|
||||||||||||||||||||
| |
| Phenotypic Information (metabolism pathway, cancer, disease, phenome) |
| |
| |
| Gene-Gene Network Information: Co-Expression Network, Interacting Genes & KEGG |
| |
|


| Gene Summary for PSME1 |
| Basic gene info. | Gene symbol | PSME1 |
| Gene name | proteasome (prosome, macropain) activator subunit 1 (PA28 alpha) | |
| Synonyms | IFI5111|PA28A|PA28alpha|REGalpha | |
| Cytomap | UCSC genome browser: 14q11.2 | |
| Genomic location | chr14 :24605377-24608176 | |
| Type of gene | protein-coding | |
| RefGenes | NM_001281528.1, NM_001281529.1,NM_006263.3,NM_176783.2, | |
| Ensembl id | ENSG00000092010 | |
| Description | 11S regulator complex subunit alpha29-kD MCP activator subunitIGUP I-5111activator of multicatalytic protease subunit 1interferon gamma up-regulated I-5111 proteininterferon-gamma IEF SSP 5111interferon-gamma-inducible protein 5111proteasome activa | |
| Modification date | 20141207 | |
| dbXrefs | MIM : 600654 | |
| HGNC : HGNC | ||
| Ensembl : ENSG00000092010 | ||
| HPRD : 02803 | ||
| Vega : OTTHUMG00000028795 | ||
| Protein | UniProt: go to UniProt's Cross Reference DB Table | |
| Expression | CleanEX: HS_PSME1 | |
| BioGPS: 5720 | ||
| Gene Expression Atlas: ENSG00000092010 | ||
| The Human Protein Atlas: ENSG00000092010 | ||
| Pathway | NCI Pathway Interaction Database: PSME1 | |
| KEGG: PSME1 | ||
| REACTOME: PSME1 | ||
| ConsensusPathDB | ||
| Pathway Commons: PSME1 | ||
| Metabolism | MetaCyc: PSME1 | |
| HUMANCyc: PSME1 | ||
| Regulation | Ensembl's Regulation: ENSG00000092010 | |
| miRBase: chr14 :24,605,377-24,608,176 | ||
| TargetScan: NM_001281528 | ||
| cisRED: ENSG00000092010 | ||
| Context | iHOP: PSME1 | |
| cancer metabolism search in PubMed: PSME1 | ||
| UCL Cancer Institute: PSME1 | ||
| Assigned class in ccmGDB | C | |
| Top |
| Phenotypic Information for PSME1(metabolism pathway, cancer, disease, phenome) |
| Cancer | CGAP: PSME1 |
| Familial Cancer Database: PSME1 | |
| * This gene is included in those cancer gene databases. |
|
|
|
|
|
| . | ||||||||||||||
Oncogene 1 | Significant driver gene in | |||||||||||||||||||
| cf) number; DB name 1 Oncogene; http://nar.oxfordjournals.org/content/35/suppl_1/D721.long, 2 Tumor Suppressor gene; https://bioinfo.uth.edu/TSGene/, 3 Cancer Gene Census; http://www.nature.com/nrc/journal/v4/n3/abs/nrc1299.html, 4 CancerGenes; http://nar.oxfordjournals.org/content/35/suppl_1/D721.long, 5 Network of Cancer Gene; http://ncg.kcl.ac.uk/index.php, 1Therapeutic Vulnerabilities in Cancer; http://cbio.mskcc.org/cancergenomics/statius/ |
| REACTOME_METABOLISM_OF_AMINO_ACIDS_AND_DERIVATIVES REACTOME_METABOLISM_OF_MRNA REACTOME_METABOLISM_OF_RNA | |
| OMIM | |
| Orphanet | |
| Disease | KEGG Disease: PSME1 |
| MedGen: PSME1 (Human Medical Genetics with Condition) | |
| ClinVar: PSME1 | |
| Phenotype | MGI: PSME1 (International Mouse Phenotyping Consortium) |
| PhenomicDB: PSME1 | |
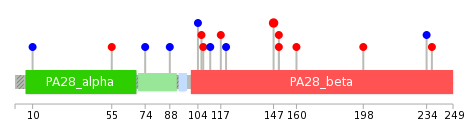
| Mutations for PSME1 |
| * Under tables are showing count per each tissue to give us broad intuition about tissue specific mutation patterns.You can go to the detailed page for each mutation database's web site. |
| There's no structural variation information in COSMIC data for this gene. |
| * From mRNA Sanger sequences, Chitars2.0 arranged chimeric transcripts. This table shows PSME1 related fusion information. |
| ID | Head Gene | Tail Gene | Accession | Gene_a | qStart_a | qEnd_a | Chromosome_a | tStart_a | tEnd_a | Gene_a | qStart_a | qEnd_a | Chromosome_a | tStart_a | tEnd_a |
| BI048257 | KCNE3 | 74 | 94 | 11 | 74176021 | 74176041 | PSME1 | 81 | 339 | 14 | 24606001 | 24606259 | |
| BG979539 | MYH9 | 30 | 174 | 22 | 36681947 | 36682855 | PSME1 | 173 | 293 | 14 | 24606350 | 24606585 | |
| BM990679 | PSME1 | 19 | 455 | 14 | 24607403 | 24608168 | IQCE | 447 | 506 | 7 | 2647130 | 2647189 | |
| Top |
| There's no copy number variation information in COSMIC data for this gene. |
| Top |
|
 |
| Top |
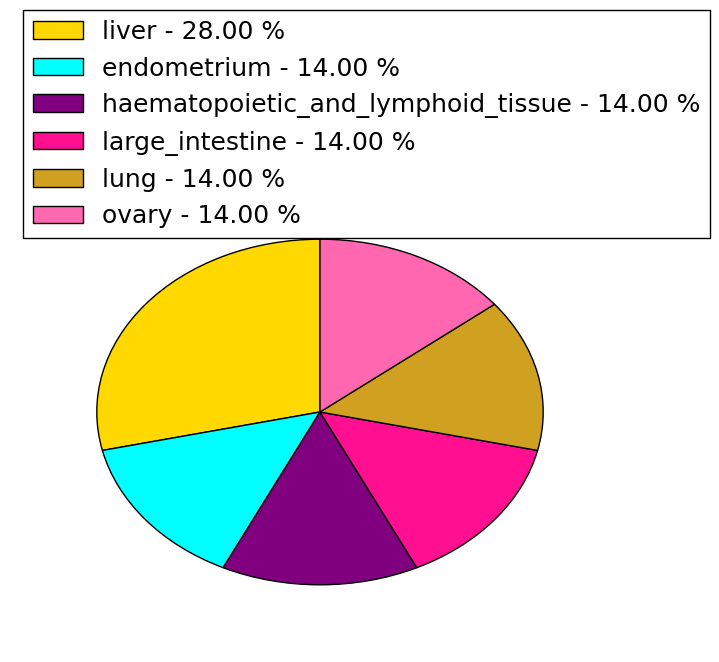
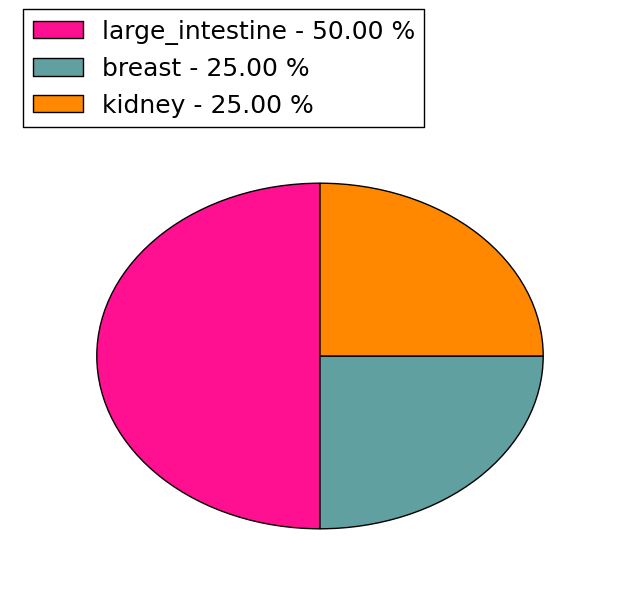
| Stat. for Non-Synonymous SNVs (# total SNVs=7) | (# total SNVs=4) |
 |  |
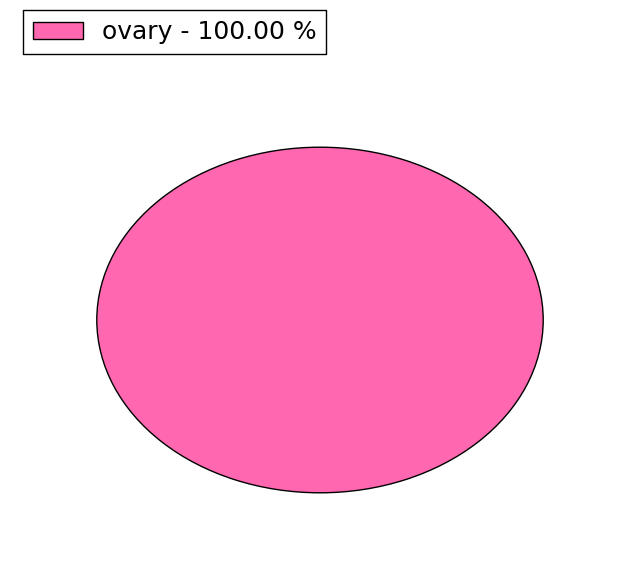
(# total SNVs=1) | (# total SNVs=0) |
 |
| Top |
| * When you move the cursor on each content, you can see more deailed mutation information on the Tooltip. Those are primary_site,primary_histology,mutation(aa),pubmedID. |
| GRCh37 position | Mutation(aa) | Unique sampleID count |
| chr14:24607306-24607306 | p.N147D | 2 |
| chr14:24606746-24606746 | p.E88E | 1 |
| chr14:24607332-24607332 | p.? | 1 |
| chr14:24606928-24606928 | p.V104V | 1 |
| chr14:24607399-24607399 | p.? | 1 |
| chr14:24606933-24606933 | p.C106Y | 1 |
| chr14:24607425-24607425 | p.M160I | 1 |
| chr14:24606936-24606936 | p.N107S | 1 |
| chr14:24607471-24607474 | p.? | 1 |
| chr14:24606949-24606949 | p.V111V | 1 |
| Top |
|
 |
| Point Mutation/ Tissue ID | 1 | 2 | 3 | 4 | 5 | 6 | 7 | 8 | 9 | 10 | 11 | 12 | 13 | 14 | 15 | 16 | 17 | 18 | 19 | 20 |
| # sample | 2 | 1 | 2 | 2 | 1 | 1 | 1 | 1 | 1 | |||||||||||
| # mutation | 2 | 1 | 2 | 2 | 1 | 1 | 1 | 1 | 1 | |||||||||||
| nonsynonymous SNV | 1 | 1 | 1 | 1 | 1 | 1 | 1 | |||||||||||||
| synonymous SNV | 1 | 1 | 1 | 1 | 1 |
| cf) Tissue ID; Tissue type (1; BLCA[Bladder Urothelial Carcinoma], 2; BRCA[Breast invasive carcinoma], 3; CESC[Cervical squamous cell carcinoma and endocervical adenocarcinoma], 4; COAD[Colon adenocarcinoma], 5; GBM[Glioblastoma multiforme], 6; Glioma Low Grade, 7; HNSC[Head and Neck squamous cell carcinoma], 8; KICH[Kidney Chromophobe], 9; KIRC[Kidney renal clear cell carcinoma], 10; KIRP[Kidney renal papillary cell carcinoma], 11; LAML[Acute Myeloid Leukemia], 12; LUAD[Lung adenocarcinoma], 13; LUSC[Lung squamous cell carcinoma], 14; OV[Ovarian serous cystadenocarcinoma ], 15; PAAD[Pancreatic adenocarcinoma], 16; PRAD[Prostate adenocarcinoma], 17; SKCM[Skin Cutaneous Melanoma], 18:STAD[Stomach adenocarcinoma], 19:THCA[Thyroid carcinoma], 20:UCEC[Uterine Corpus Endometrial Carcinoma]) |
| Top |
| * We represented just top 10 SNVs. When you move the cursor on each content, you can see more deailed mutation information on the Tooltip. Those are primary_site, primary_histology, mutation(aa), pubmedID. |
| Genomic Position | Mutation(aa) | Unique sampleID count |
| chr14:24606976 | p.A10A,PSME1 | 1 |
| chr14:24607315 | p.K74K,PSME1 | 1 |
| chr14:24607316 | p.E88E,PSME1 | 1 |
| chr14:24607425 | p.K90N,PSME1 | 1 |
| chr14:24607452 | p.N107S,PSME1 | 1 |
| chr14:24605501 | p.L117V,PSME1 | 1 |
| chr14:24607692 | p.E120E,PSME1 | 1 |
| chr14:24606616 | p.V150L,PSME1 | 1 |
| chr14:24606746 | p.V150A,PSME1 | 1 |
| chr14:24606752 | p.M160I,PSME1 | 1 |
| * Copy number data were extracted from TCGA using R package TCGA-Assembler. The URLs of all public data files on TCGA DCC data server were gathered on Jan-05-2015. Function ProcessCNAData in TCGA-Assembler package was used to obtain gene-level copy number value which is calculated as the average copy number of the genomic region of a gene. |
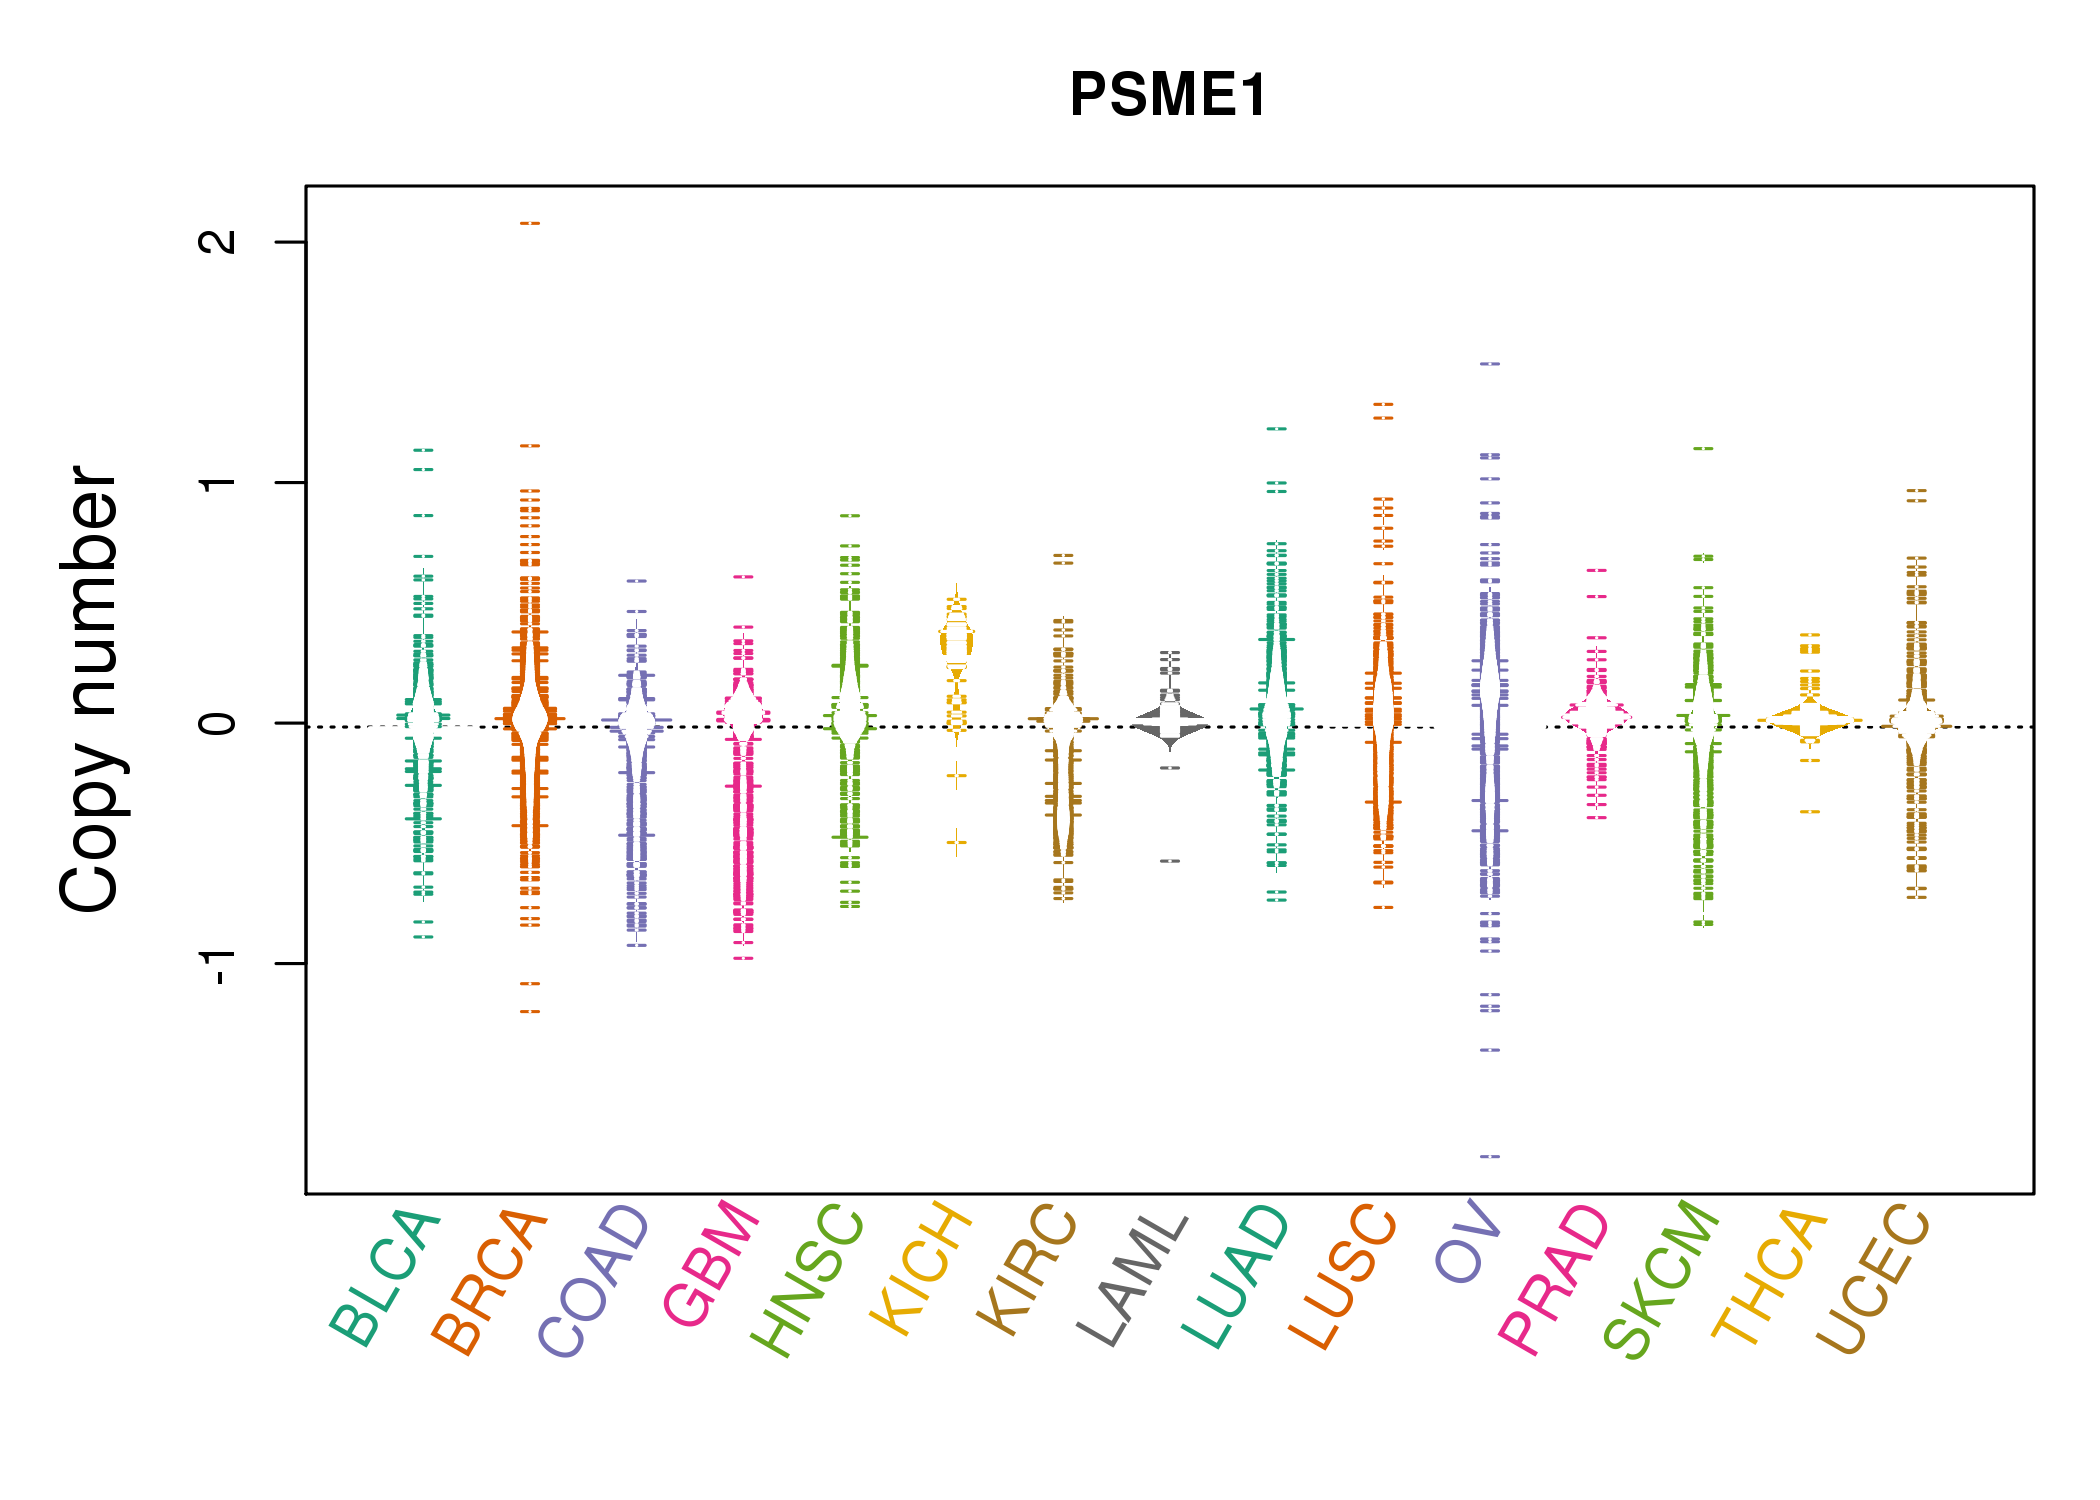 |
| cf) Tissue ID[Tissue type]: BLCA[Bladder Urothelial Carcinoma], BRCA[Breast invasive carcinoma], CESC[Cervical squamous cell carcinoma and endocervical adenocarcinoma], COAD[Colon adenocarcinoma], GBM[Glioblastoma multiforme], Glioma Low Grade, HNSC[Head and Neck squamous cell carcinoma], KICH[Kidney Chromophobe], KIRC[Kidney renal clear cell carcinoma], KIRP[Kidney renal papillary cell carcinoma], LAML[Acute Myeloid Leukemia], LUAD[Lung adenocarcinoma], LUSC[Lung squamous cell carcinoma], OV[Ovarian serous cystadenocarcinoma ], PAAD[Pancreatic adenocarcinoma], PRAD[Prostate adenocarcinoma], SKCM[Skin Cutaneous Melanoma], STAD[Stomach adenocarcinoma], THCA[Thyroid carcinoma], UCEC[Uterine Corpus Endometrial Carcinoma] |
| Top |
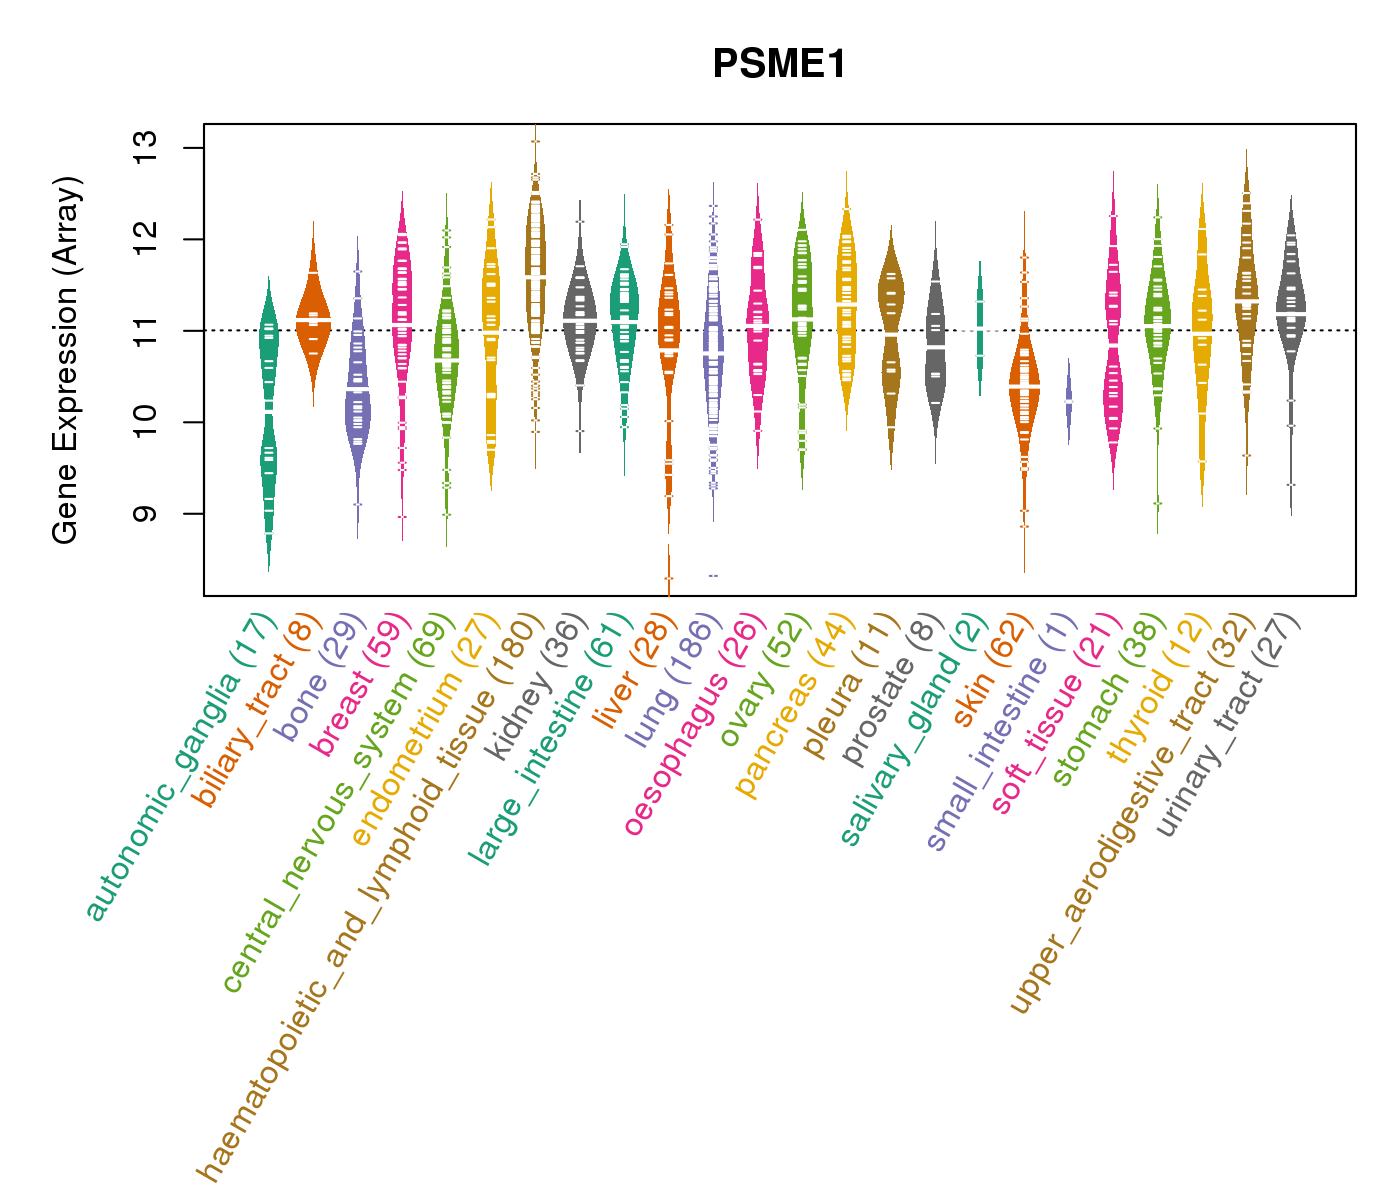
| Gene Expression for PSME1 |
| * CCLE gene expression data were extracted from CCLE_Expression_Entrez_2012-10-18.res: Gene-centric RMA-normalized mRNA expression data. |
 |
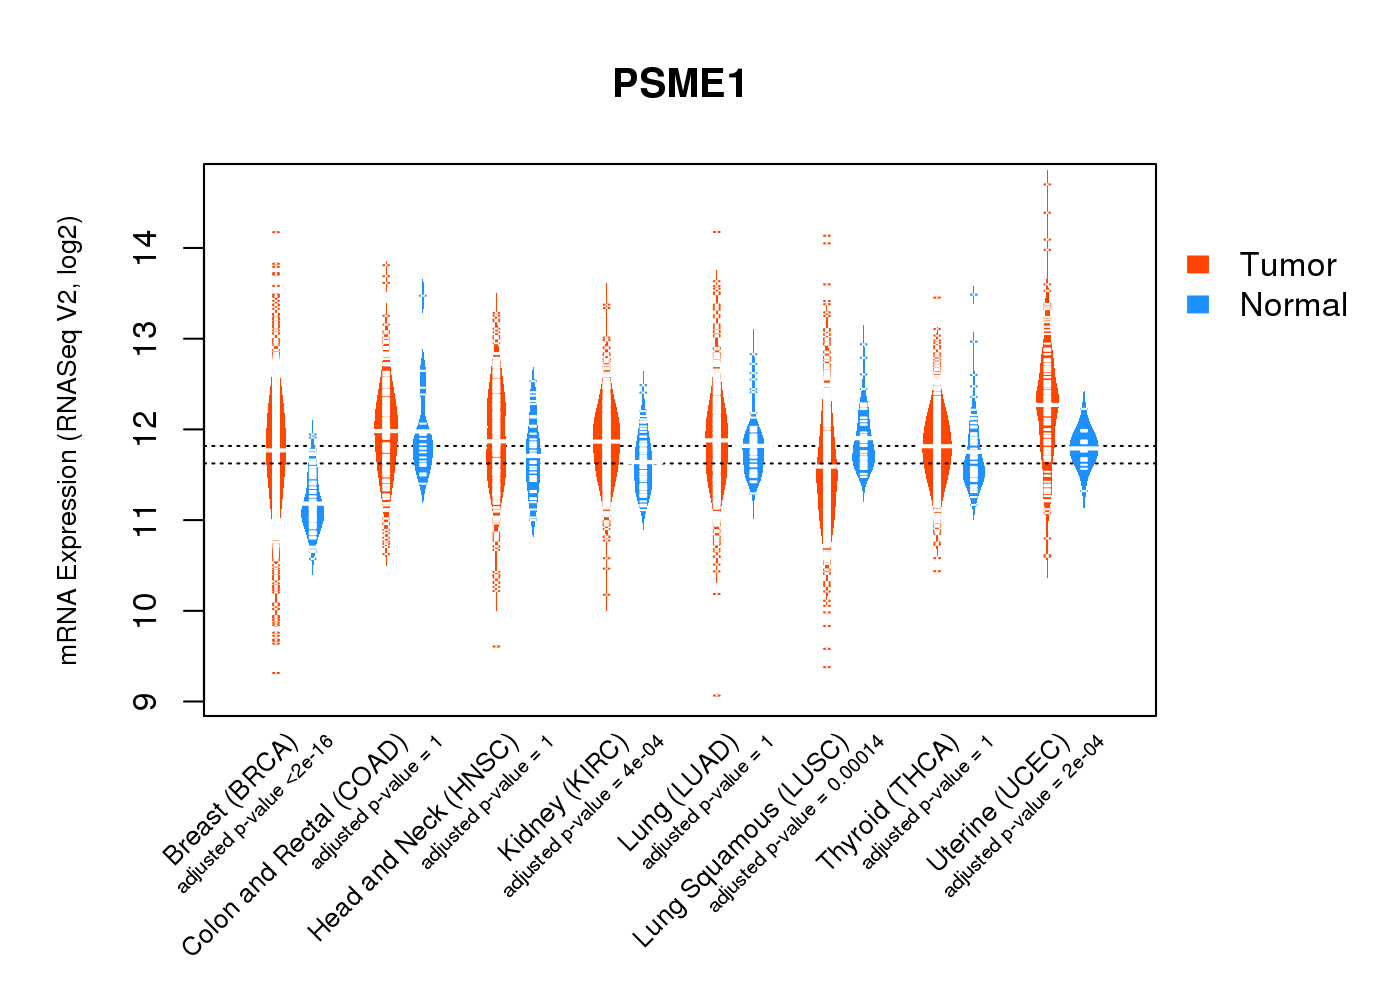
| * Normalized gene expression data of RNASeqV2 was extracted from TCGA using R package TCGA-Assembler. The URLs of all public data files on TCGA DCC data server were gathered at Jan-05-2015. Only eight cancer types have enough normal control samples for differential expression analysis. (t test, adjusted p<0.05 (using Benjamini-Hochberg FDR)) |
 |
| Top |
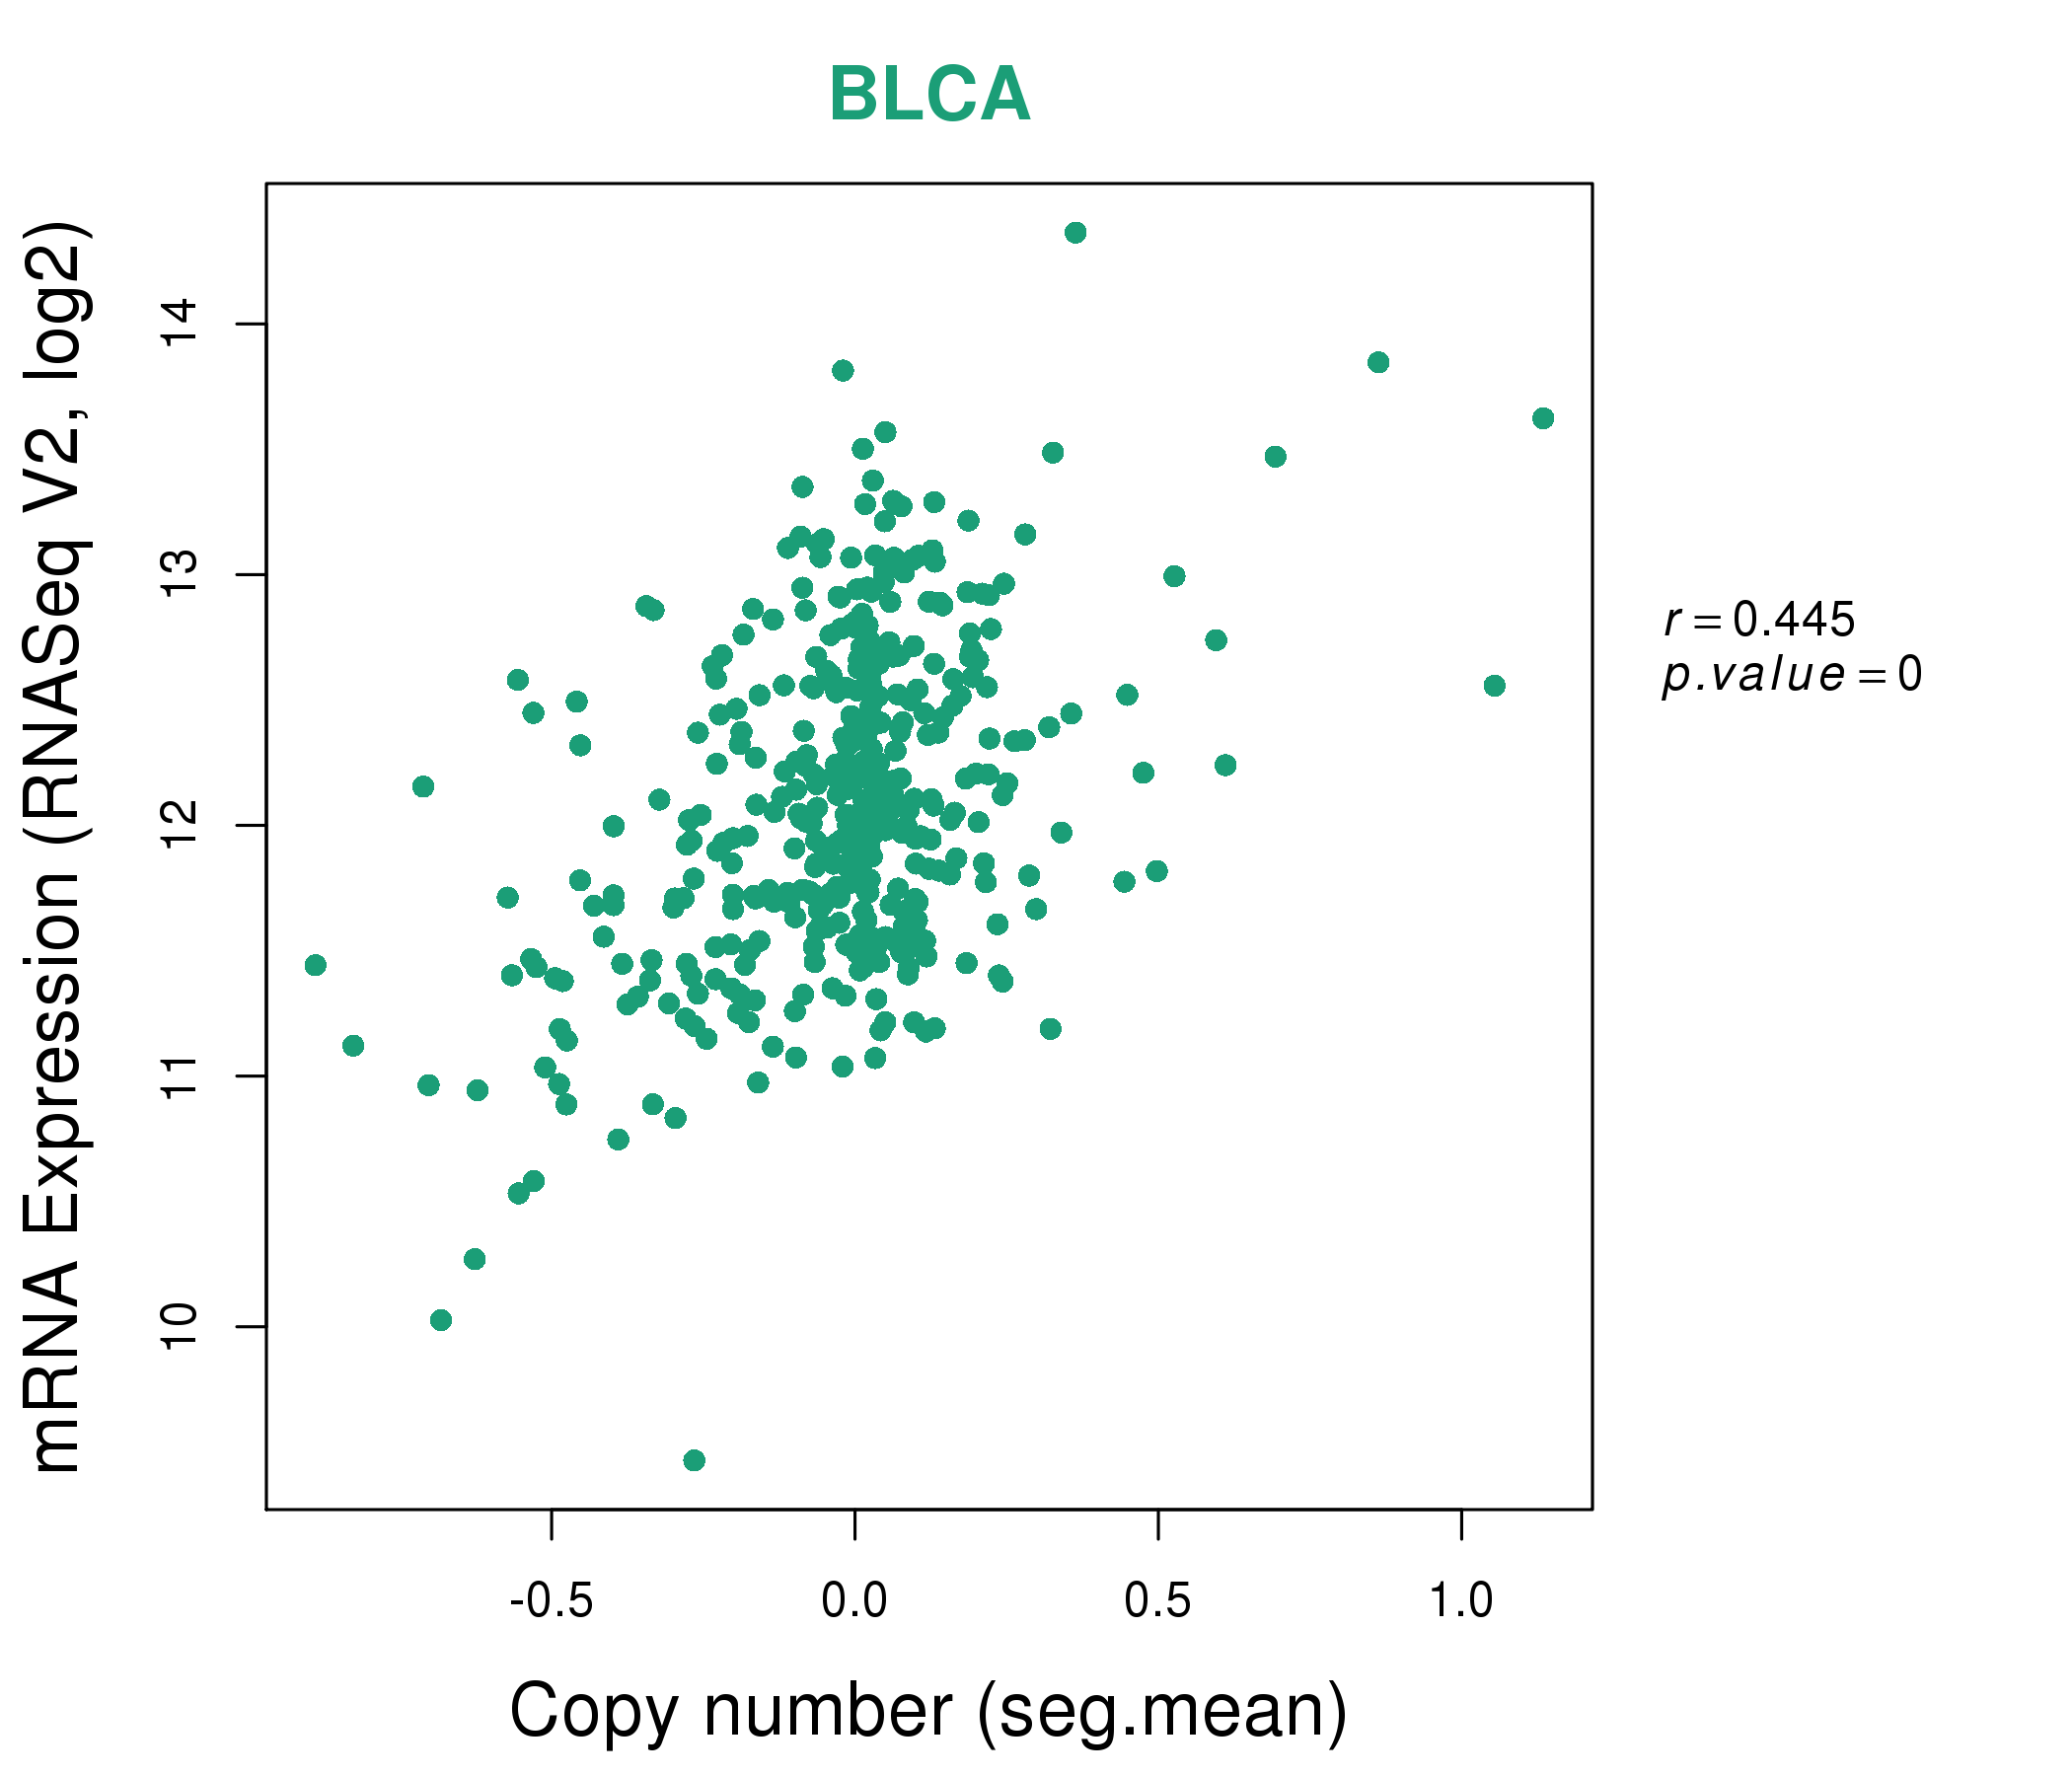
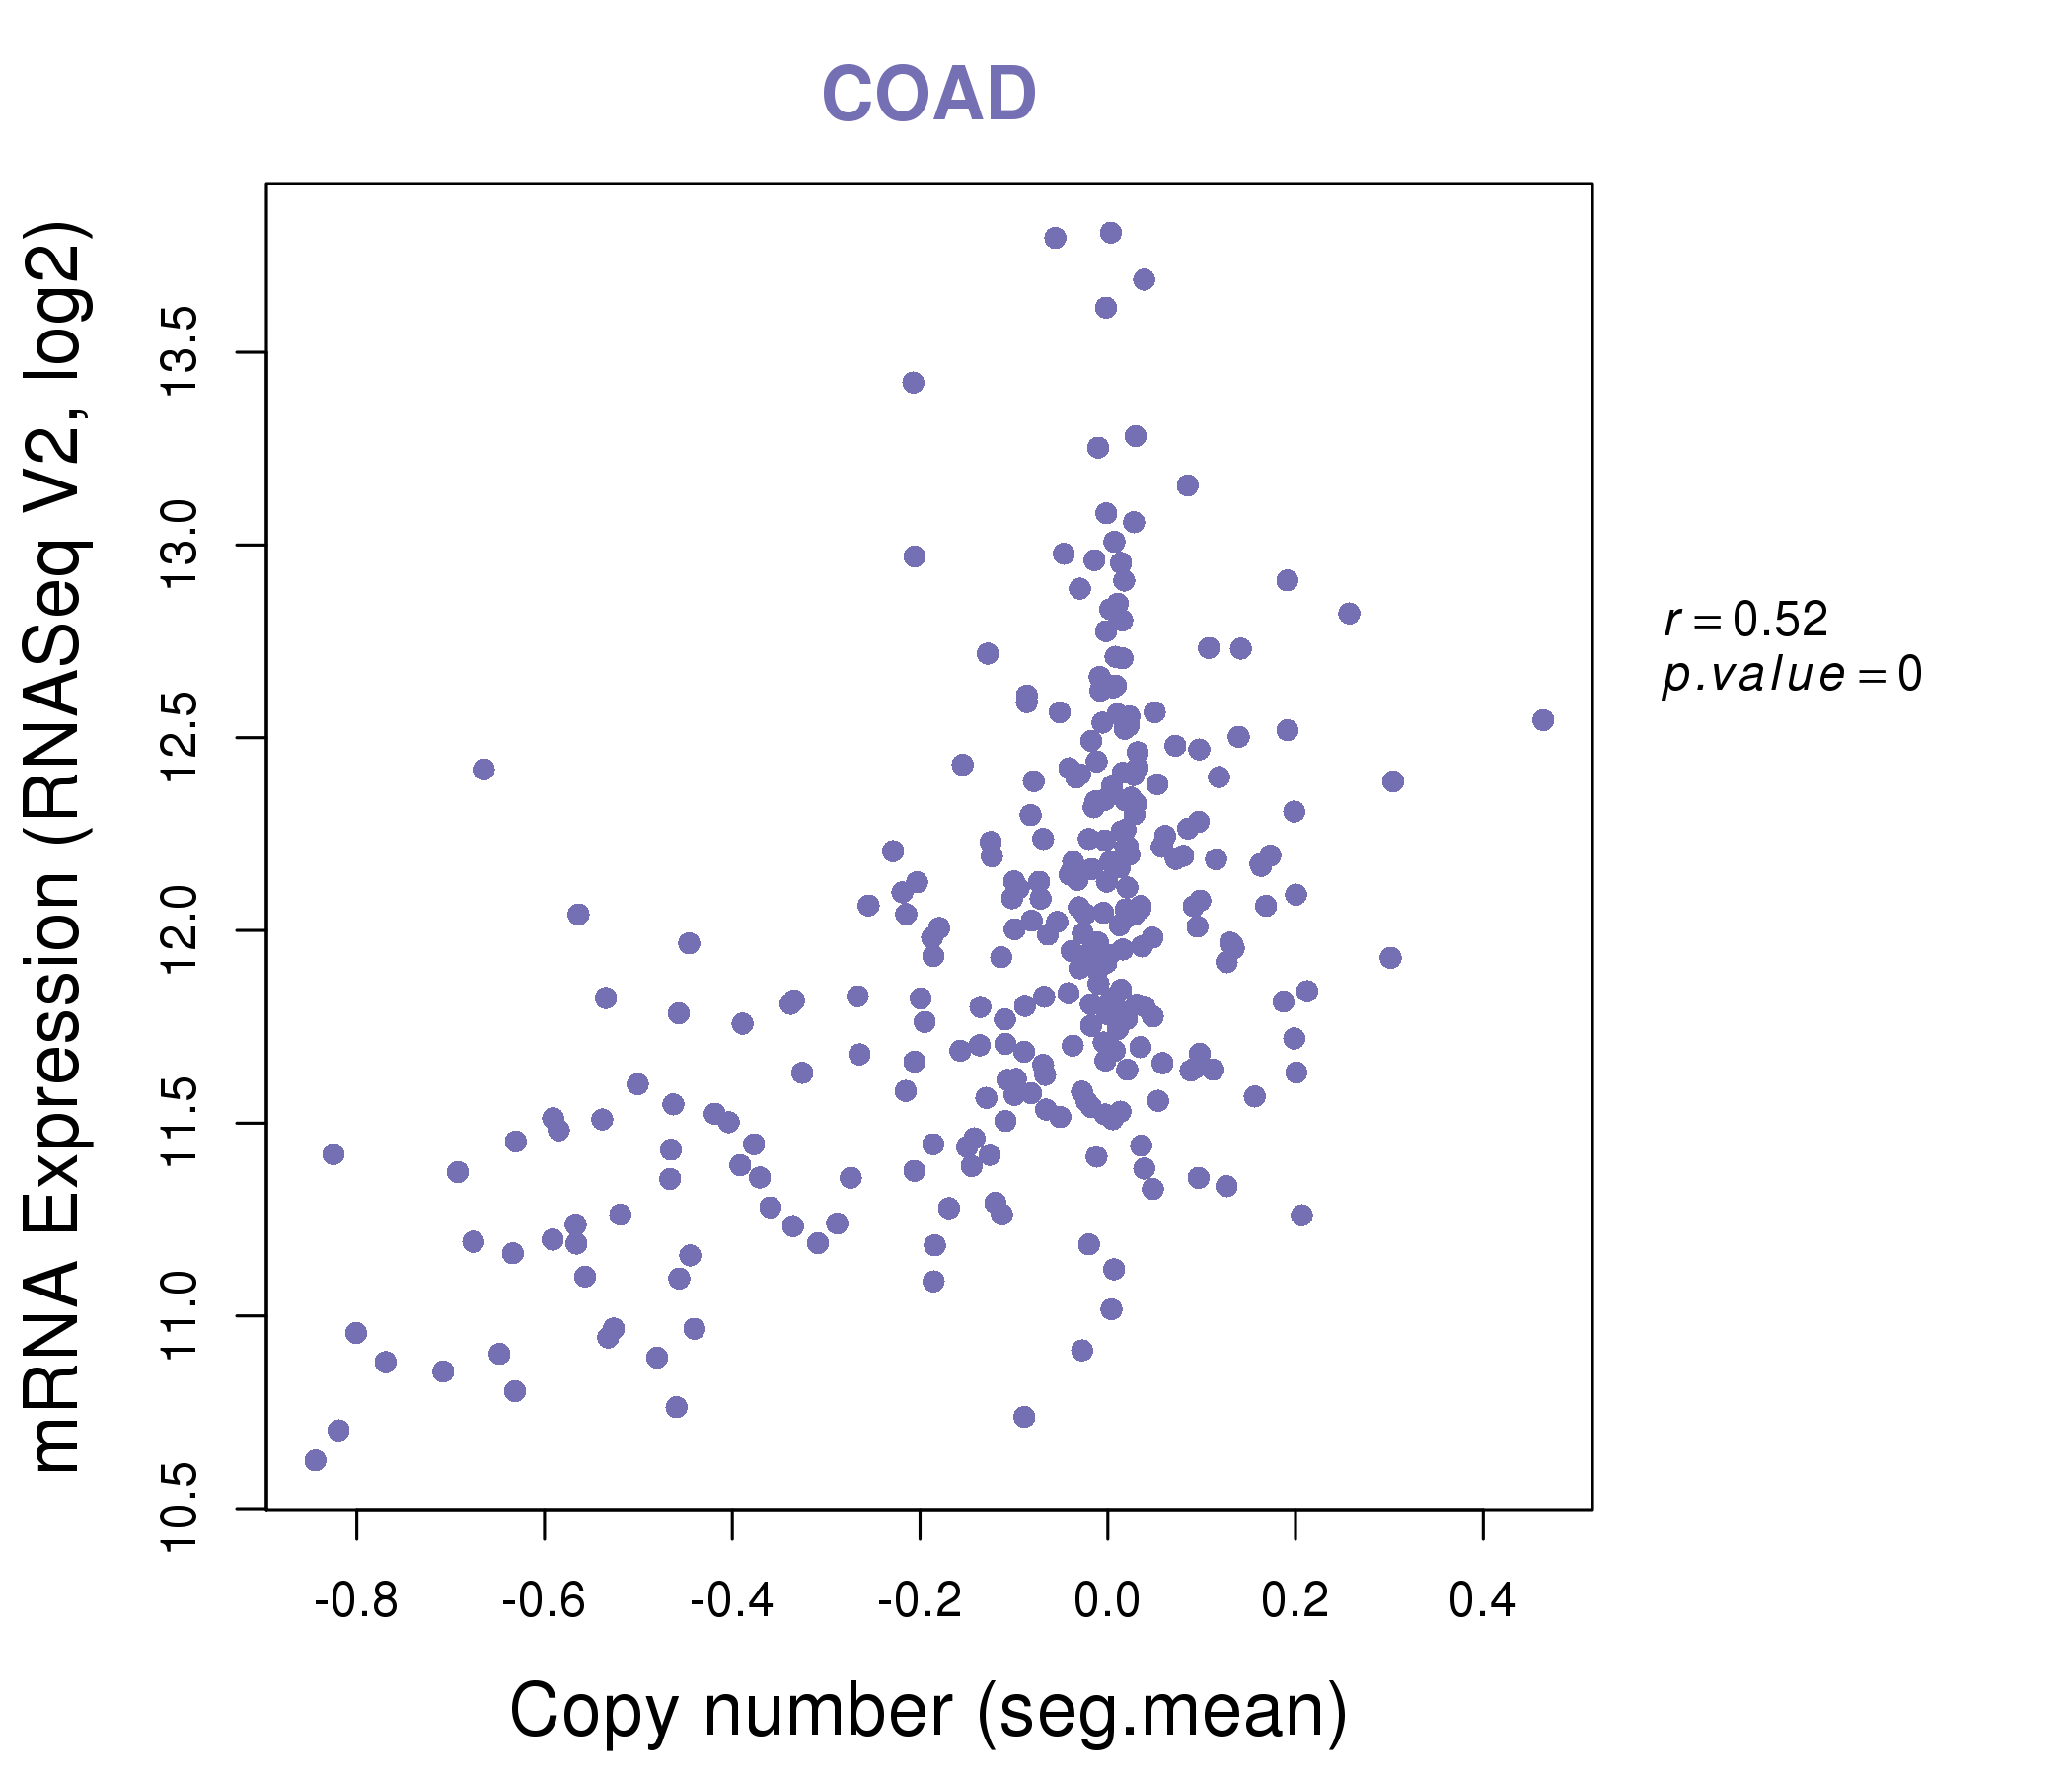
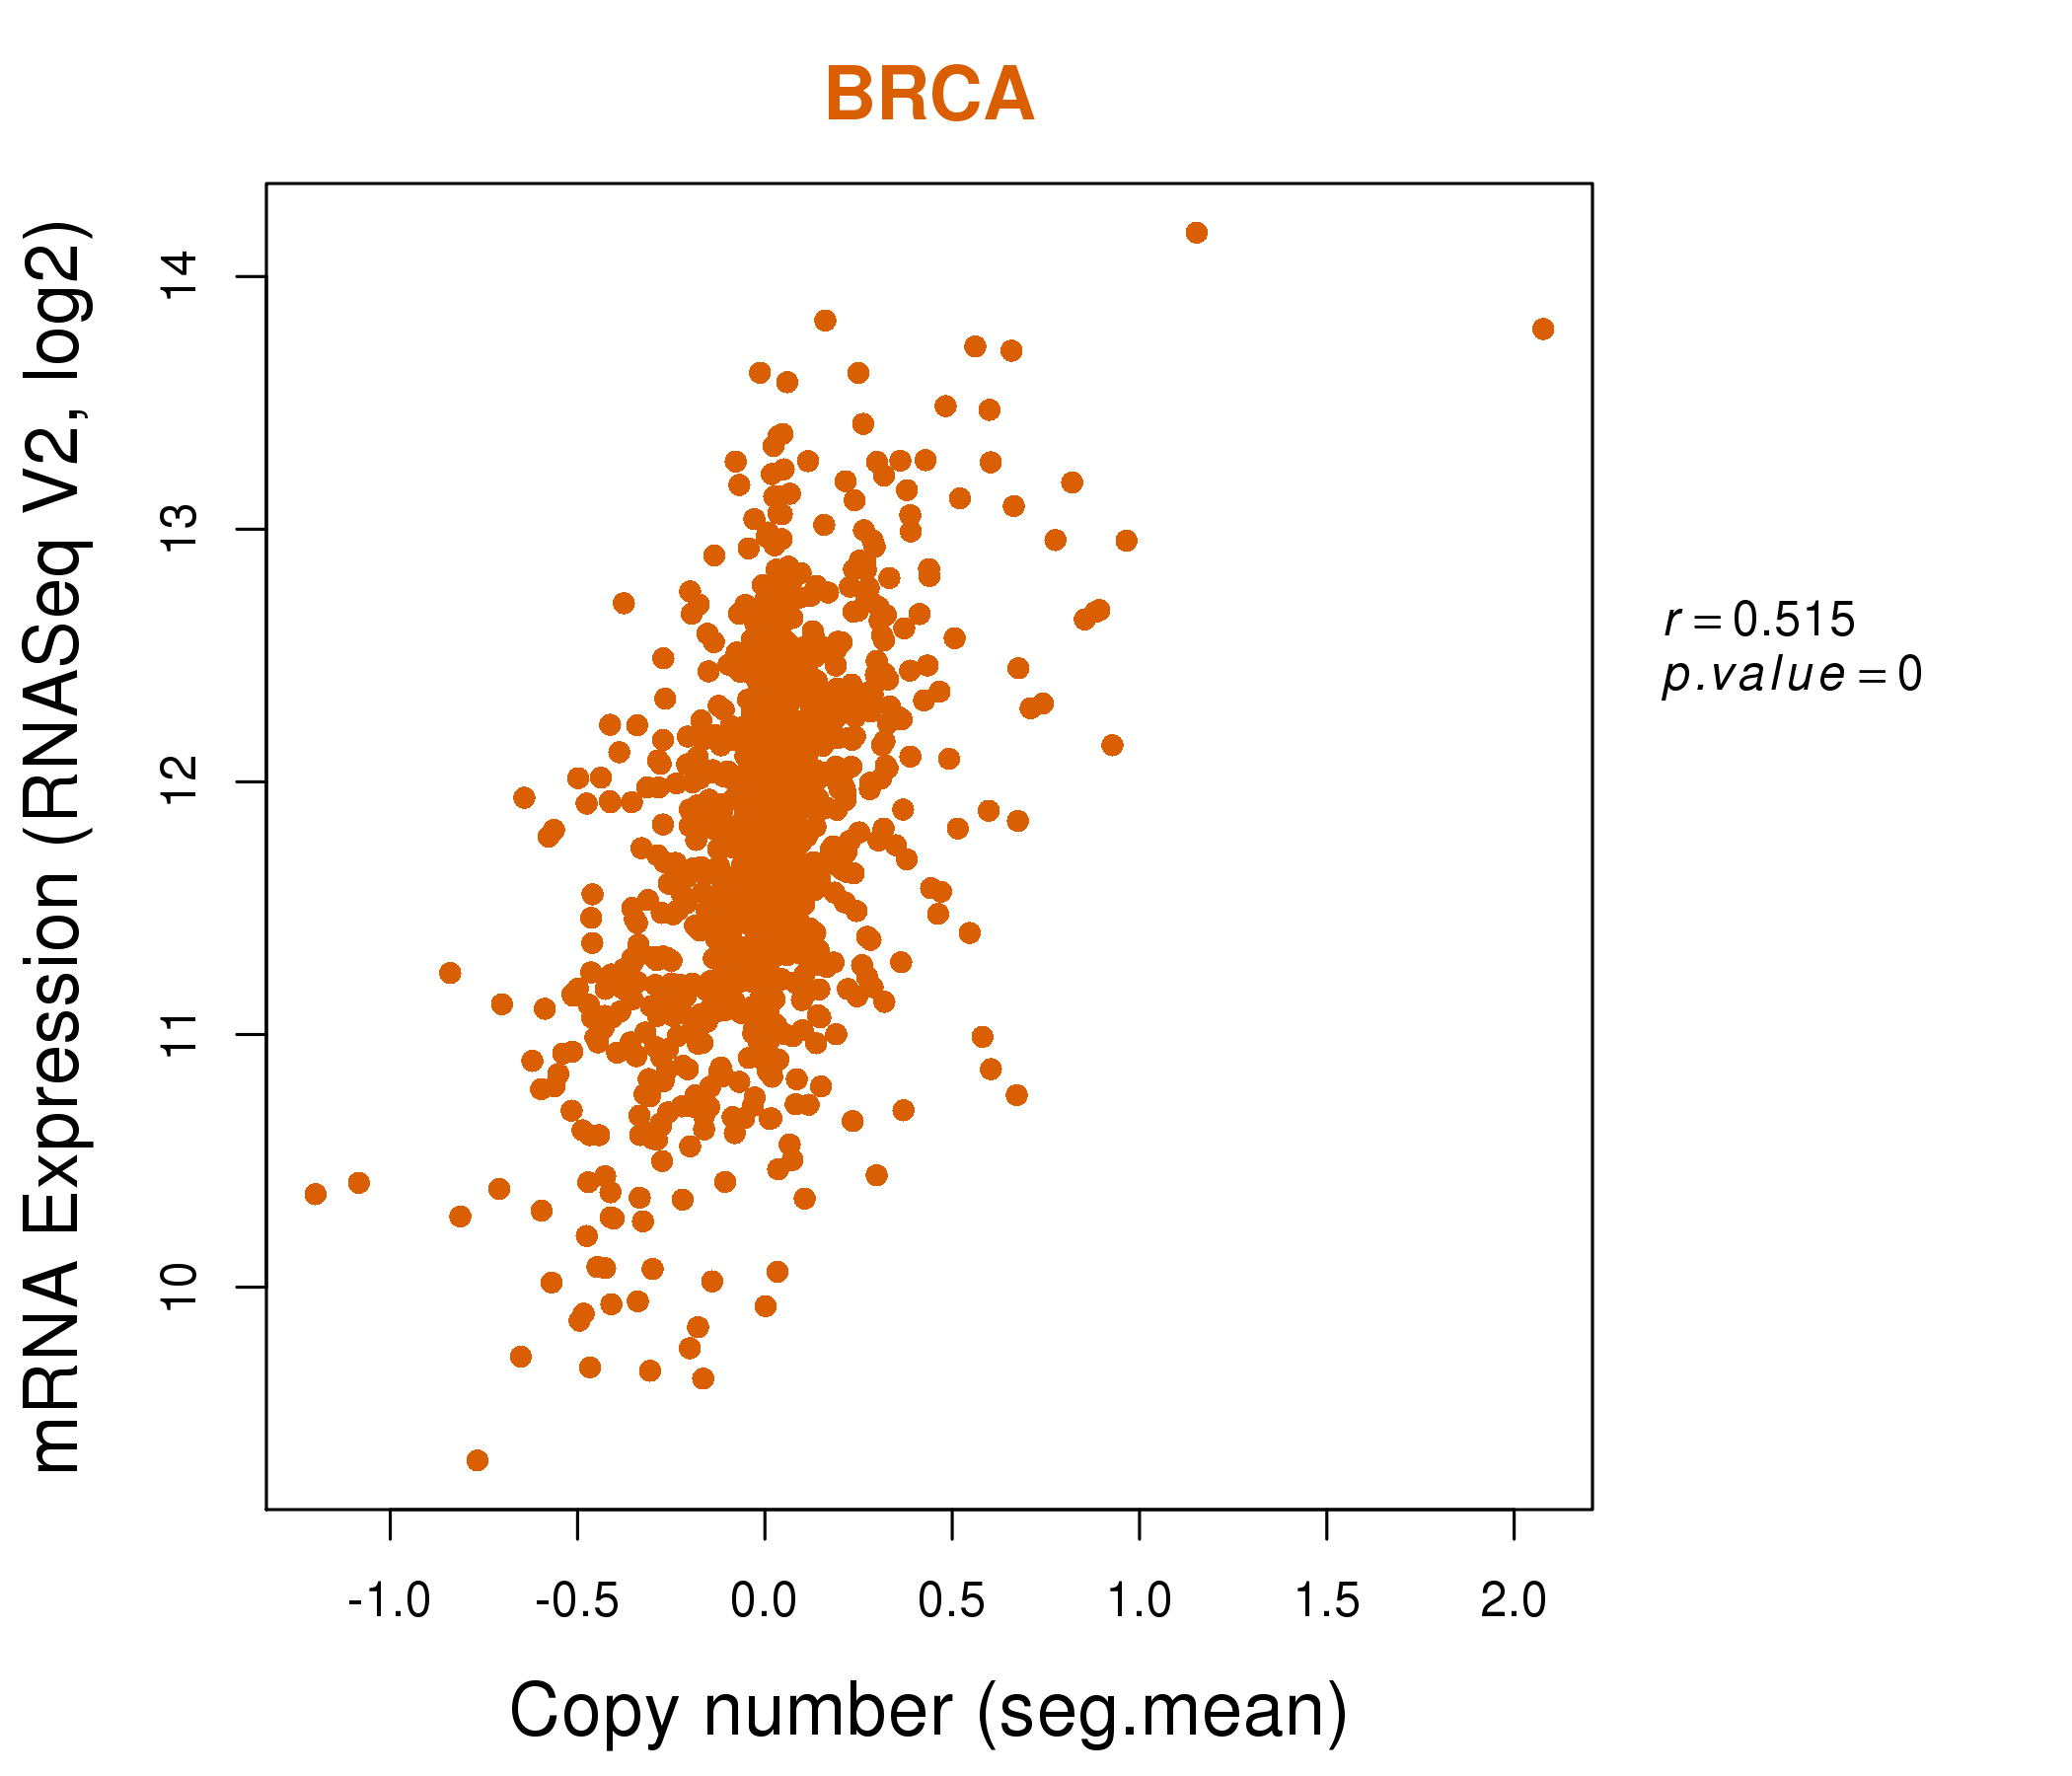
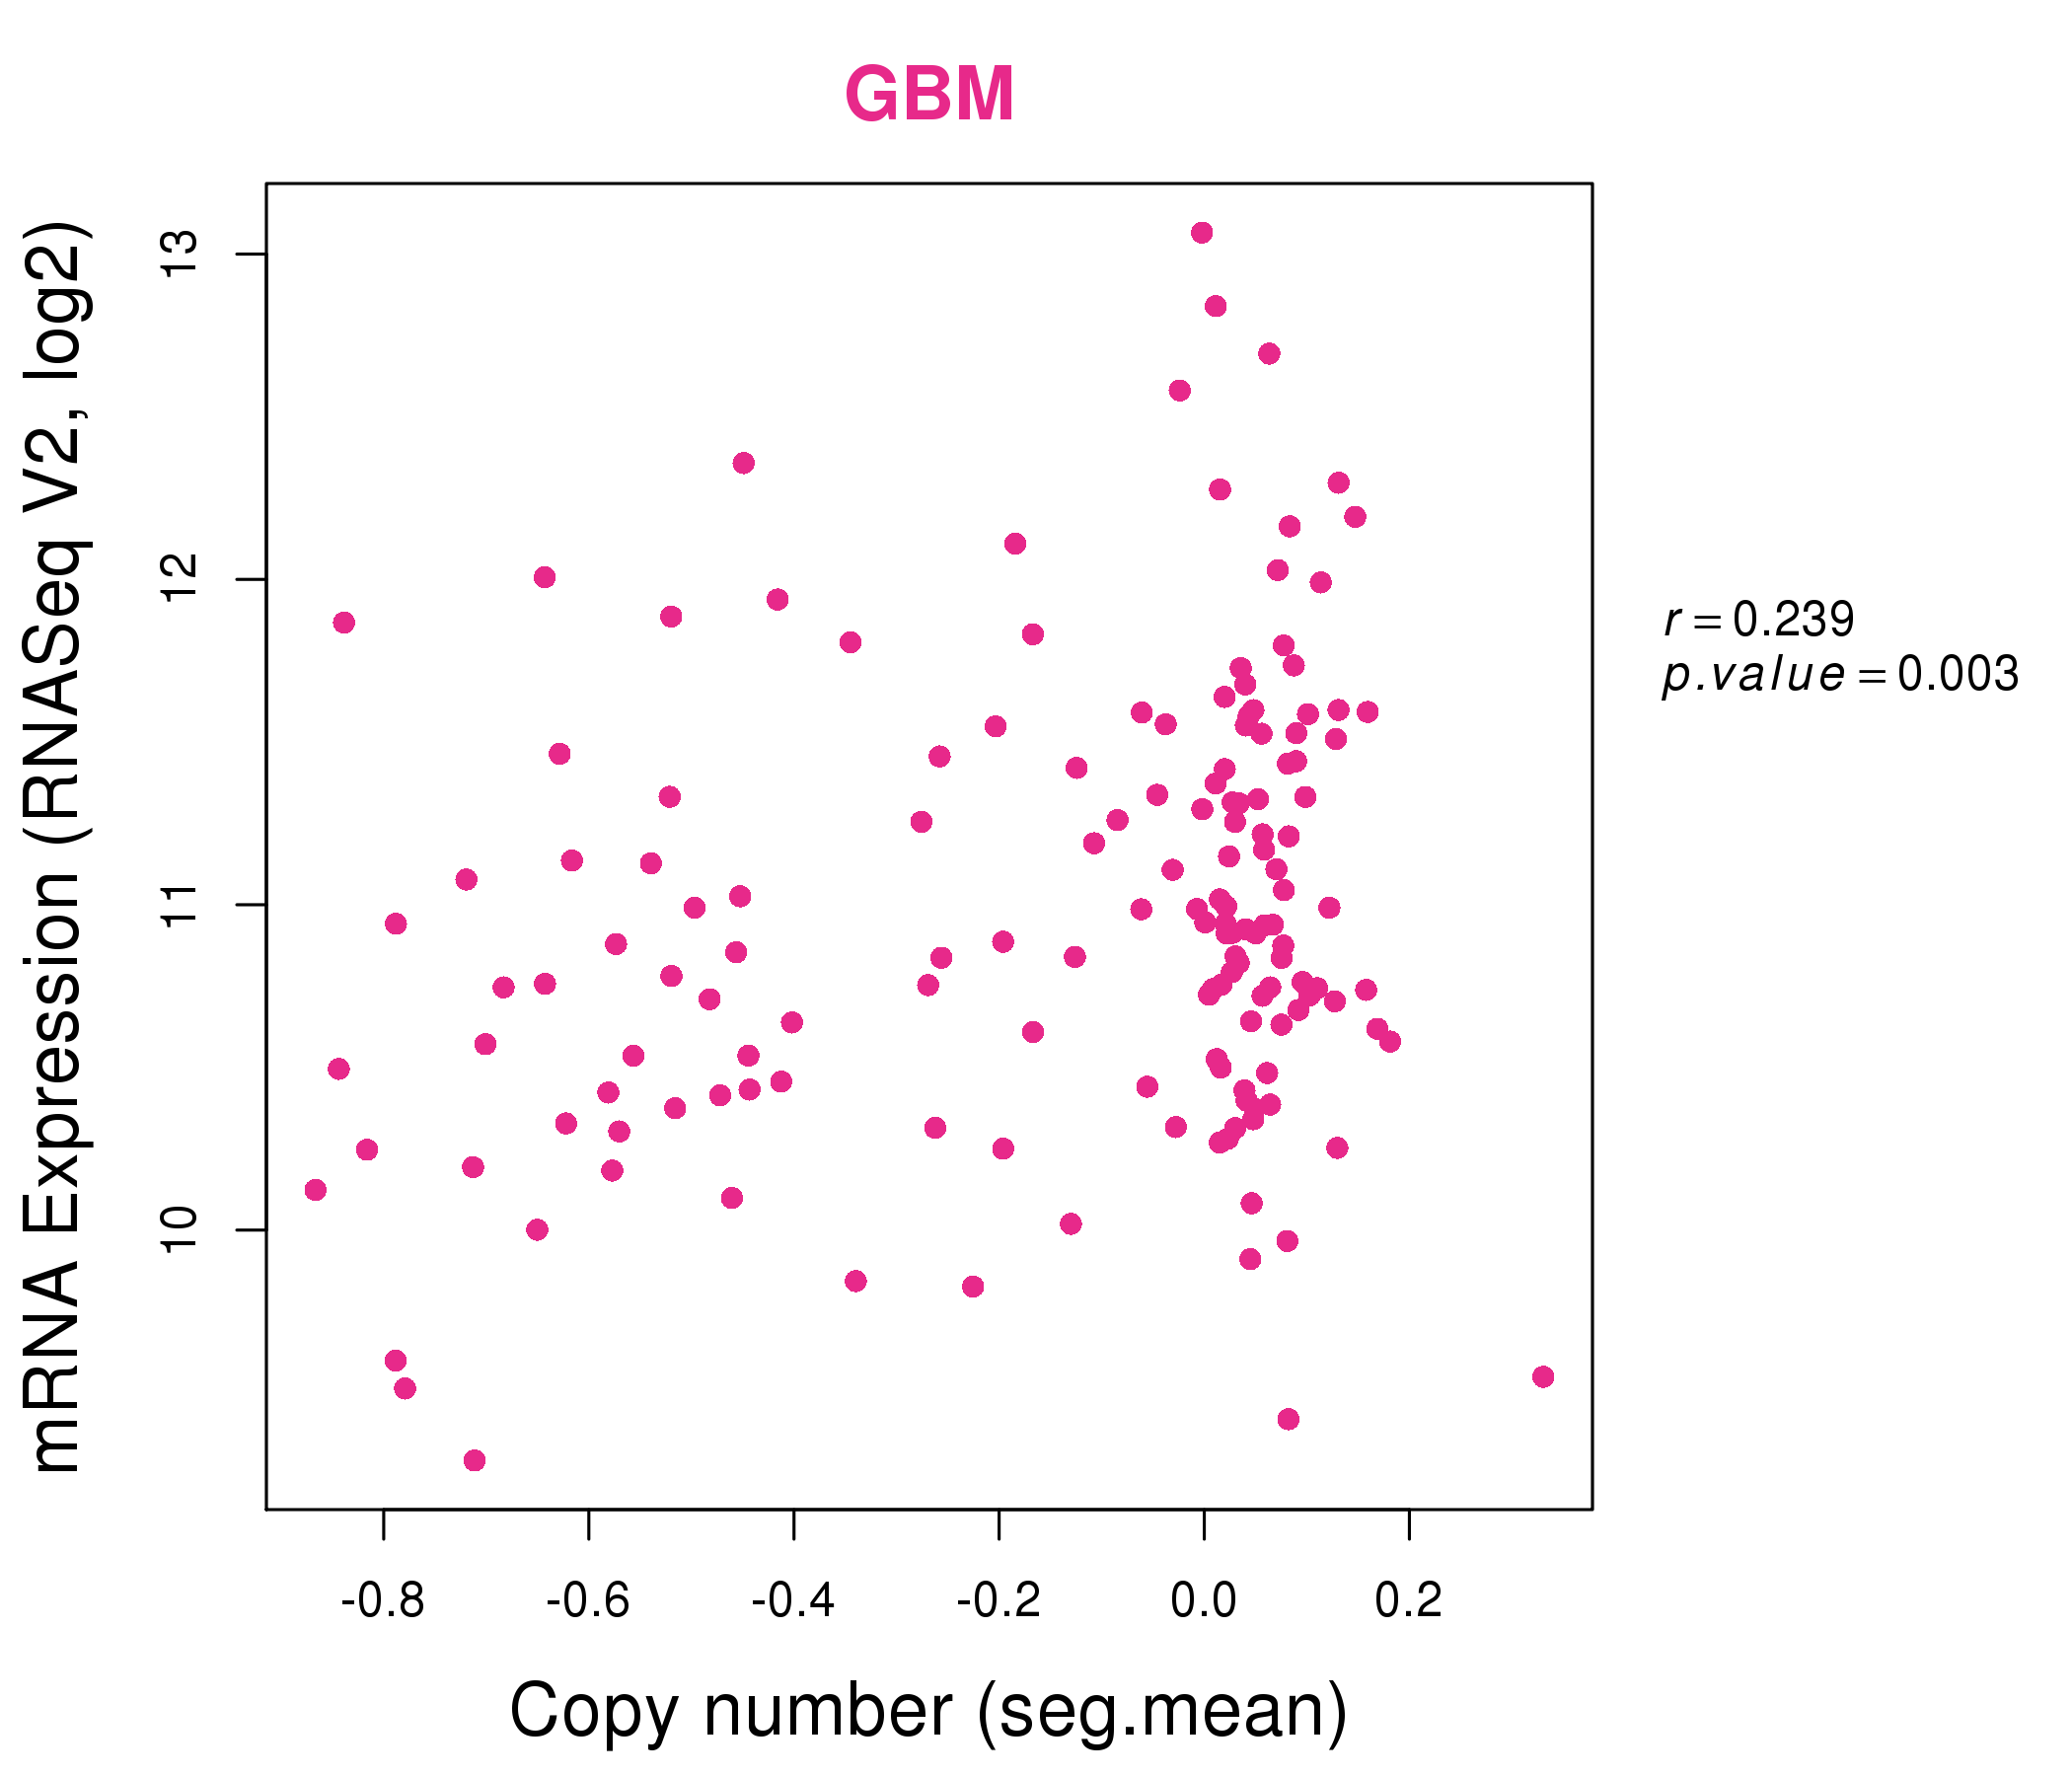
| * This plots show the correlation between CNV and gene expression. |
: Open all plots for all cancer types
 |
|
 |
|
| Top |
| Gene-Gene Network Information |
| * Co-Expression network figures were drawn using R package igraph. Only the top 20 genes with the highest correlations were shown. Red circle: input gene, orange circle: cell metabolism gene, sky circle: other gene |
: Open all plots for all cancer types
 |
|
| BST2,IFT43,CHMP4A,EMC9,GMPR2,IFI35,IRF9, MDP1,NEDD8,NRL,PSMB10,PSMB8,PSME1,PSME2, RABGGTA,RARRES3,RNF181,RNF31,RPL36AL,TM9SF1,UBE2L6 | ARPC4,C17orf49,EIF6,GSTP1,IMP3,LSM2,LY6E, MANF,PRELID1,PSMB10,PSMB8,PSME1,PSME2,PSMG3, PYCARD,RAB34,RANBP1,RARRES3,SDF2,SNRPF,WDR54 |
 |
|
| EIF5A,ETV7,FBXO6,IFI27,IRF1,NAA38,MRPL52, NMI,PSMA3,PSMA6,PSMB10,PSMB8,PSMB9,PSMD9, PSME1,PSME2,RARRES3,RPL36AL,SCO2,TAP1,UBE2L6 | C5orf15,CARD16,CASP1,EPSTI1,ETV7,FAM26F,GBP4, IFI30,IFI35,IRF1,NMI,PSMB10,PSMB8,PSMB9, PSME1,PSME2,RARRES3,STAT1,TAP1,TRIM21,UBE2L6 |

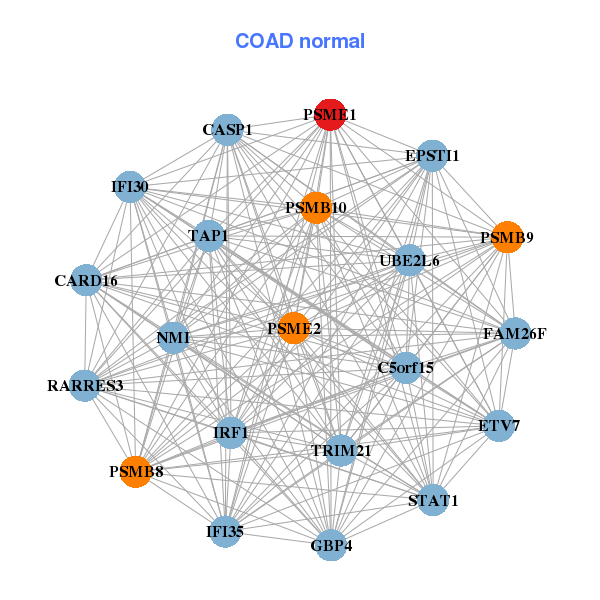
| * Co-Expression network figures were drawn using R package igraph. Only the top 20 genes with the highest correlations were shown. Red circle: input gene, orange circle: cell metabolism gene, sky circle: other gene |
: Open all plots for all cancer types
| Top |
: Open all interacting genes' information including KEGG pathway for all interacting genes from DAVID
| Top |
| Pharmacological Information for PSME1 |
| There's no related Drug. |
| Top |
| Cross referenced IDs for PSME1 |
| * We obtained these cross-references from Uniprot database. It covers 150 different DBs, 18 categories. http://www.uniprot.org/help/cross_references_section |
: Open all cross reference information
|
Copyright © 2016-Present - The Univsersity of Texas Health Science Center at Houston @ |