|
||||||||||||||||||||
| |
| Phenotypic Information (metabolism pathway, cancer, disease, phenome) |
| |
| |
| Gene-Gene Network Information: Co-Expression Network, Interacting Genes & KEGG |
| |
|


| Gene Summary for PTGDS |
| Basic gene info. | Gene symbol | PTGDS |
| Gene name | prostaglandin D2 synthase 21kDa (brain) | |
| Synonyms | L-PGDS|LPGDS|PDS|PGD2|PGDS|PGDS2 | |
| Cytomap | UCSC genome browser: 9q34.2-q34.3 | |
| Genomic location | chr9 :139871955-139876194 | |
| Type of gene | protein-coding | |
| RefGenes | NM_000954.5, | |
| Ensembl id | ENSG00000107317 | |
| Description | PGD2 synthasebeta-trace proteincerebrin-28glutathione-independent PGD synthaseglutathione-independent PGD synthetaselipocalin-type prostaglandin D synthaselipocalin-type prostaglandin-D synthaseprostaglandin D synthaseprostaglandin-D2 synthasepro | |
| Modification date | 20141207 | |
| dbXrefs | MIM : 176803 | |
| HGNC : HGNC | ||
| Ensembl : ENSG00000107317 | ||
| HPRD : 08904 | ||
| Vega : OTTHUMG00000020957 | ||
| Protein | UniProt: go to UniProt's Cross Reference DB Table | |
| Expression | CleanEX: HS_PTGDS | |
| BioGPS: 5730 | ||
| Gene Expression Atlas: ENSG00000107317 | ||
| The Human Protein Atlas: ENSG00000107317 | ||
| Pathway | NCI Pathway Interaction Database: PTGDS | |
| KEGG: PTGDS | ||
| REACTOME: PTGDS | ||
| ConsensusPathDB | ||
| Pathway Commons: PTGDS | ||
| Metabolism | MetaCyc: PTGDS | |
| HUMANCyc: PTGDS | ||
| Regulation | Ensembl's Regulation: ENSG00000107317 | |
| miRBase: chr9 :139,871,955-139,876,194 | ||
| TargetScan: NM_000954 | ||
| cisRED: ENSG00000107317 | ||
| Context | iHOP: PTGDS | |
| cancer metabolism search in PubMed: PTGDS | ||
| UCL Cancer Institute: PTGDS | ||
| Assigned class in ccmGDB | C | |
| Top |
| Phenotypic Information for PTGDS(metabolism pathway, cancer, disease, phenome) |
| Cancer | CGAP: PTGDS |
| Familial Cancer Database: PTGDS | |
| * This gene is included in those cancer gene databases. |
|
|
|
|
|
|
| ||||||||||||||
Oncogene 1 | Significant driver gene in | |||||||||||||||||||
| cf) number; DB name 1 Oncogene; http://nar.oxfordjournals.org/content/35/suppl_1/D721.long, 2 Tumor Suppressor gene; https://bioinfo.uth.edu/TSGene/, 3 Cancer Gene Census; http://www.nature.com/nrc/journal/v4/n3/abs/nrc1299.html, 4 CancerGenes; http://nar.oxfordjournals.org/content/35/suppl_1/D721.long, 5 Network of Cancer Gene; http://ncg.kcl.ac.uk/index.php, 1Therapeutic Vulnerabilities in Cancer; http://cbio.mskcc.org/cancergenomics/statius/ |
| KEGG_ARACHIDONIC_ACID_METABOLISM | |
| OMIM | |
| Orphanet | |
| Disease | KEGG Disease: PTGDS |
| MedGen: PTGDS (Human Medical Genetics with Condition) | |
| ClinVar: PTGDS | |
| Phenotype | MGI: PTGDS (International Mouse Phenotyping Consortium) |
| PhenomicDB: PTGDS | |
| Mutations for PTGDS |
| * Under tables are showing count per each tissue to give us broad intuition about tissue specific mutation patterns.You can go to the detailed page for each mutation database's web site. |
| There's no structural variation information in COSMIC data for this gene. |
| * From mRNA Sanger sequences, Chitars2.0 arranged chimeric transcripts. This table shows PTGDS related fusion information. |
| ID | Head Gene | Tail Gene | Accession | Gene_a | qStart_a | qEnd_a | Chromosome_a | tStart_a | tEnd_a | Gene_a | qStart_a | qEnd_a | Chromosome_a | tStart_a | tEnd_a |
| CB153680 | PTGDS | 2 | 90 | 9 | 139871956 | 139872044 | HIP1R | 85 | 542 | 12 | 123343442 | 123344782 | |
| DA811774 | PTGDS | 1 | 354 | 9 | 139871956 | 139873699 | HKR1 | 349 | 637 | 19 | 37853722 | 37854005 | |
| AJ711203 | PTGDS | 1 | 67 | 9 | 139871977 | 139872044 | MYL7 | 63 | 393 | 7 | 44178466 | 44179968 | |
| AJ711202 | PTGDS | 12 | 78 | 9 | 139871977 | 139872044 | MYL7 | 74 | 404 | 7 | 44178466 | 44179968 | |
| Z17825 | SRRM2 | 2 | 145 | 16 | 2813306 | 2813449 | PTGDS | 137 | 254 | 9 | 139871956 | 139872075 | |
| DA262936 | PTGDS | 1 | 456 | 9 | 139871956 | 139874447 | DIP2C | 453 | 559 | 10 | 709466 | 709572 | |
| BC094690 | MYBPC2 | 1 | 918 | 19 | 50936160 | 50945535 | PTGDS | 916 | 1621 | 9 | 139872062 | 139876194 | |
| BQ950270 | PTGDS | 12 | 65 | 9 | 139876117 | 139876170 | PTGDS | 57 | 829 | 9 | 139871961 | 139876144 | |
| AW316630 | PTGDS | 1 | 402 | 9 | 139874404 | 139876196 | FAM63A | 397 | 491 | 1 | 150970227 | 150970623 | |
| EB387717 | PTGDS | 1 | 167 | 9 | 139871994 | 139872160 | SIDT2 | 163 | 758 | 11 | 117052160 | 117053256 | |
| Top |
| There's no copy number variation information in COSMIC data for this gene. |
| Top |
|
 |
| Top |
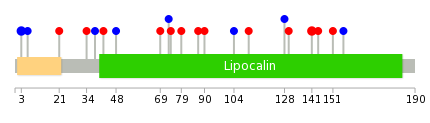
| Stat. for Non-Synonymous SNVs (# total SNVs=13) | (# total SNVs=5) |
 |  |
(# total SNVs=0) | (# total SNVs=0) |
| Top |
| * When you move the cursor on each content, you can see more deailed mutation information on the Tooltip. Those are primary_site,primary_histology,mutation(aa),pubmedID. |
| GRCh37 position | Mutation(aa) | Unique sampleID count |
| chr9:139872039-139872039 | p.T3T | 2 |
| chr9:139874450-139874450 | p.Y128* | 2 |
| chr9:139874487-139874487 | p.E141K | 2 |
| chr9:139874654-139874654 | p.R156R | 1 |
| chr9:139873565-139873565 | p.L79V | 1 |
| chr9:139875307-139875307 | p.*191Y | 1 |
| chr9:139873680-139873680 | p.N87S | 1 |
| chr9:139872048-139872048 | p.T6T | 1 |
| chr9:139873688-139873688 | p.E90K | 1 |
| chr9:139872093-139872093 | p.Q21H | 1 |
| Top |
|
 |
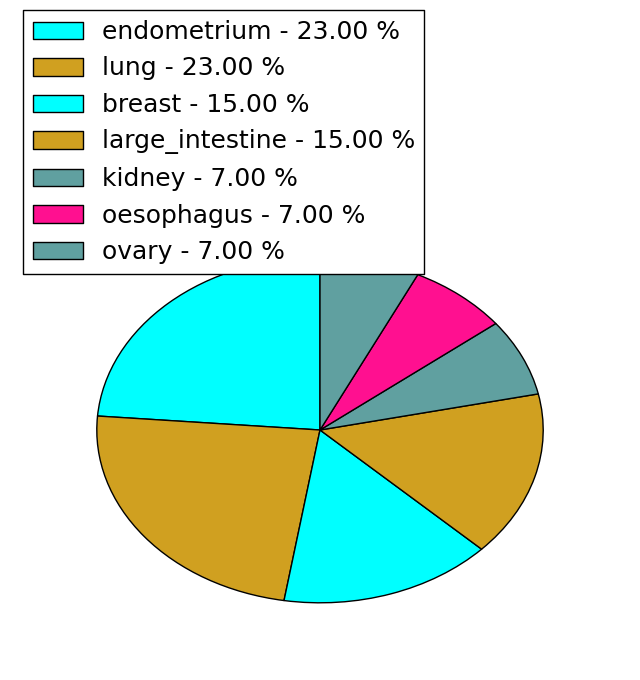
| Point Mutation/ Tissue ID | 1 | 2 | 3 | 4 | 5 | 6 | 7 | 8 | 9 | 10 | 11 | 12 | 13 | 14 | 15 | 16 | 17 | 18 | 19 | 20 |
| # sample | 1 | 2 | 1 | 2 | 1 | 2 | 1 | 3 | ||||||||||||
| # mutation | 1 | 2 | 1 | 2 | 1 | 3 | 1 | 3 | ||||||||||||
| nonsynonymous SNV | 2 | 1 | 2 | 1 | 1 | 3 | ||||||||||||||
| synonymous SNV | 1 | 1 | 2 |
| cf) Tissue ID; Tissue type (1; BLCA[Bladder Urothelial Carcinoma], 2; BRCA[Breast invasive carcinoma], 3; CESC[Cervical squamous cell carcinoma and endocervical adenocarcinoma], 4; COAD[Colon adenocarcinoma], 5; GBM[Glioblastoma multiforme], 6; Glioma Low Grade, 7; HNSC[Head and Neck squamous cell carcinoma], 8; KICH[Kidney Chromophobe], 9; KIRC[Kidney renal clear cell carcinoma], 10; KIRP[Kidney renal papillary cell carcinoma], 11; LAML[Acute Myeloid Leukemia], 12; LUAD[Lung adenocarcinoma], 13; LUSC[Lung squamous cell carcinoma], 14; OV[Ovarian serous cystadenocarcinoma ], 15; PAAD[Pancreatic adenocarcinoma], 16; PRAD[Prostate adenocarcinoma], 17; SKCM[Skin Cutaneous Melanoma], 18:STAD[Stomach adenocarcinoma], 19:THCA[Thyroid carcinoma], 20:UCEC[Uterine Corpus Endometrial Carcinoma]) |
| Top |
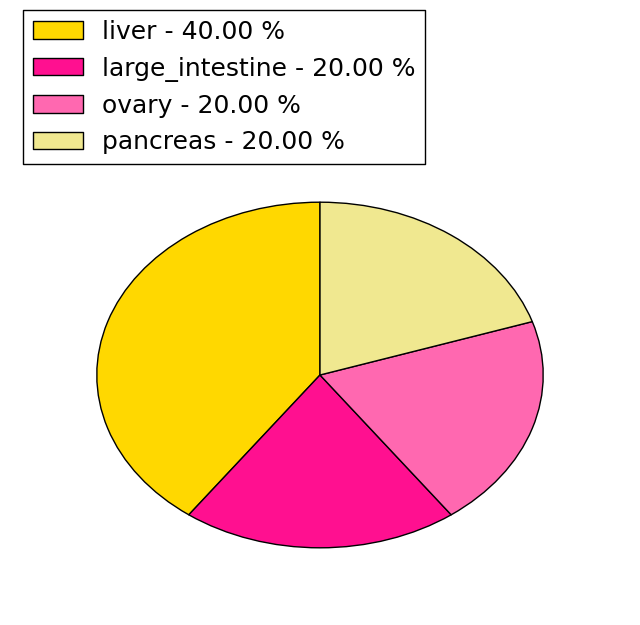
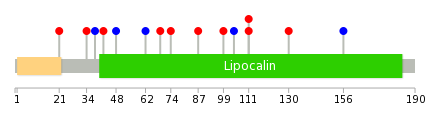
| * We represented just top 10 SNVs. When you move the cursor on each content, you can see more deailed mutation information on the Tooltip. Those are primary_site, primary_histology, mutation(aa), pubmedID. |
| Genomic Position | Mutation(aa) | Unique sampleID count |
| chr9:139873751 | p.H111N | 2 |
| chr9:139873732 | p.L130M | 1 |
| chr9:139872093 | p.R156R | 1 |
| chr9:139872131 | p.Q21H | 1 |
| chr9:139874454 | p.F34Y | 1 |
| chr9:139872144 | p.K38K | 1 |
| chr9:139874654 | p.R42H | 1 |
| chr9:139873455 | p.L48L | 1 |
| chr9:139873474 | p.L62L | 1 |
| chr9:139873514 | p.V69M | 1 |
| * Copy number data were extracted from TCGA using R package TCGA-Assembler. The URLs of all public data files on TCGA DCC data server were gathered on Jan-05-2015. Function ProcessCNAData in TCGA-Assembler package was used to obtain gene-level copy number value which is calculated as the average copy number of the genomic region of a gene. |
 |
| cf) Tissue ID[Tissue type]: BLCA[Bladder Urothelial Carcinoma], BRCA[Breast invasive carcinoma], CESC[Cervical squamous cell carcinoma and endocervical adenocarcinoma], COAD[Colon adenocarcinoma], GBM[Glioblastoma multiforme], Glioma Low Grade, HNSC[Head and Neck squamous cell carcinoma], KICH[Kidney Chromophobe], KIRC[Kidney renal clear cell carcinoma], KIRP[Kidney renal papillary cell carcinoma], LAML[Acute Myeloid Leukemia], LUAD[Lung adenocarcinoma], LUSC[Lung squamous cell carcinoma], OV[Ovarian serous cystadenocarcinoma ], PAAD[Pancreatic adenocarcinoma], PRAD[Prostate adenocarcinoma], SKCM[Skin Cutaneous Melanoma], STAD[Stomach adenocarcinoma], THCA[Thyroid carcinoma], UCEC[Uterine Corpus Endometrial Carcinoma] |
| Top |
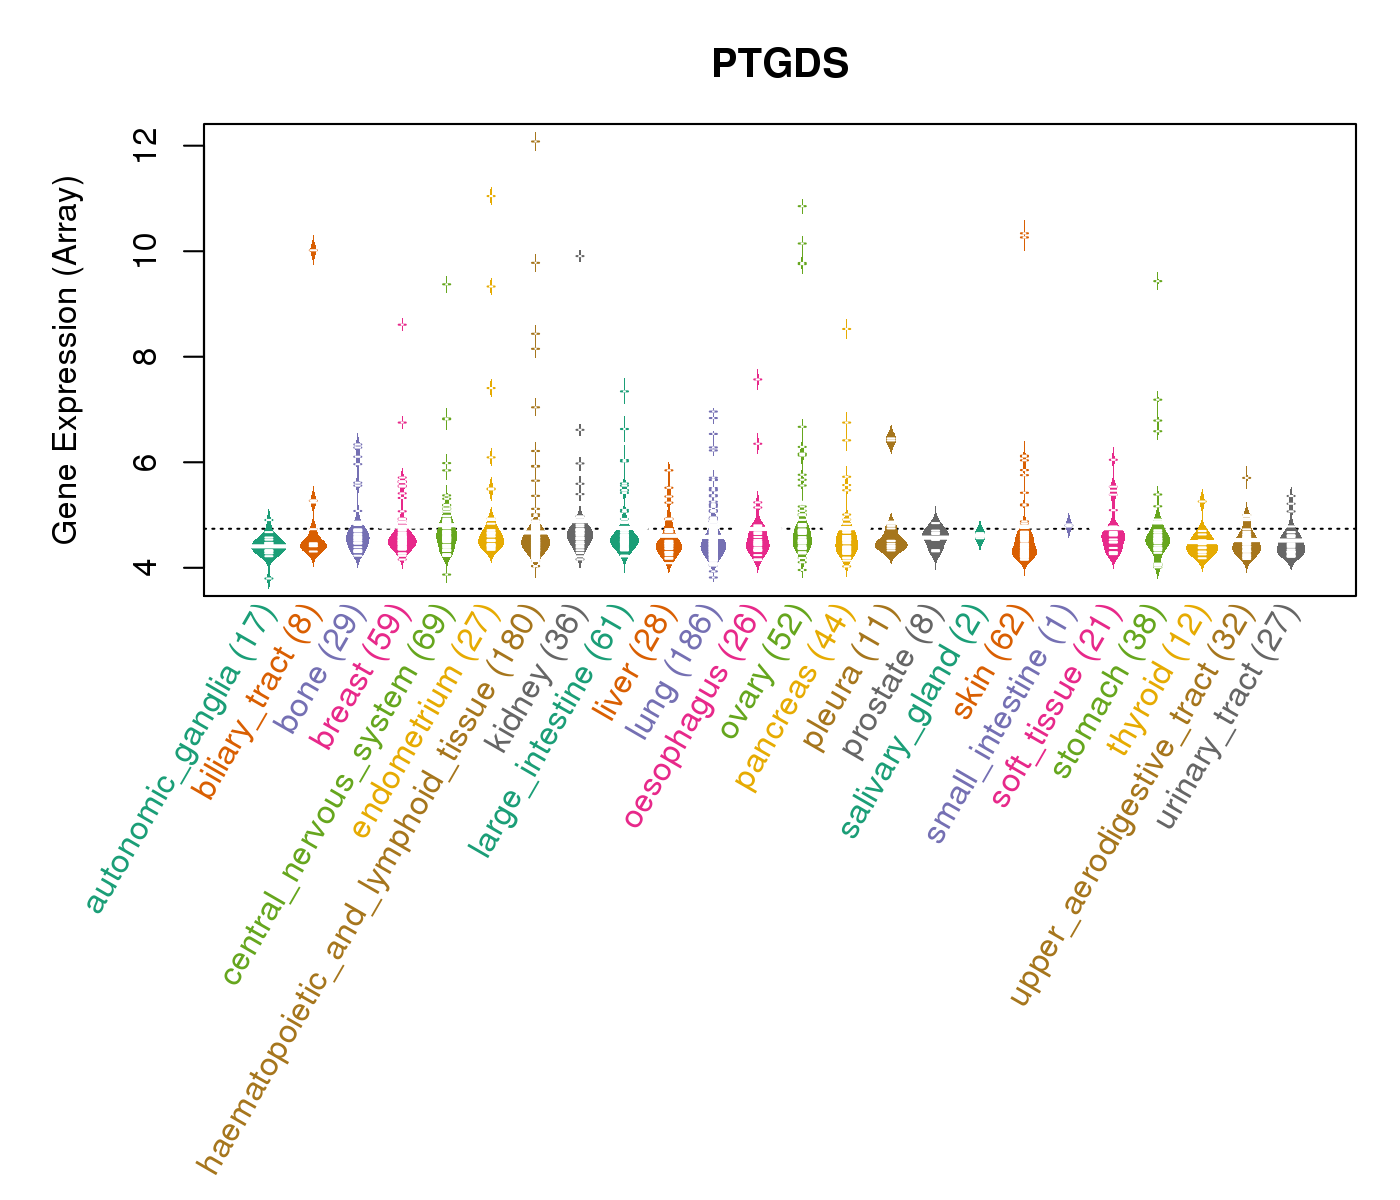
| Gene Expression for PTGDS |
| * CCLE gene expression data were extracted from CCLE_Expression_Entrez_2012-10-18.res: Gene-centric RMA-normalized mRNA expression data. |
 |
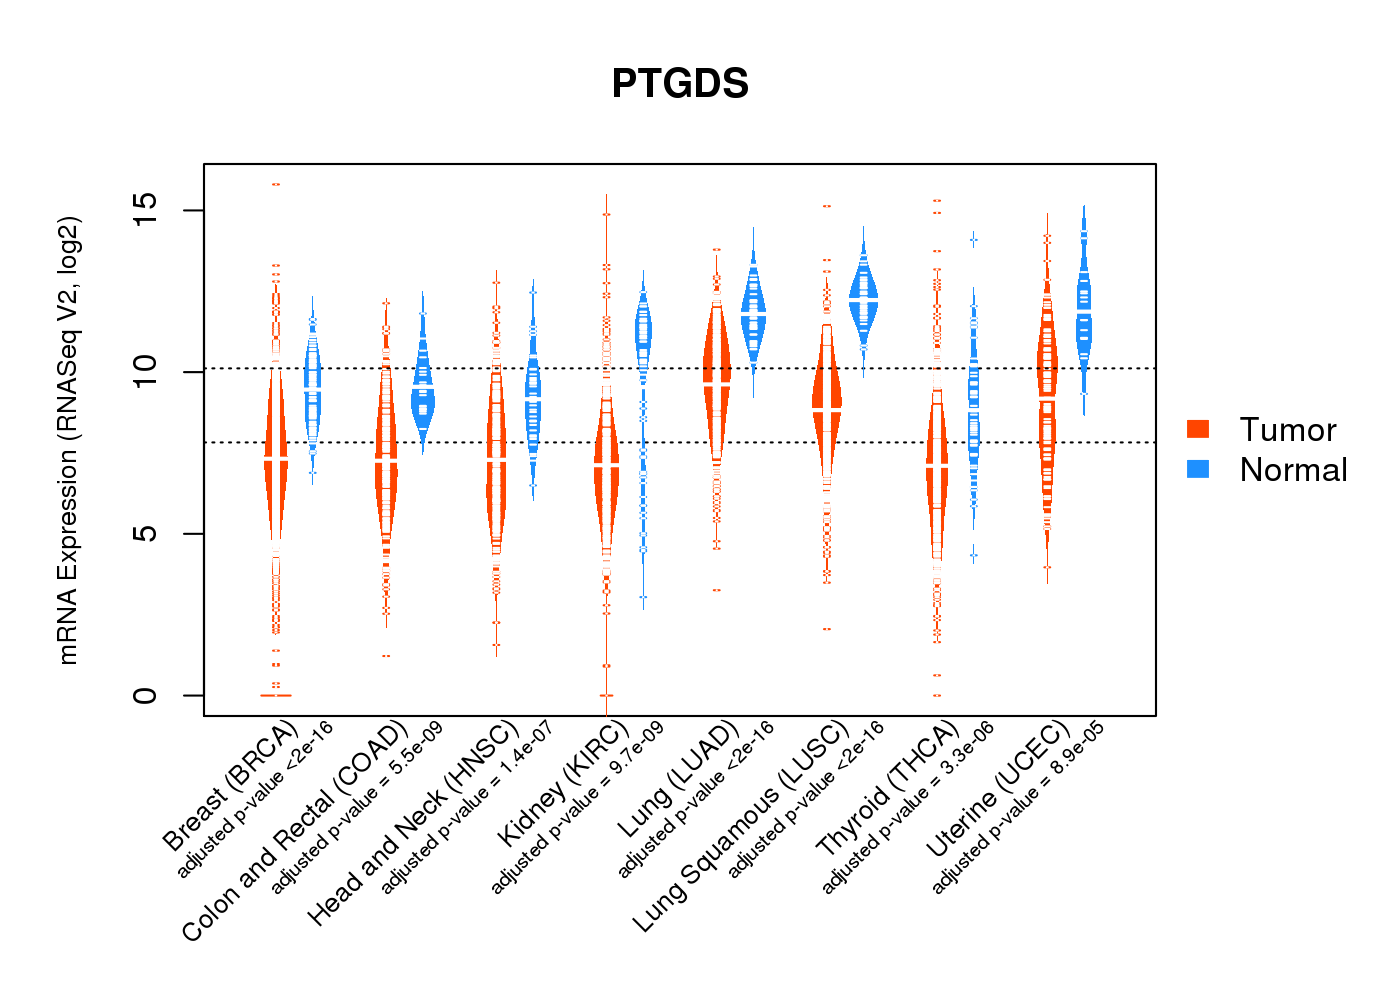
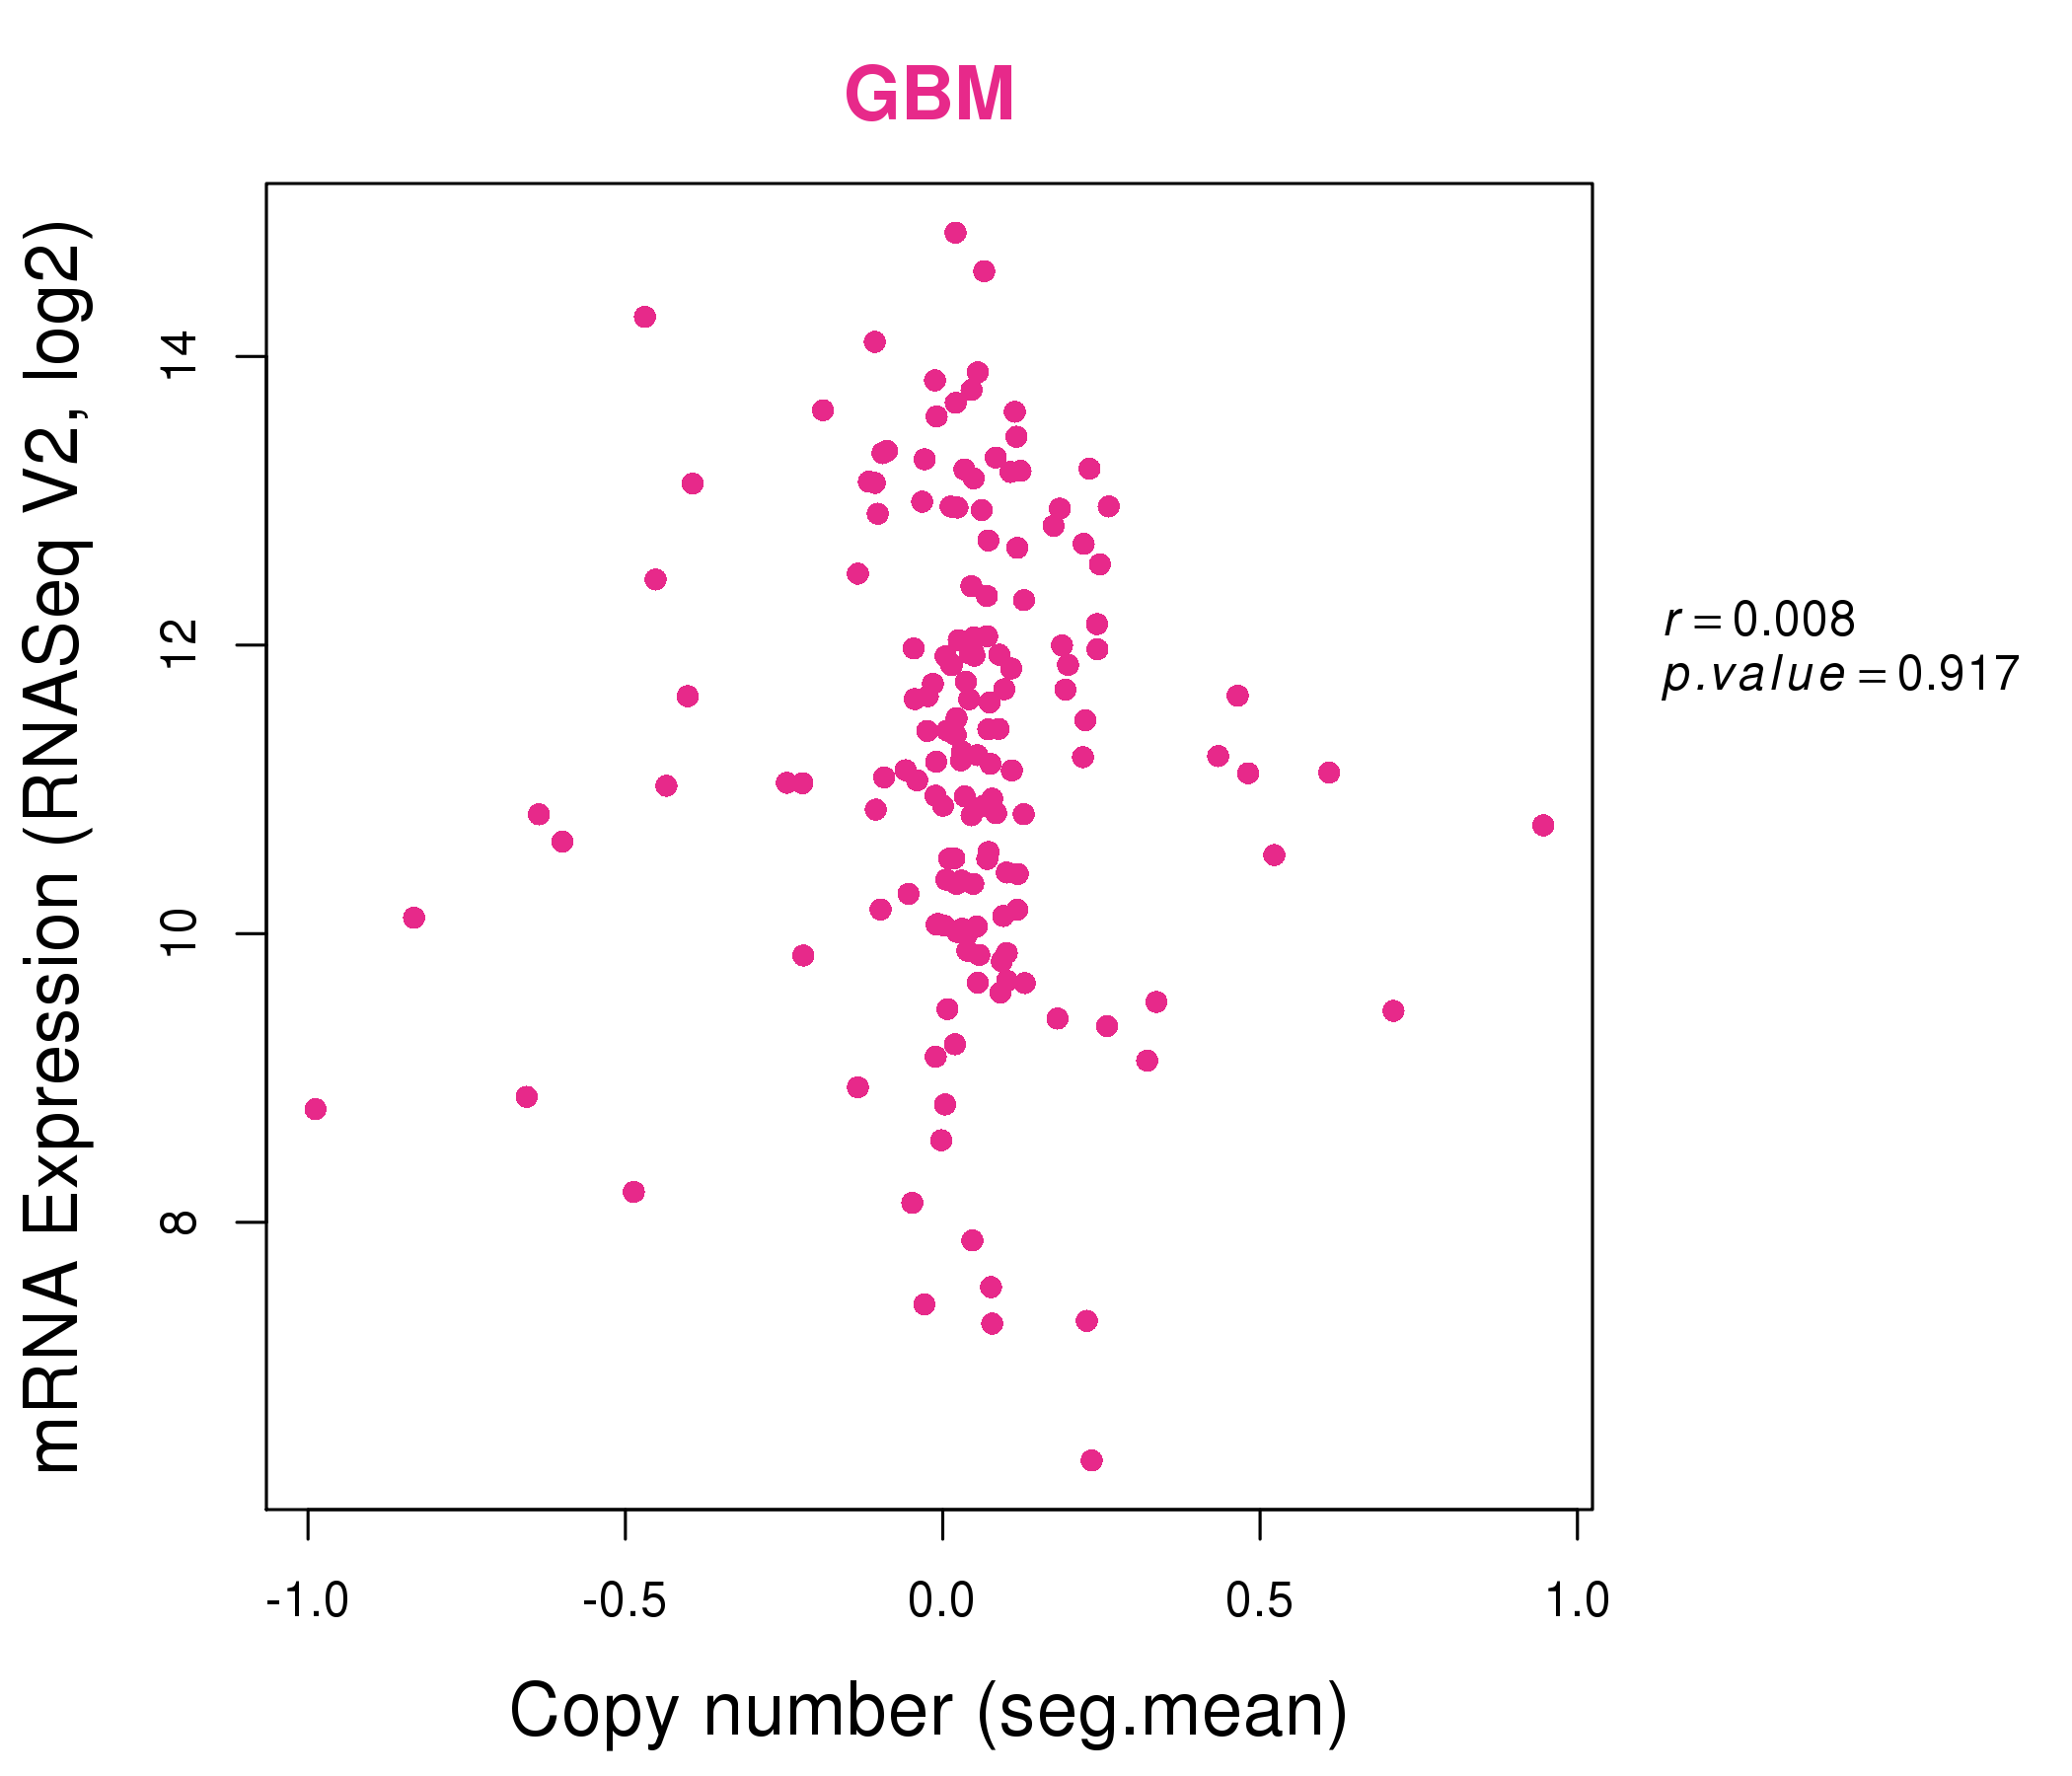
| * Normalized gene expression data of RNASeqV2 was extracted from TCGA using R package TCGA-Assembler. The URLs of all public data files on TCGA DCC data server were gathered at Jan-05-2015. Only eight cancer types have enough normal control samples for differential expression analysis. (t test, adjusted p<0.05 (using Benjamini-Hochberg FDR)) |
 |
| Top |
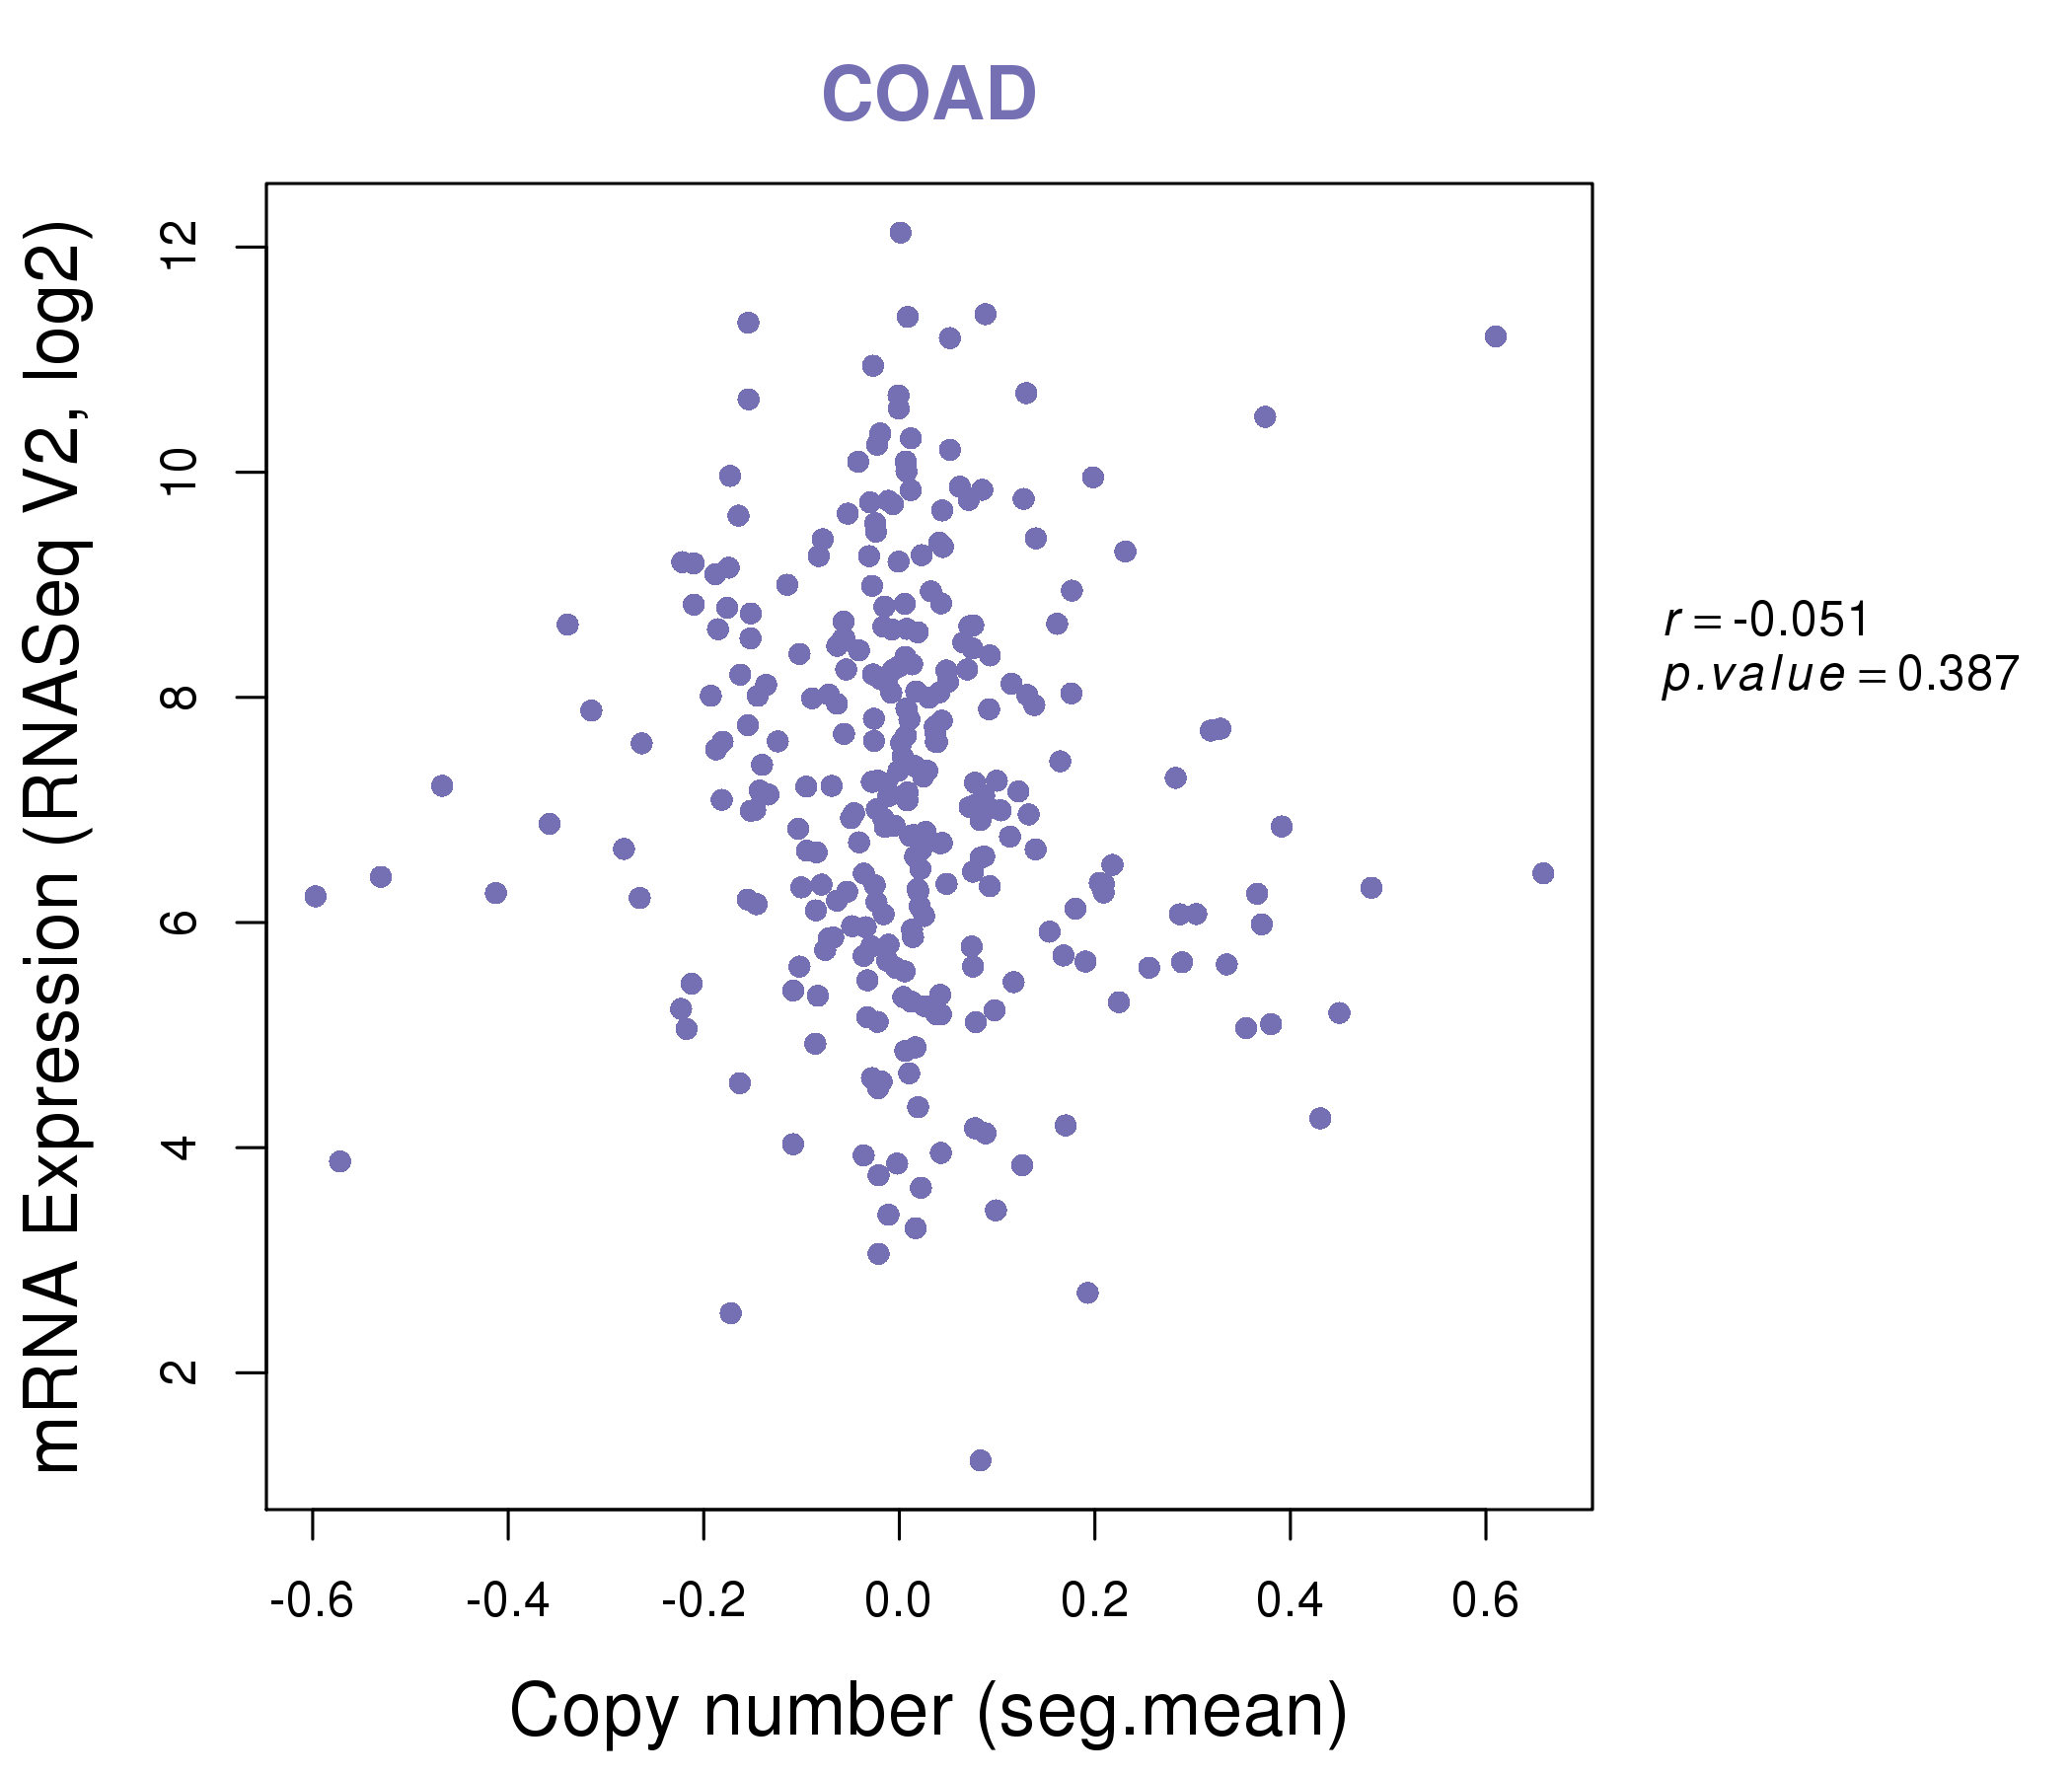
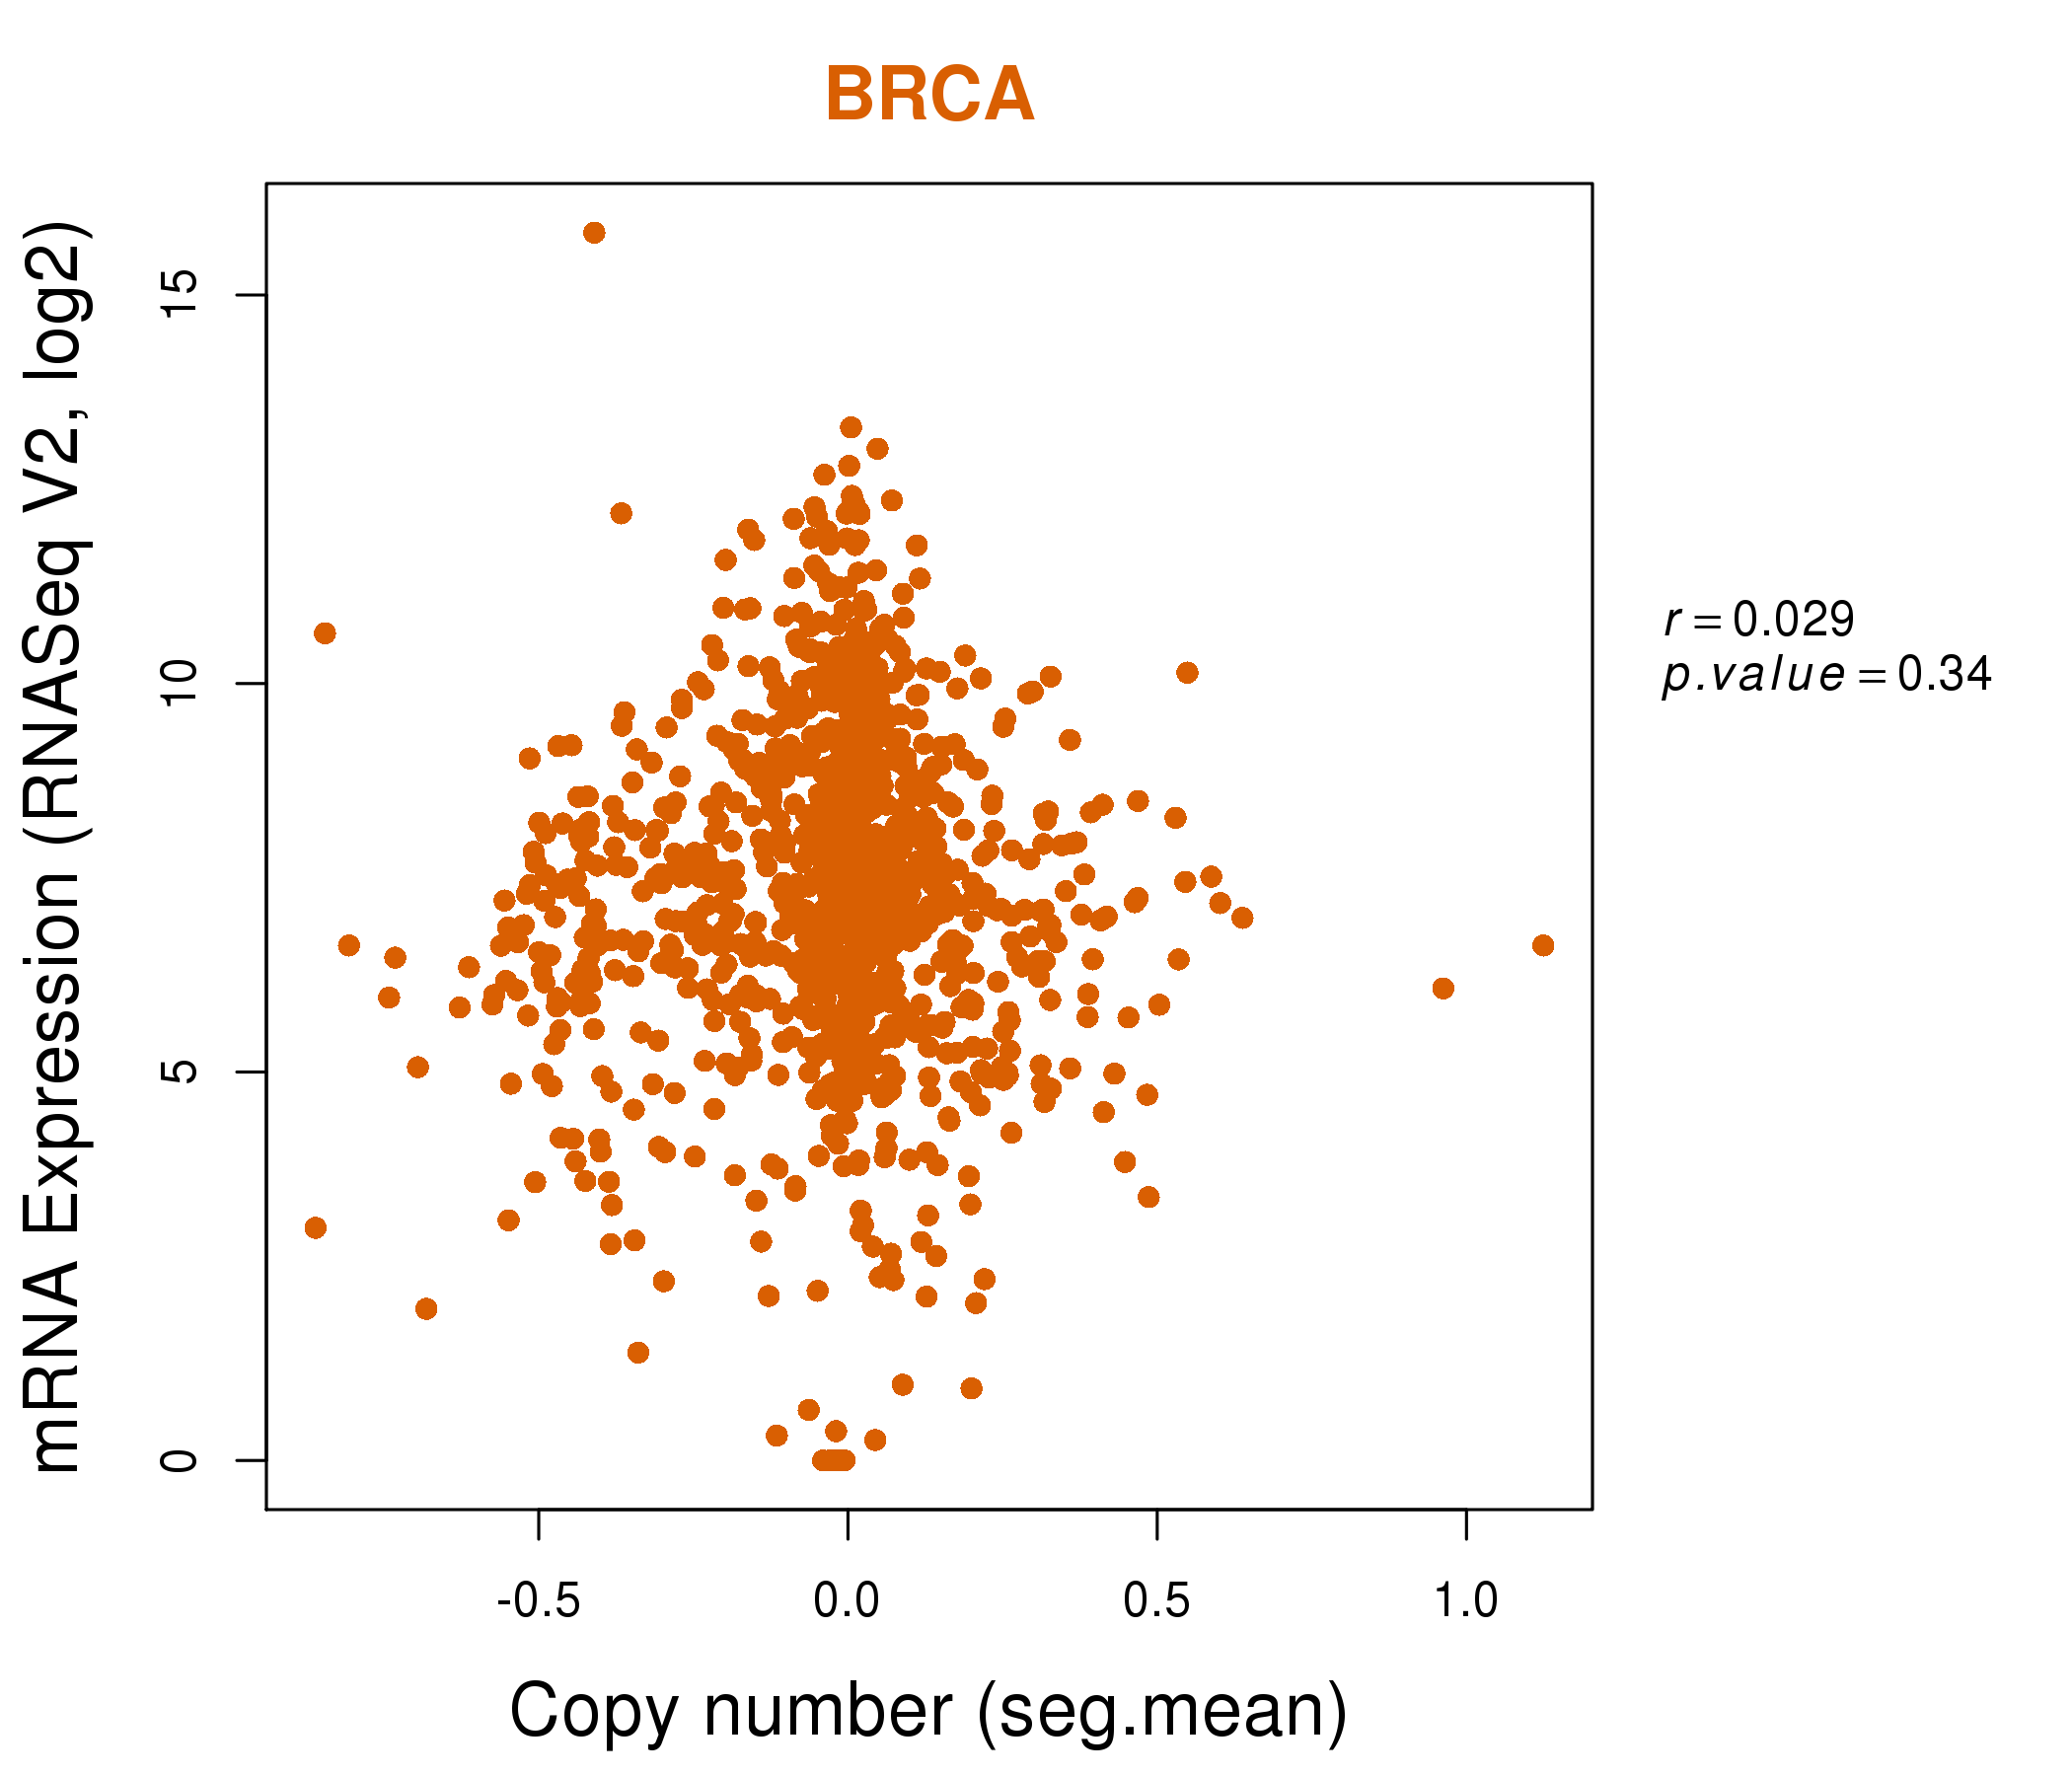
| * This plots show the correlation between CNV and gene expression. |
: Open all plots for all cancer types
 |
|
 |
|
| Top |
| Gene-Gene Network Information |
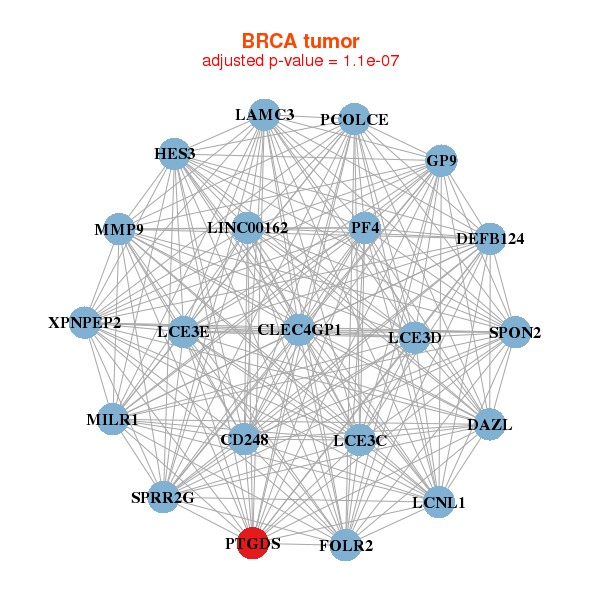
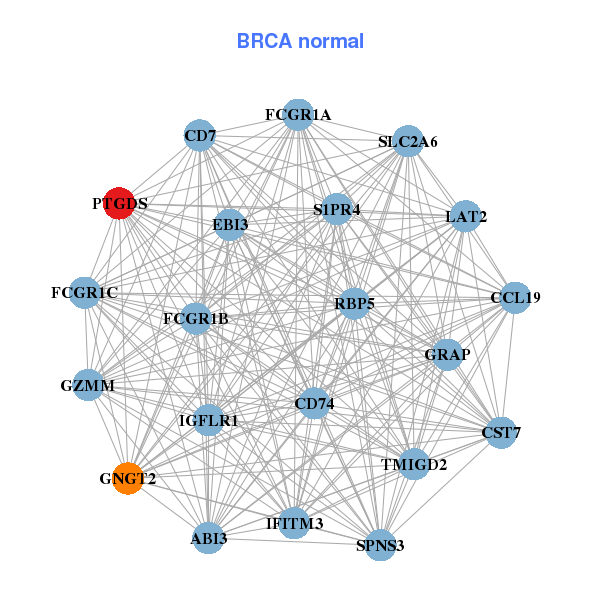
| * Co-Expression network figures were drawn using R package igraph. Only the top 20 genes with the highest correlations were shown. Red circle: input gene, orange circle: cell metabolism gene, sky circle: other gene |
: Open all plots for all cancer types
 |
| ||||
| MILR1,CD248,CLEC4GP1,DAZL,DEFB124,FOLR2,GP9, HES3,LAMC3,LCE3C,LCE3D,LCE3E,LCNL1,MMP9, LINC00162,PCOLCE,PF4,PTGDS,SPON2,SPRR2G,XPNPEP2 | ABI3,CCL19,CD74,CD7,CST7,EBI3,FCGR1A, FCGR1B,FCGR1C,GNGT2,GRAP,GZMM,IFITM3,LAT2, PTGDS,RBP5,S1PR4,SLC2A6,SPNS3,IGFLR1,TMIGD2 | ||||
 |
| ||||
| ABI3BP,ANK2,CCL19,CD37,CYSLTR1,GAPT,GFRA2, GIMAP7,TP73-AS1,TESPA1,MFNG,MUSK,NAPSB,PPP1R16B, PRKCB,PTGDS,RBP5,RSPO1,SCN4B,SLC9A9,TDRD10 | AADACL4,BPIFB4,C4A,CDH3,CNBD1,CPXM1,CR1, DEFB124,DPYS,DYDC1,FAM26D,GLYCAM1,IGFN1,LIM2, MARCO,OR3A4P,PTGDS,SCGB1A1,SCGB3A1,SNORA22,TIMD4 |

| * Co-Expression network figures were drawn using R package igraph. Only the top 20 genes with the highest correlations were shown. Red circle: input gene, orange circle: cell metabolism gene, sky circle: other gene |
: Open all plots for all cancer types
| Top |
: Open all interacting genes' information including KEGG pathway for all interacting genes from DAVID
| Top |
| Pharmacological Information for PTGDS |
| DB Category | DB Name | DB's ID and Url link |
| * Gene Centered Interaction Network. |
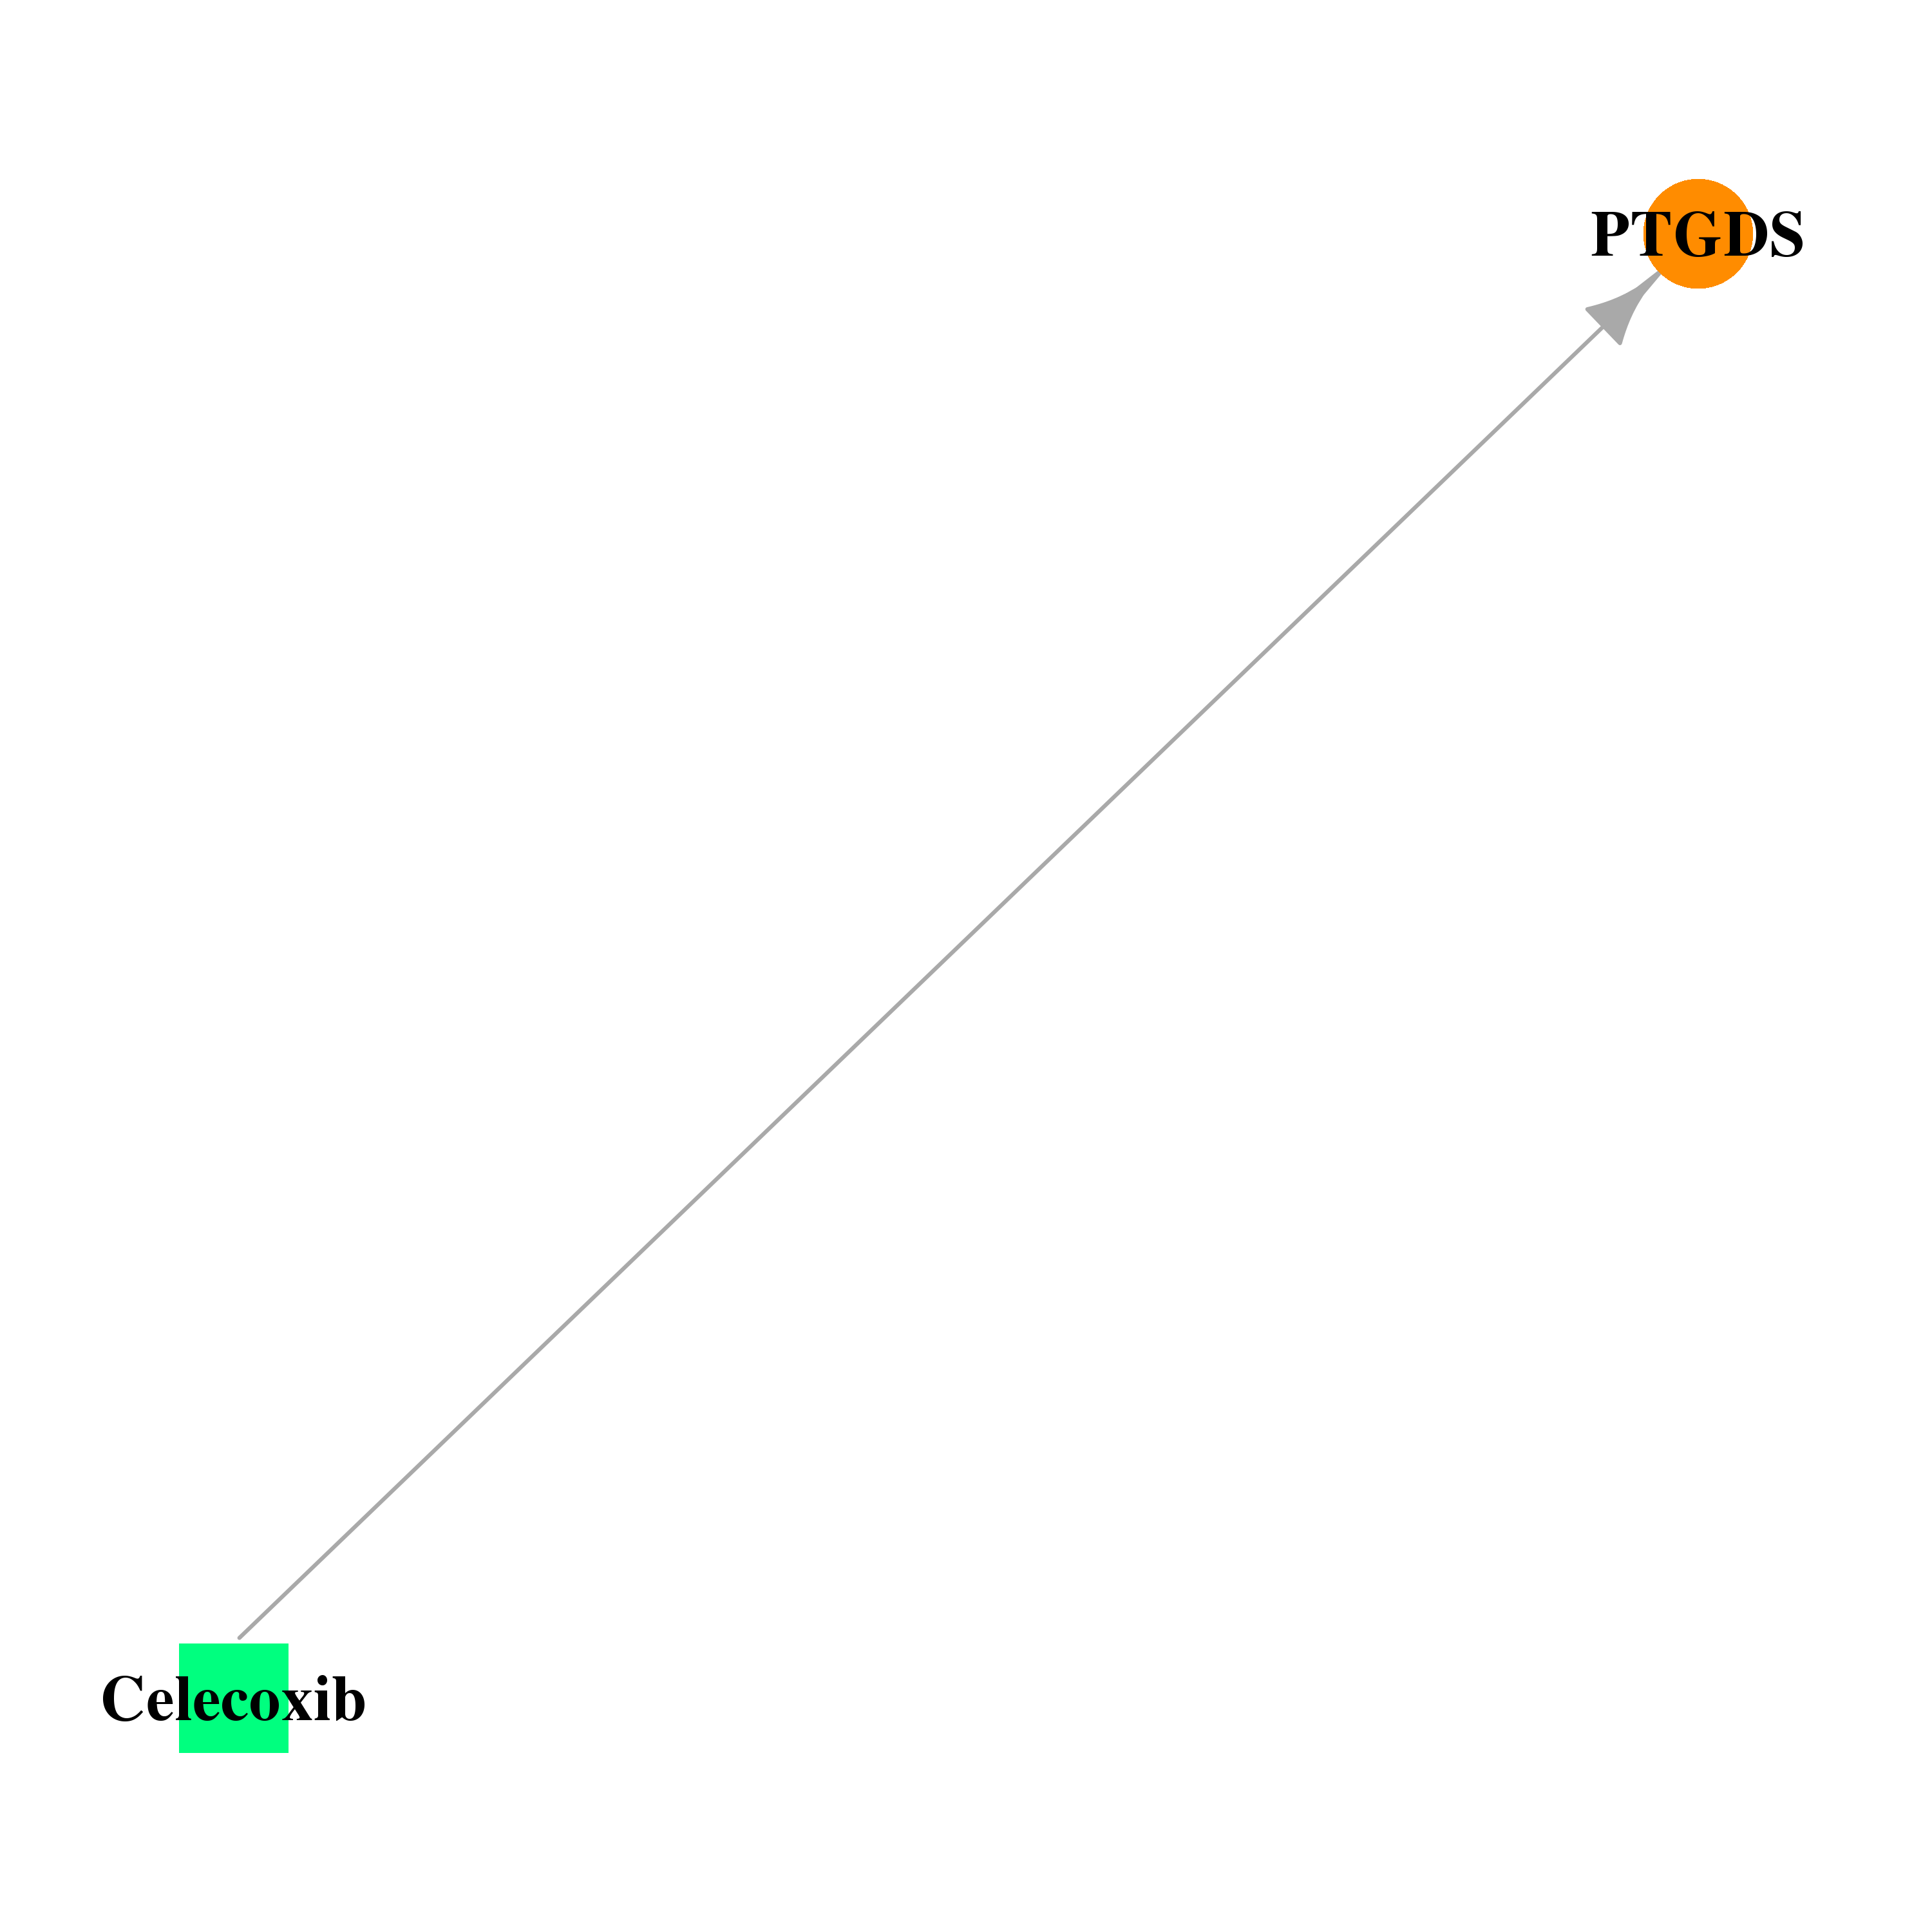 |
| * Drug Centered Interaction Network. |
| DrugBank ID | Target Name | Drug Groups | Generic Name | Drug Centered Network | Drug Structure |
| DB00482 | prostaglandin D2 synthase 21kDa (brain) | approved; investigational | Celecoxib | 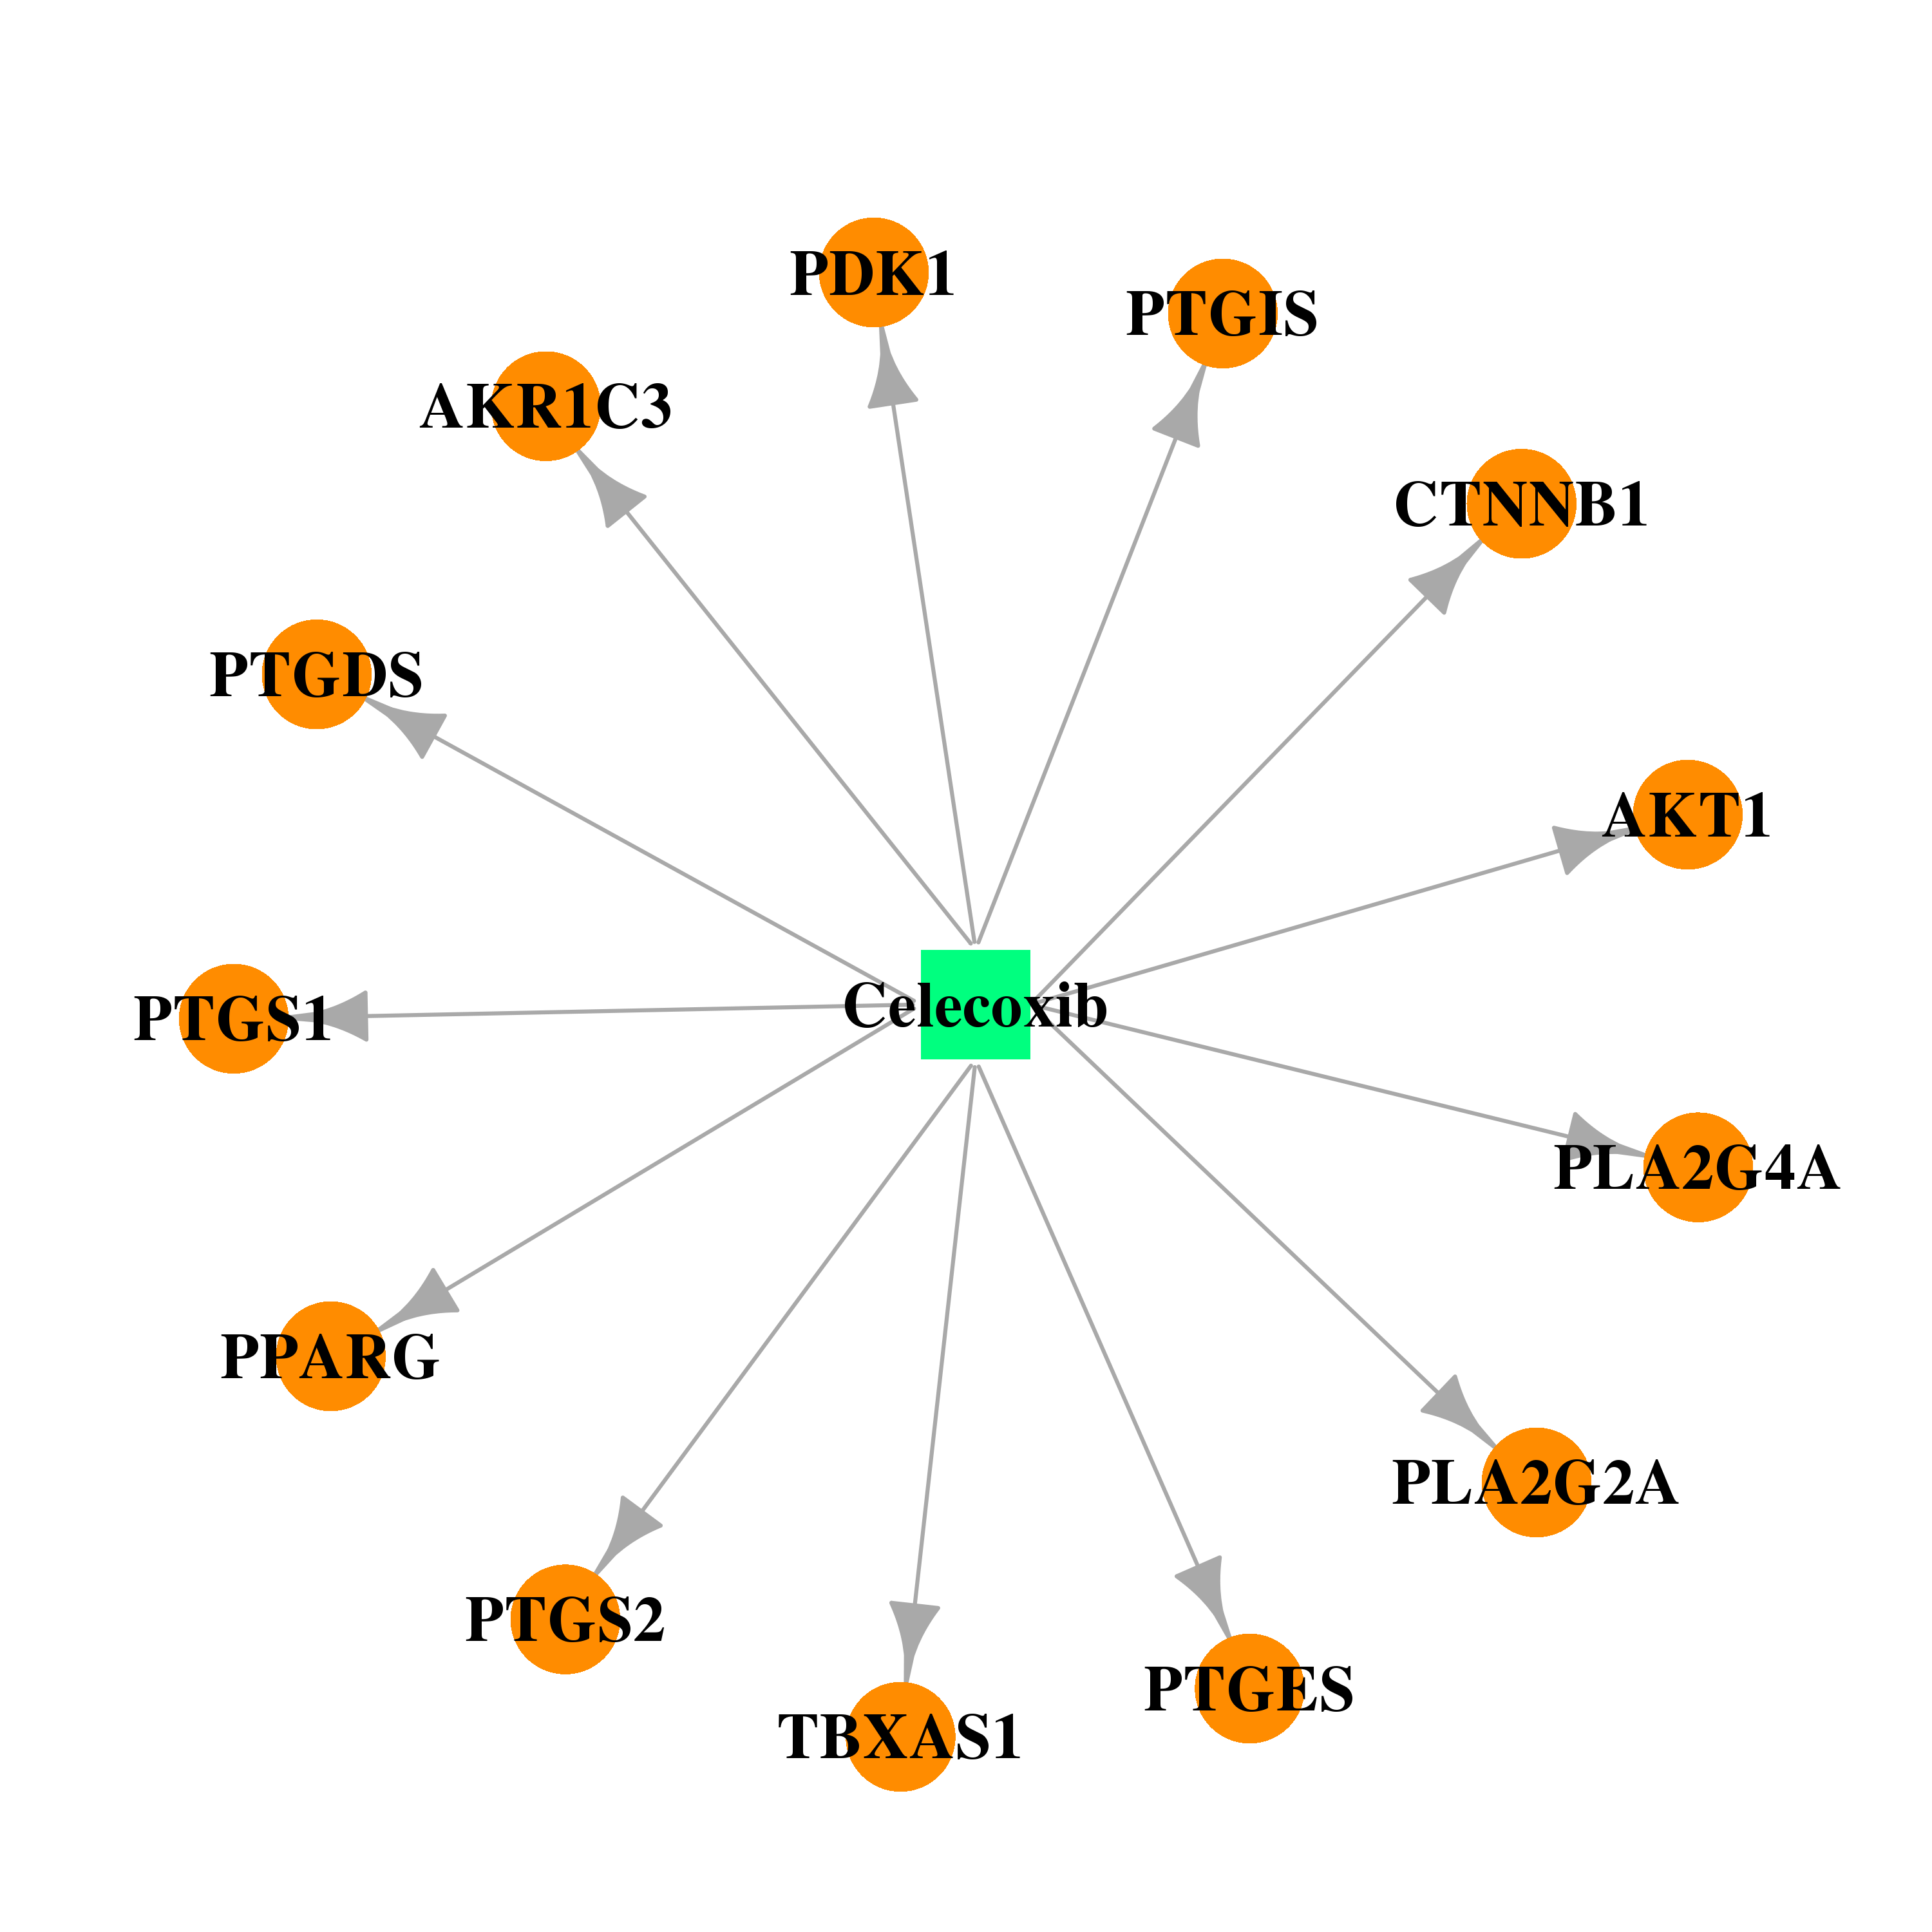 |  |
| Top |
| Cross referenced IDs for PTGDS |
| * We obtained these cross-references from Uniprot database. It covers 150 different DBs, 18 categories. http://www.uniprot.org/help/cross_references_section |
: Open all cross reference information
|
Copyright © 2016-Present - The Univsersity of Texas Health Science Center at Houston @ |