|
|||||||||||||||||||||||||||||||||||||||||||||||||||||||||||||||||||||||||||||||||||||||||||||||||||||||||||||||||||||||||||||||||||||||||||||||||||||||||||||||||||||||||||||||||||||||||||||||||||||||||||||||||||||||||||||||||||||||||||||||||||||||||||||||||||||||||||||||||||||||||||||||||||||||||||||||||||||||||||||||||||||||||||||||||||||||||||||||||||||||||||||||||
| |
| Phenotypic Information (metabolism pathway, cancer, disease, phenome) |
| |
| |
| Gene-Gene Network Information: Co-Expression Network, Interacting Genes & KEGG |
| |
|


| Gene Summary for PTGIS |
| Top |
| Phenotypic Information for PTGIS(metabolism pathway, cancer, disease, phenome) |
| Cancer | CGAP: PTGIS |
| Familial Cancer Database: PTGIS | |
| * This gene is included in those cancer gene databases. |
|
|
|
|
|
| . | |||||||||||||||||||||||||||||||||||||||||||||||||||||||||||||||||||||||||||||||||||||||||||||||||||||||||||||||||||||||||||||||||||||||||||||||||||||||||||||||||||||||||||||||||||||||||||||||||||||||||||||||||||||||||||||||||||||||||||||||||||||||||||||||||||||||||||||||||||||||||||||||||||||||||||||||||||||||||||||||||||||||||||||||||||||||||||||||||||||||||||
Oncogene 1 | Significant driver gene in | ||||||||||||||||||||||||||||||||||||||||||||||||||||||||||||||||||||||||||||||||||||||||||||||||||||||||||||||||||||||||||||||||||||||||||||||||||||||||||||||||||||||||||||||||||||||||||||||||||||||||||||||||||||||||||||||||||||||||||||||||||||||||||||||||||||||||||||||||||||||||||||||||||||||||||||||||||||||||||||||||||||||||||||||||||||||||||||||||||||||||||||||||
| cf) number; DB name 1 Oncogene; http://nar.oxfordjournals.org/content/35/suppl_1/D721.long, 2 Tumor Suppressor gene; https://bioinfo.uth.edu/TSGene/, 3 Cancer Gene Census; http://www.nature.com/nrc/journal/v4/n3/abs/nrc1299.html, 4 CancerGenes; http://nar.oxfordjournals.org/content/35/suppl_1/D721.long, 5 Network of Cancer Gene; http://ncg.kcl.ac.uk/index.php, 1Therapeutic Vulnerabilities in Cancer; http://cbio.mskcc.org/cancergenomics/statius/ |
| KEGG_ARACHIDONIC_ACID_METABOLISM | |
| OMIM | |
| Orphanet | |
| Disease | KEGG Disease: PTGIS |
| MedGen: PTGIS (Human Medical Genetics with Condition) | |
| ClinVar: PTGIS | |
| Phenotype | MGI: PTGIS (International Mouse Phenotyping Consortium) |
| PhenomicDB: PTGIS | |
| Mutations for PTGIS |
| * Under tables are showing count per each tissue to give us broad intuition about tissue specific mutation patterns.You can go to the detailed page for each mutation database's web site. |
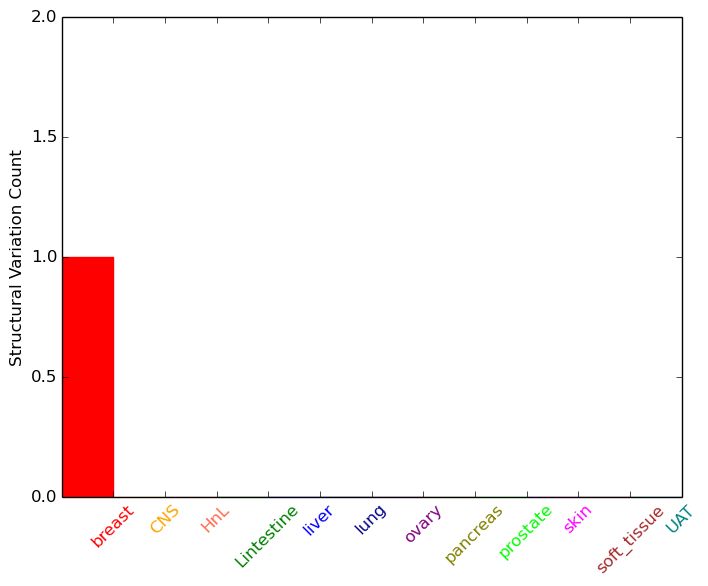
| - Statistics for Tissue and Mutation type | Top |
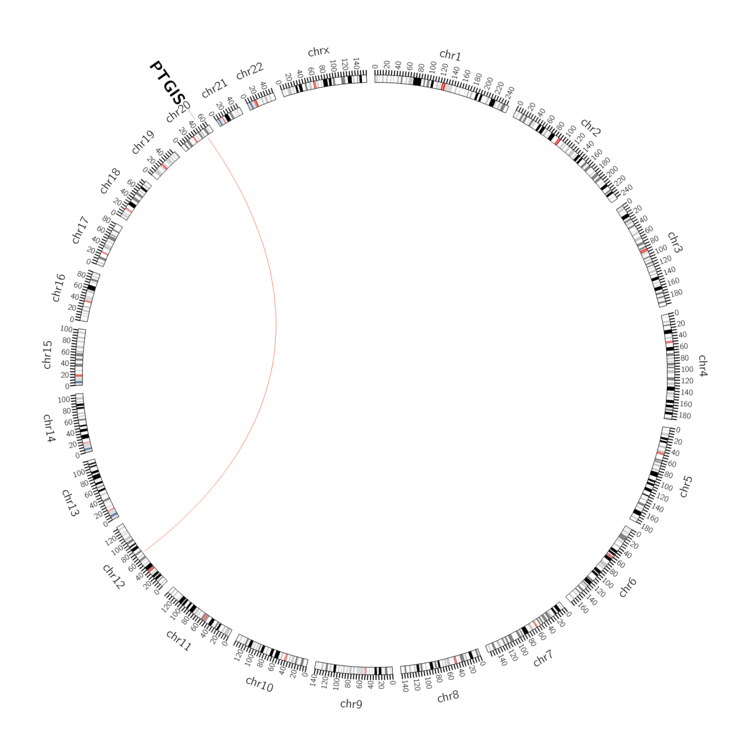 |
| - For Inter-chromosomal Variations |
| * Inter-chromosomal variantions includes 'interchromosomal amplicon to amplicon', 'interchromosomal amplicon to non-amplified dna', 'interchromosomal insertion', 'Interchromosomal unknown type'. |
 |
| - For Intra-chromosomal Variations |
| There's no intra-chromosomal structural variation. |
| Sample | Symbol_a | Chr_a | Start_a | End_a | Symbol_b | Chr_b | Start_b | End_b |
| cf) Tissue number; Tissue name (1;Breast, 2;Central_nervous_system, 3;Haematopoietic_and_lymphoid_tissue, 4;Large_intestine, 5;Liver, 6;Lung, 7;Ovary, 8;Pancreas, 9;Prostate, 10;Skin, 11;Soft_tissue, 12;Upper_aerodigestive_tract) |
| * From mRNA Sanger sequences, Chitars2.0 arranged chimeric transcripts. This table shows PTGIS related fusion information. |
| ID | Head Gene | Tail Gene | Accession | Gene_a | qStart_a | qEnd_a | Chromosome_a | tStart_a | tEnd_a | Gene_a | qStart_a | qEnd_a | Chromosome_a | tStart_a | tEnd_a |
| Top |
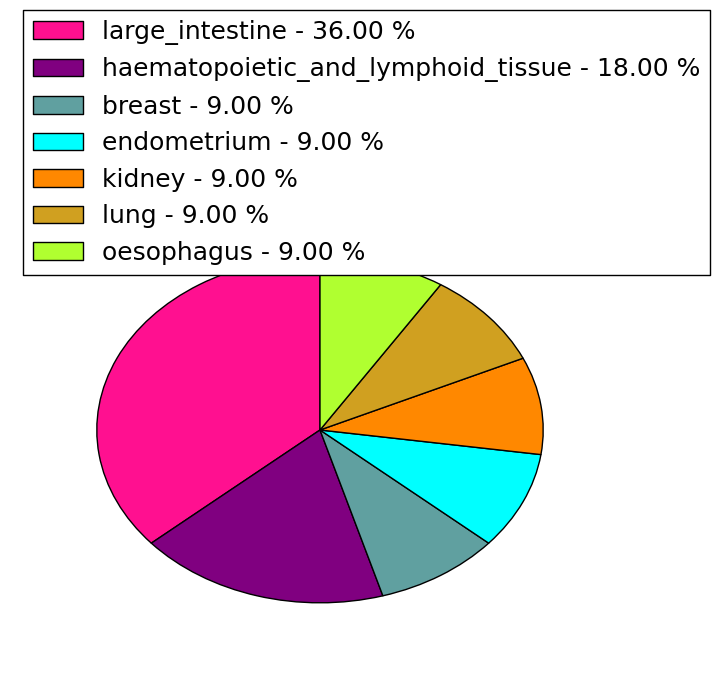
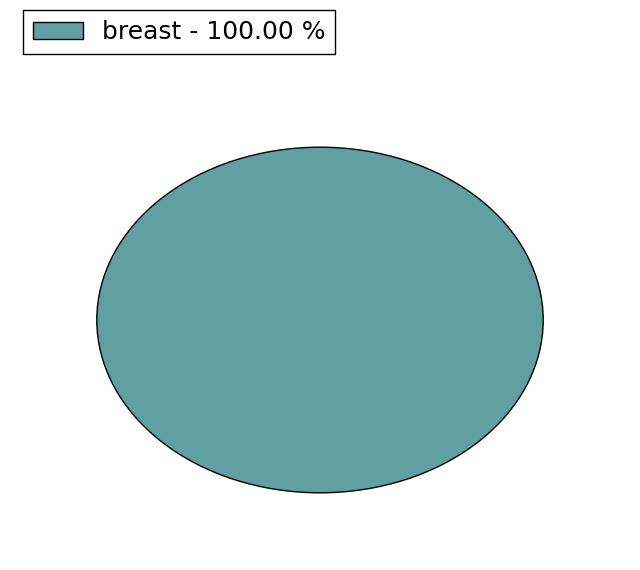
| Mutation type/ Tissue ID | brca | cns | cerv | endome | haematopo | kidn | Lintest | liver | lung | ns | ovary | pancre | prost | skin | stoma | thyro | urina | |||
| Total # sample | 3 | 1 | 3 | |||||||||||||||||
| GAIN (# sample) | 3 | 1 | 3 | |||||||||||||||||
| LOSS (# sample) |
| cf) Tissue ID; Tissue type (1; Breast, 2; Central_nervous_system, 3; Cervix, 4; Endometrium, 5; Haematopoietic_and_lymphoid_tissue, 6; Kidney, 7; Large_intestine, 8; Liver, 9; Lung, 10; NS, 11; Ovary, 12; Pancreas, 13; Prostate, 14; Skin, 15; Stomach, 16; Thyroid, 17; Urinary_tract) |
| Top |
|
 |
| Top |
| Stat. for Non-Synonymous SNVs (# total SNVs=53) | (# total SNVs=11) |
 |  |
(# total SNVs=0) | (# total SNVs=1) |
 |
| Top |
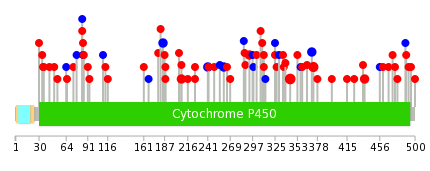
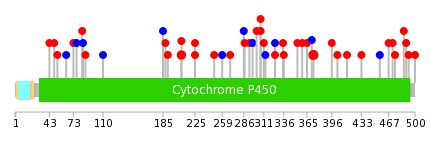
| * When you move the cursor on each content, you can see more deailed mutation information on the Tooltip. Those are primary_site,primary_histology,mutation(aa),pubmedID. |
| GRCh37 position | Mutation(aa) | Unique sampleID count |
| chr20:48129793-48129793 | p.V344M | 4 |
| chr20:48129705-48129705 | p.R373Q | 3 |
| chr20:48129637-48129637 | p.E396K | 2 |
| chr20:48140669-48140669 | p.L261L | 2 |
| chr20:48156225-48156225 | p.A185A | 2 |
| chr20:48129710-48129710 | p.D371D | 2 |
| chr20:48140727-48140727 | p.L241L | 2 |
| chr20:48130909-48130909 | p.F293L | 2 |
| chr20:48140776-48140776 | p.G225V | 2 |
| chr20:48127613-48127613 | p.G437E | 2 |
| Top |
|
 |
| Point Mutation/ Tissue ID | 1 | 2 | 3 | 4 | 5 | 6 | 7 | 8 | 9 | 10 | 11 | 12 | 13 | 14 | 15 | 16 | 17 | 18 | 19 | 20 |
| # sample | 2 | 3 | 8 | 1 | 3 | 1 | 5 | 2 | 2 | 12 | 5 | 4 | ||||||||
| # mutation | 2 | 3 | 8 | 1 | 3 | 1 | 5 | 2 | 2 | 13 | 5 | 7 | ||||||||
| nonsynonymous SNV | 1 | 2 | 6 | 1 | 3 | 5 | 1 | 2 | 10 | 4 | 6 | |||||||||
| synonymous SNV | 1 | 1 | 2 | 1 | 1 | 3 | 1 | 1 |
| cf) Tissue ID; Tissue type (1; BLCA[Bladder Urothelial Carcinoma], 2; BRCA[Breast invasive carcinoma], 3; CESC[Cervical squamous cell carcinoma and endocervical adenocarcinoma], 4; COAD[Colon adenocarcinoma], 5; GBM[Glioblastoma multiforme], 6; Glioma Low Grade, 7; HNSC[Head and Neck squamous cell carcinoma], 8; KICH[Kidney Chromophobe], 9; KIRC[Kidney renal clear cell carcinoma], 10; KIRP[Kidney renal papillary cell carcinoma], 11; LAML[Acute Myeloid Leukemia], 12; LUAD[Lung adenocarcinoma], 13; LUSC[Lung squamous cell carcinoma], 14; OV[Ovarian serous cystadenocarcinoma ], 15; PAAD[Pancreatic adenocarcinoma], 16; PRAD[Prostate adenocarcinoma], 17; SKCM[Skin Cutaneous Melanoma], 18:STAD[Stomach adenocarcinoma], 19:THCA[Thyroid carcinoma], 20:UCEC[Uterine Corpus Endometrial Carcinoma]) |
| Top |
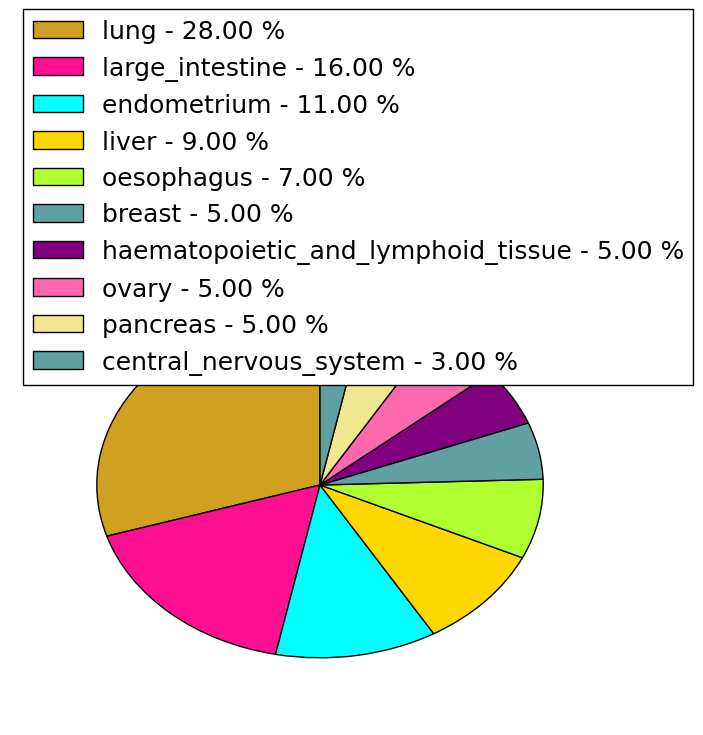
| * We represented just top 10 SNVs. When you move the cursor on each content, you can see more deailed mutation information on the Tooltip. Those are primary_site, primary_histology, mutation(aa), pubmedID. |
| Genomic Position | Mutation(aa) | Unique sampleID count |
| chr20:48129705 | p.R373Q | 3 |
| chr20:48140776 | p.G225V | 2 |
| chr20:48156158 | p.R208C | 2 |
| chr20:48129765 | p.V492M | 1 |
| chr20:48166673 | p.D336N | 1 |
| chr20:48130909 | p.R208H | 1 |
| chr20:48124559 | p.E489D | 1 |
| chr20:48156225 | p.L335P | 1 |
| chr20:48130782 | p.M486T | 1 |
| chr20:48130929 | p.S325S | 1 |
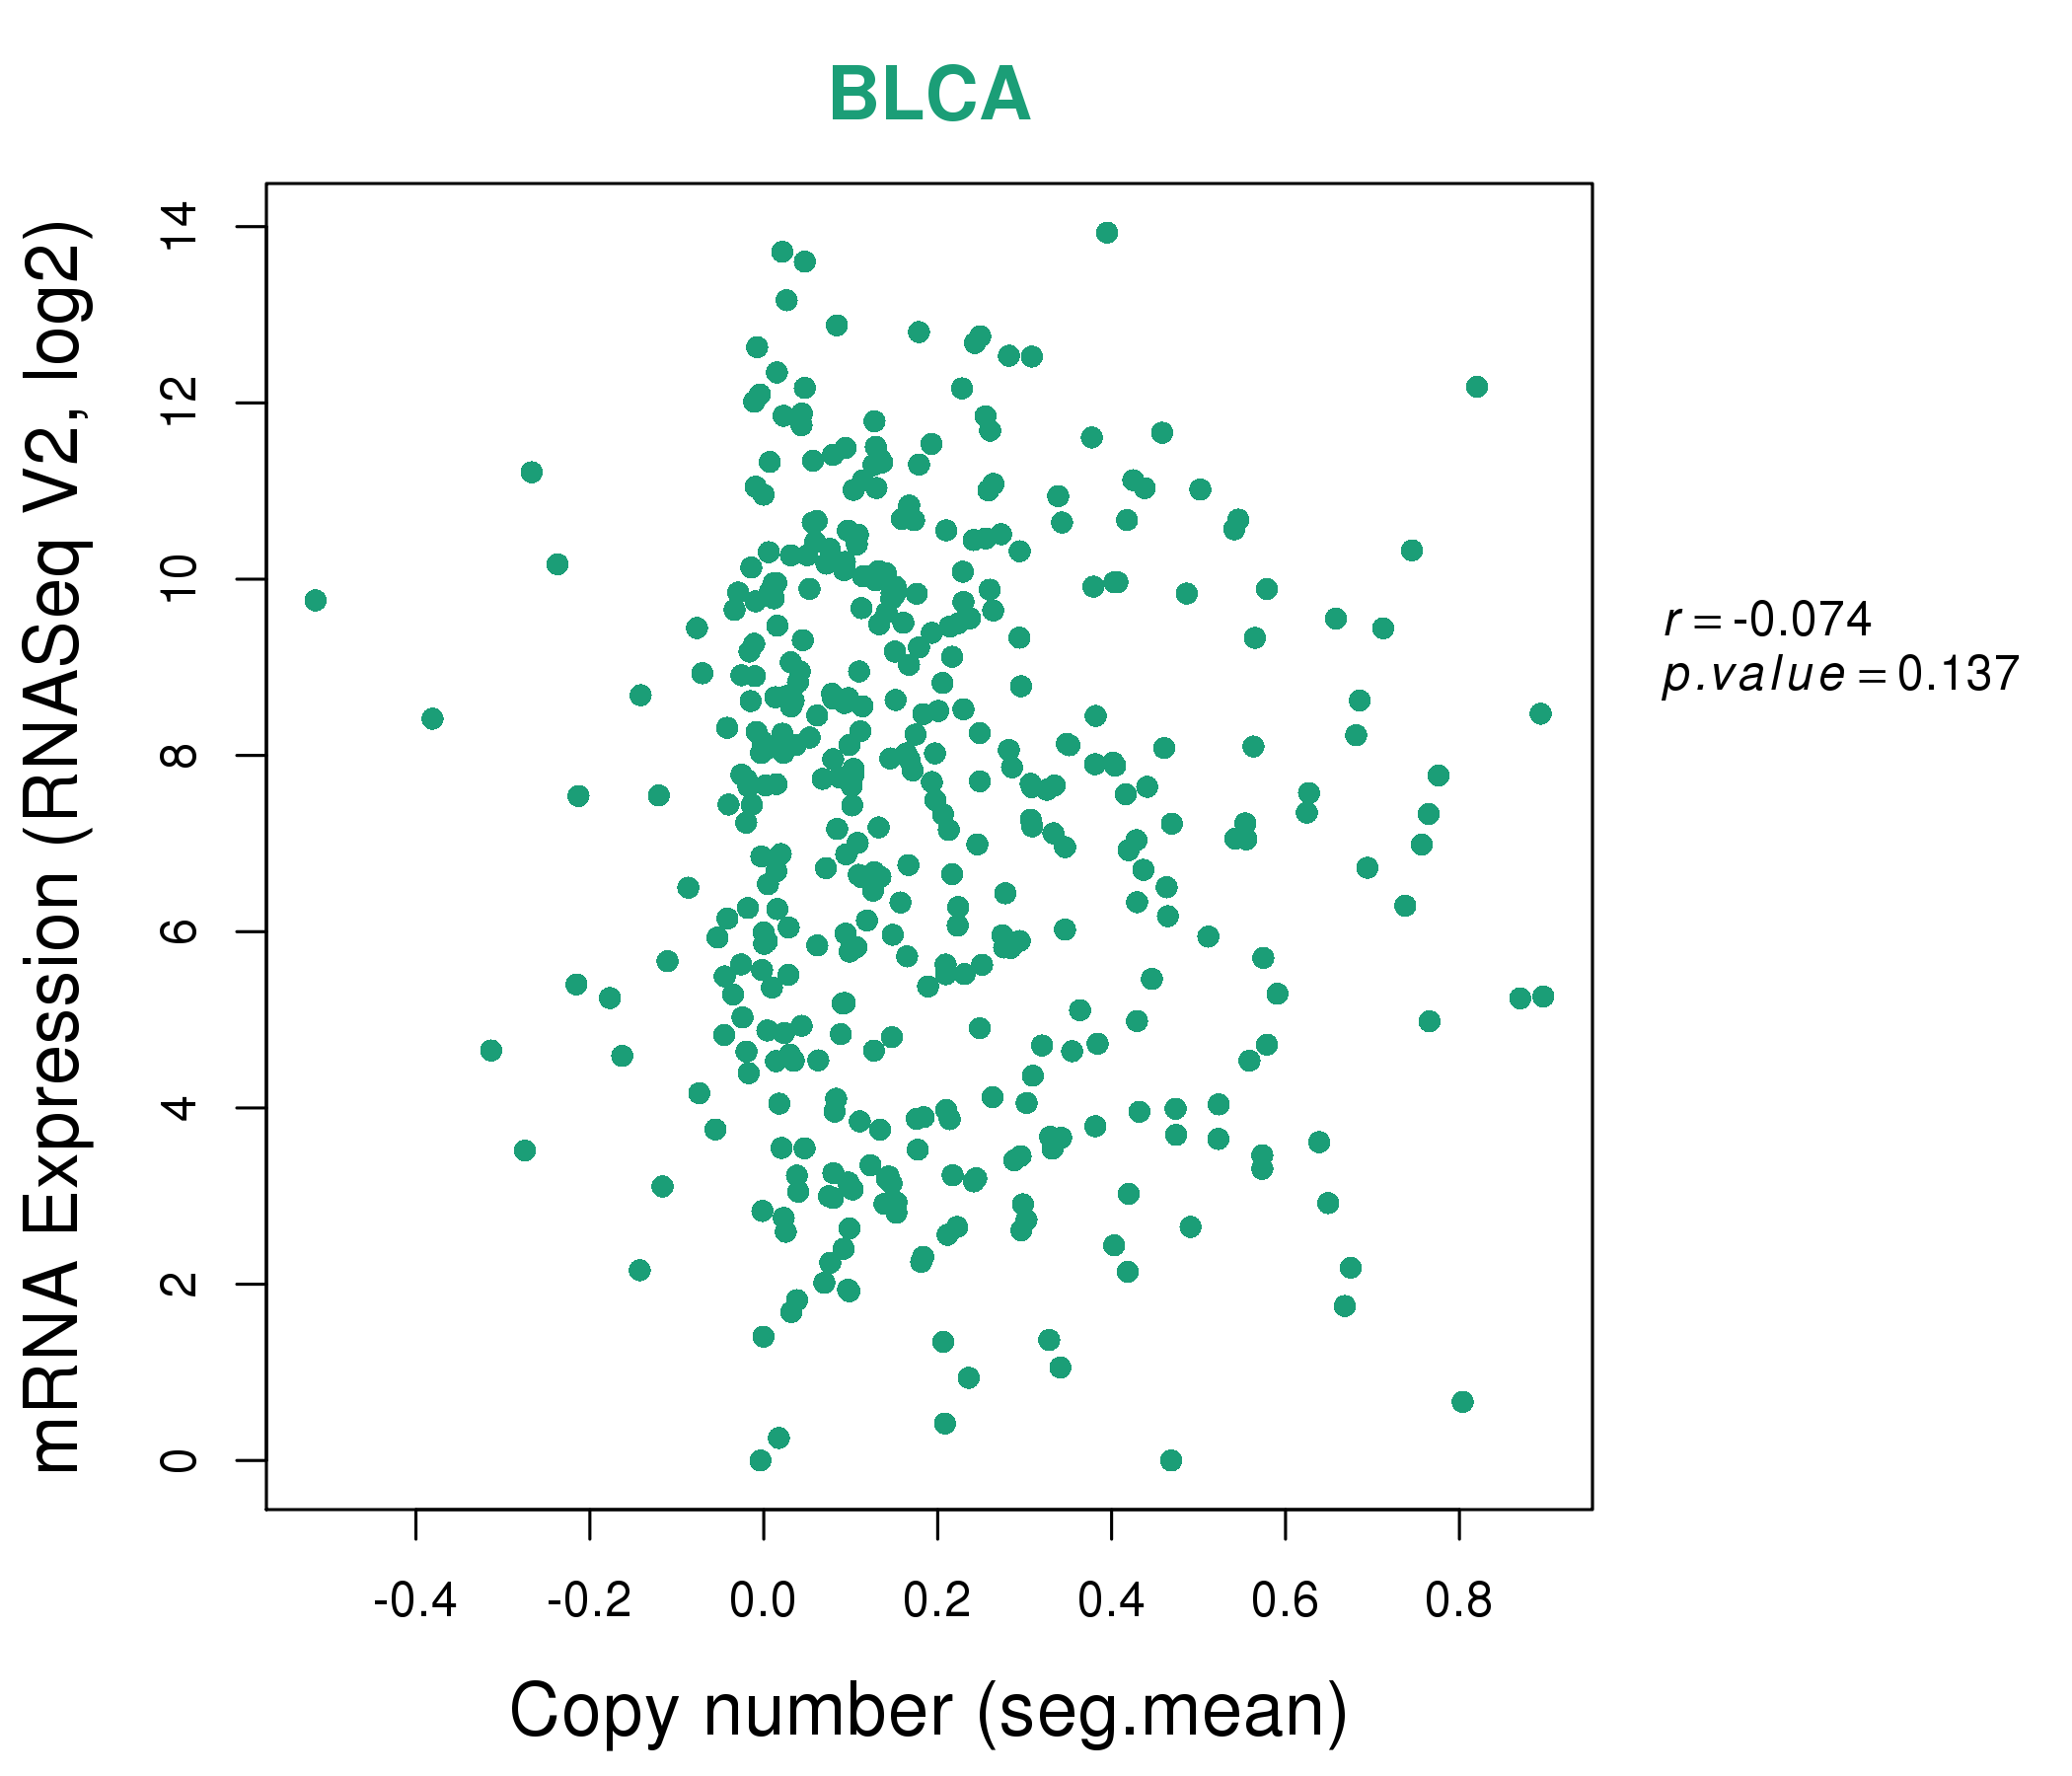
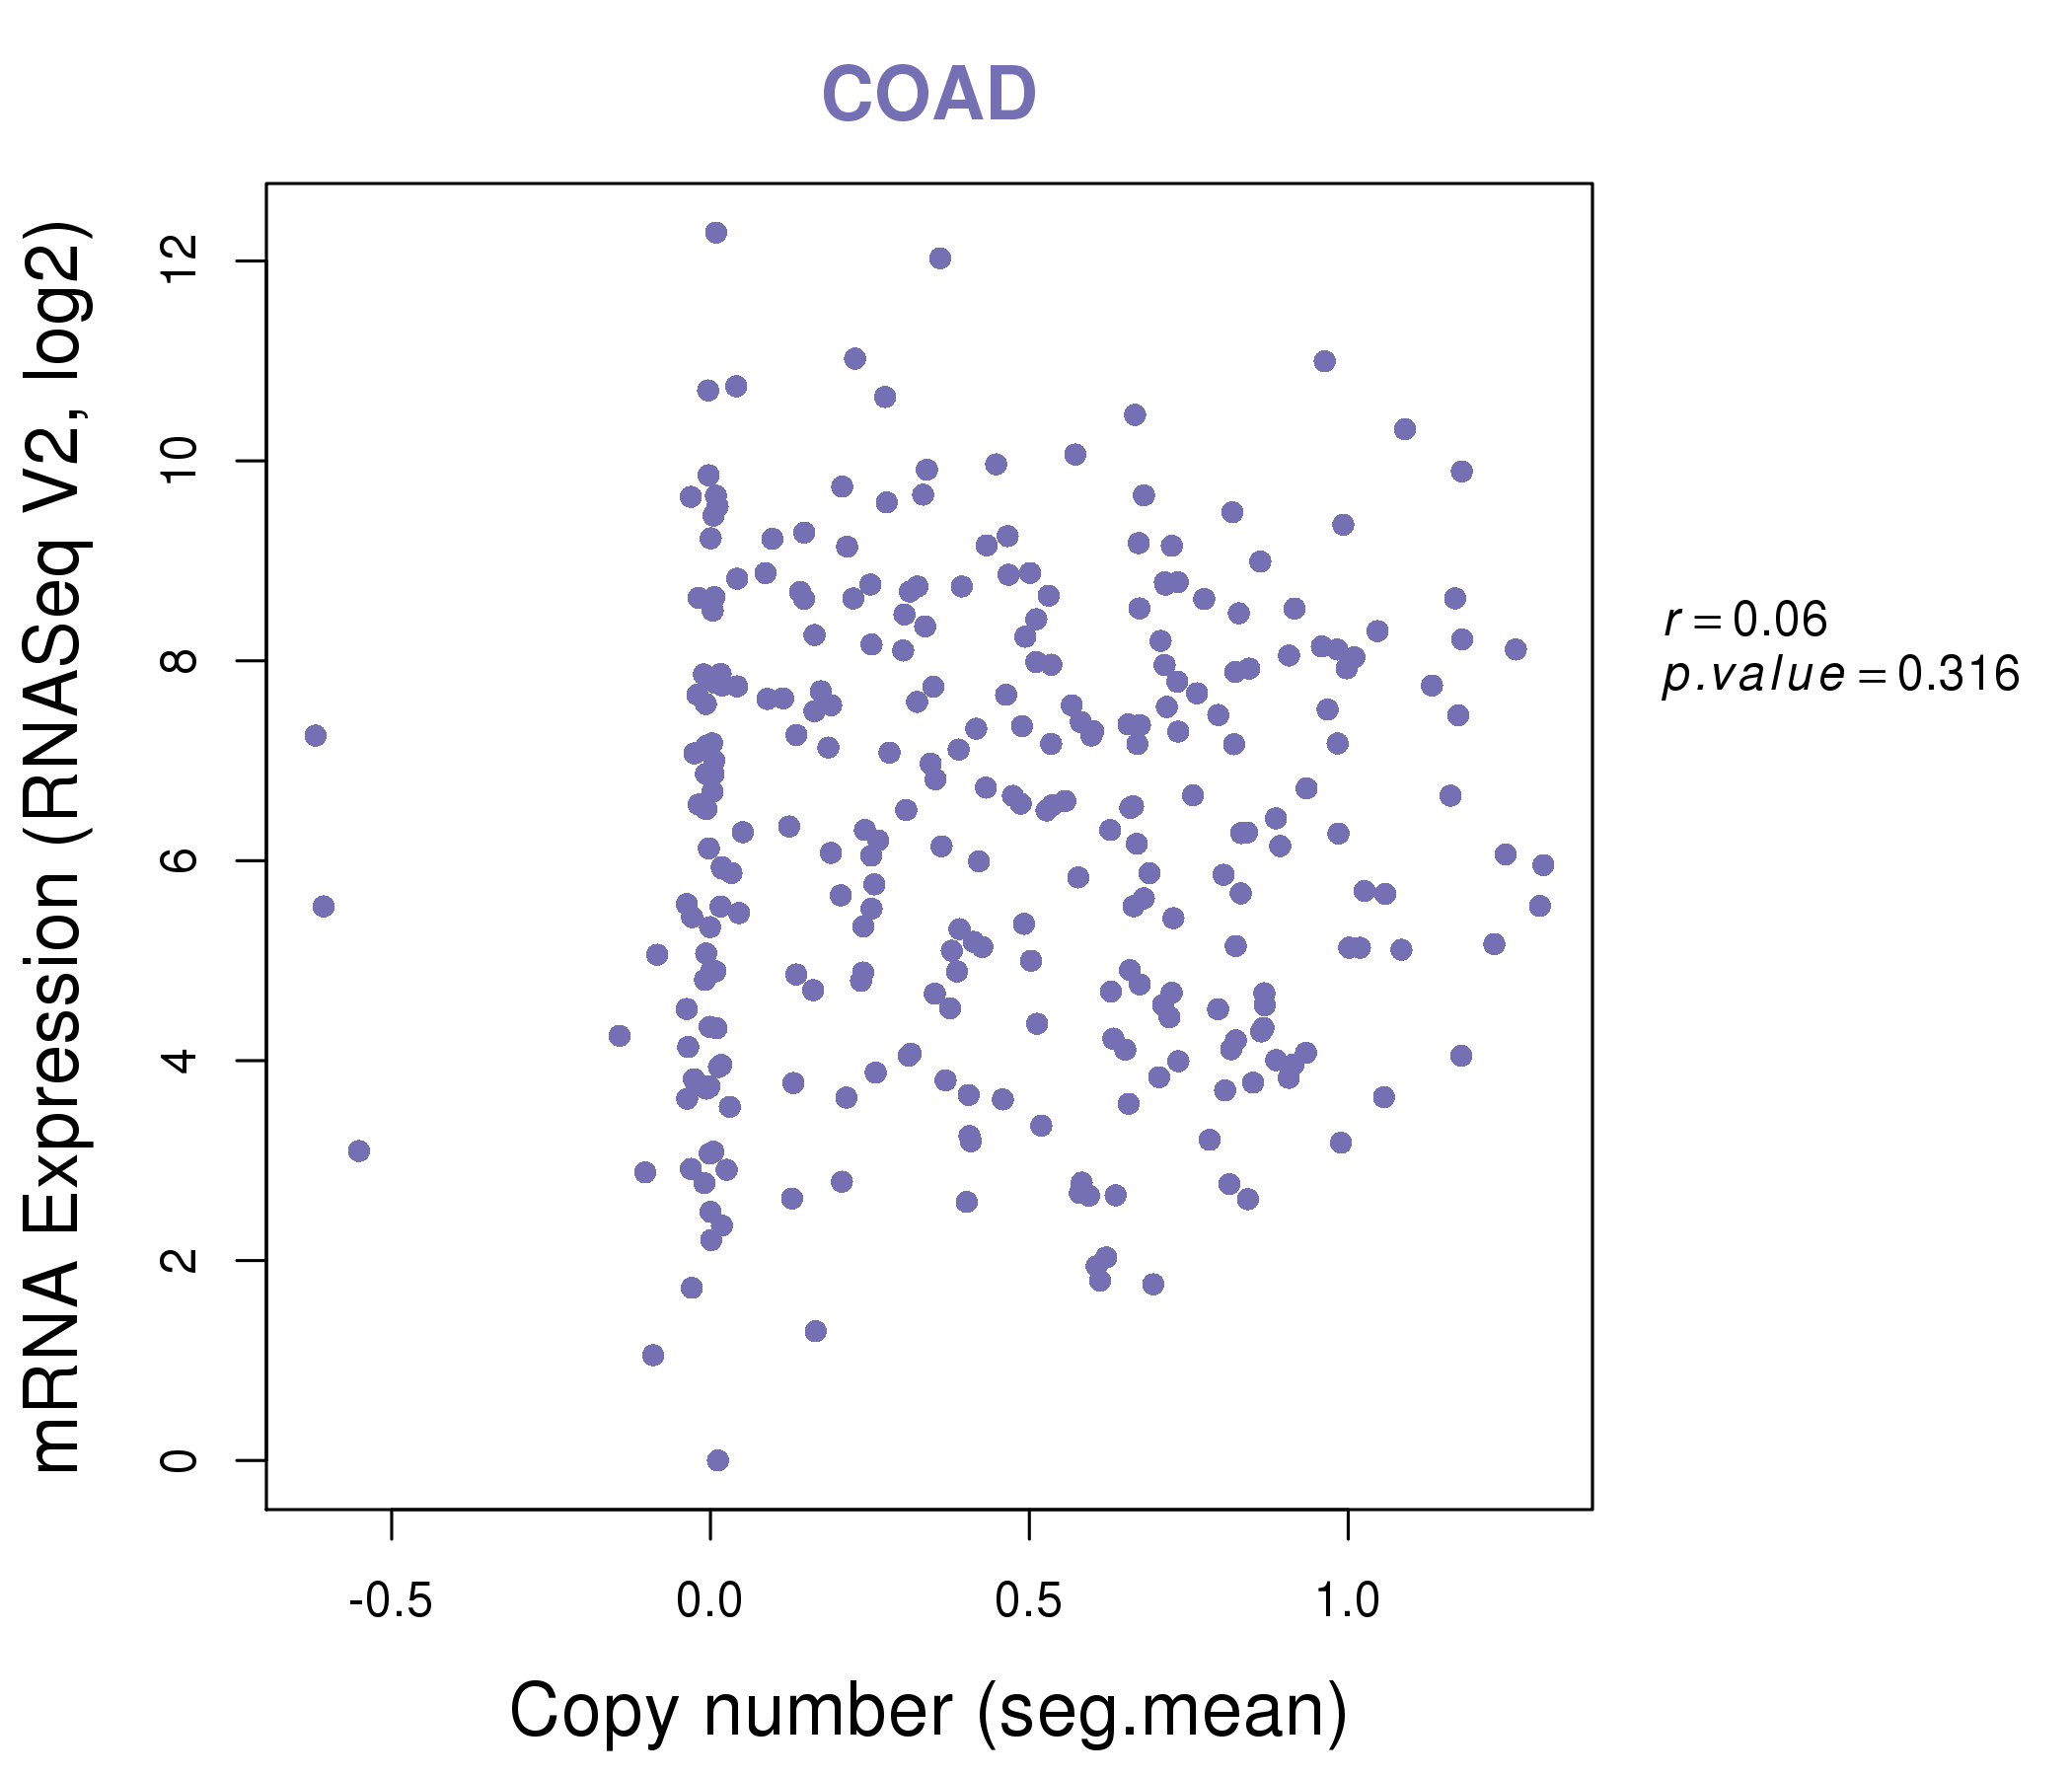
| * Copy number data were extracted from TCGA using R package TCGA-Assembler. The URLs of all public data files on TCGA DCC data server were gathered on Jan-05-2015. Function ProcessCNAData in TCGA-Assembler package was used to obtain gene-level copy number value which is calculated as the average copy number of the genomic region of a gene. |
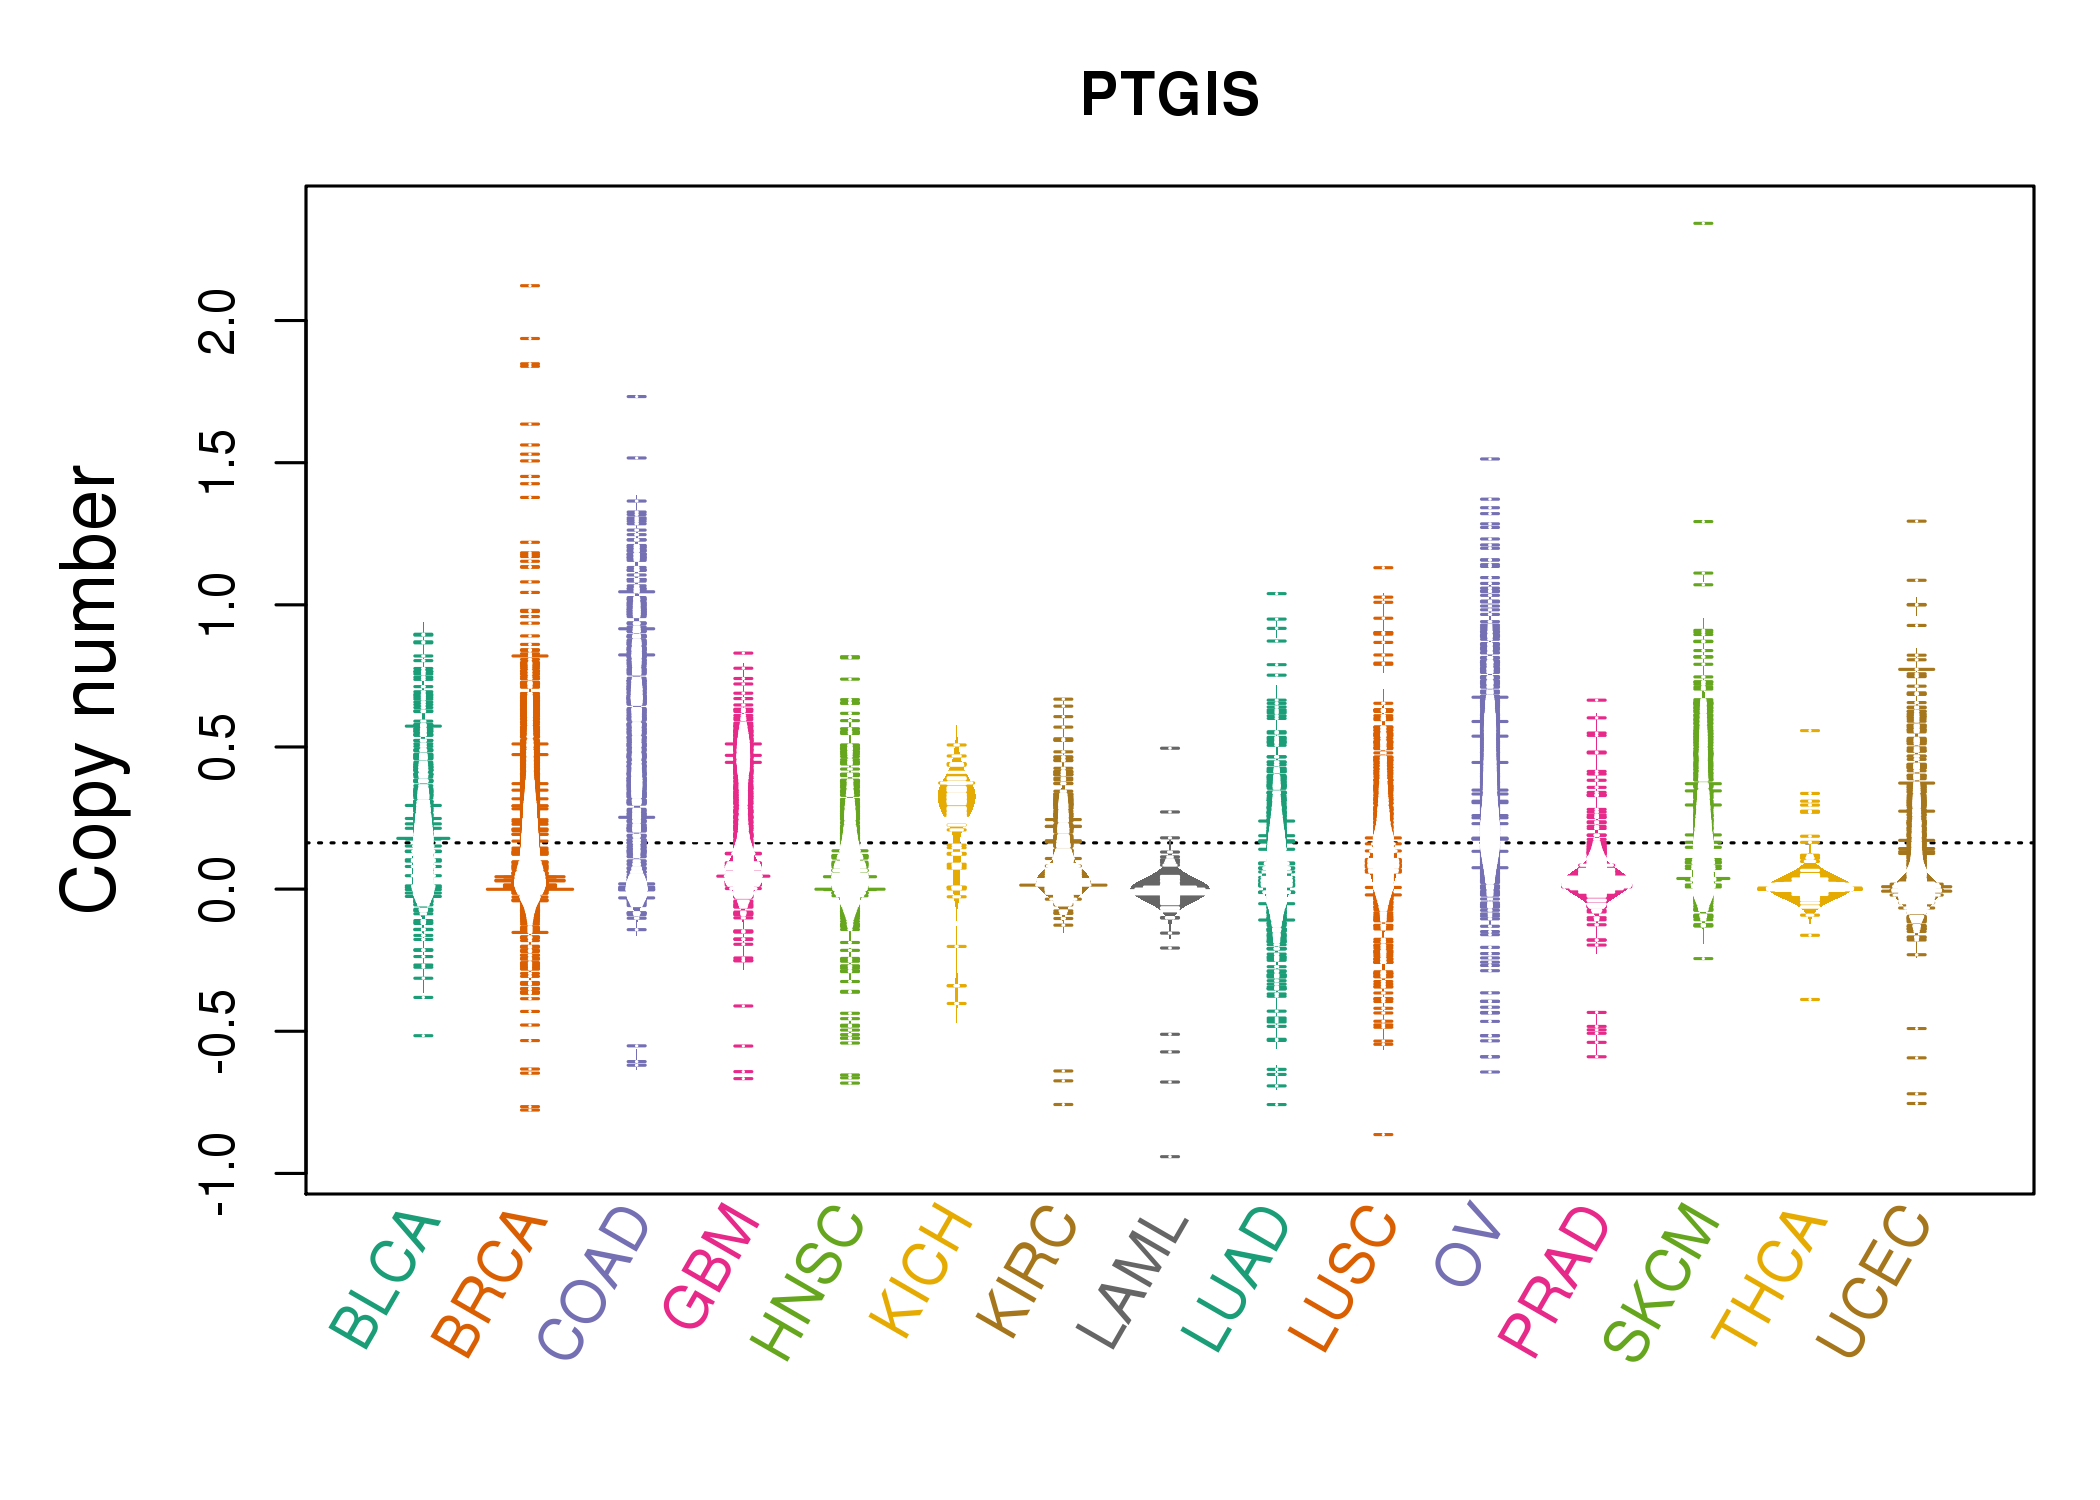 |
| cf) Tissue ID[Tissue type]: BLCA[Bladder Urothelial Carcinoma], BRCA[Breast invasive carcinoma], CESC[Cervical squamous cell carcinoma and endocervical adenocarcinoma], COAD[Colon adenocarcinoma], GBM[Glioblastoma multiforme], Glioma Low Grade, HNSC[Head and Neck squamous cell carcinoma], KICH[Kidney Chromophobe], KIRC[Kidney renal clear cell carcinoma], KIRP[Kidney renal papillary cell carcinoma], LAML[Acute Myeloid Leukemia], LUAD[Lung adenocarcinoma], LUSC[Lung squamous cell carcinoma], OV[Ovarian serous cystadenocarcinoma ], PAAD[Pancreatic adenocarcinoma], PRAD[Prostate adenocarcinoma], SKCM[Skin Cutaneous Melanoma], STAD[Stomach adenocarcinoma], THCA[Thyroid carcinoma], UCEC[Uterine Corpus Endometrial Carcinoma] |
| Top |
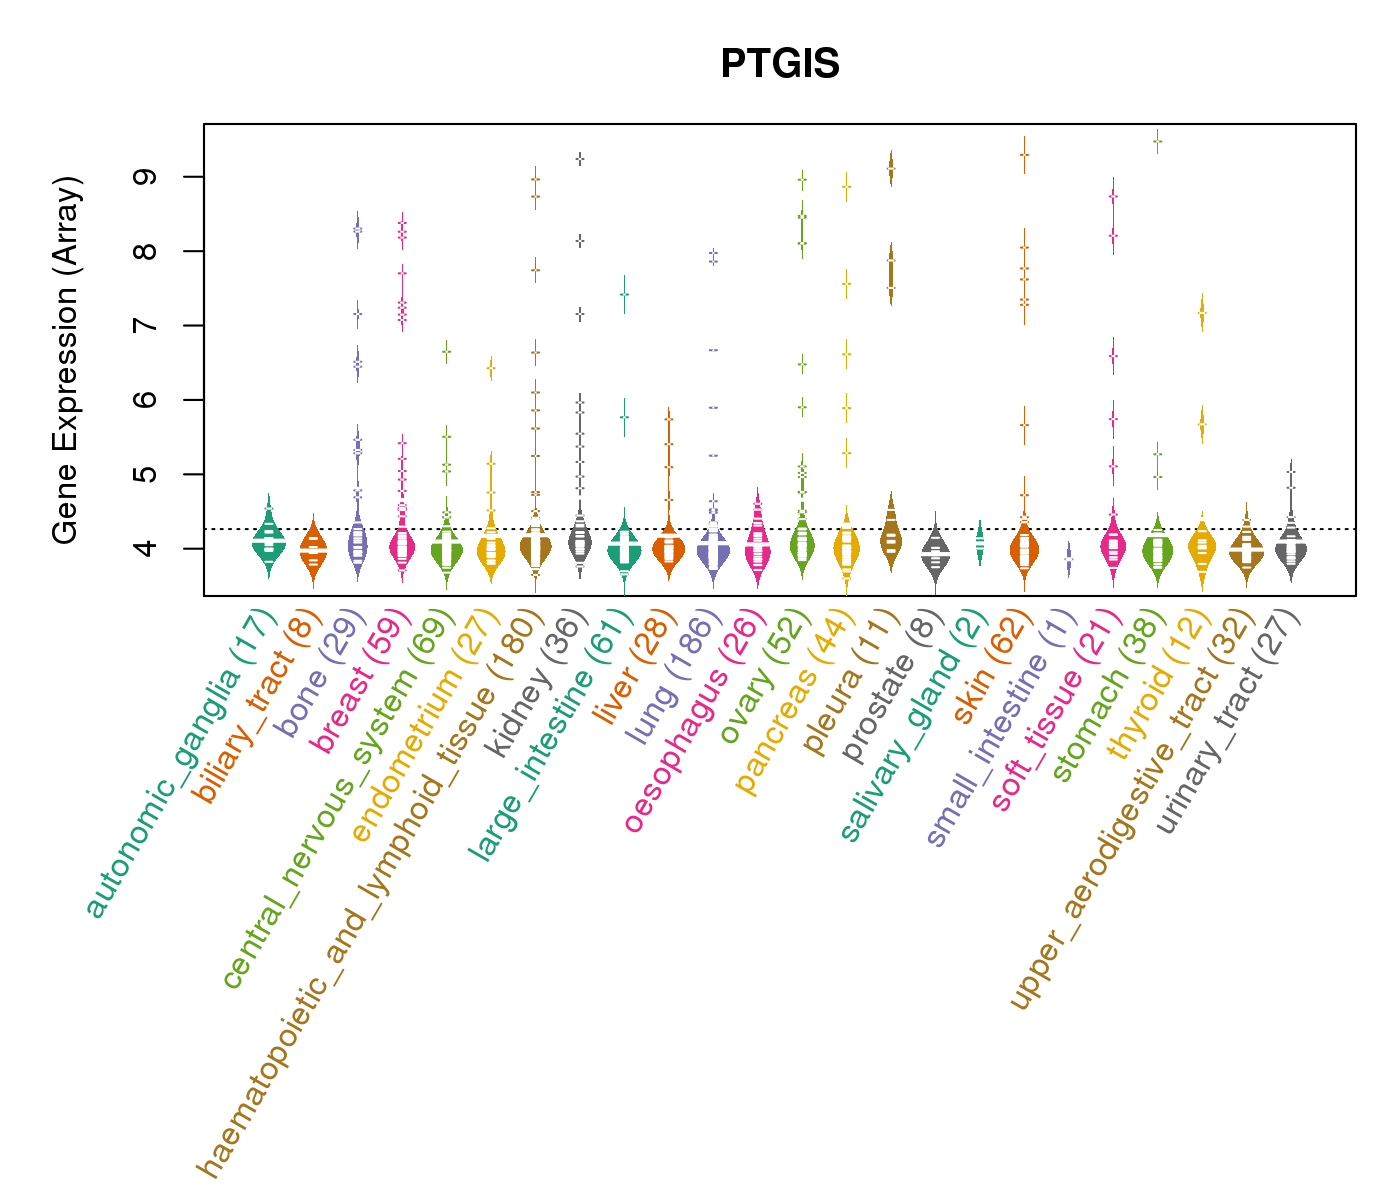
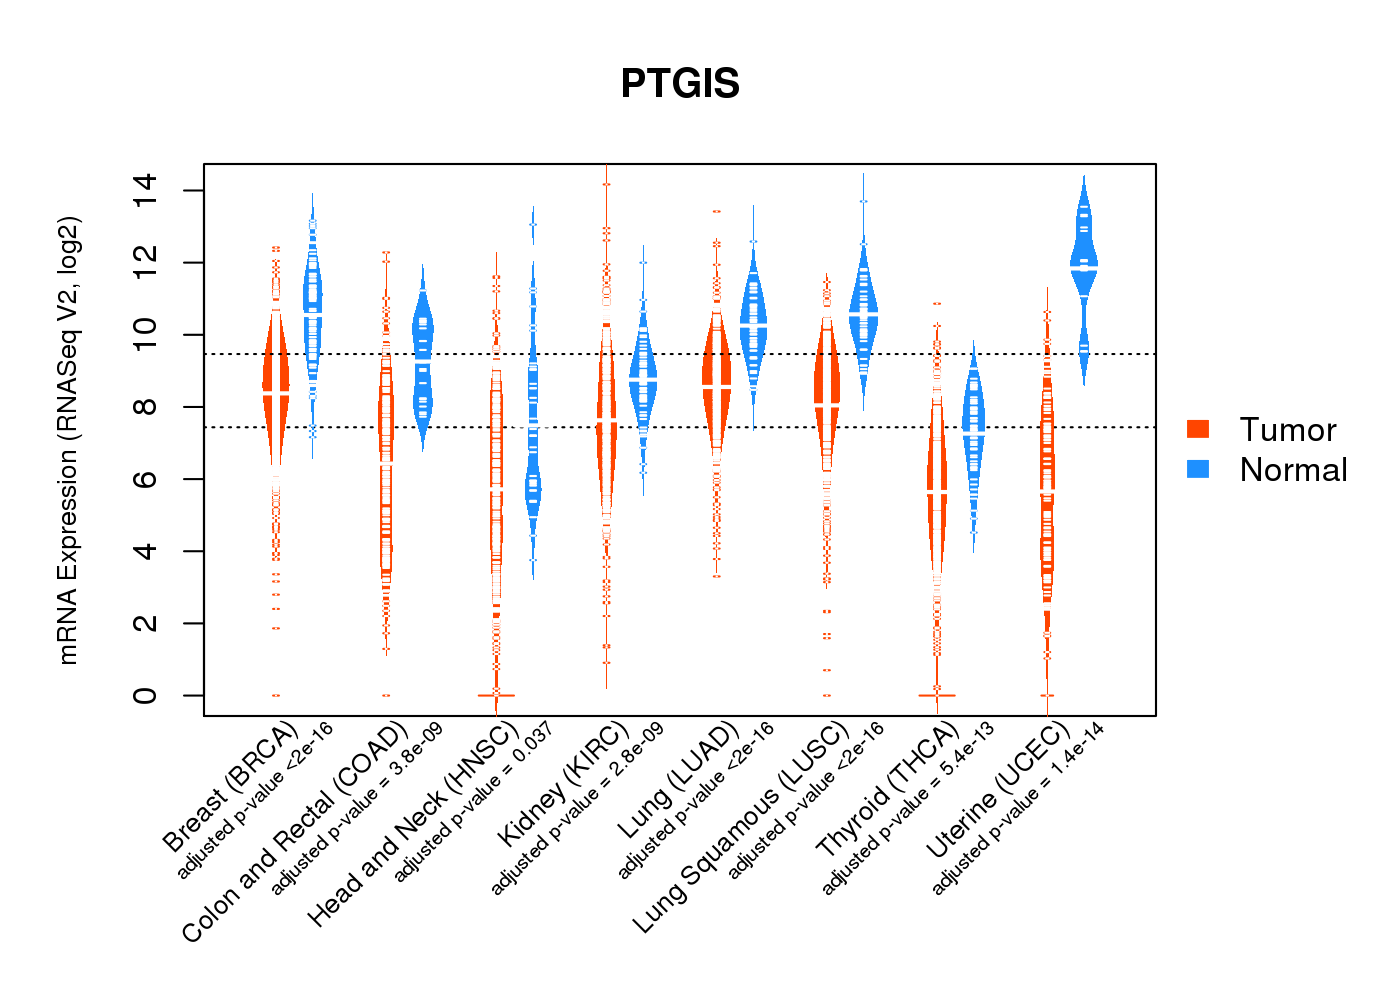
| Gene Expression for PTGIS |
| * CCLE gene expression data were extracted from CCLE_Expression_Entrez_2012-10-18.res: Gene-centric RMA-normalized mRNA expression data. |
 |
| * Normalized gene expression data of RNASeqV2 was extracted from TCGA using R package TCGA-Assembler. The URLs of all public data files on TCGA DCC data server were gathered at Jan-05-2015. Only eight cancer types have enough normal control samples for differential expression analysis. (t test, adjusted p<0.05 (using Benjamini-Hochberg FDR)) |
 |
| Top |
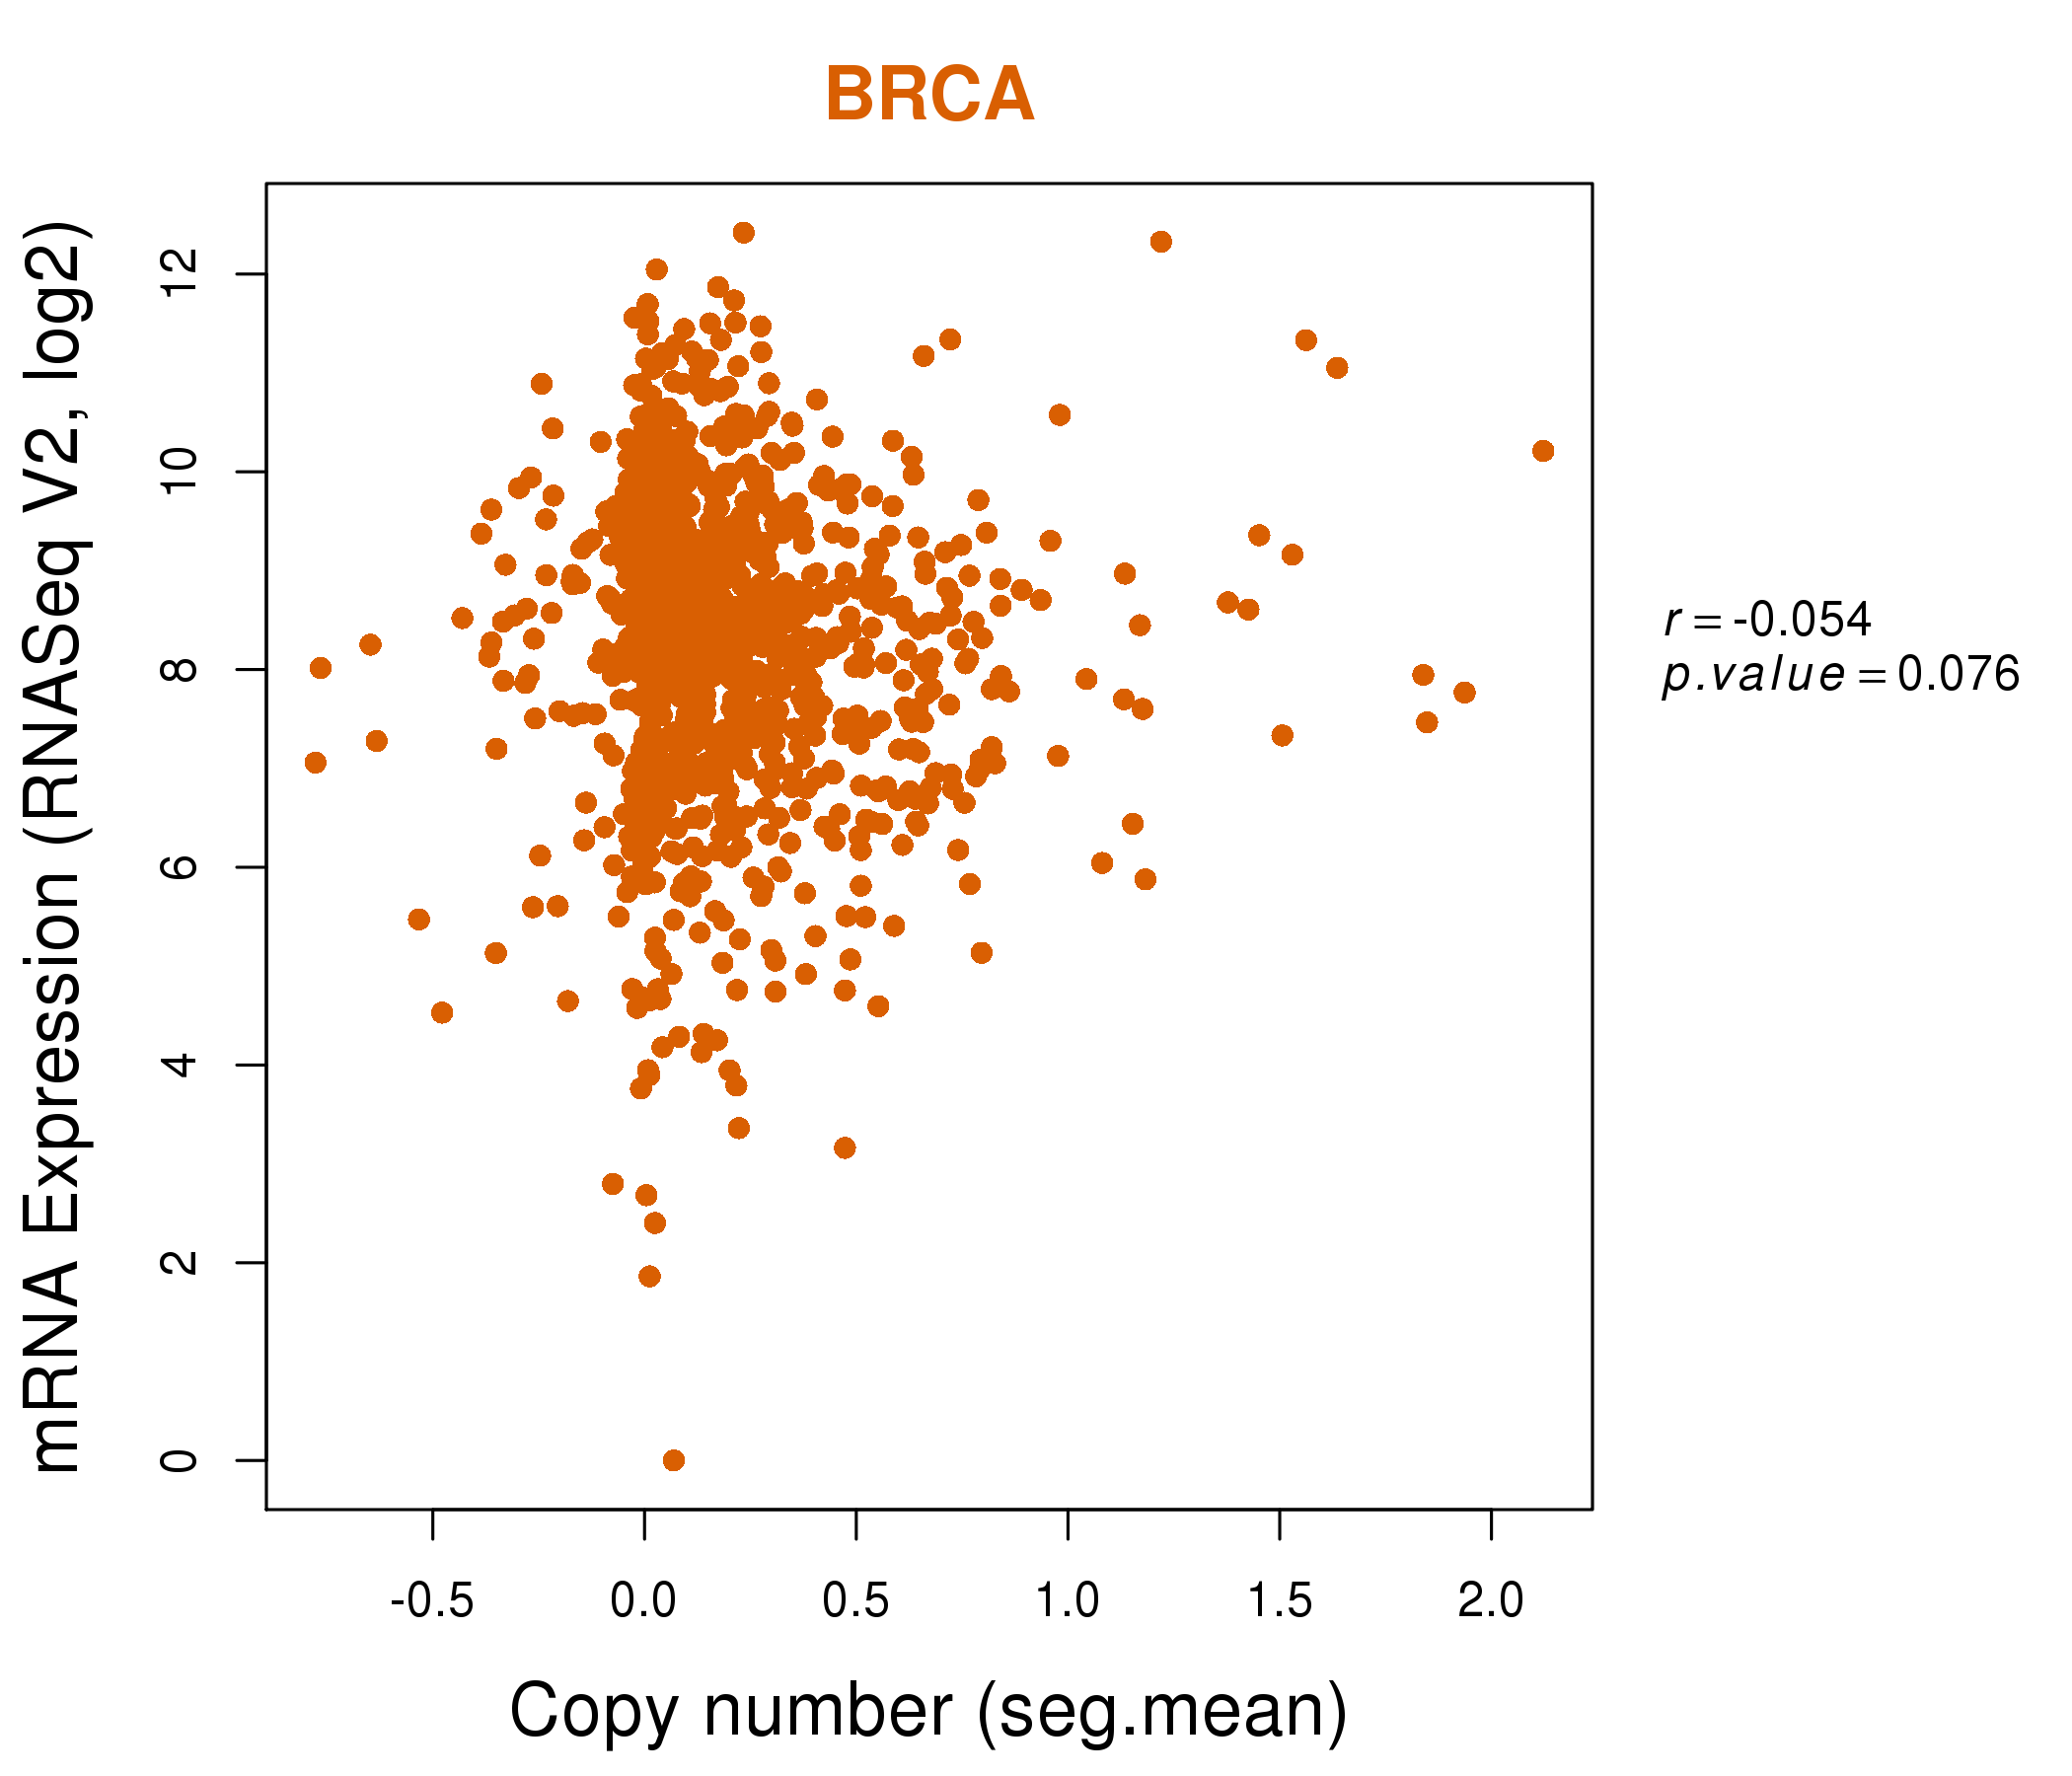
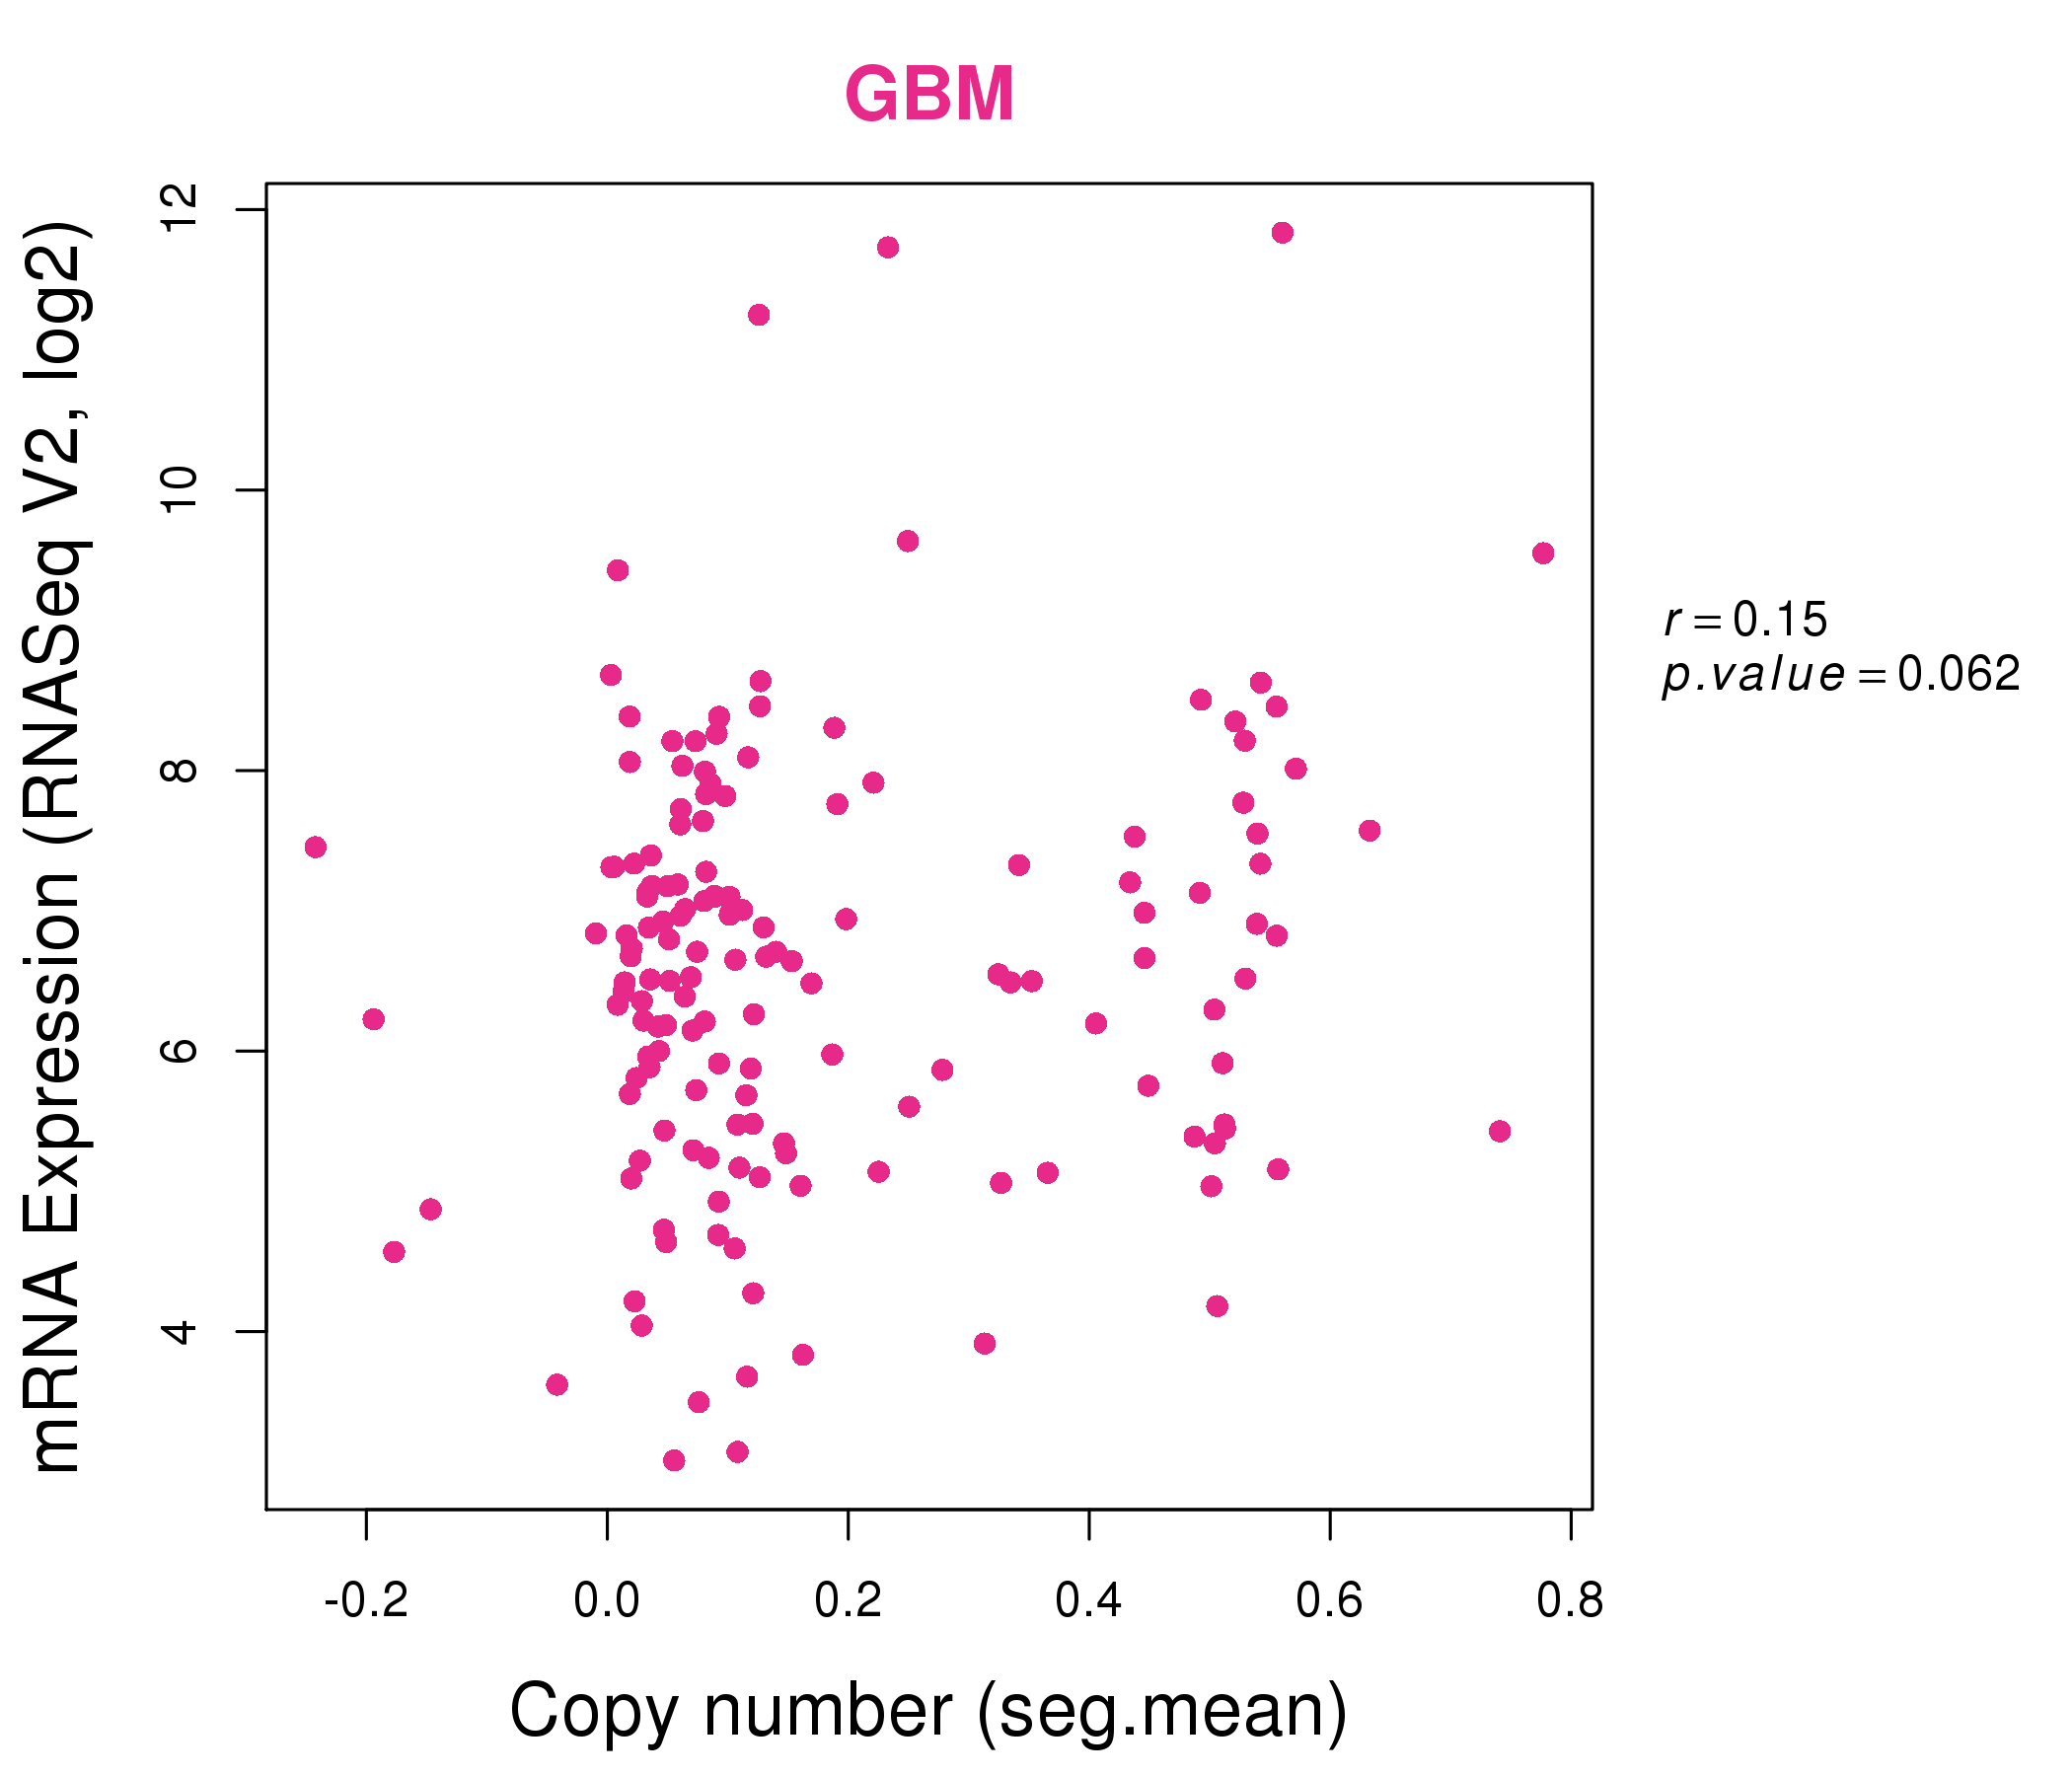
| * This plots show the correlation between CNV and gene expression. |
: Open all plots for all cancer types
 |
|
 |
|
| Top |
| Gene-Gene Network Information |
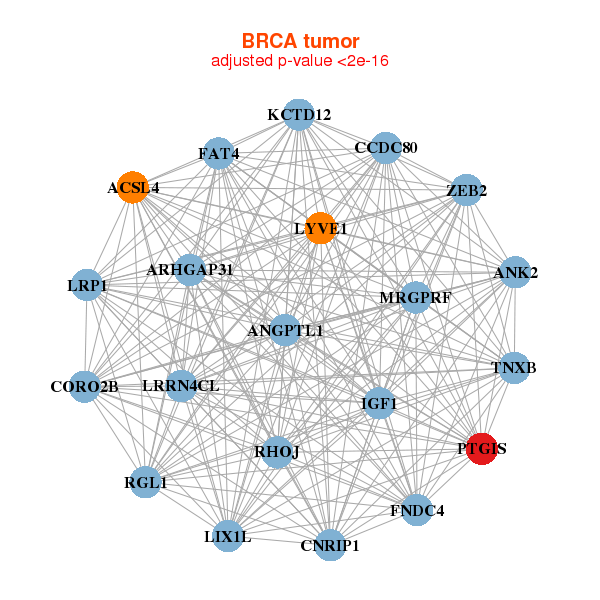
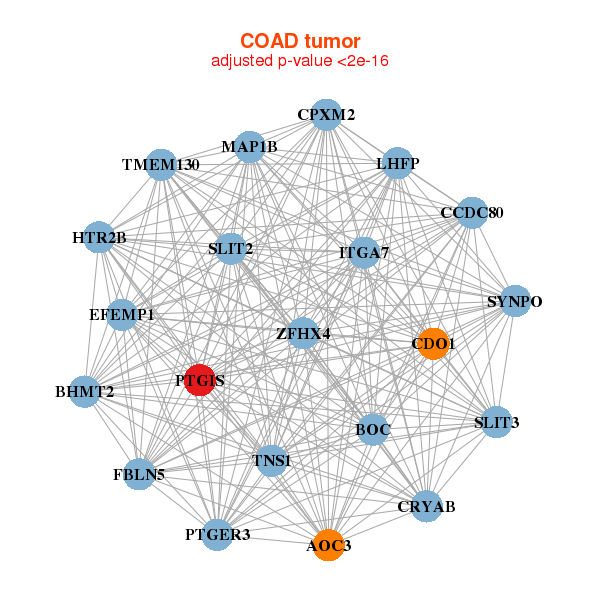
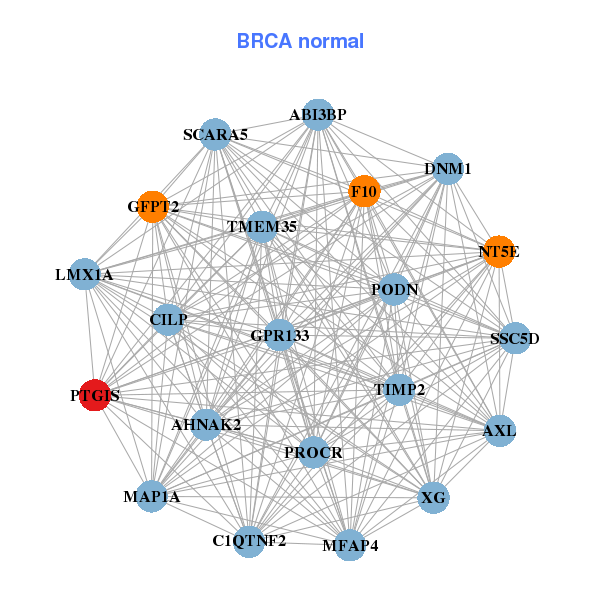
| * Co-Expression network figures were drawn using R package igraph. Only the top 20 genes with the highest correlations were shown. Red circle: input gene, orange circle: cell metabolism gene, sky circle: other gene |
: Open all plots for all cancer types
 |
| ||||
| ACSL4,ANGPTL1,ANK2,ARHGAP31,CCDC80,CNRIP1,CORO2B, FAT4,FNDC4,IGF1,KCTD12,LIX1L,LRP1,LRRN4CL, LYVE1,MRGPRF,PTGIS,RGL1,RHOJ,TNXB,ZEB2 | ABI3BP,AHNAK2,AXL,C1QTNF2,CILP,DNM1,F10, GFPT2,GPR133,LMX1A,MAP1A,MFAP4,NT5E,PODN, PROCR,PTGIS,SCARA5,SSC5D,TIMP2,TMEM35,XG | ||||
 |
| ||||
| AOC3,BHMT2,BOC,CCDC80,CDO1,CPXM2,CRYAB, EFEMP1,FBLN5,HTR2B,ITGA7,LHFP,MAP1B,PTGER3, PTGIS,SLIT2,SLIT3,SYNPO,TMEM130,TNS1,ZFHX4 | A4GALT,ABCA3,ANK2,BOC,CHST3,COL8A1,DBN1, EBF3,FBN1,FGFR1,FSTL1,GPR133,HSPA12A,MAP1B, NAP1L3,NLGN2,PALM,PTGIS,SYT11,TMTC1,ZBTB47 |

| * Co-Expression network figures were drawn using R package igraph. Only the top 20 genes with the highest correlations were shown. Red circle: input gene, orange circle: cell metabolism gene, sky circle: other gene |
: Open all plots for all cancer types
| Top |
: Open all interacting genes' information including KEGG pathway for all interacting genes from DAVID
| Top |
| Pharmacological Information for PTGIS |
| DB Category | DB Name | DB's ID and Url link |
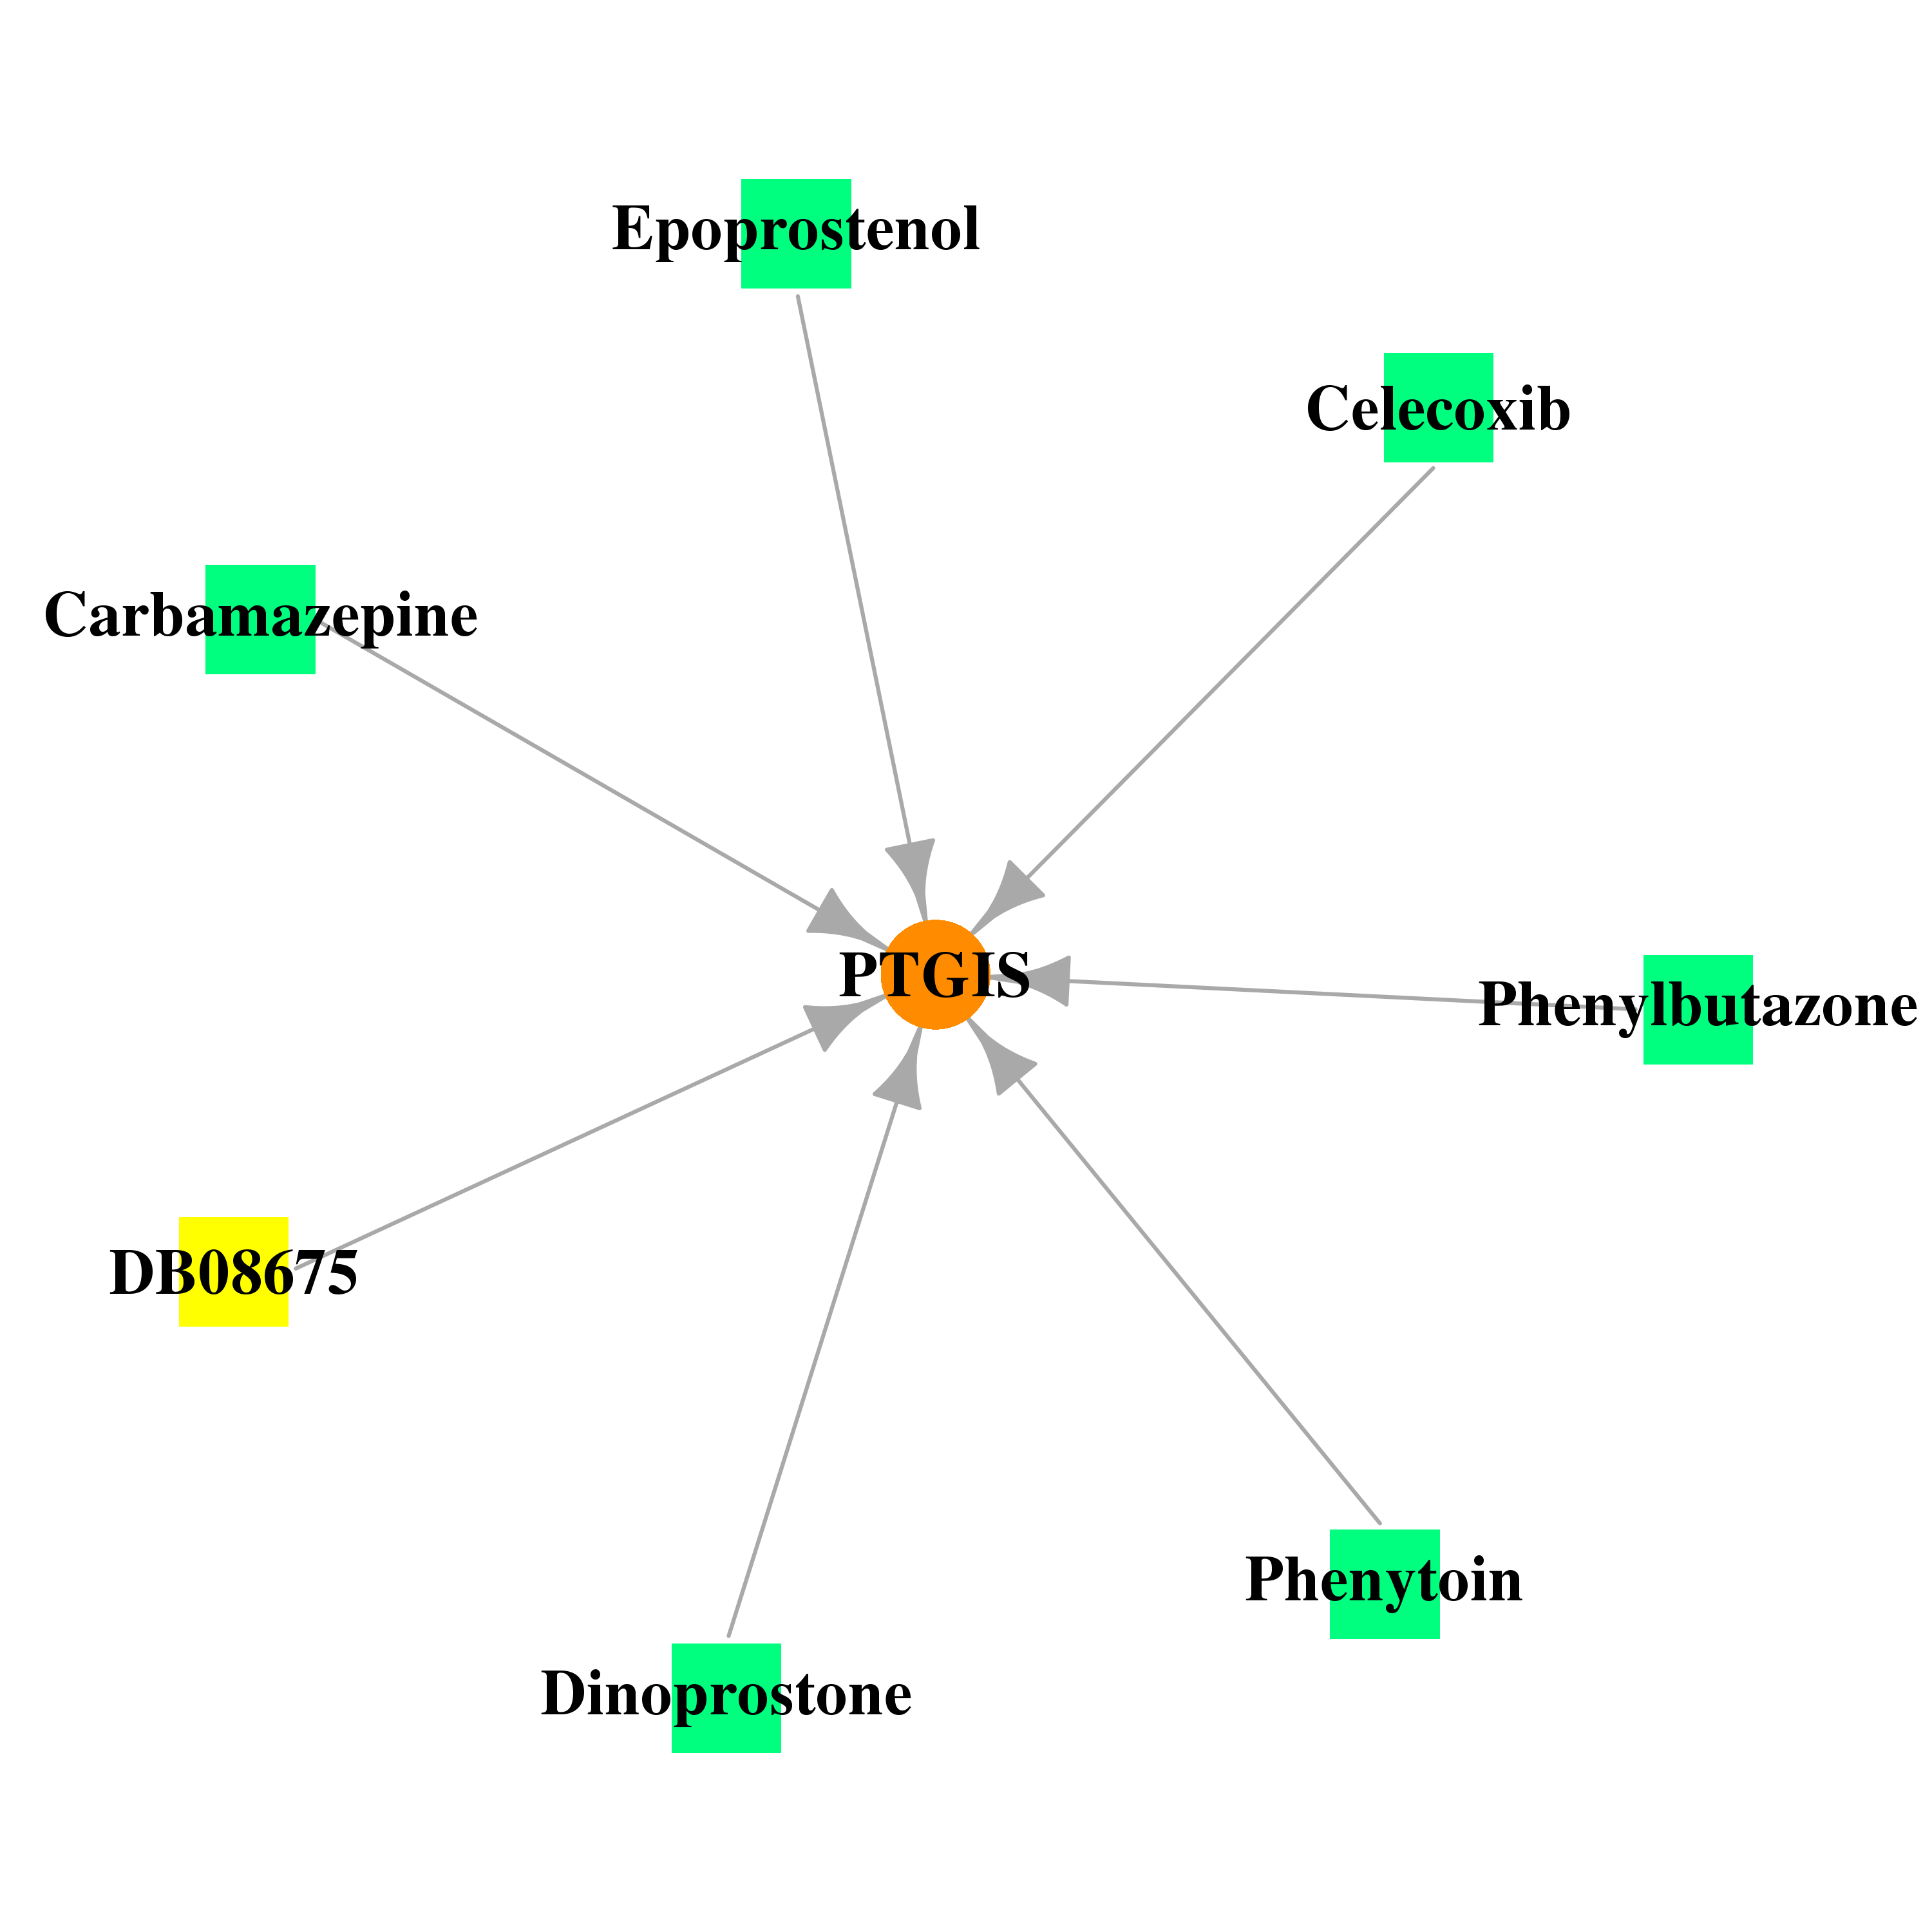
| * Gene Centered Interaction Network. |
 |
| * Drug Centered Interaction Network. |
| DrugBank ID | Target Name | Drug Groups | Generic Name | Drug Centered Network | Drug Structure |
| DB00812 | prostaglandin I2 (prostacyclin) synthase | approved | Phenylbutazone | 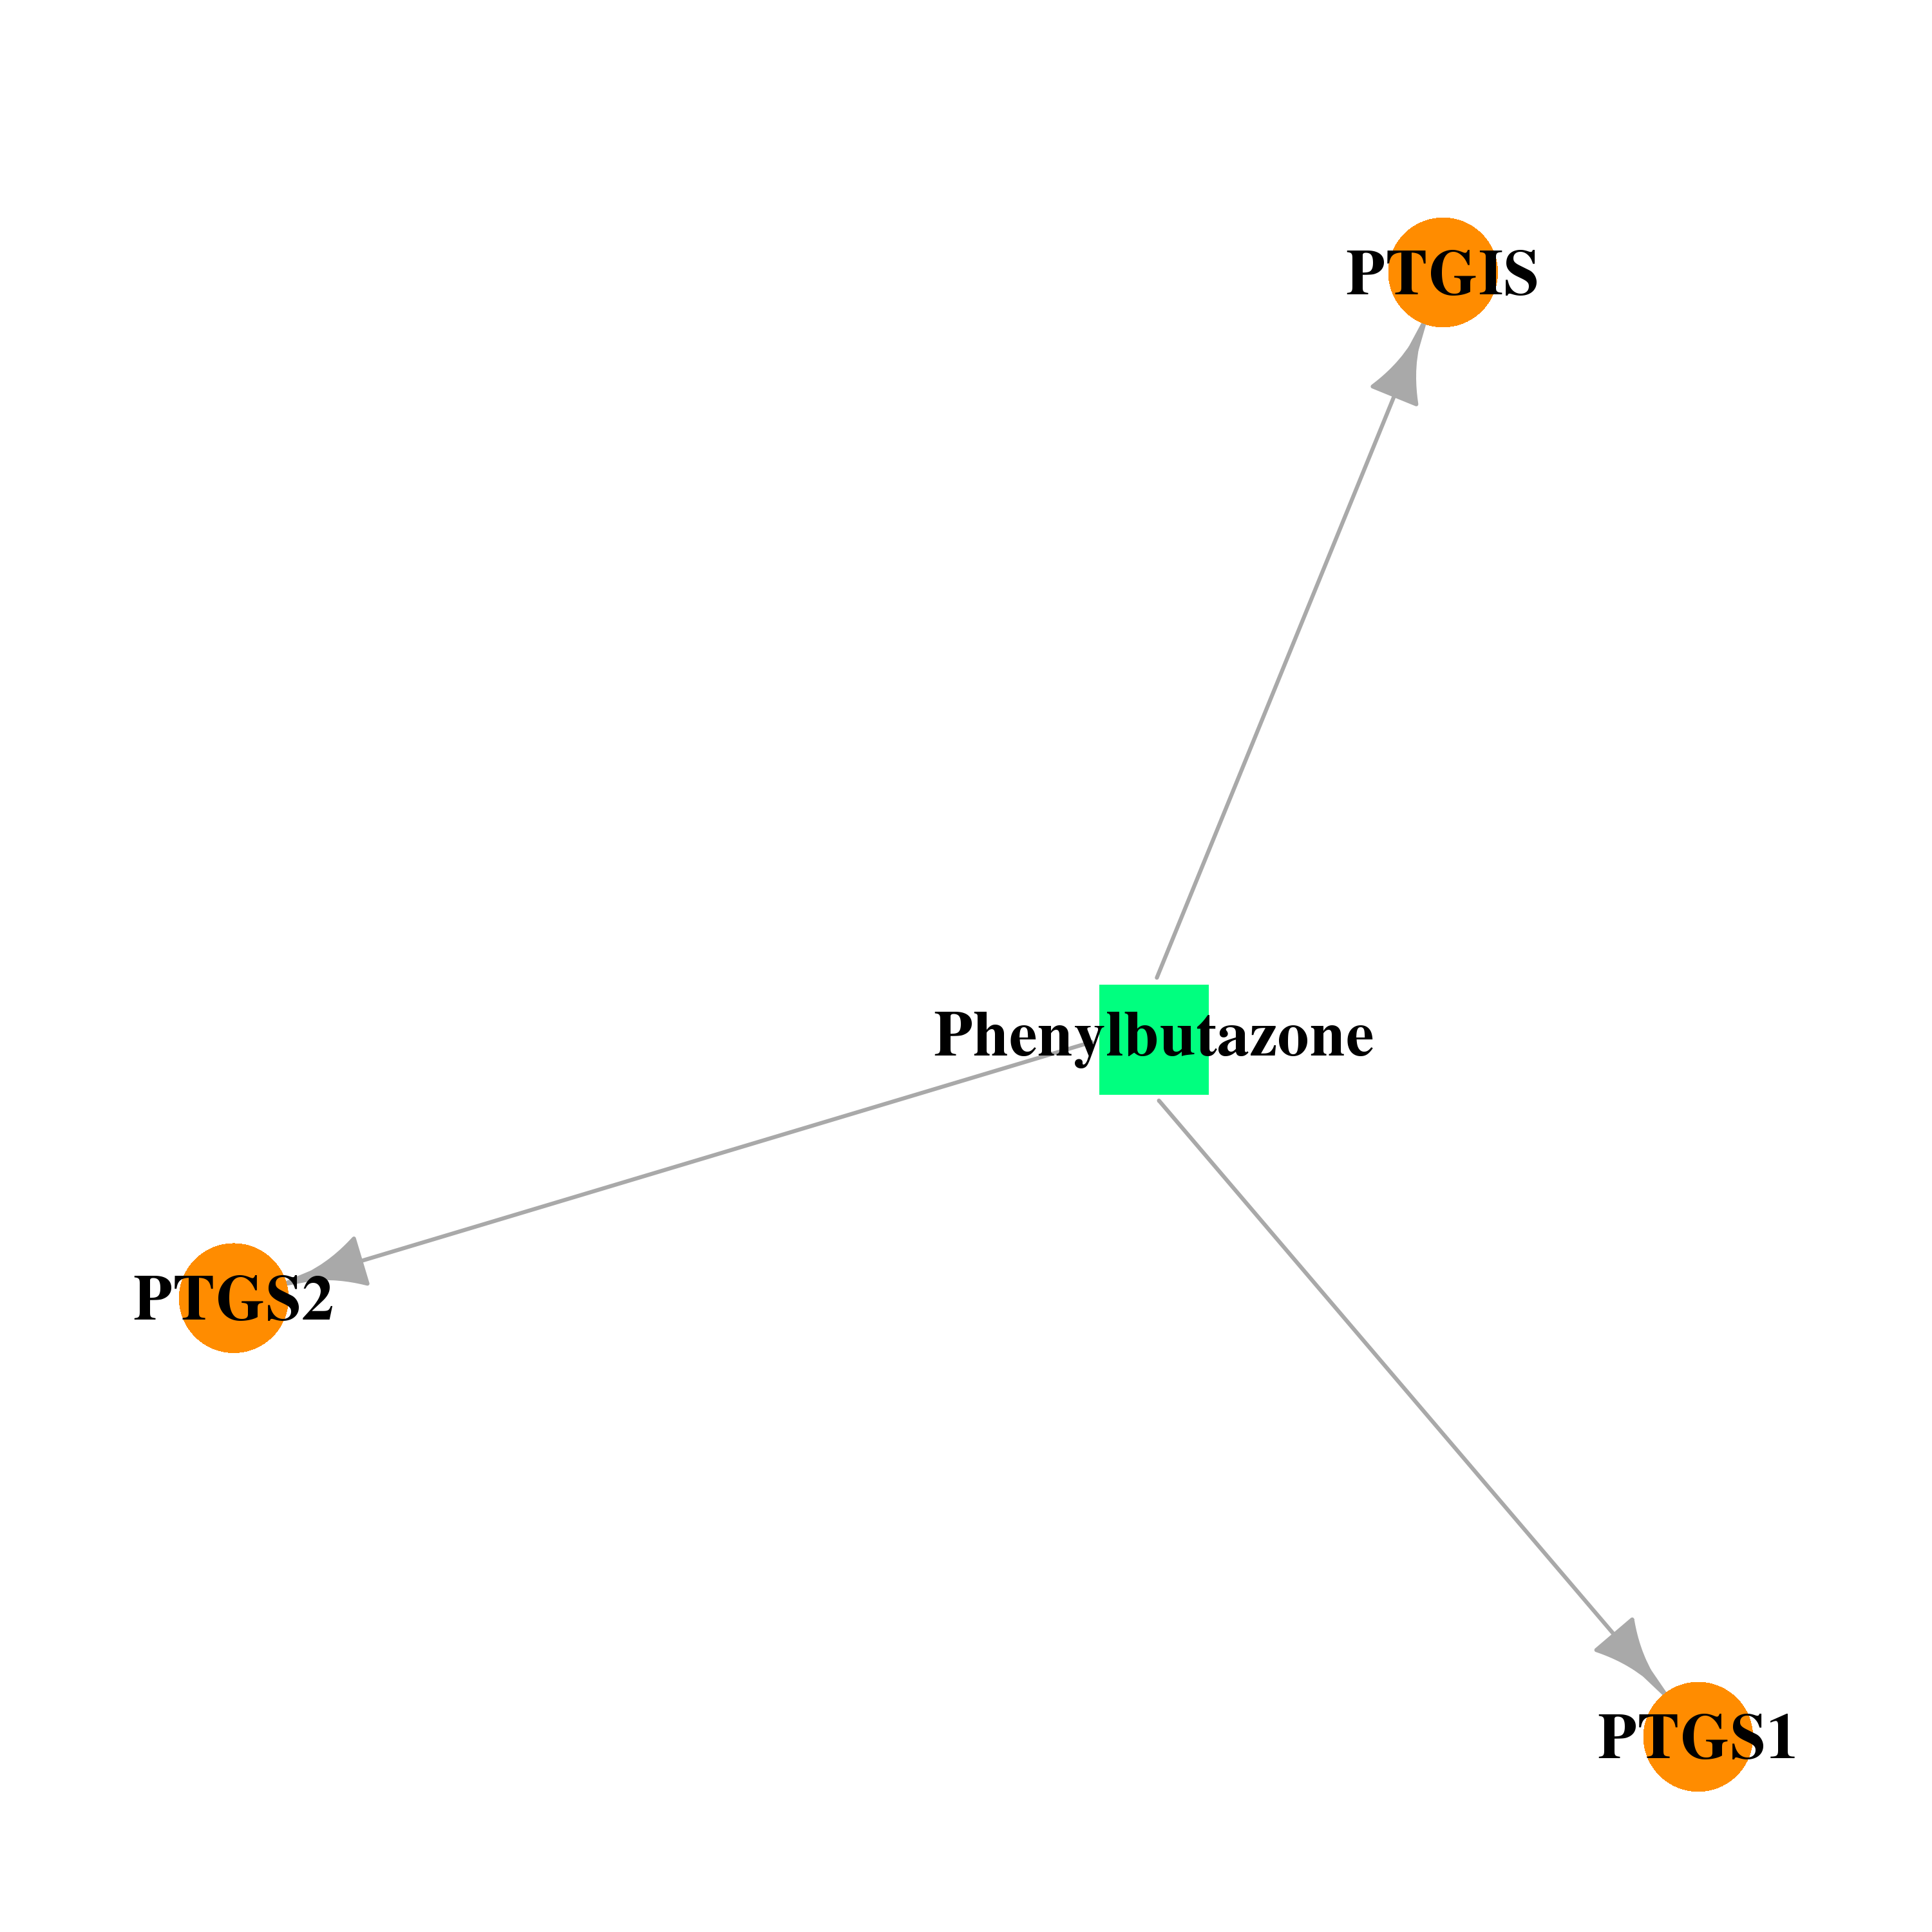 | 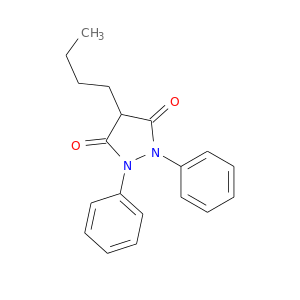 |
| DB01240 | prostaglandin I2 (prostacyclin) synthase | approved | Epoprostenol | 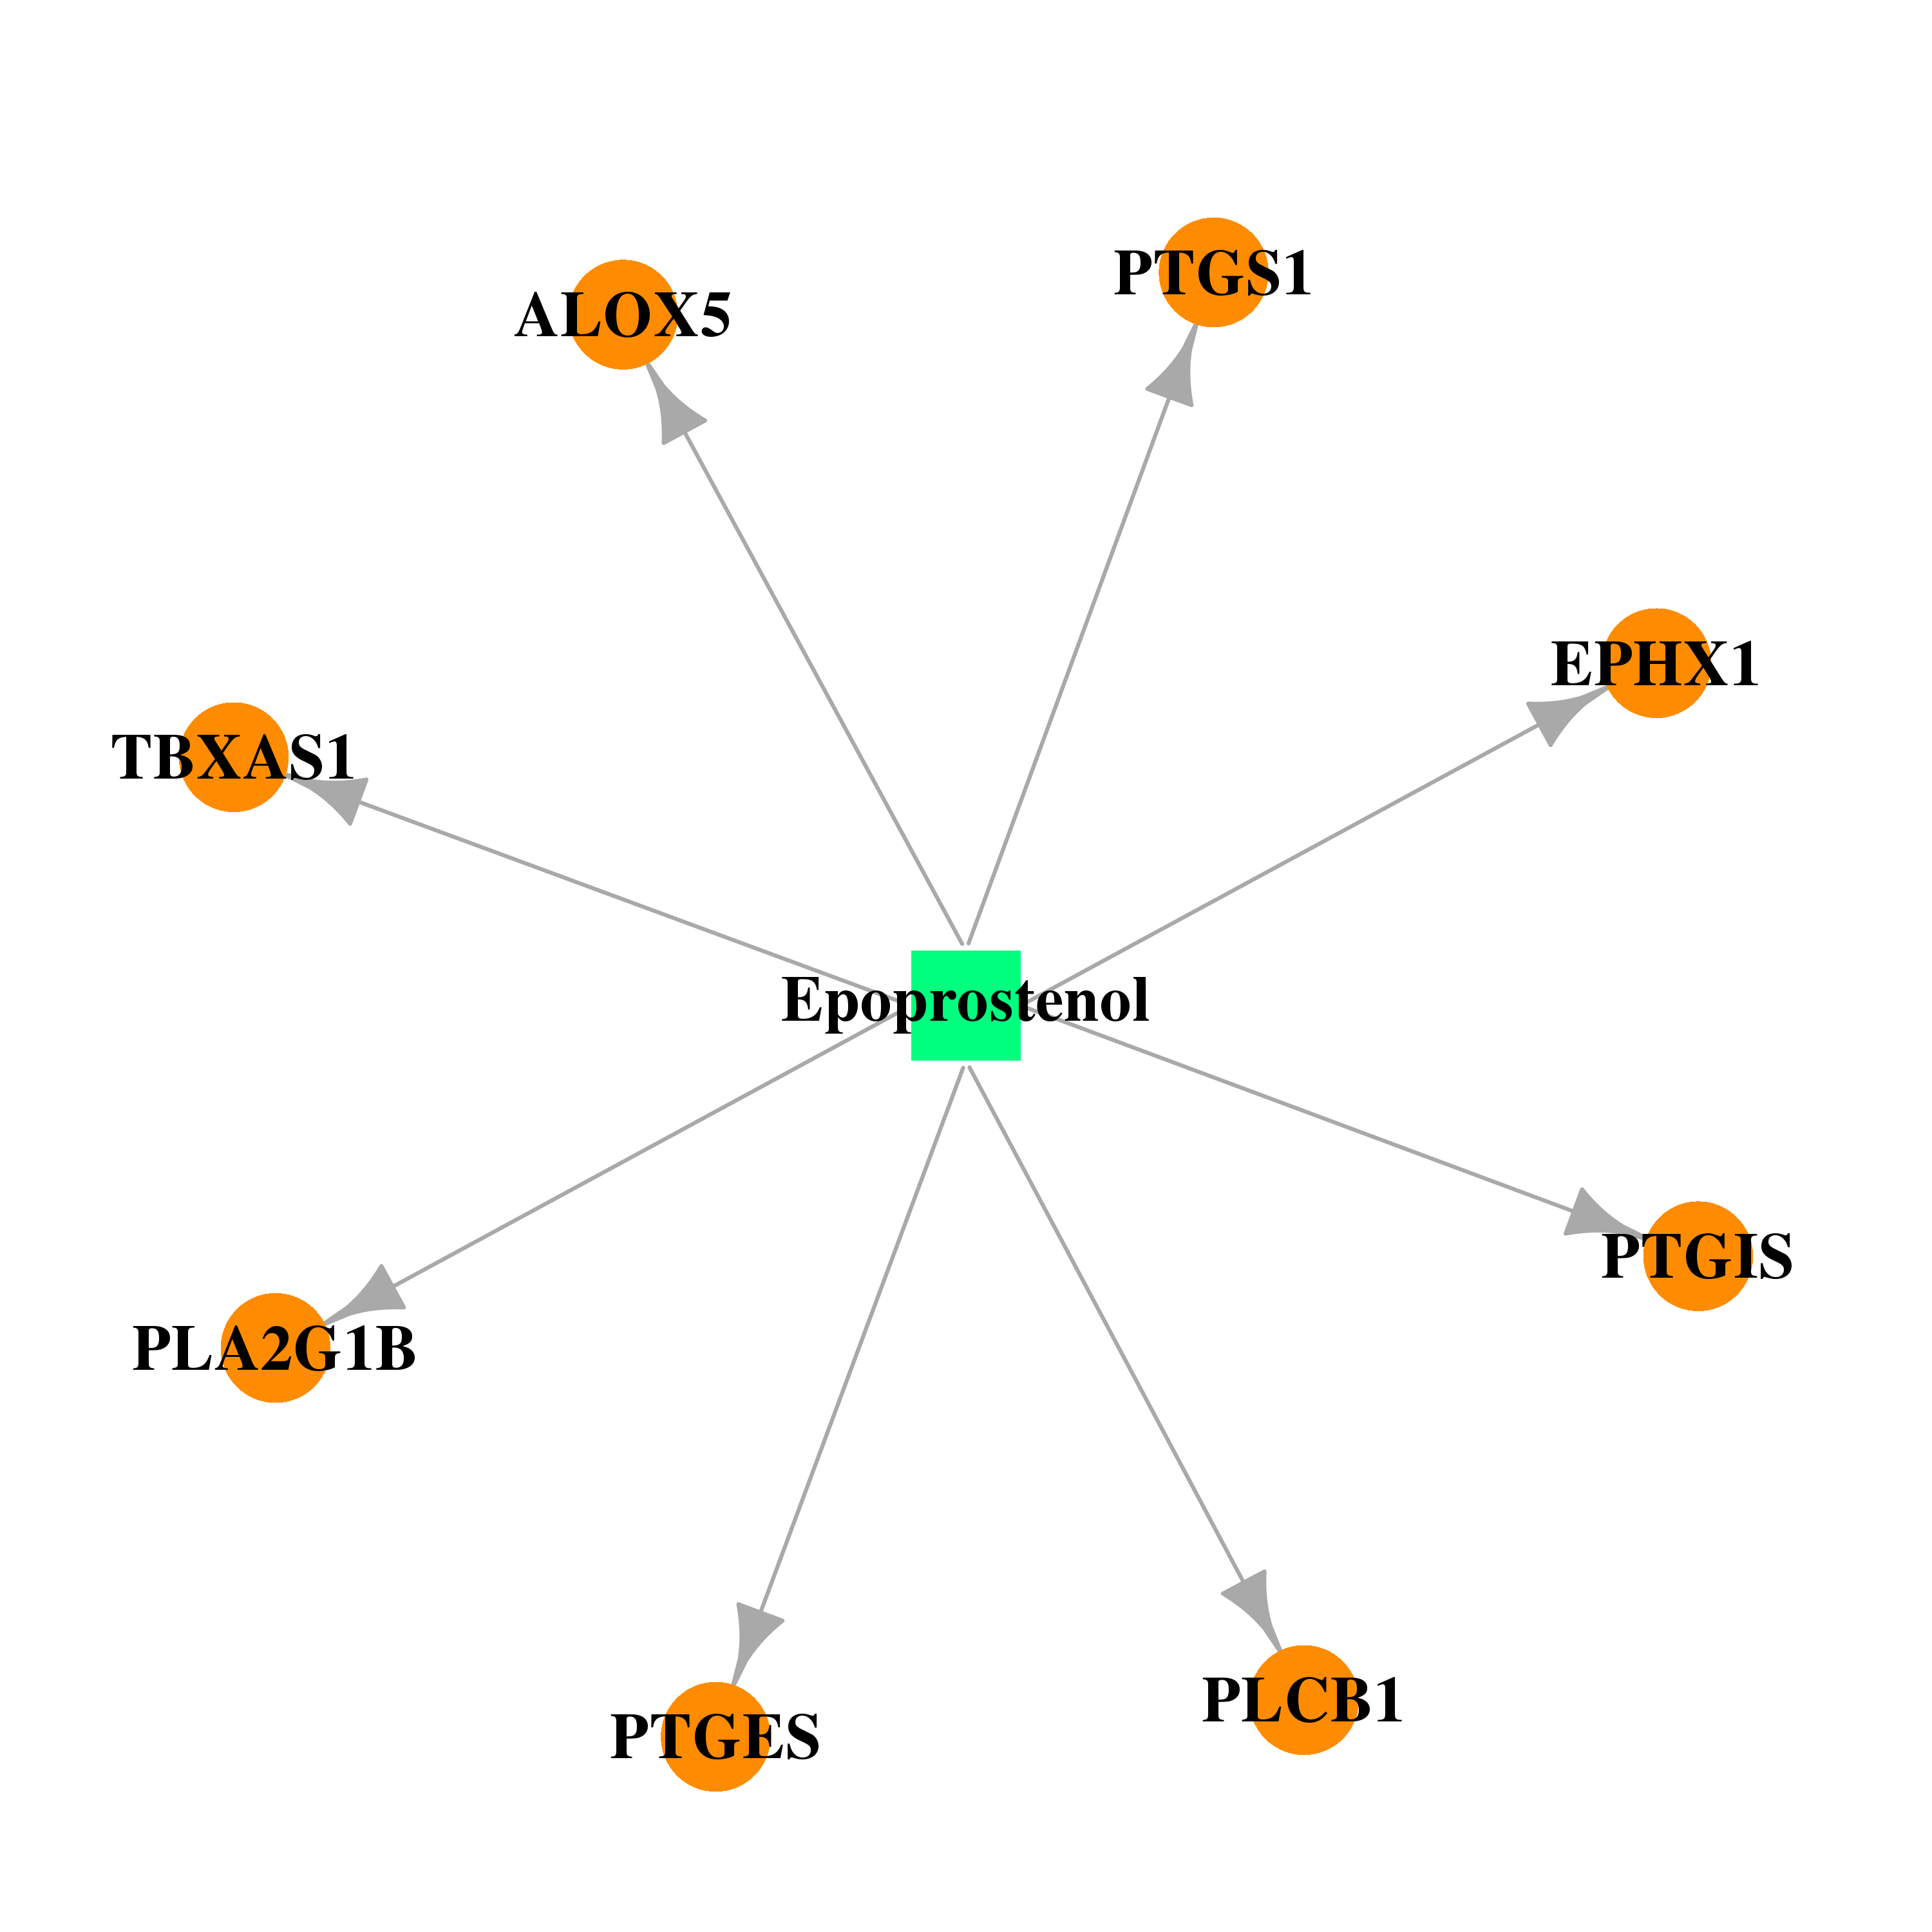 | 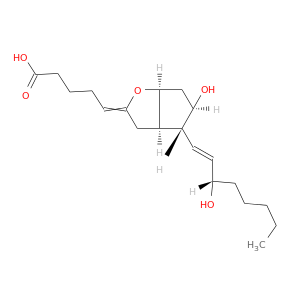 |
| DB08675 | prostaglandin I2 (prostacyclin) synthase | experimental | (6E)-7-{6-[(1E)-OCT-1-ENYL]-2,3-DIAZABICYCLO[2.2.1]HEPT-2-EN-5-YL}HEPT-6-ENOIC ACID |  | 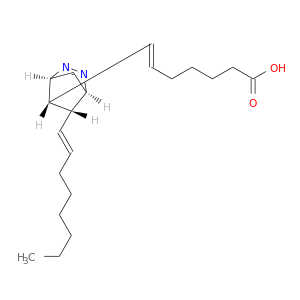 |
| DB00564 | prostaglandin I2 (prostacyclin) synthase | approved; investigational | Carbamazepine | 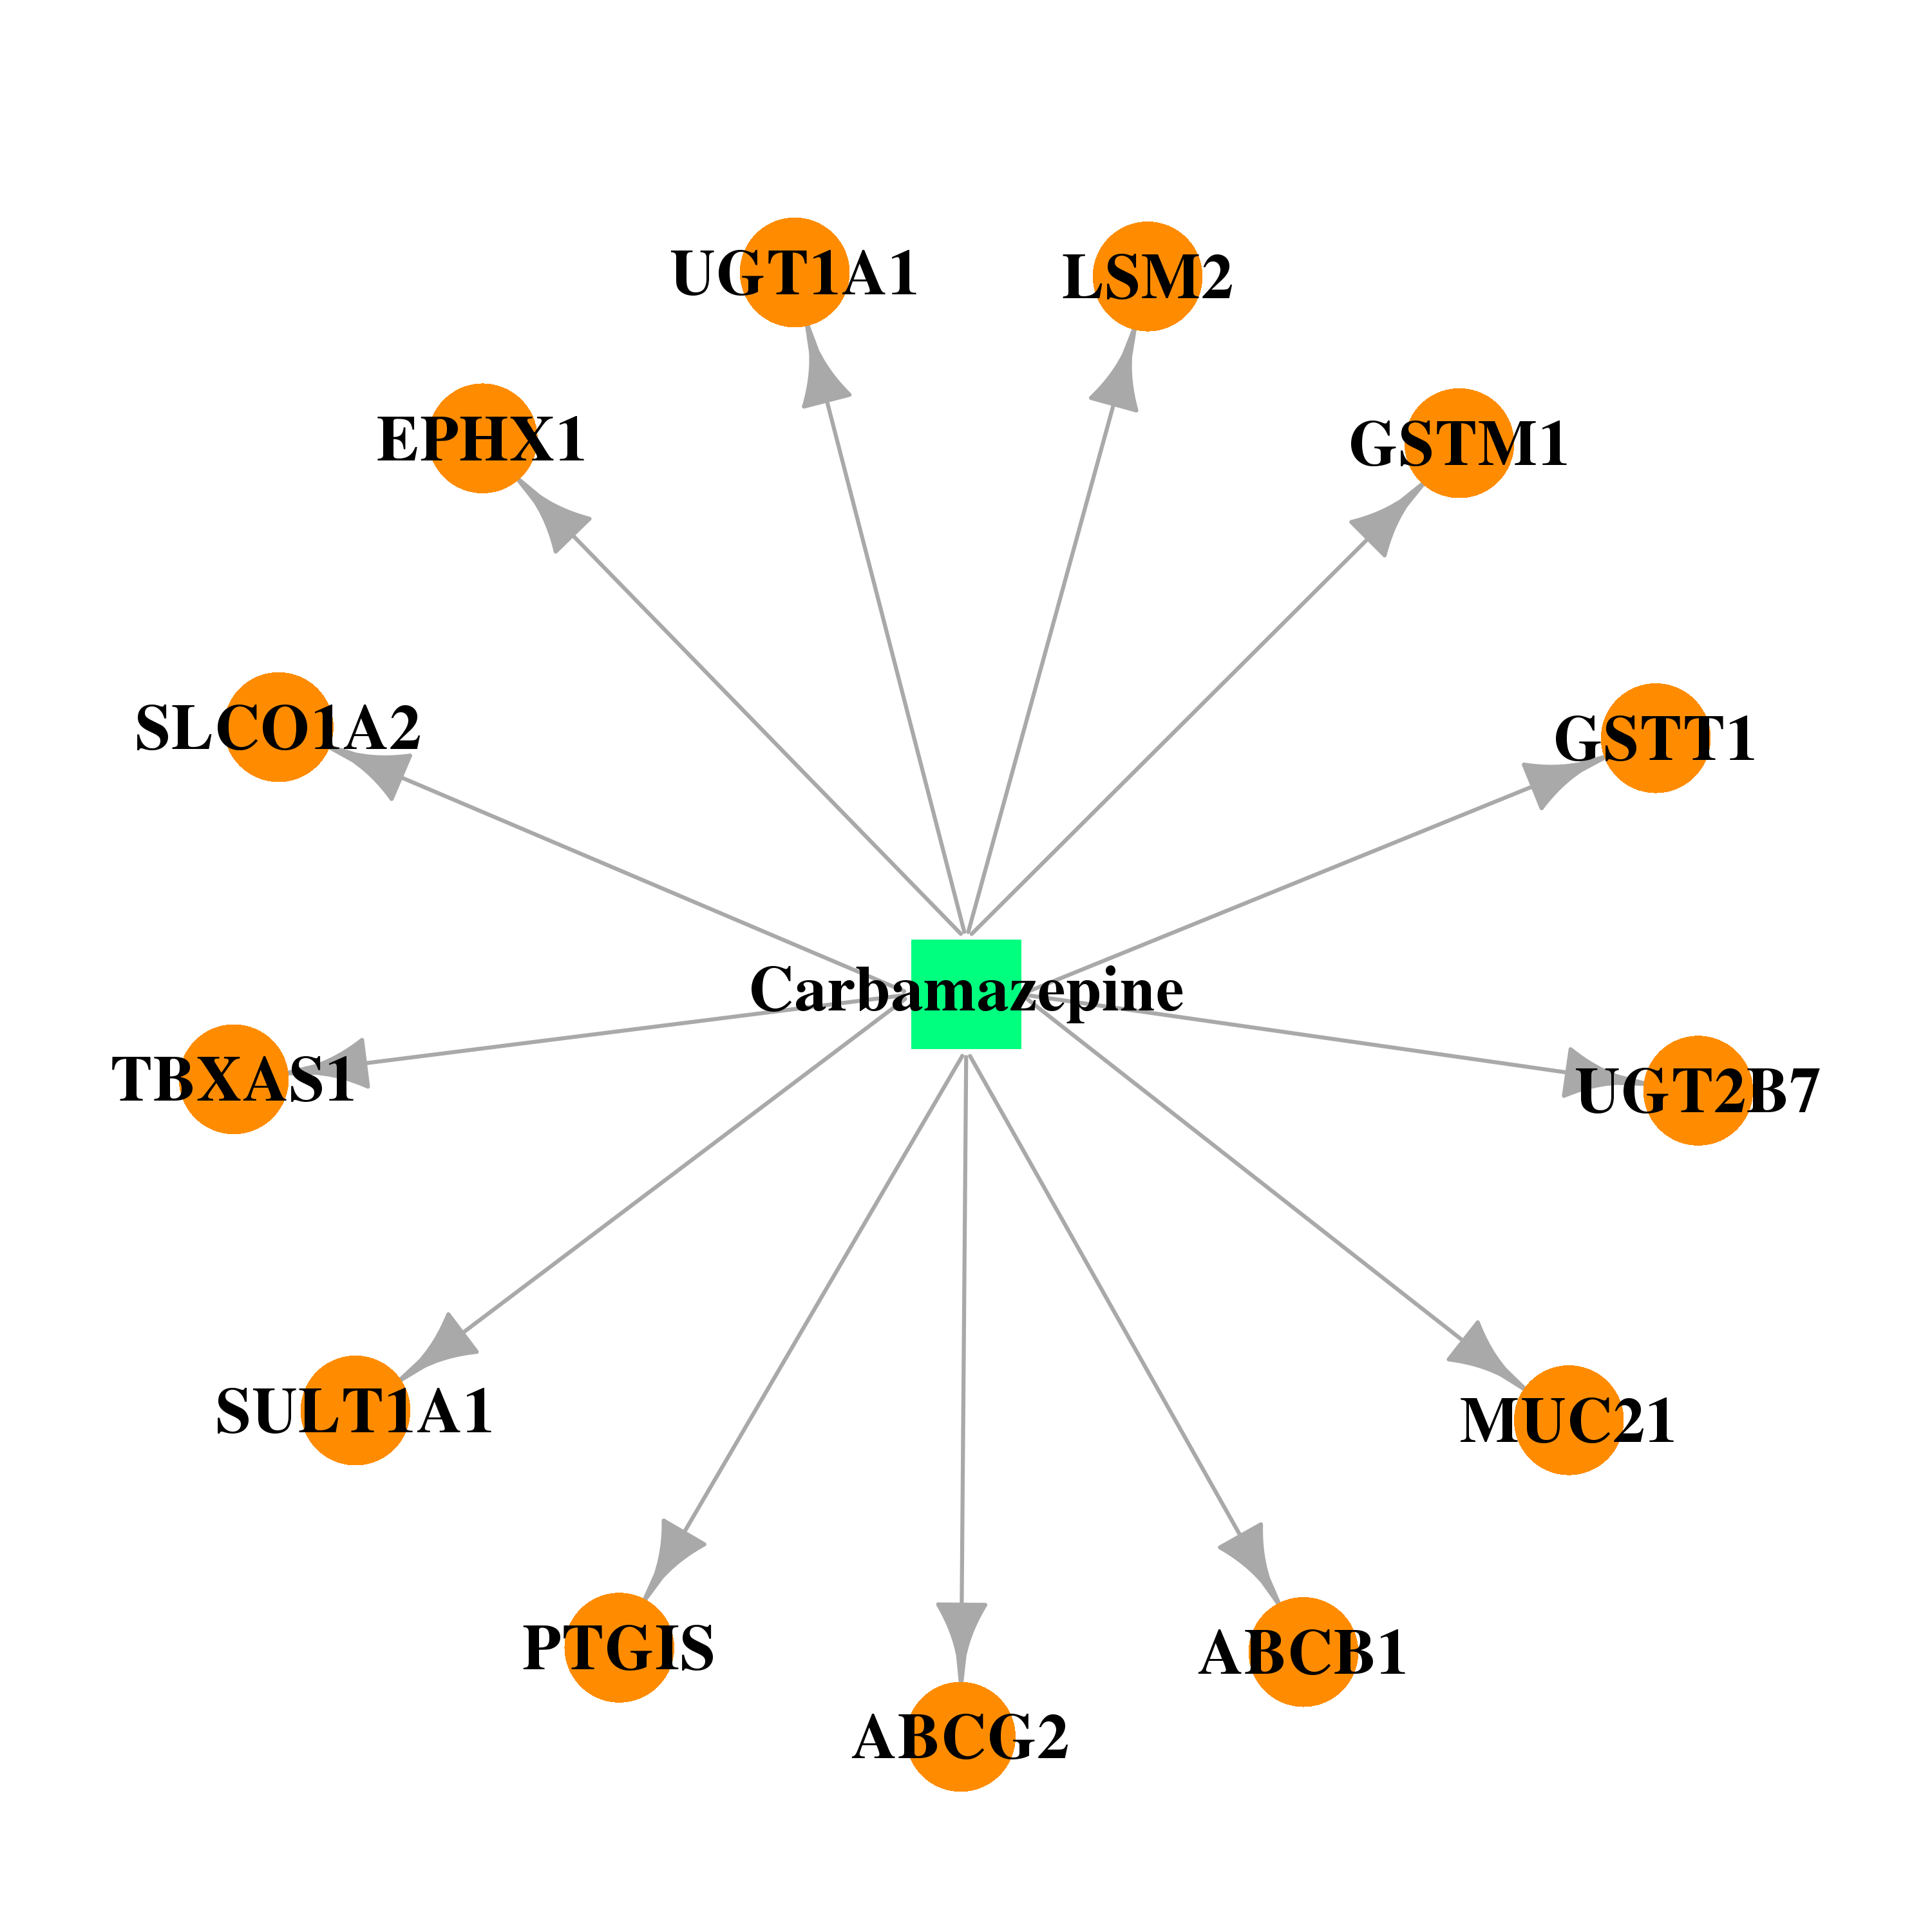 | 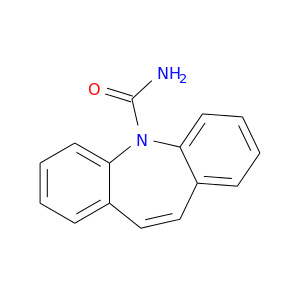 |
| DB00252 | prostaglandin I2 (prostacyclin) synthase | approved | Phenytoin | 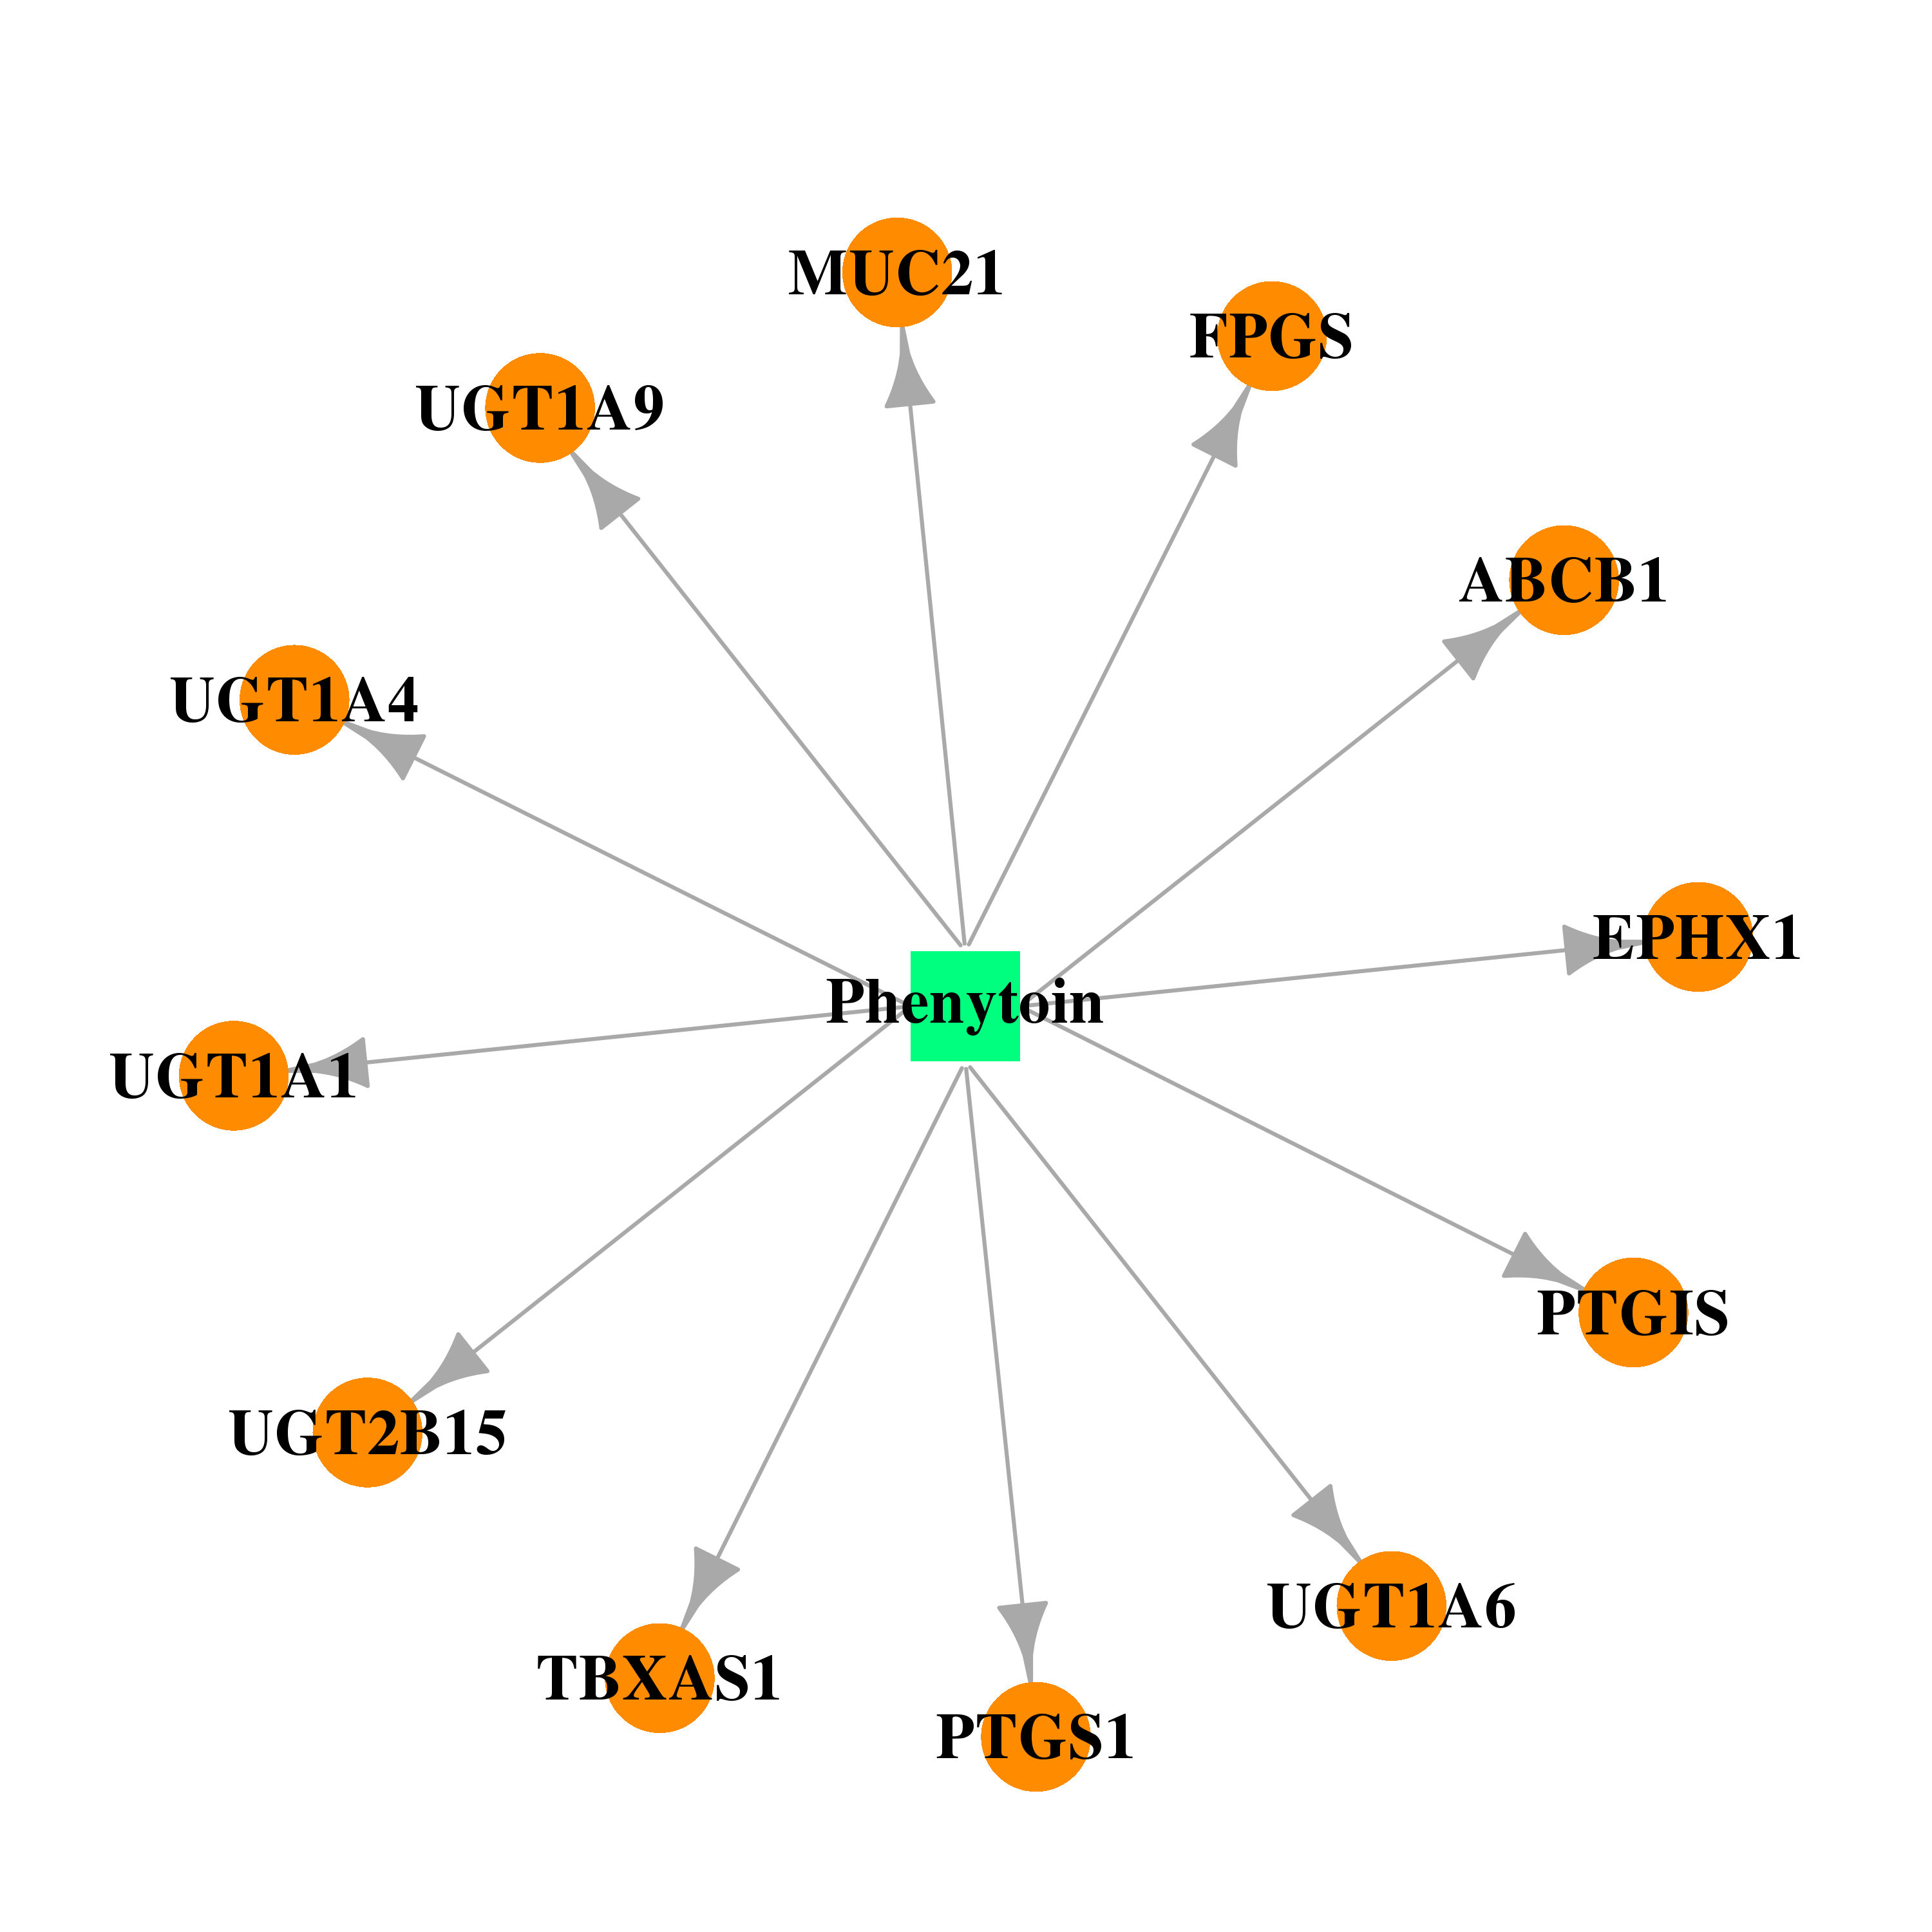 | 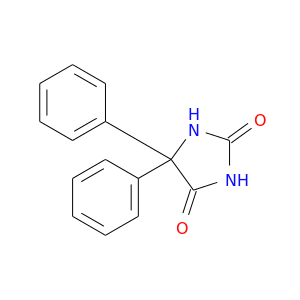 |
| DB00917 | prostaglandin I2 (prostacyclin) synthase | approved | Dinoprostone | 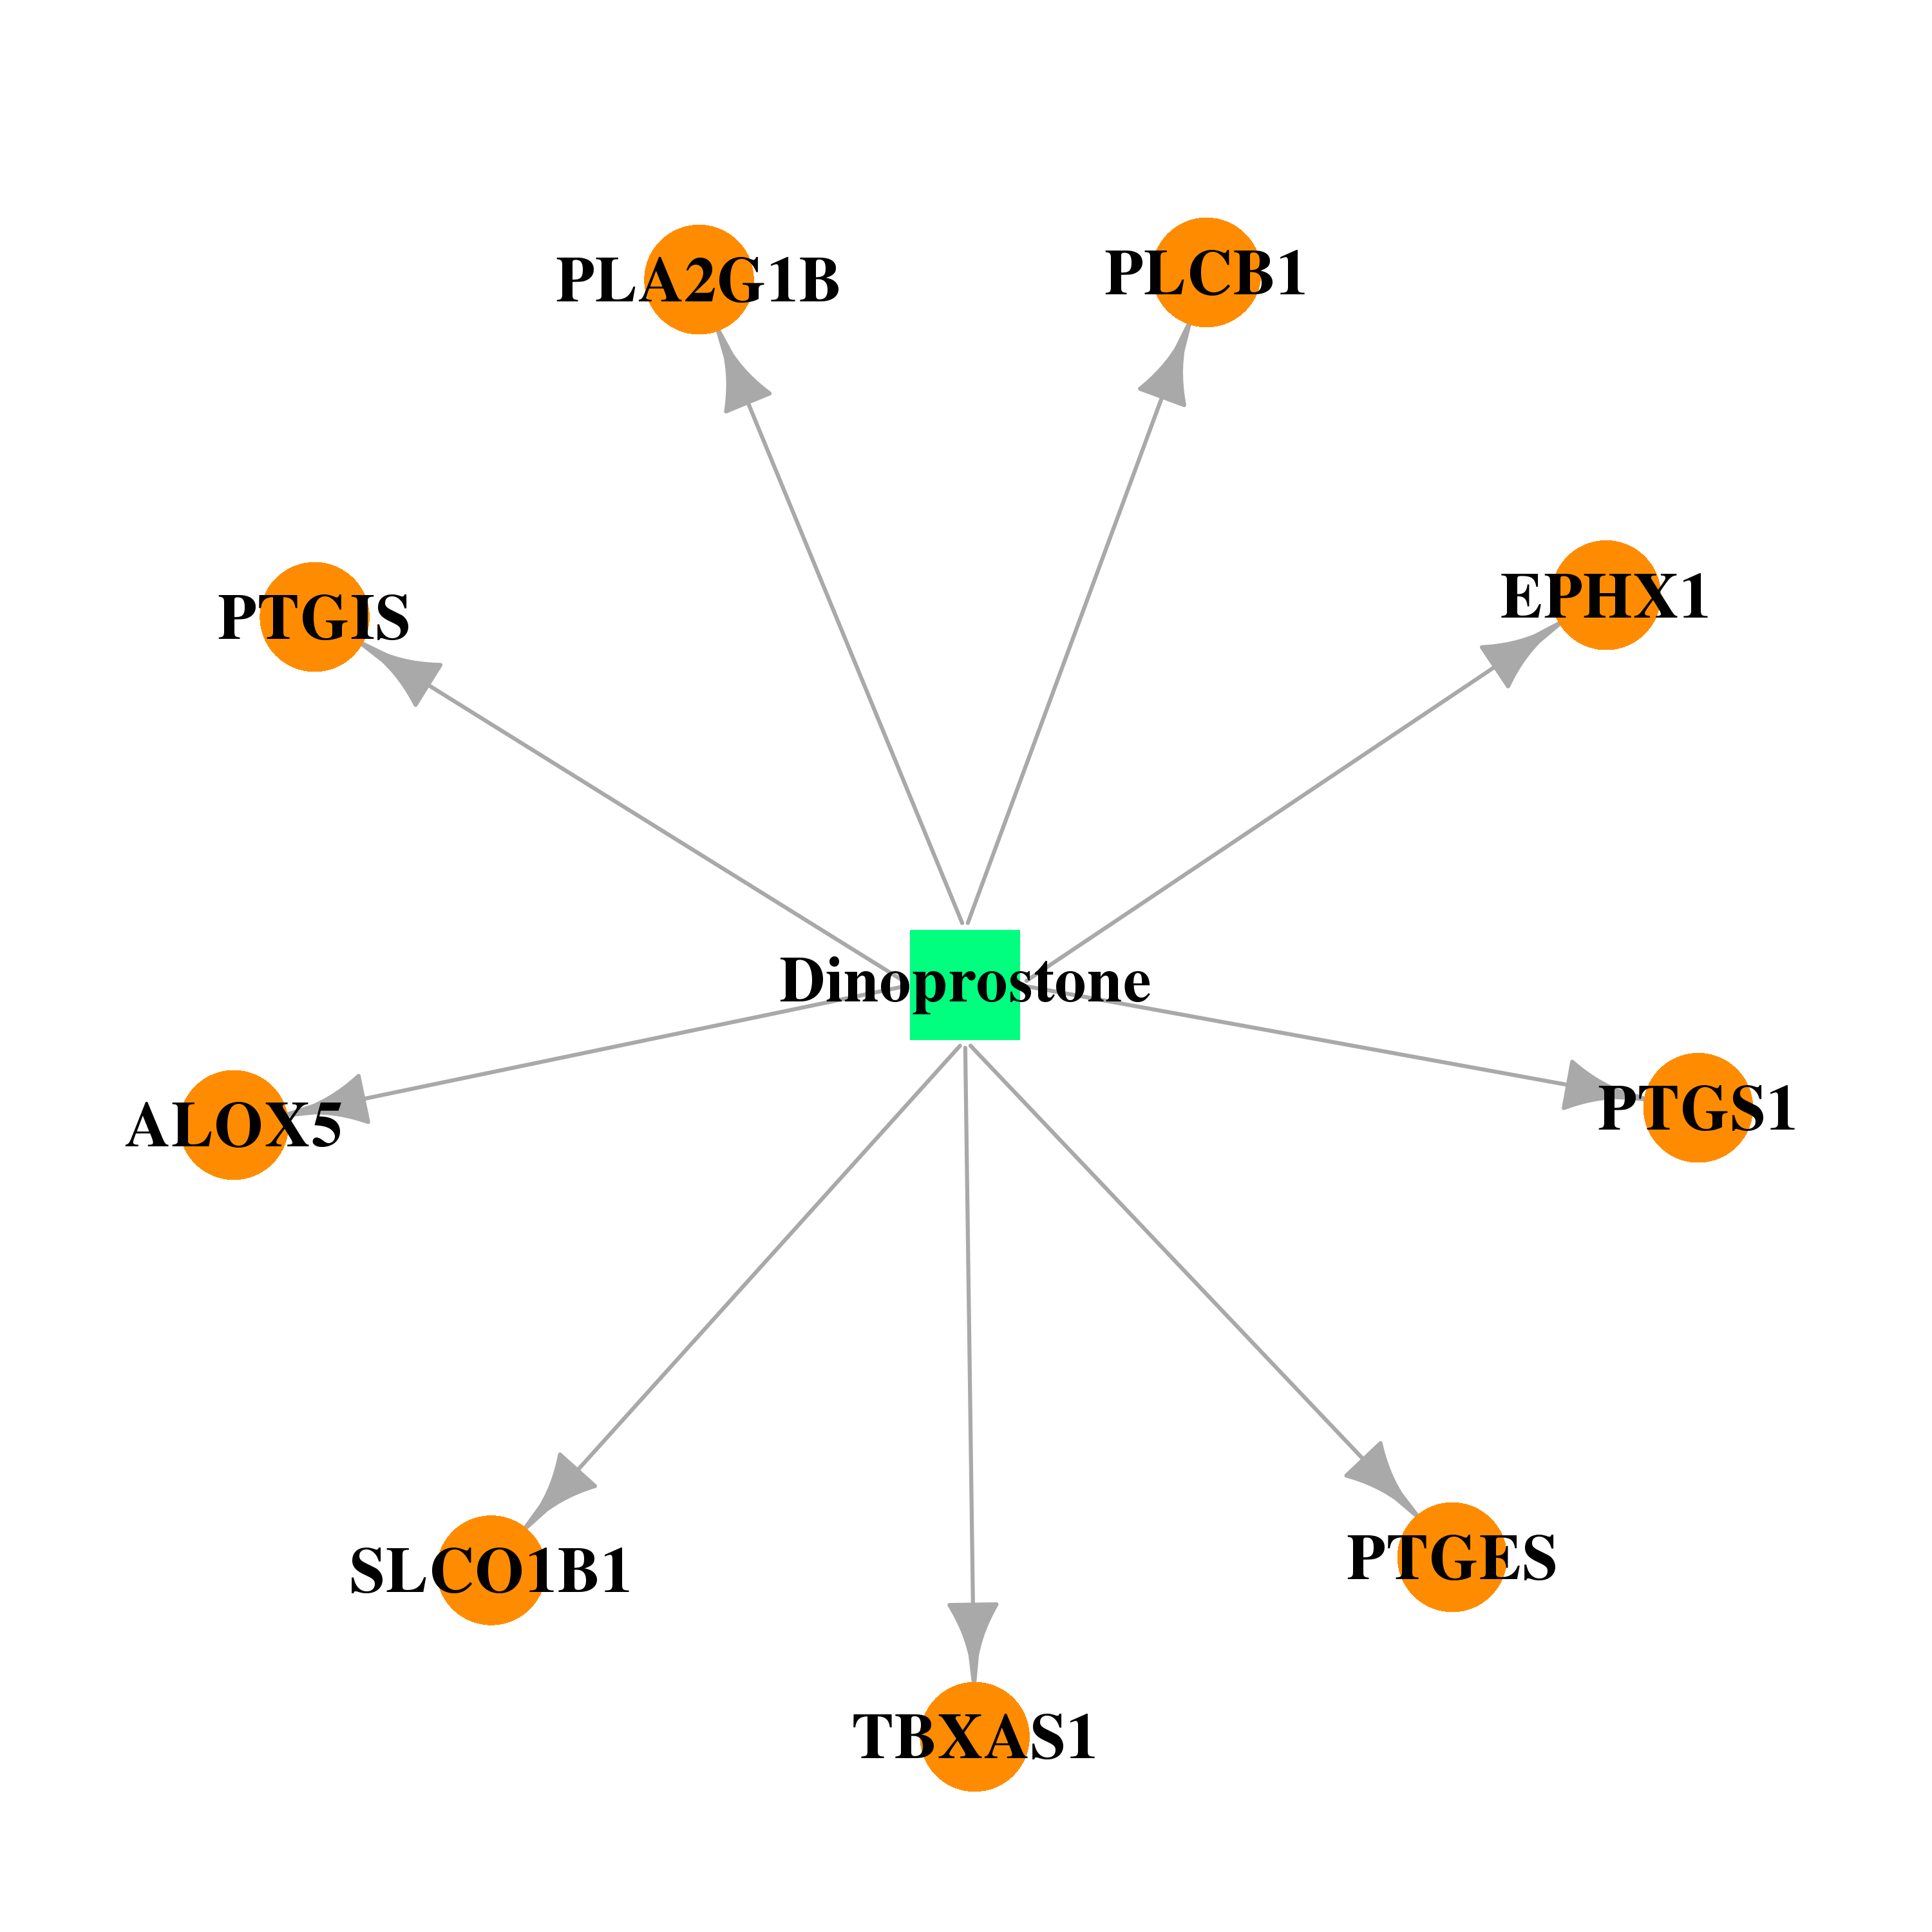 |  |
| DB00482 | prostaglandin I2 (prostacyclin) synthase | approved; investigational | Celecoxib | 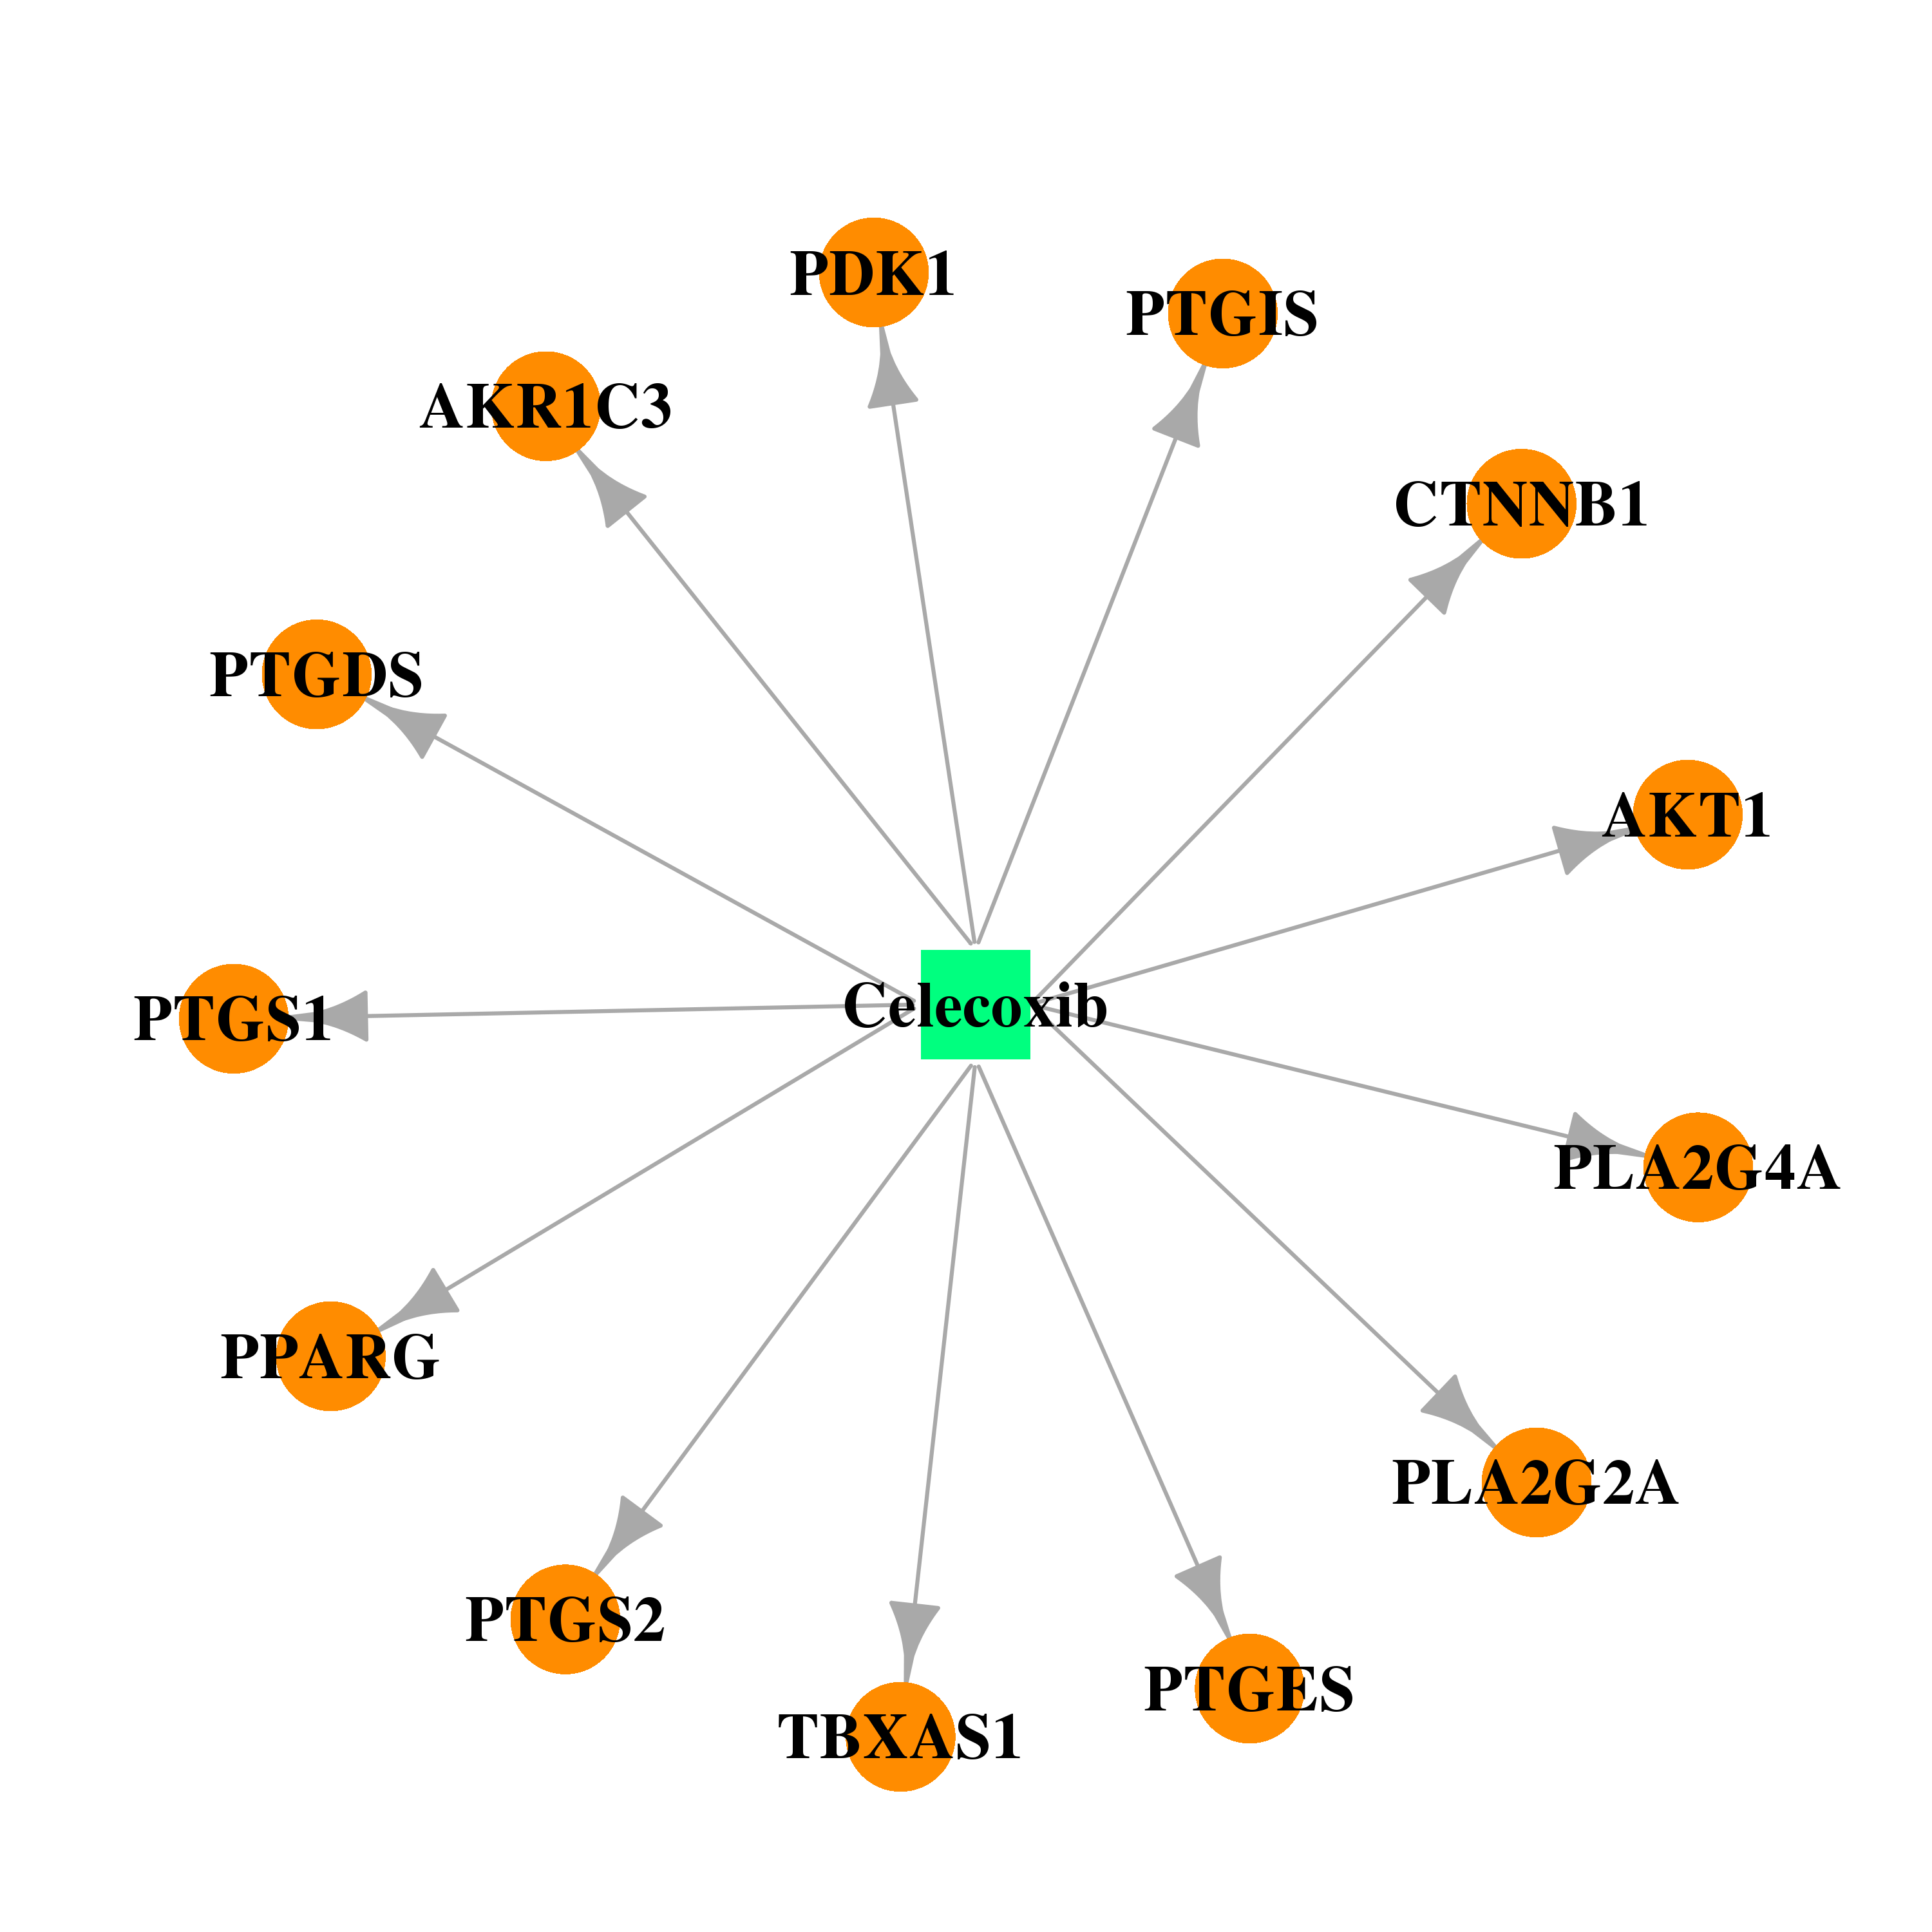 |  |
| Top |
| Cross referenced IDs for PTGIS |
| * We obtained these cross-references from Uniprot database. It covers 150 different DBs, 18 categories. http://www.uniprot.org/help/cross_references_section |
: Open all cross reference information
|
Copyright © 2016-Present - The Univsersity of Texas Health Science Center at Houston @ |