|
||||||||||||||||||||
| |
| Phenotypic Information (metabolism pathway, cancer, disease, phenome) |
| |
| |
| Gene-Gene Network Information: Co-Expression Network, Interacting Genes & KEGG |
| |
|


| Gene Summary for PDP2 |
| Basic gene info. | Gene symbol | PDP2 |
| Gene name | pyruvate dehyrogenase phosphatase catalytic subunit 2 | |
| Synonyms | PPM2C2 | |
| Cytomap | UCSC genome browser: 16q22.1 | |
| Genomic location | chr16 :66914382-66925002 | |
| Type of gene | protein-coding | |
| RefGenes | NM_020786.2, | |
| Ensembl id | ENSG00000172840 | |
| Description | PDPC 2[Pyruvate dehydrogenase [acetyl-transferring]]-phosphatase 2, mitochondrialprotein phosphatase 2C, magnesium-dependent, catalytic subunit 2pyruvate dehydrogenase phosphatase catalytic subunit 2pyruvate dehydrogenase phosphatase isoenzyme 2pyruv | |
| Modification date | 20141207 | |
| dbXrefs | MIM : 615499 | |
| HGNC : HGNC | ||
| Ensembl : ENSG00000172840 | ||
| HPRD : 15112 | ||
| Vega : OTTHUMG00000137512 | ||
| Protein | UniProt: go to UniProt's Cross Reference DB Table | |
| Expression | CleanEX: HS_PDP2 | |
| BioGPS: 57546 | ||
| Gene Expression Atlas: ENSG00000172840 | ||
| The Human Protein Atlas: ENSG00000172840 | ||
| Pathway | NCI Pathway Interaction Database: PDP2 | |
| KEGG: PDP2 | ||
| REACTOME: PDP2 | ||
| ConsensusPathDB | ||
| Pathway Commons: PDP2 | ||
| Metabolism | MetaCyc: PDP2 | |
| HUMANCyc: PDP2 | ||
| Regulation | Ensembl's Regulation: ENSG00000172840 | |
| miRBase: chr16 :66,914,382-66,925,002 | ||
| TargetScan: NM_020786 | ||
| cisRED: ENSG00000172840 | ||
| Context | iHOP: PDP2 | |
| cancer metabolism search in PubMed: PDP2 | ||
| UCL Cancer Institute: PDP2 | ||
| Assigned class in ccmGDB | C | |
| Top |
| Phenotypic Information for PDP2(metabolism pathway, cancer, disease, phenome) |
| Cancer | CGAP: PDP2 |
| Familial Cancer Database: PDP2 | |
| * This gene is included in those cancer gene databases. |
|
|
|
|
|
|
| ||||||||||||||
Oncogene 1 | Significant driver gene in | |||||||||||||||||||
| cf) number; DB name 1 Oncogene; http://nar.oxfordjournals.org/content/35/suppl_1/D721.long, 2 Tumor Suppressor gene; https://bioinfo.uth.edu/TSGene/, 3 Cancer Gene Census; http://www.nature.com/nrc/journal/v4/n3/abs/nrc1299.html, 4 CancerGenes; http://nar.oxfordjournals.org/content/35/suppl_1/D721.long, 5 Network of Cancer Gene; http://ncg.kcl.ac.uk/index.php, 1Therapeutic Vulnerabilities in Cancer; http://cbio.mskcc.org/cancergenomics/statius/ |
| REACTOME_PYRUVATE_METABOLISM_AND_CITRIC_ACID_TCA_CYCLE REACTOME_PYRUVATE_METABOLISM | |
| OMIM | |
| Orphanet | |
| Disease | KEGG Disease: PDP2 |
| MedGen: PDP2 (Human Medical Genetics with Condition) | |
| ClinVar: PDP2 | |
| Phenotype | MGI: PDP2 (International Mouse Phenotyping Consortium) |
| PhenomicDB: PDP2 | |
| Mutations for PDP2 |
| * Under tables are showing count per each tissue to give us broad intuition about tissue specific mutation patterns.You can go to the detailed page for each mutation database's web site. |
| There's no structural variation information in COSMIC data for this gene. |
| * From mRNA Sanger sequences, Chitars2.0 arranged chimeric transcripts. This table shows PDP2 related fusion information. |
| ID | Head Gene | Tail Gene | Accession | Gene_a | qStart_a | qEnd_a | Chromosome_a | tStart_a | tEnd_a | Gene_a | qStart_a | qEnd_a | Chromosome_a | tStart_a | tEnd_a |
| Top |
| There's no copy number variation information in COSMIC data for this gene. |
| Top |
|
 |
| Top |
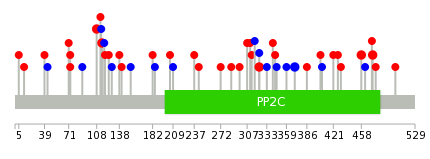
| Stat. for Non-Synonymous SNVs (# total SNVs=30) | (# total SNVs=12) |
 |  |
(# total SNVs=0) | (# total SNVs=0) |
| Top |
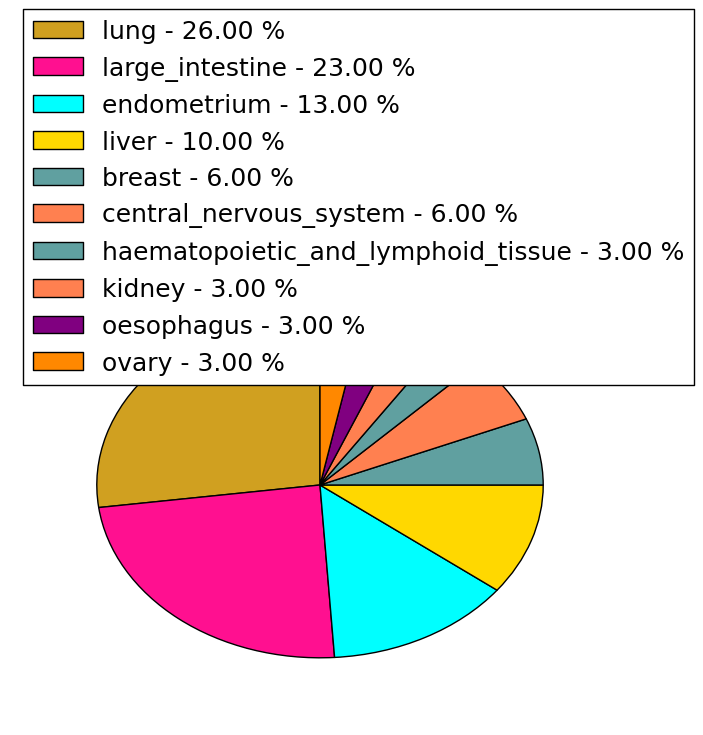
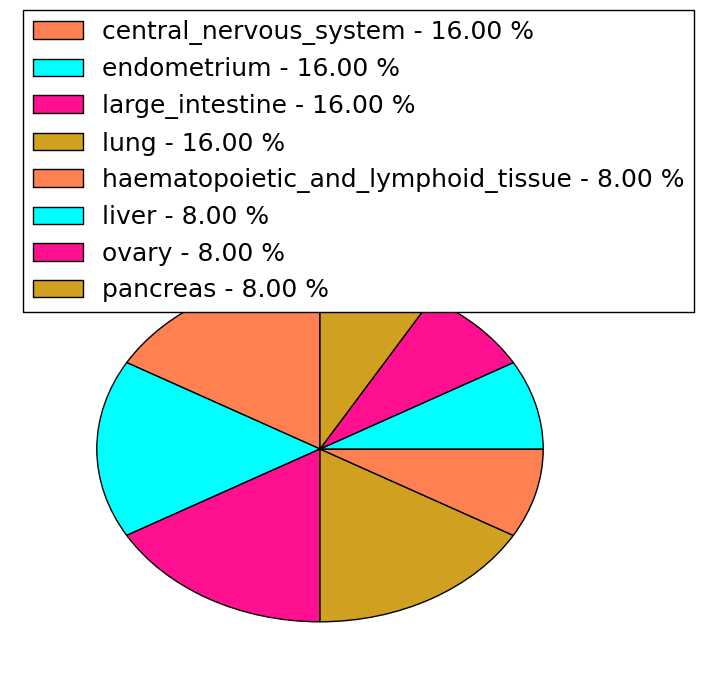
| * When you move the cursor on each content, you can see more deailed mutation information on the Tooltip. Those are primary_site,primary_histology,mutation(aa),pubmedID. |
| GRCh37 position | Mutation(aa) | Unique sampleID count |
| chr16:66919155-66919155 | p.E323G | 2 |
| chr16:66919560-66919560 | p.R458K | 2 |
| chr16:66918510-66918510 | p.R108Q | 2 |
| chr16:66919604-66919604 | p.R473W | 2 |
| chr16:66919297-66919297 | p.T370T | 2 |
| chr16:66918530-66918530 | p.A115T | 2 |
| chr16:66918814-66918814 | p.L209L | 1 |
| chr16:66919695-66919695 | p.A503V | 1 |
| chr16:66918222-66918222 | p.S12F | 1 |
| chr16:66919136-66919136 | p.L317L | 1 |
| Top |
|
 |
| Point Mutation/ Tissue ID | 1 | 2 | 3 | 4 | 5 | 6 | 7 | 8 | 9 | 10 | 11 | 12 | 13 | 14 | 15 | 16 | 17 | 18 | 19 | 20 |
| # sample | 1 | 1 | 1 | 6 | 1 | 1 | 4 | 4 | 1 | 1 | 9 | 6 | 5 | |||||||
| # mutation | 1 | 1 | 1 | 5 | 1 | 1 | 4 | 4 | 1 | 1 | 9 | 7 | 6 | |||||||
| nonsynonymous SNV | 1 | 1 | 3 | 1 | 1 | 2 | 4 | 1 | 4 | 5 | 4 | |||||||||
| synonymous SNV | 1 | 2 | 2 | 1 | 5 | 2 | 2 |
| cf) Tissue ID; Tissue type (1; BLCA[Bladder Urothelial Carcinoma], 2; BRCA[Breast invasive carcinoma], 3; CESC[Cervical squamous cell carcinoma and endocervical adenocarcinoma], 4; COAD[Colon adenocarcinoma], 5; GBM[Glioblastoma multiforme], 6; Glioma Low Grade, 7; HNSC[Head and Neck squamous cell carcinoma], 8; KICH[Kidney Chromophobe], 9; KIRC[Kidney renal clear cell carcinoma], 10; KIRP[Kidney renal papillary cell carcinoma], 11; LAML[Acute Myeloid Leukemia], 12; LUAD[Lung adenocarcinoma], 13; LUSC[Lung squamous cell carcinoma], 14; OV[Ovarian serous cystadenocarcinoma ], 15; PAAD[Pancreatic adenocarcinoma], 16; PRAD[Prostate adenocarcinoma], 17; SKCM[Skin Cutaneous Melanoma], 18:STAD[Stomach adenocarcinoma], 19:THCA[Thyroid carcinoma], 20:UCEC[Uterine Corpus Endometrial Carcinoma]) |
| Top |
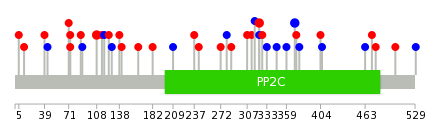
| * We represented just top 10 SNVs. When you move the cursor on each content, you can see more deailed mutation information on the Tooltip. Those are primary_site, primary_histology, mutation(aa), pubmedID. |
| Genomic Position | Mutation(aa) | Unique sampleID count |
| chr16:66919297 | p.T370T | 2 |
| chr16:66919155 | p.R108Q | 2 |
| chr16:66918510 | p.E323G | 2 |
| chr16:66919027 | p.S12F | 1 |
| chr16:66918222 | p.P182L | 1 |
| chr16:66918558 | p.W39L | 1 |
| chr16:66919043 | p.L209L | 1 |
| chr16:66918303 | p.A372S | 1 |
| chr16:66919301 | p.S43S | 1 |
| chr16:66918571 | p.R237I | 1 |
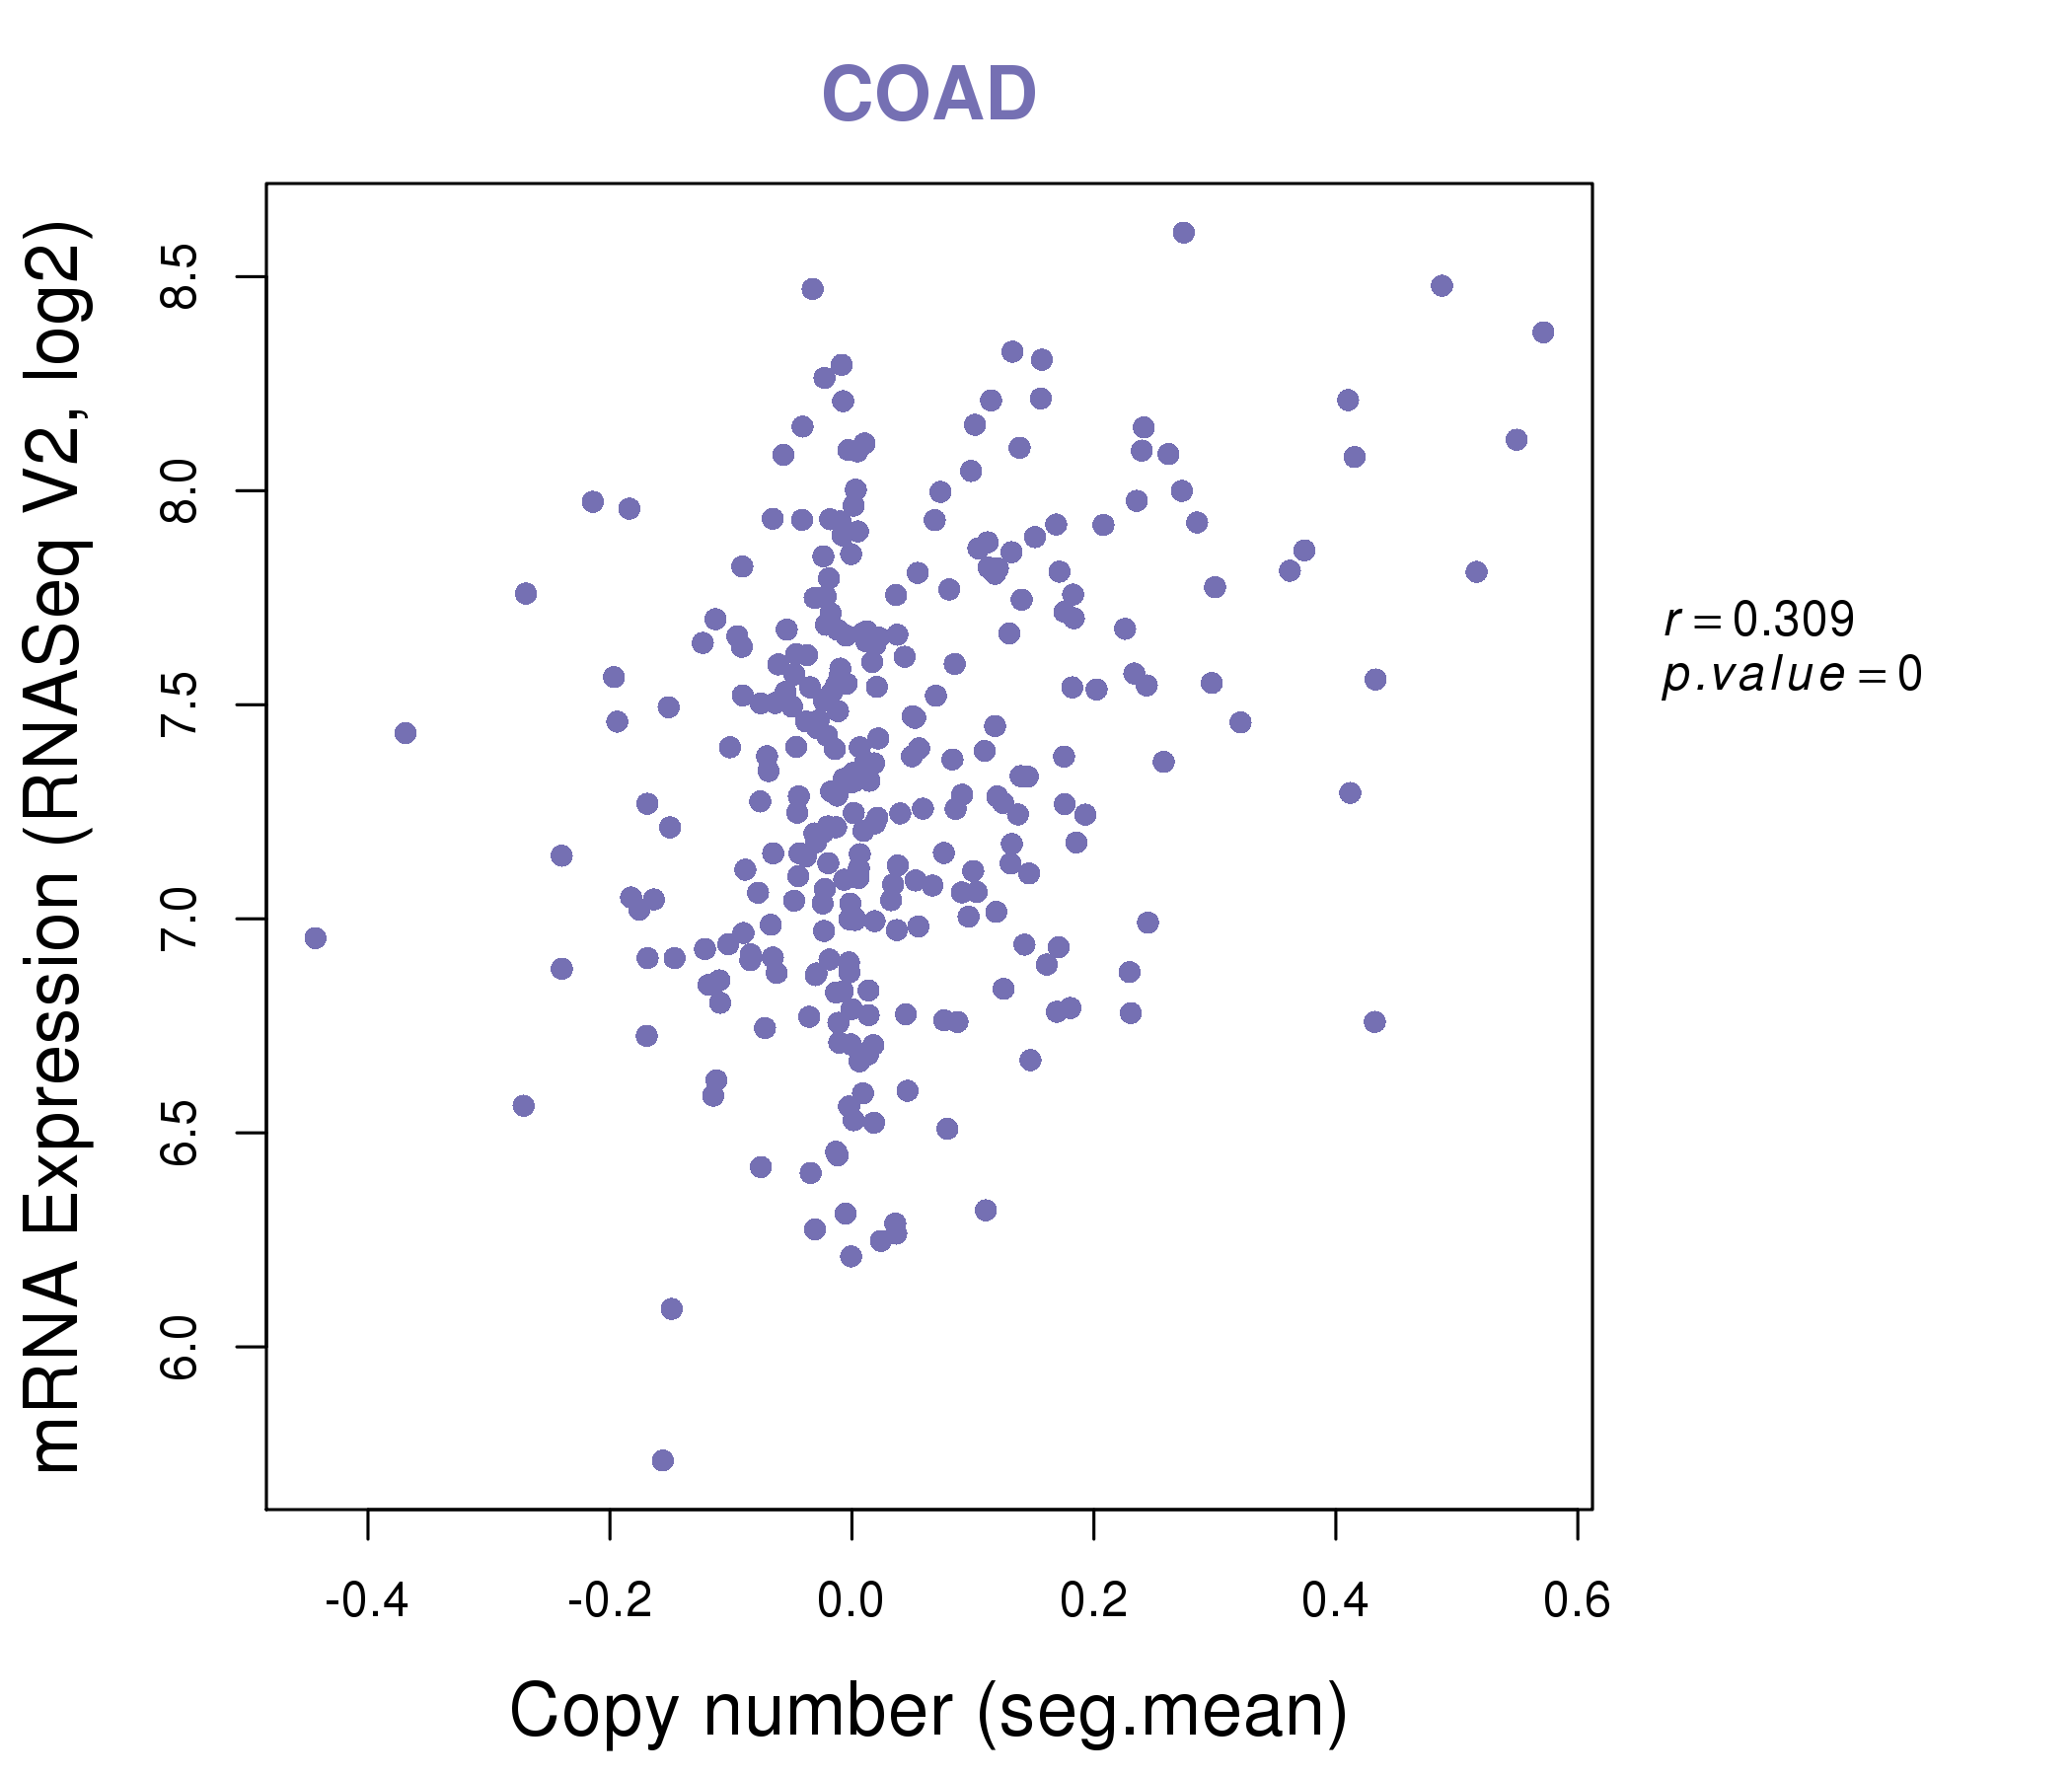
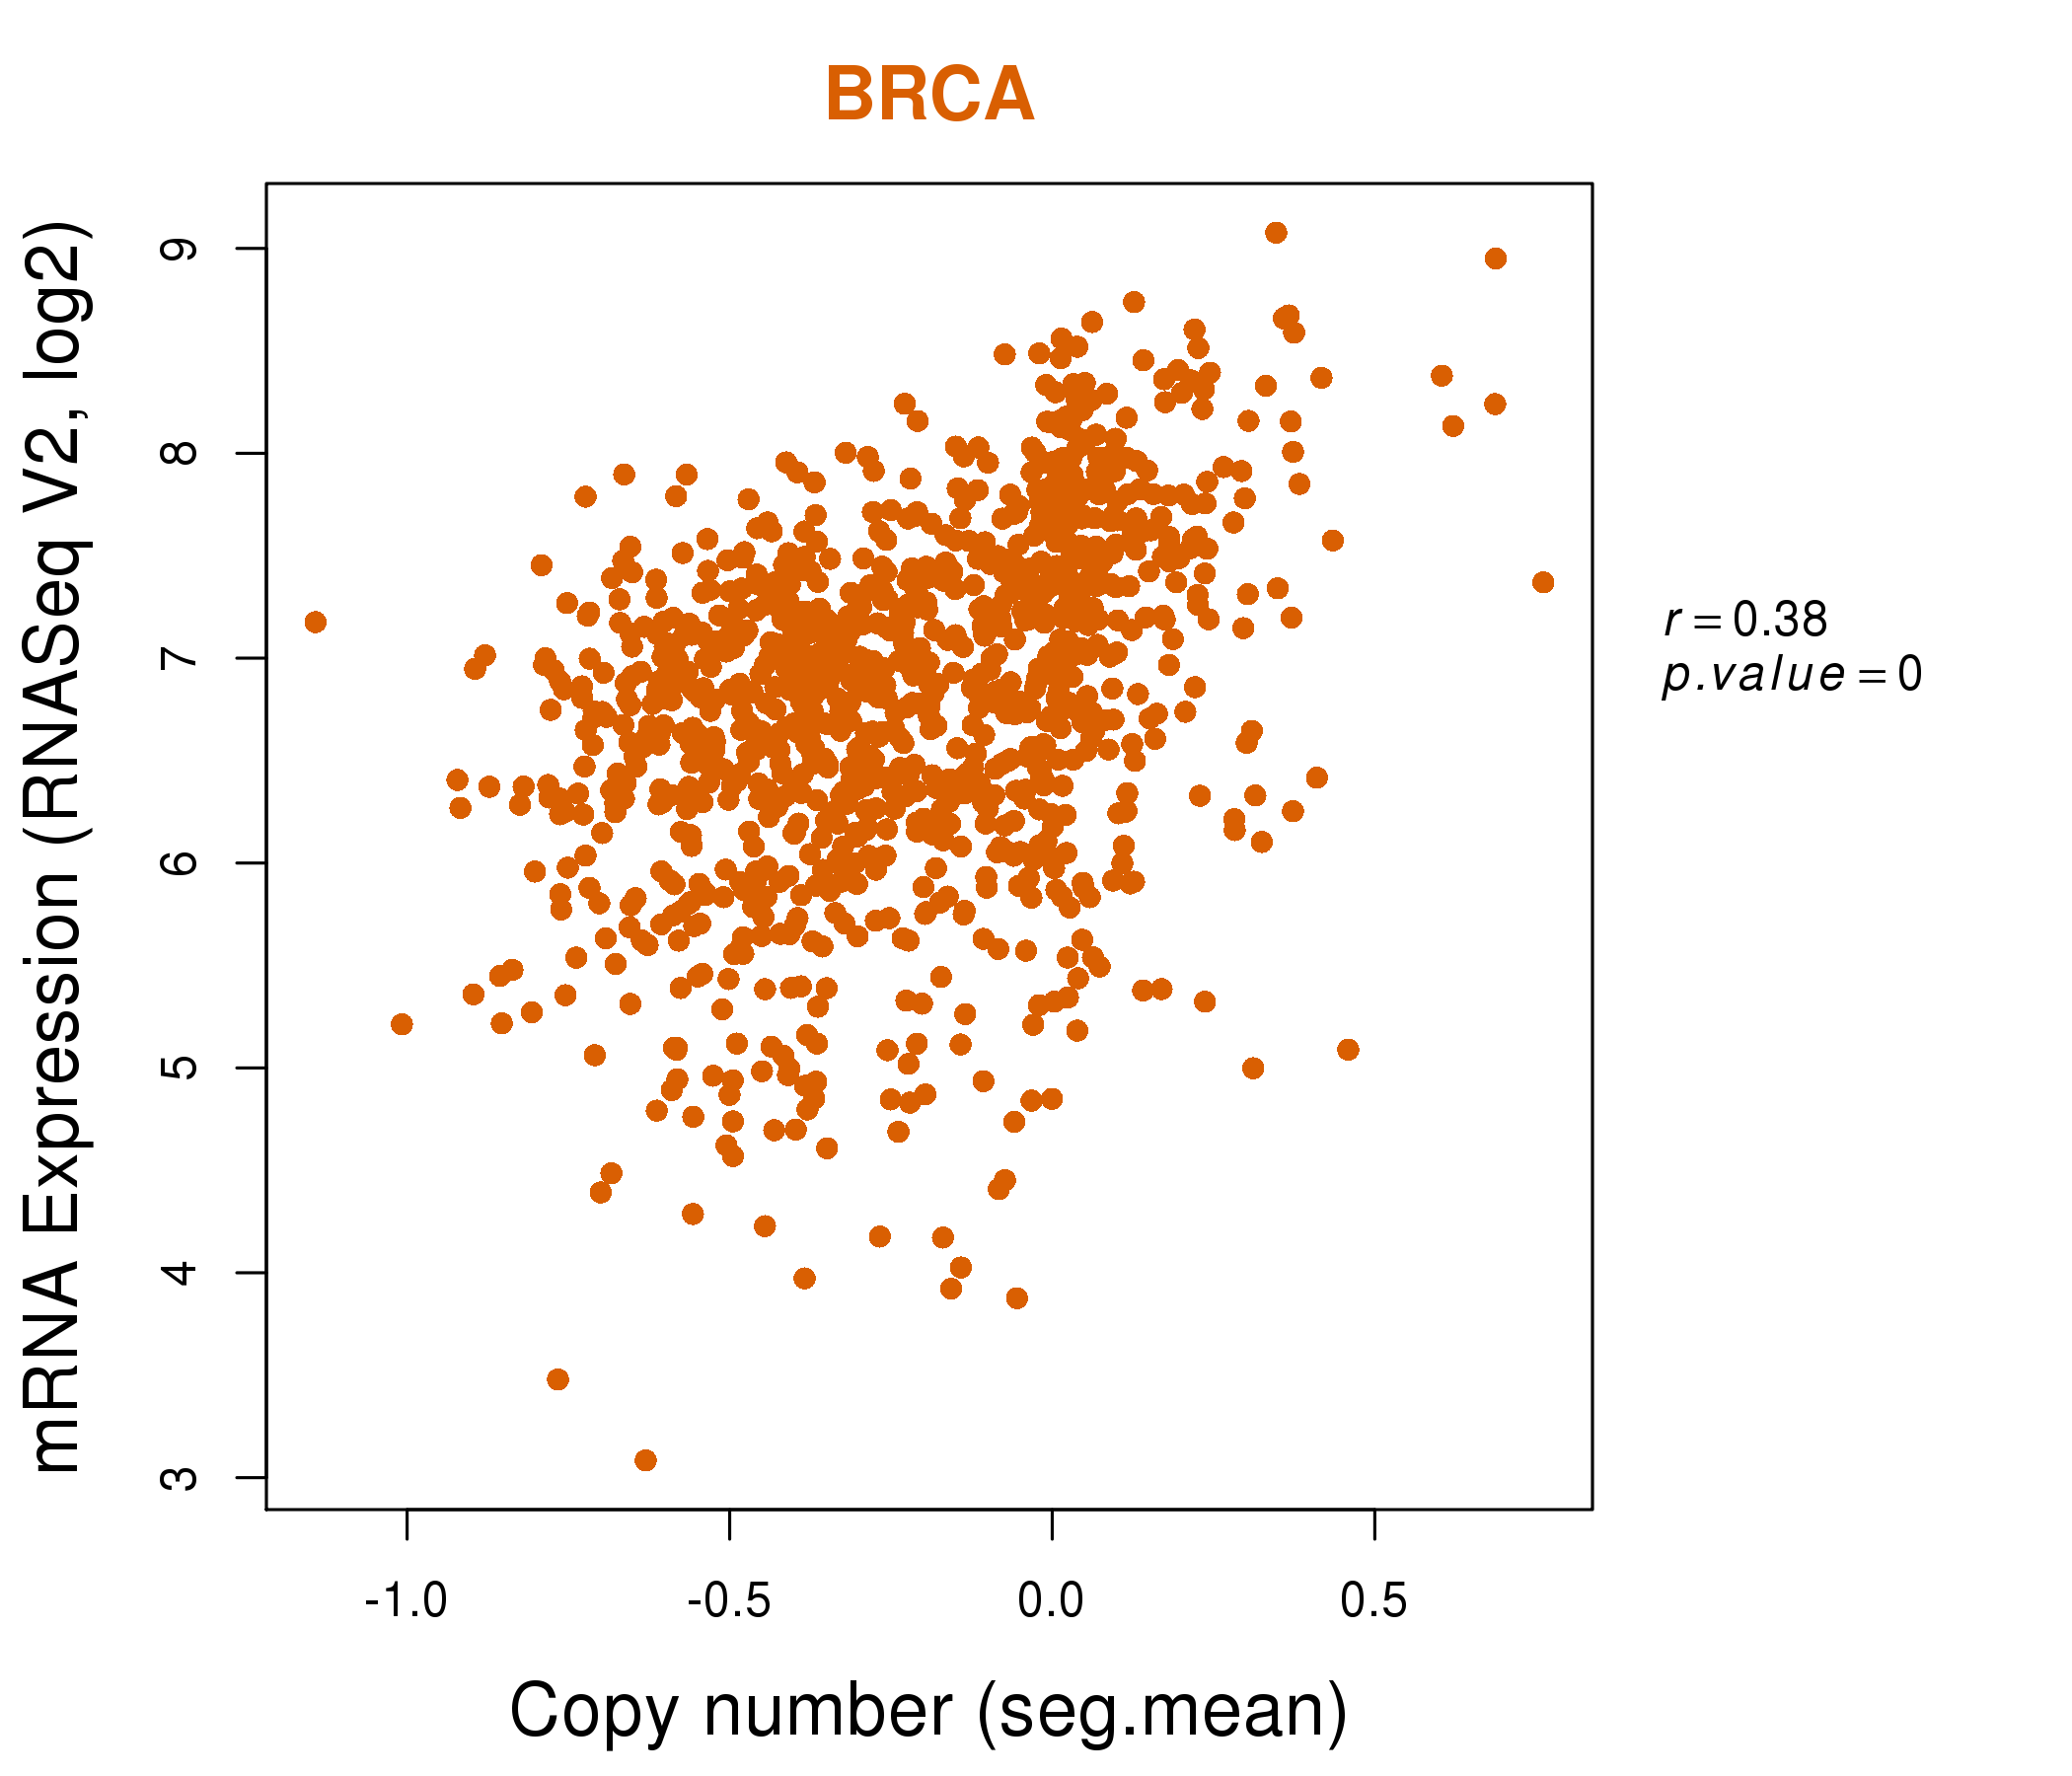
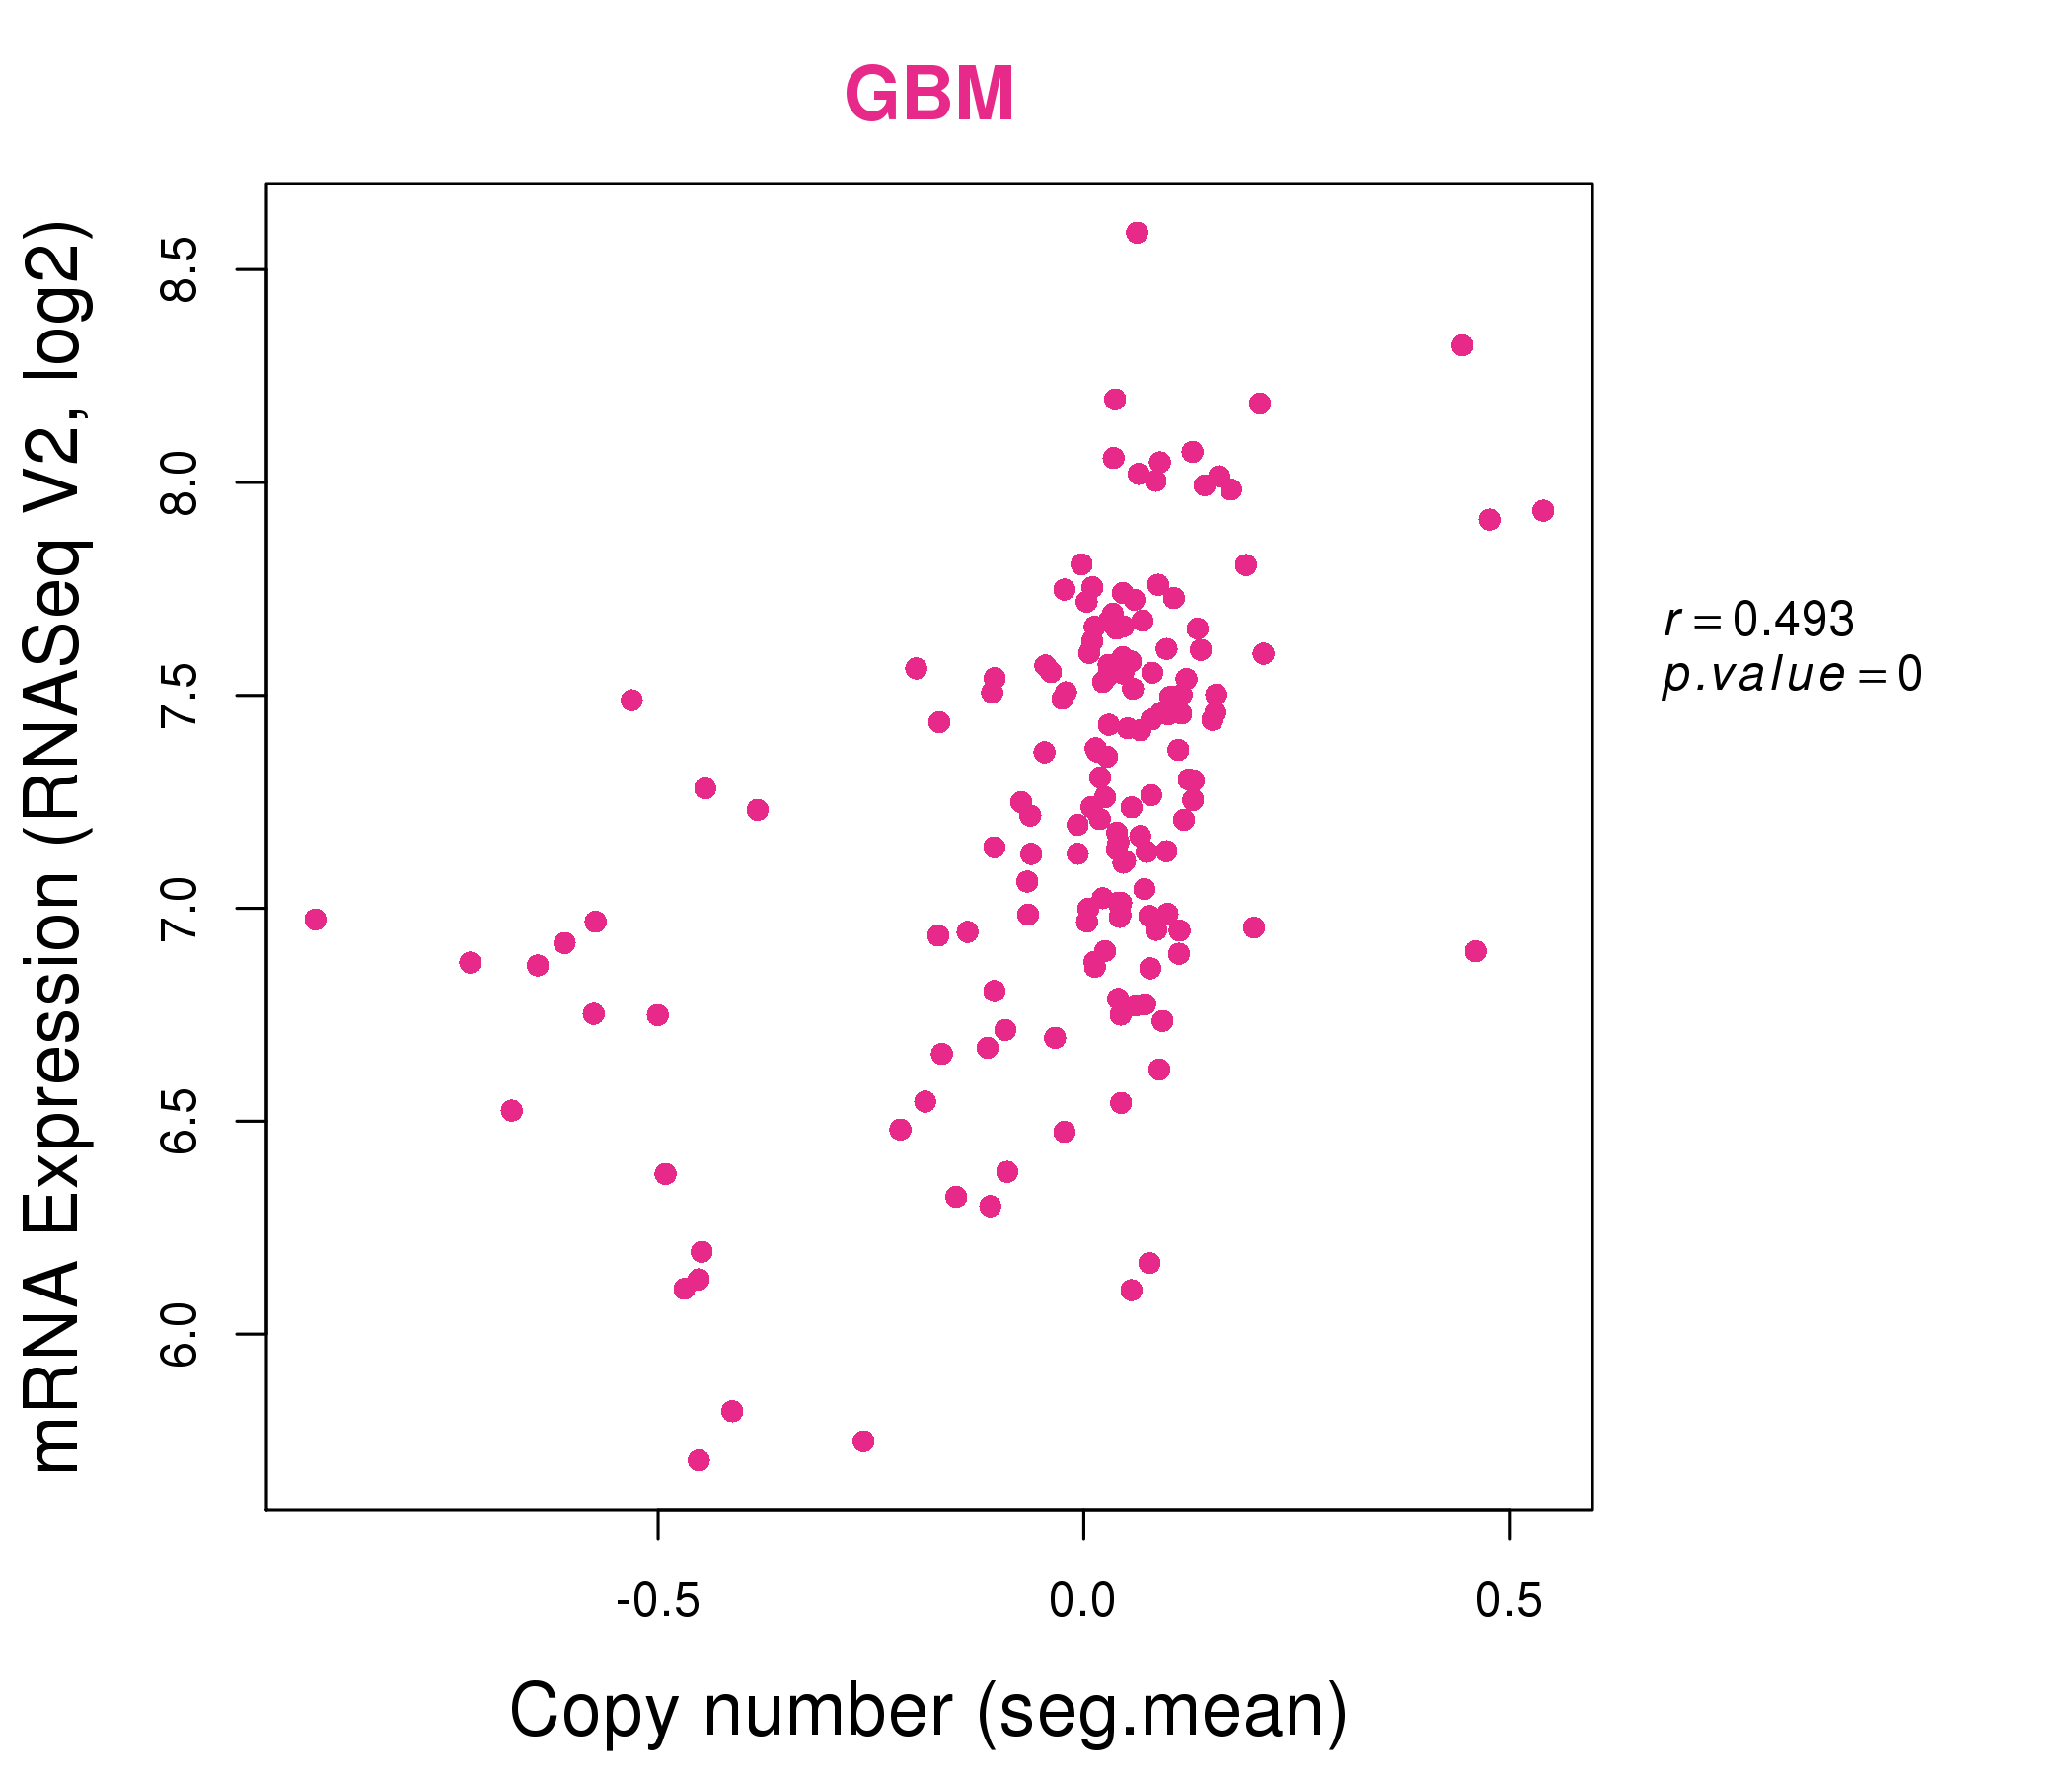
| * Copy number data were extracted from TCGA using R package TCGA-Assembler. The URLs of all public data files on TCGA DCC data server were gathered on Jan-05-2015. Function ProcessCNAData in TCGA-Assembler package was used to obtain gene-level copy number value which is calculated as the average copy number of the genomic region of a gene. |
 |
| cf) Tissue ID[Tissue type]: BLCA[Bladder Urothelial Carcinoma], BRCA[Breast invasive carcinoma], CESC[Cervical squamous cell carcinoma and endocervical adenocarcinoma], COAD[Colon adenocarcinoma], GBM[Glioblastoma multiforme], Glioma Low Grade, HNSC[Head and Neck squamous cell carcinoma], KICH[Kidney Chromophobe], KIRC[Kidney renal clear cell carcinoma], KIRP[Kidney renal papillary cell carcinoma], LAML[Acute Myeloid Leukemia], LUAD[Lung adenocarcinoma], LUSC[Lung squamous cell carcinoma], OV[Ovarian serous cystadenocarcinoma ], PAAD[Pancreatic adenocarcinoma], PRAD[Prostate adenocarcinoma], SKCM[Skin Cutaneous Melanoma], STAD[Stomach adenocarcinoma], THCA[Thyroid carcinoma], UCEC[Uterine Corpus Endometrial Carcinoma] |
| Top |
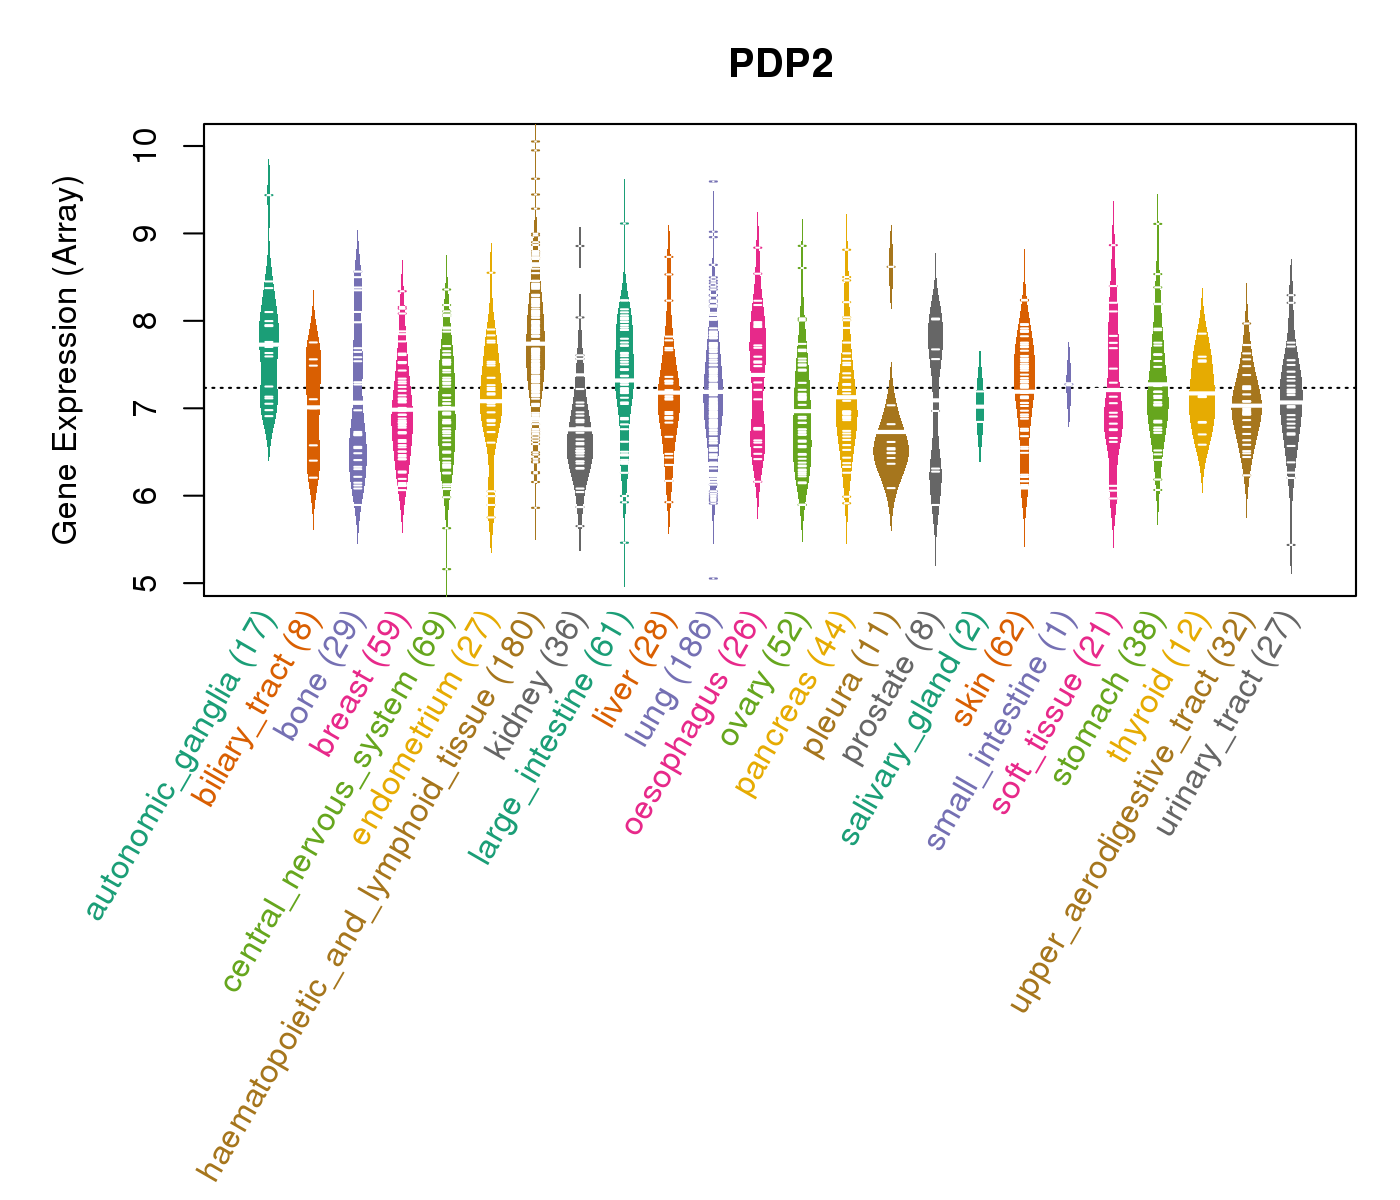
| Gene Expression for PDP2 |
| * CCLE gene expression data were extracted from CCLE_Expression_Entrez_2012-10-18.res: Gene-centric RMA-normalized mRNA expression data. |
 |
| * Normalized gene expression data of RNASeqV2 was extracted from TCGA using R package TCGA-Assembler. The URLs of all public data files on TCGA DCC data server were gathered at Jan-05-2015. Only eight cancer types have enough normal control samples for differential expression analysis. (t test, adjusted p<0.05 (using Benjamini-Hochberg FDR)) |
 |
| Top |
| * This plots show the correlation between CNV and gene expression. |
: Open all plots for all cancer types
 |
|
 |
|
| Top |
| Gene-Gene Network Information |
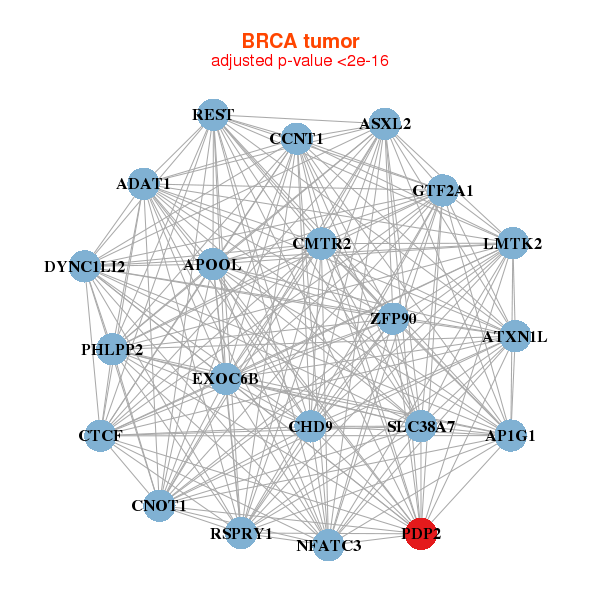
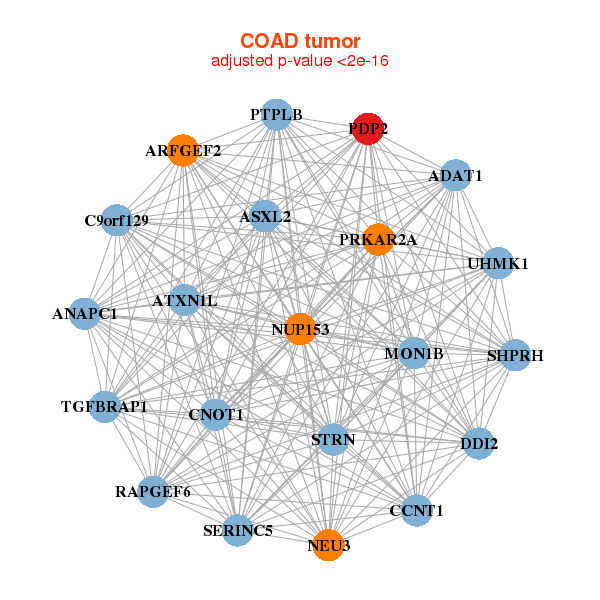
| * Co-Expression network figures were drawn using R package igraph. Only the top 20 genes with the highest correlations were shown. Red circle: input gene, orange circle: cell metabolism gene, sky circle: other gene |
: Open all plots for all cancer types
 |
|
| ADAT1,AP1G1,APOOL,ASXL2,ATXN1L,CCNT1,CHD9, CNOT1,CTCF,DYNC1LI2,EXOC6B,CMTR2,GTF2A1,LMTK2, NFATC3,PDP2,PHLPP2,REST,RSPRY1,SLC38A7,ZFP90 | ABCD2,ACSS3,ACVR1C,ADIPOQ,ADRBK2,ALDH6A1,ANO6, AQPEP,GPATCH11,EHHADH,EIF4EBP2,FAM13A,GABRE,GHR, KCNIP2,OXCT1,PDE3B,PDP2,PEX19,SIK2,SLC16A7 |
 |
|
| ADAT1,ANAPC1,ARFGEF2,ASXL2,ATXN1L,C9orf129,CCNT1, CNOT1,DDI2,MON1B,NEU3,NUP153,PDP2,PRKAR2A, PTPLB,RAPGEF6,SERINC5,SHPRH,STRN,TGFBRAP1,UHMK1 | ACVR1B,ADAM10,APAF1,ARFGEF1,ARFGEF2,ARHGAP32,ATP11B, ATP6V1A,BROX,PRR14L,CTNND1,FHDC1,FNIP2,LGR4, MARVELD2,MCTP2,NAPEPLD,NUMB,PDP2,PLD1,UTP14C |
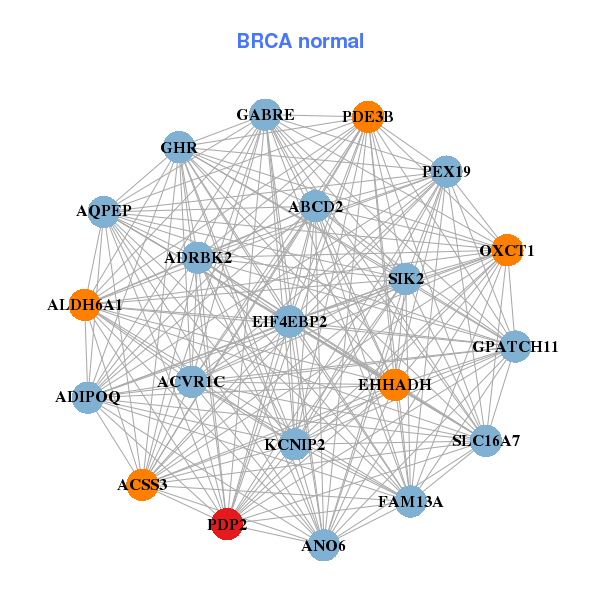
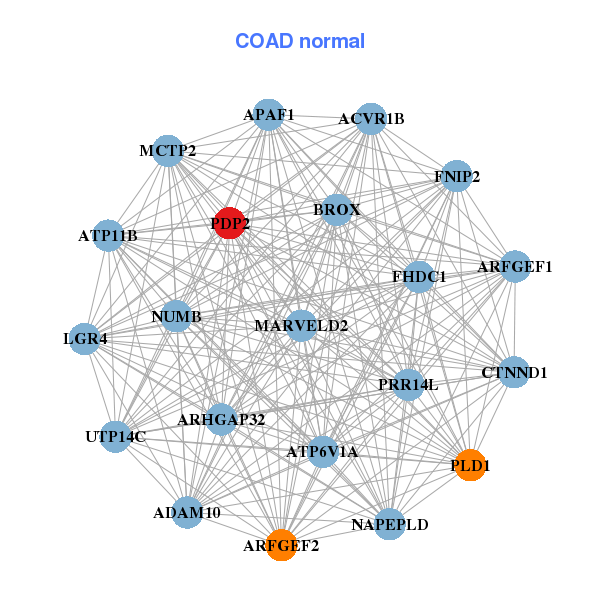
| * Co-Expression network figures were drawn using R package igraph. Only the top 20 genes with the highest correlations were shown. Red circle: input gene, orange circle: cell metabolism gene, sky circle: other gene |
: Open all plots for all cancer types
| Top |
: Open all interacting genes' information including KEGG pathway for all interacting genes from DAVID
| Top |
| Pharmacological Information for PDP2 |
| There's no related Drug. |
| Top |
| Cross referenced IDs for PDP2 |
| * We obtained these cross-references from Uniprot database. It covers 150 different DBs, 18 categories. http://www.uniprot.org/help/cross_references_section |
: Open all cross reference information
|
Copyright © 2016-Present - The Univsersity of Texas Health Science Center at Houston @ |