|
||||||||||||||||||||
| |
| Phenotypic Information (metabolism pathway, cancer, disease, phenome) |
| |
| |
| Gene-Gene Network Information: Co-Expression Network, Interacting Genes & KEGG |
| |
|


| Gene Summary for GPAM |
| Top |
| Phenotypic Information for GPAM(metabolism pathway, cancer, disease, phenome) |
| Cancer | CGAP: GPAM |
| Familial Cancer Database: GPAM | |
| * This gene is included in those cancer gene databases. |
|
|
|
|
|
|
| ||||||||||||||
Oncogene 1 | Significant driver gene in | |||||||||||||||||||
| cf) number; DB name 1 Oncogene; http://nar.oxfordjournals.org/content/35/suppl_1/D721.long, 2 Tumor Suppressor gene; https://bioinfo.uth.edu/TSGene/, 3 Cancer Gene Census; http://www.nature.com/nrc/journal/v4/n3/abs/nrc1299.html, 4 CancerGenes; http://nar.oxfordjournals.org/content/35/suppl_1/D721.long, 5 Network of Cancer Gene; http://ncg.kcl.ac.uk/index.php, 1Therapeutic Vulnerabilities in Cancer; http://cbio.mskcc.org/cancergenomics/statius/ |
| KEGG_GLYCEROLIPID_METABOLISM KEGG_GLYCEROPHOSPHOLIPID_METABOLISM REACTOME_PHOSPHOLIPID_METABOLISM REACTOME_METABOLISM_OF_LIPIDS_AND_LIPOPROTEINS | |
| OMIM | |
| Orphanet | |
| Disease | KEGG Disease: GPAM |
| MedGen: GPAM (Human Medical Genetics with Condition) | |
| ClinVar: GPAM | |
| Phenotype | MGI: GPAM (International Mouse Phenotyping Consortium) |
| PhenomicDB: GPAM | |
| Mutations for GPAM |
| * Under tables are showing count per each tissue to give us broad intuition about tissue specific mutation patterns.You can go to the detailed page for each mutation database's web site. |
| - Statistics for Tissue and Mutation type | Top |
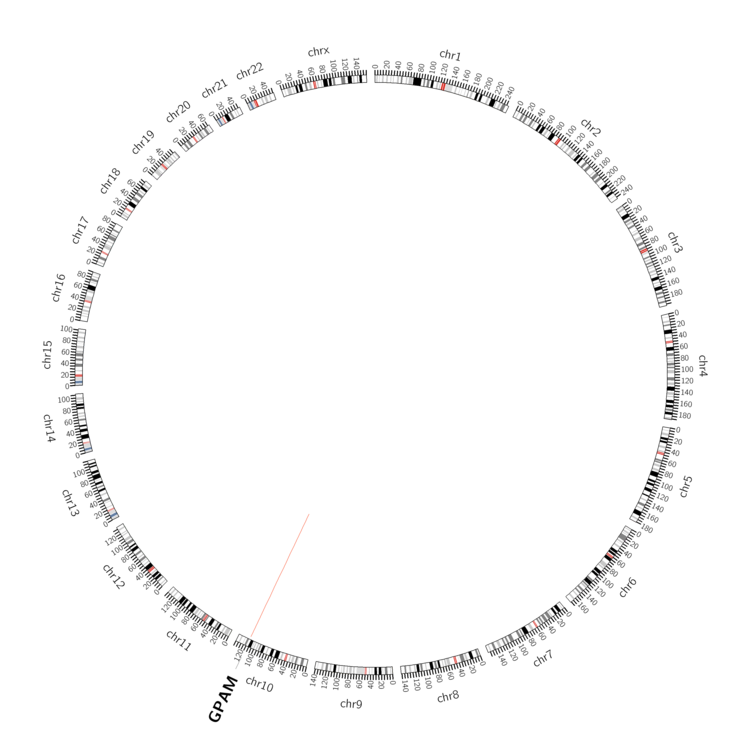 |
| - For Inter-chromosomal Variations |
| There's no inter-chromosomal structural variation. |
| - For Intra-chromosomal Variations |
| * Intra-chromosomal variantions includes 'intrachromosomal amplicon to amplicon', 'intrachromosomal amplicon to non-amplified dna', 'intrachromosomal deletion', 'intrachromosomal fold-back inversion', 'intrachromosomal inversion', 'intrachromosomal tandem duplication', 'Intrachromosomal unknown type', 'intrachromosomal with inverted orientation', 'intrachromosomal with non-inverted orientation'. |
 |
| Sample | Symbol_a | Chr_a | Start_a | End_a | Symbol_b | Chr_b | Start_b | End_b |
| ovary | GPAM | chr10 | 113935444 | 113935464 | GPAM | chr10 | 113935532 | 113935552 |
| cf) Tissue number; Tissue name (1;Breast, 2;Central_nervous_system, 3;Haematopoietic_and_lymphoid_tissue, 4;Large_intestine, 5;Liver, 6;Lung, 7;Ovary, 8;Pancreas, 9;Prostate, 10;Skin, 11;Soft_tissue, 12;Upper_aerodigestive_tract) |
| * From mRNA Sanger sequences, Chitars2.0 arranged chimeric transcripts. This table shows GPAM related fusion information. |
| ID | Head Gene | Tail Gene | Accession | Gene_a | qStart_a | qEnd_a | Chromosome_a | tStart_a | tEnd_a | Gene_a | qStart_a | qEnd_a | Chromosome_a | tStart_a | tEnd_a |
| BM710854 | GPAM | 1 | 324 | 10 | 113915622 | 113917140 | PRKCB | 324 | 419 | 16 | 24231281 | 24231376 | |
| Top |
| There's no copy number variation information in COSMIC data for this gene. |
| Top |
|
 |
| Top |
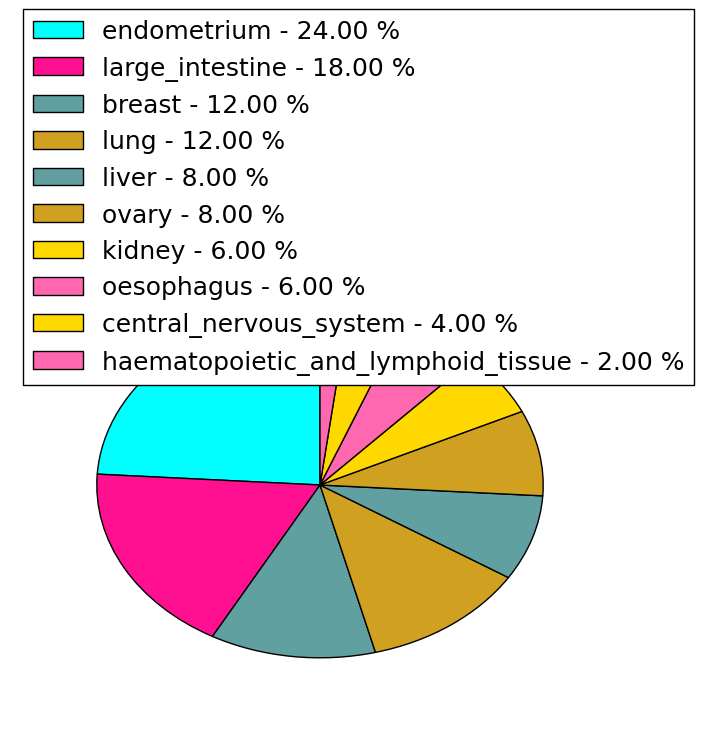
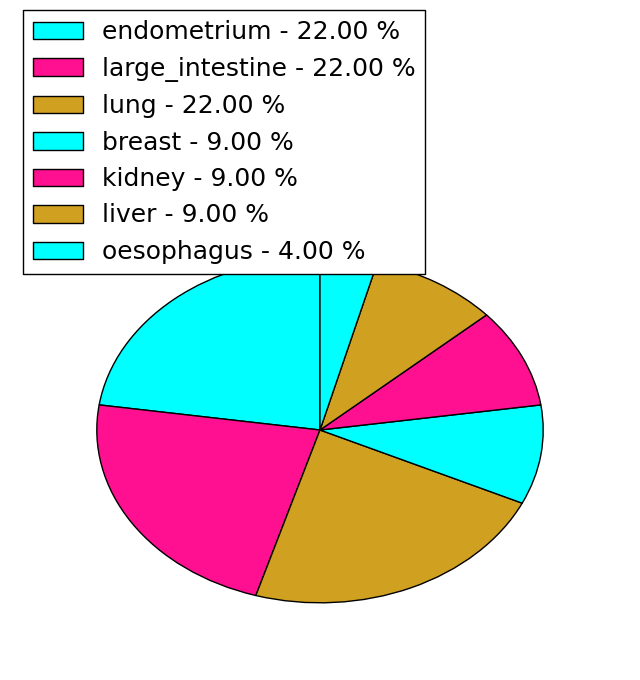
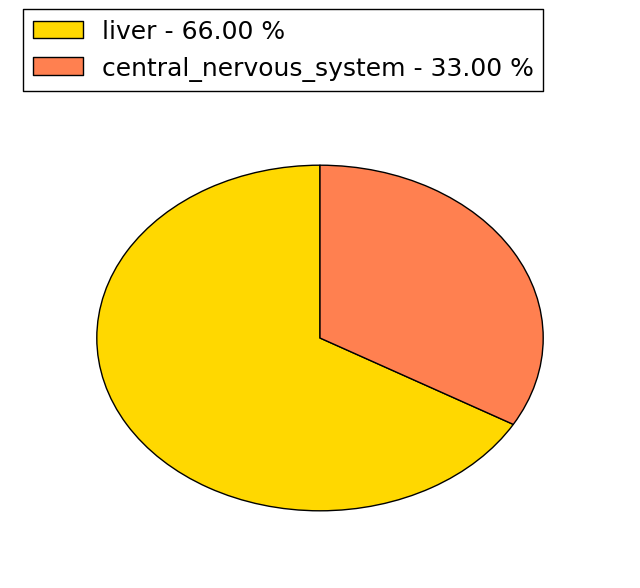
| Stat. for Non-Synonymous SNVs (# total SNVs=50) | (# total SNVs=22) |
 |  |
(# total SNVs=3) | (# total SNVs=2) |
 | 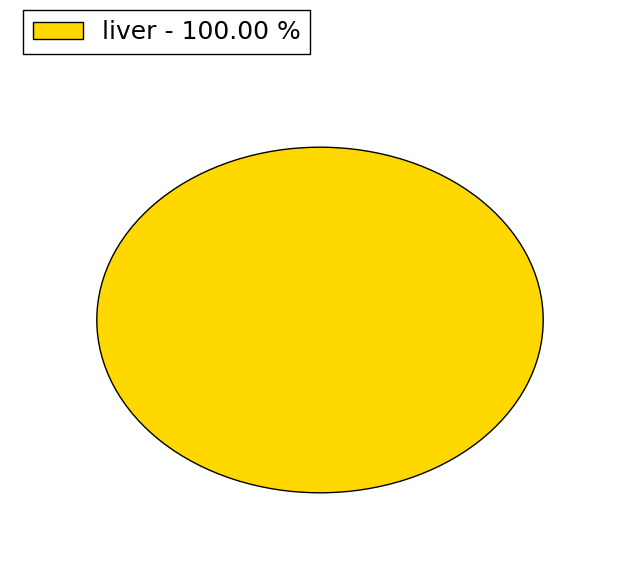 |
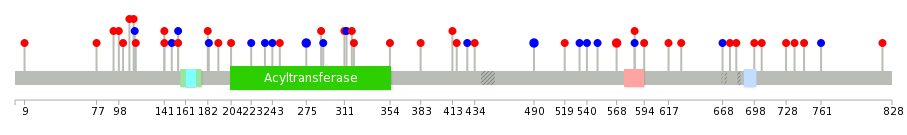
| Top |
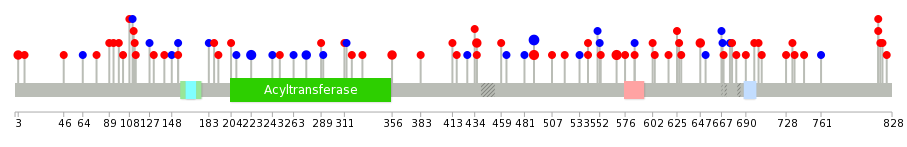
| * When you move the cursor on each content, you can see more deailed mutation information on the Tooltip. Those are primary_site,primary_histology,mutation(aa),pubmedID. |
| GRCh37 position | Mutation(aa) | Unique sampleID count |
| chr10:113921449-113921449 | p.C490C | 4 |
| chr10:113920419-113920419 | p.E568K | 3 |
| chr10:113921450-113921450 | p.C490F | 3 |
| chr10:113913352-113913352 | p.R815* | 3 |
| chr10:113924283-113924283 | p.R436K | 3 |
| chr10:113932065-113932065 | p.P223P | 3 |
| chr10:113918114-113918114 | p.V647G | 2 |
| chr10:113928680-113928680 | p.F275F | 2 |
| chr10:113941536-113941536 | p.E3K | 2 |
| chr10:113928110-113928110 | p.Y356C | 2 |
| Top |
|
 |
| Point Mutation/ Tissue ID | 1 | 2 | 3 | 4 | 5 | 6 | 7 | 8 | 9 | 10 | 11 | 12 | 13 | 14 | 15 | 16 | 17 | 18 | 19 | 20 |
| # sample | 1 | 2 | 7 | 2 | 2 | 7 | 4 | 2 | 1 | 4 | 6 | 1 | 11 | |||||||
| # mutation | 2 | 2 | 7 | 2 | 2 | 7 | 4 | 2 | 1 | 6 | 7 | 1 | 13 | |||||||
| nonsynonymous SNV | 1 | 5 | 2 | 1 | 4 | 2 | 2 | 1 | 4 | 7 | 9 | |||||||||
| synonymous SNV | 2 | 1 | 2 | 1 | 3 | 2 | 2 | 1 | 4 |
| cf) Tissue ID; Tissue type (1; BLCA[Bladder Urothelial Carcinoma], 2; BRCA[Breast invasive carcinoma], 3; CESC[Cervical squamous cell carcinoma and endocervical adenocarcinoma], 4; COAD[Colon adenocarcinoma], 5; GBM[Glioblastoma multiforme], 6; Glioma Low Grade, 7; HNSC[Head and Neck squamous cell carcinoma], 8; KICH[Kidney Chromophobe], 9; KIRC[Kidney renal clear cell carcinoma], 10; KIRP[Kidney renal papillary cell carcinoma], 11; LAML[Acute Myeloid Leukemia], 12; LUAD[Lung adenocarcinoma], 13; LUSC[Lung squamous cell carcinoma], 14; OV[Ovarian serous cystadenocarcinoma ], 15; PAAD[Pancreatic adenocarcinoma], 16; PRAD[Prostate adenocarcinoma], 17; SKCM[Skin Cutaneous Melanoma], 18:STAD[Stomach adenocarcinoma], 19:THCA[Thyroid carcinoma], 20:UCEC[Uterine Corpus Endometrial Carcinoma]) |
| Top |
| * We represented just top 10 SNVs. When you move the cursor on each content, you can see more deailed mutation information on the Tooltip. Those are primary_site, primary_histology, mutation(aa), pubmedID. |
| Genomic Position | Mutation(aa) | Unique sampleID count |
| chr10:113920419 | p.E568K,GPAM | 2 |
| chr10:113921449 | p.F275F,GPAM | 2 |
| chr10:113928680 | p.C490C,GPAM | 2 |
| chr10:113915699 | p.I585I,GPAM | 1 |
| chr10:113931986 | p.F313F,GPAM | 1 |
| chr10:113920366 | p.E141D,GPAM | 1 |
| chr10:113933594 | p.I585V,GPAM | 1 |
| chr10:113924352 | p.E311D,GPAM | 1 |
| chr10:113915727 | p.E141K,GPAM | 1 |
| chr10:113932005 | p.L291L,GPAM | 1 |
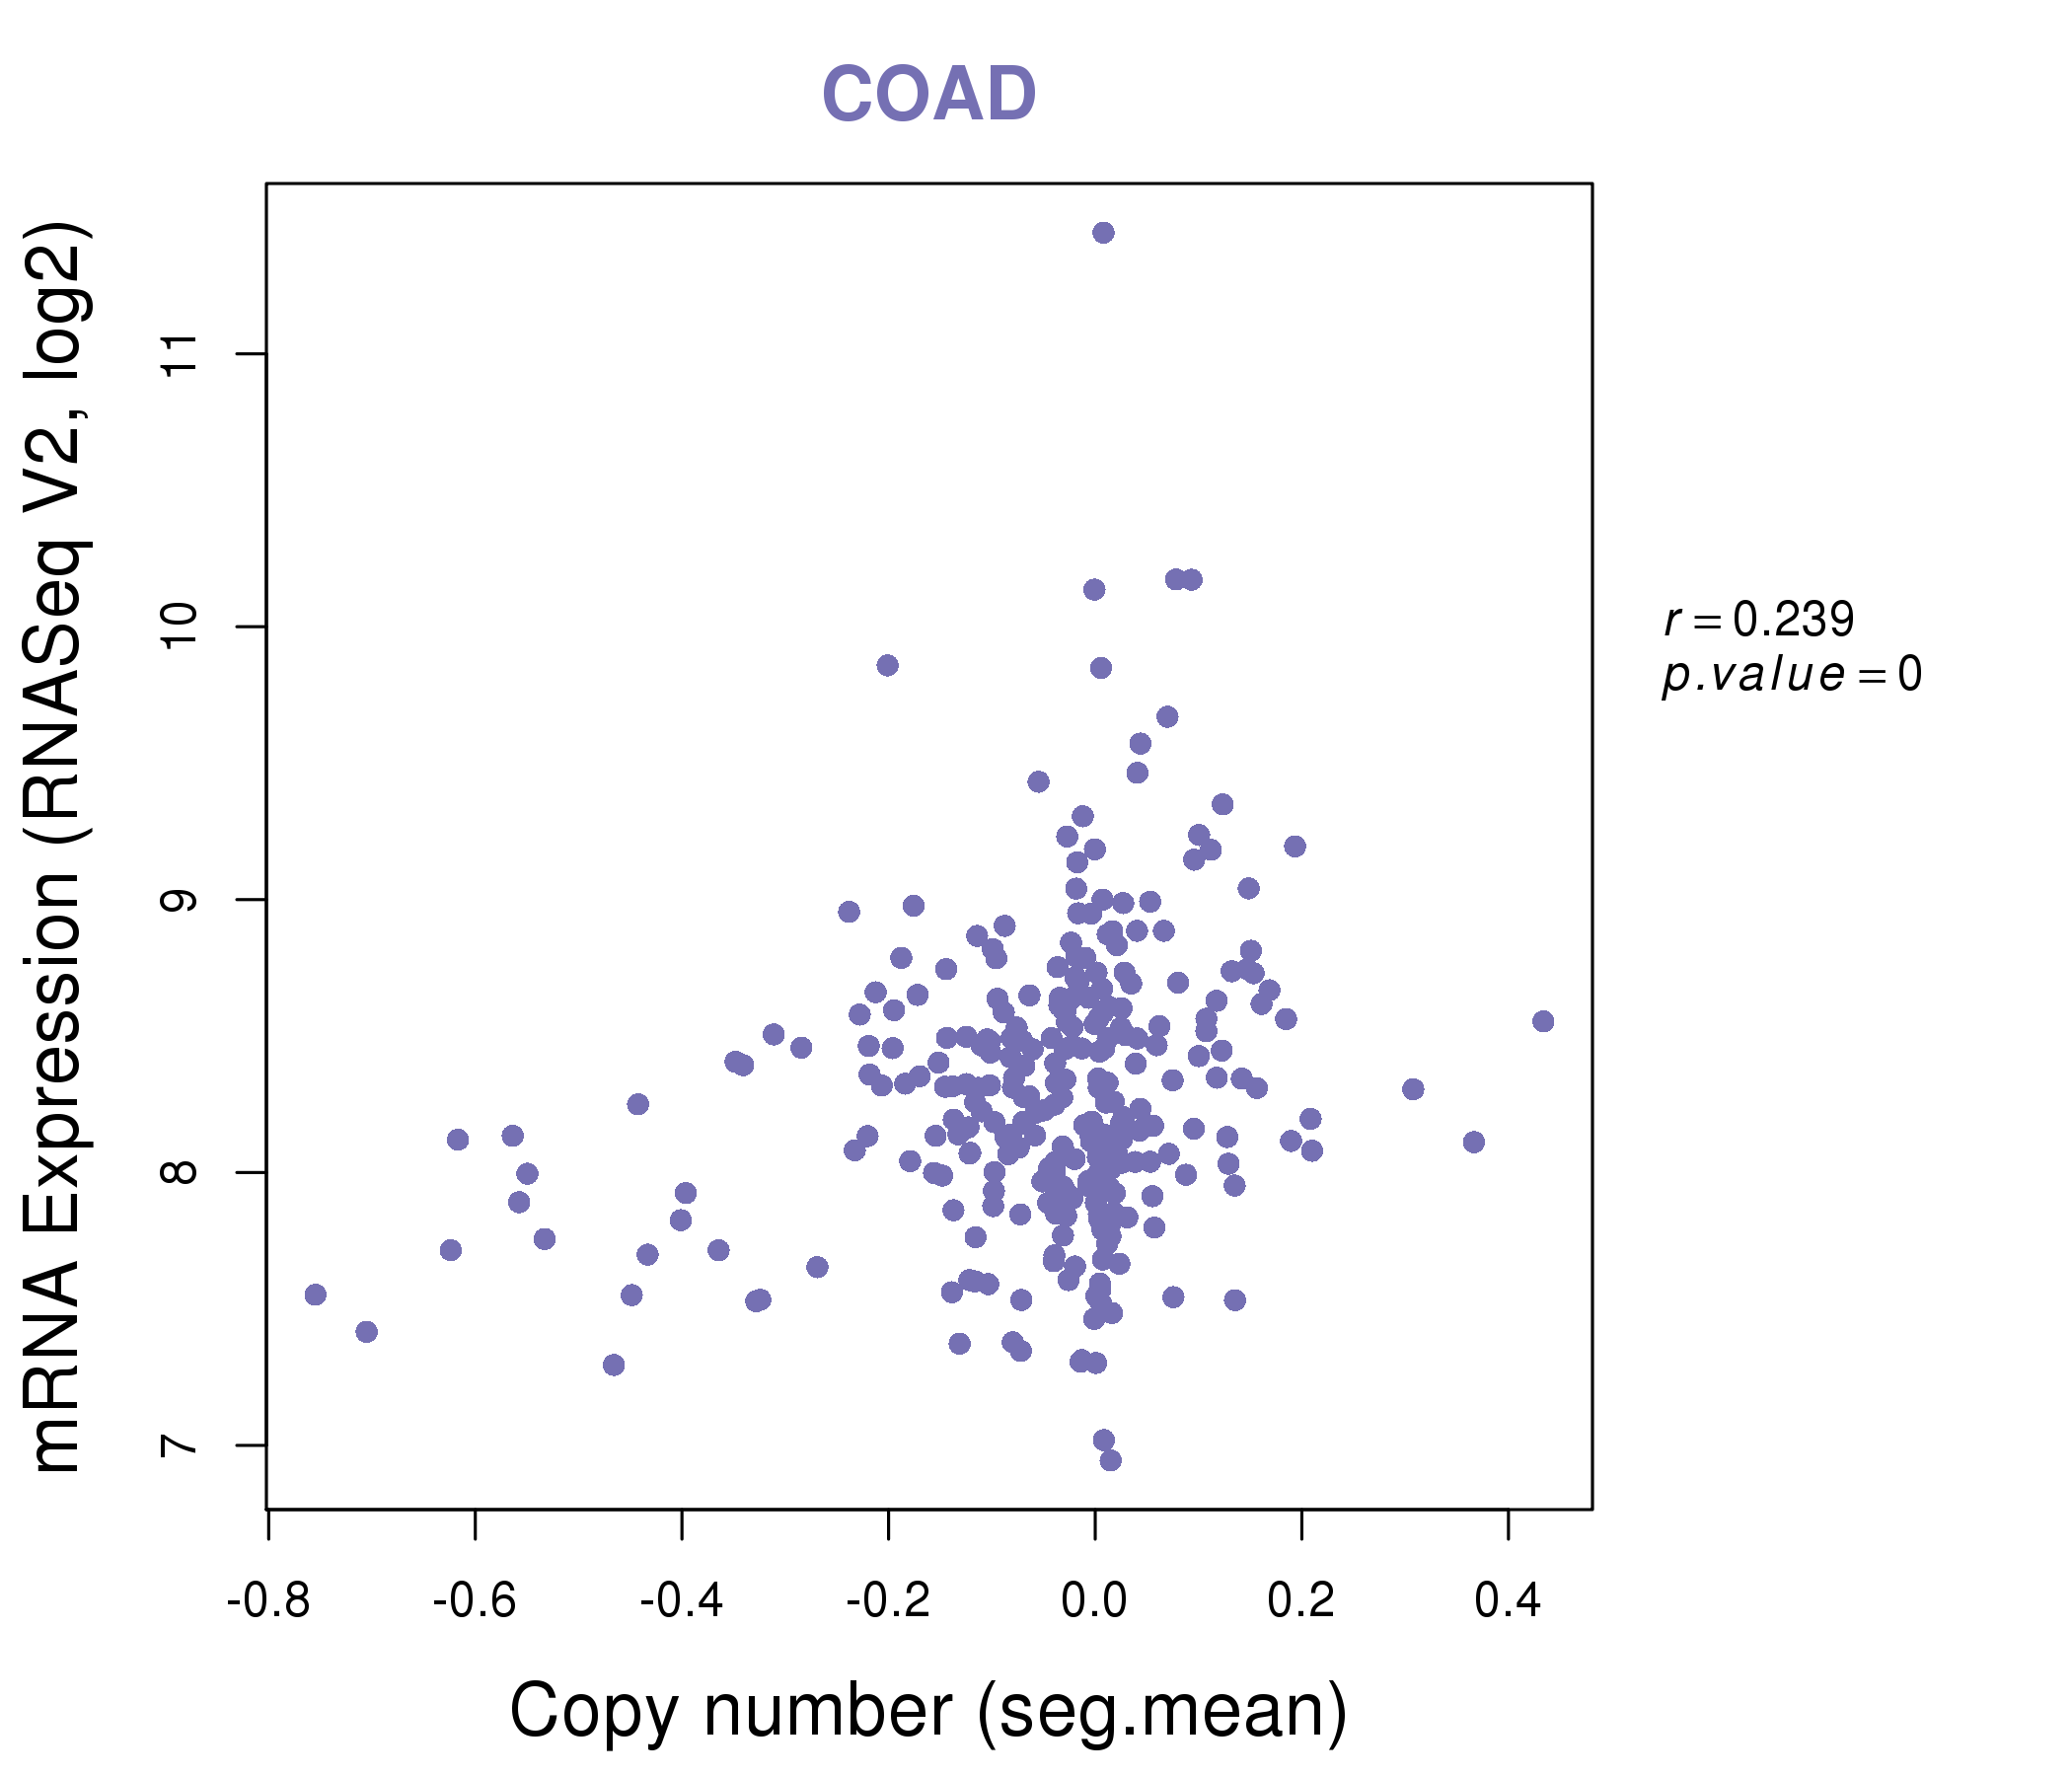
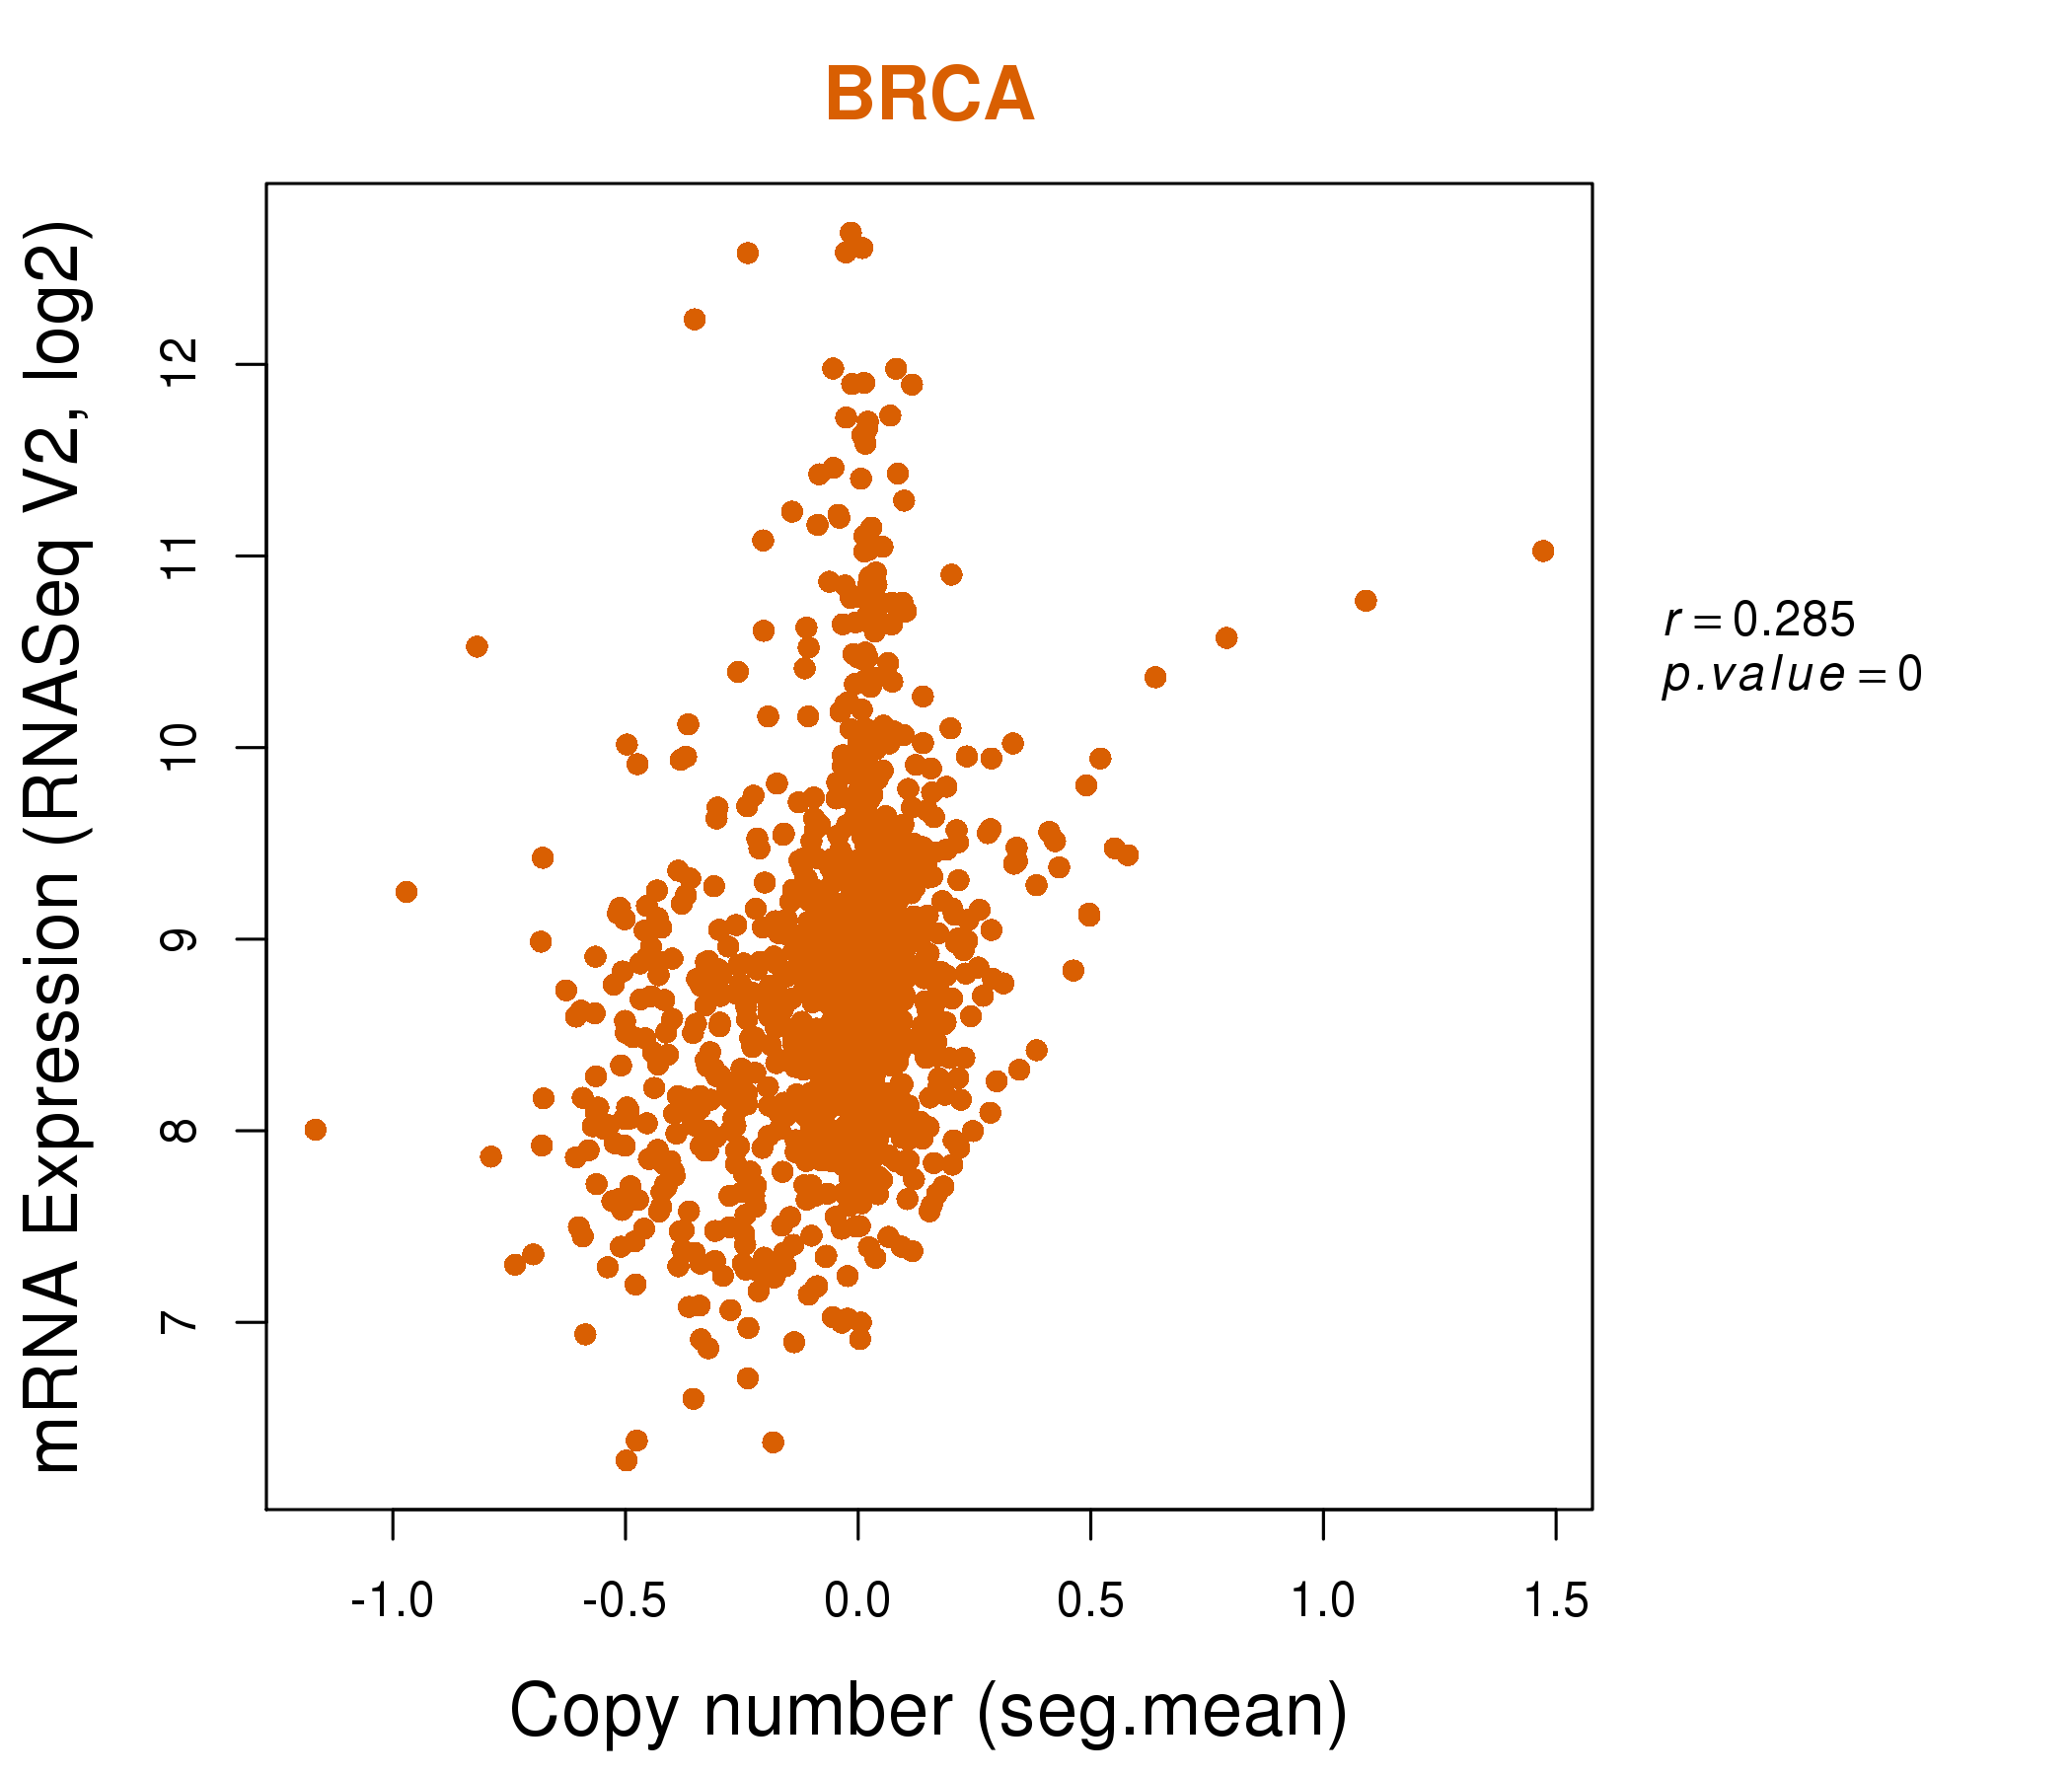
| * Copy number data were extracted from TCGA using R package TCGA-Assembler. The URLs of all public data files on TCGA DCC data server were gathered on Jan-05-2015. Function ProcessCNAData in TCGA-Assembler package was used to obtain gene-level copy number value which is calculated as the average copy number of the genomic region of a gene. |
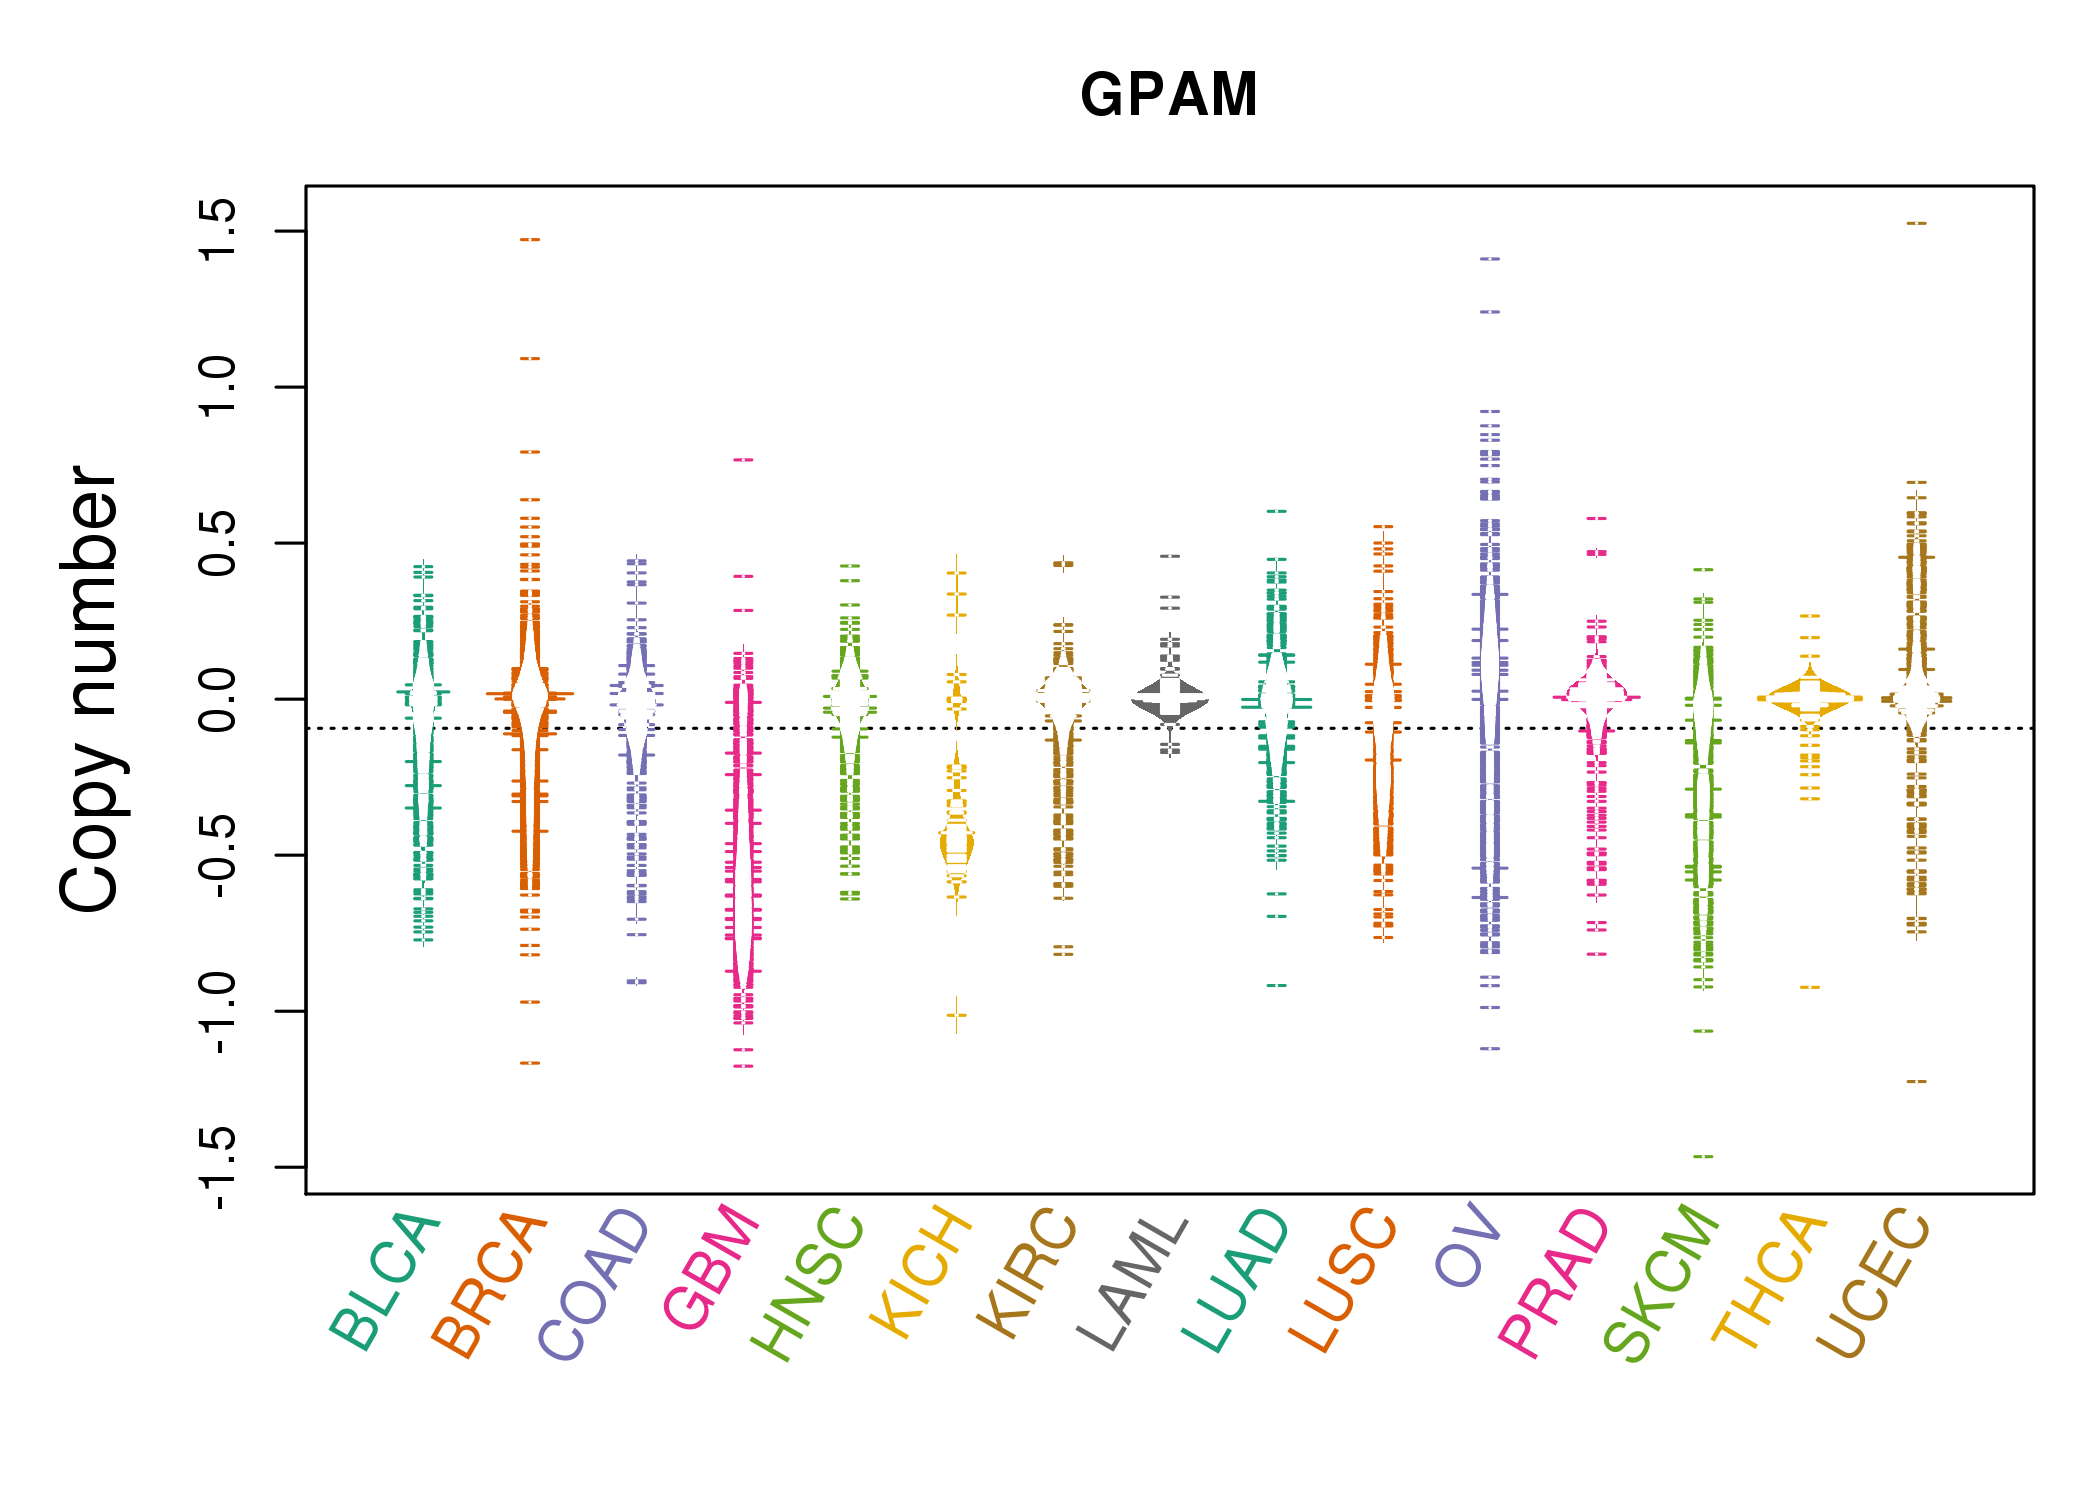 |
| cf) Tissue ID[Tissue type]: BLCA[Bladder Urothelial Carcinoma], BRCA[Breast invasive carcinoma], CESC[Cervical squamous cell carcinoma and endocervical adenocarcinoma], COAD[Colon adenocarcinoma], GBM[Glioblastoma multiforme], Glioma Low Grade, HNSC[Head and Neck squamous cell carcinoma], KICH[Kidney Chromophobe], KIRC[Kidney renal clear cell carcinoma], KIRP[Kidney renal papillary cell carcinoma], LAML[Acute Myeloid Leukemia], LUAD[Lung adenocarcinoma], LUSC[Lung squamous cell carcinoma], OV[Ovarian serous cystadenocarcinoma ], PAAD[Pancreatic adenocarcinoma], PRAD[Prostate adenocarcinoma], SKCM[Skin Cutaneous Melanoma], STAD[Stomach adenocarcinoma], THCA[Thyroid carcinoma], UCEC[Uterine Corpus Endometrial Carcinoma] |
| Top |
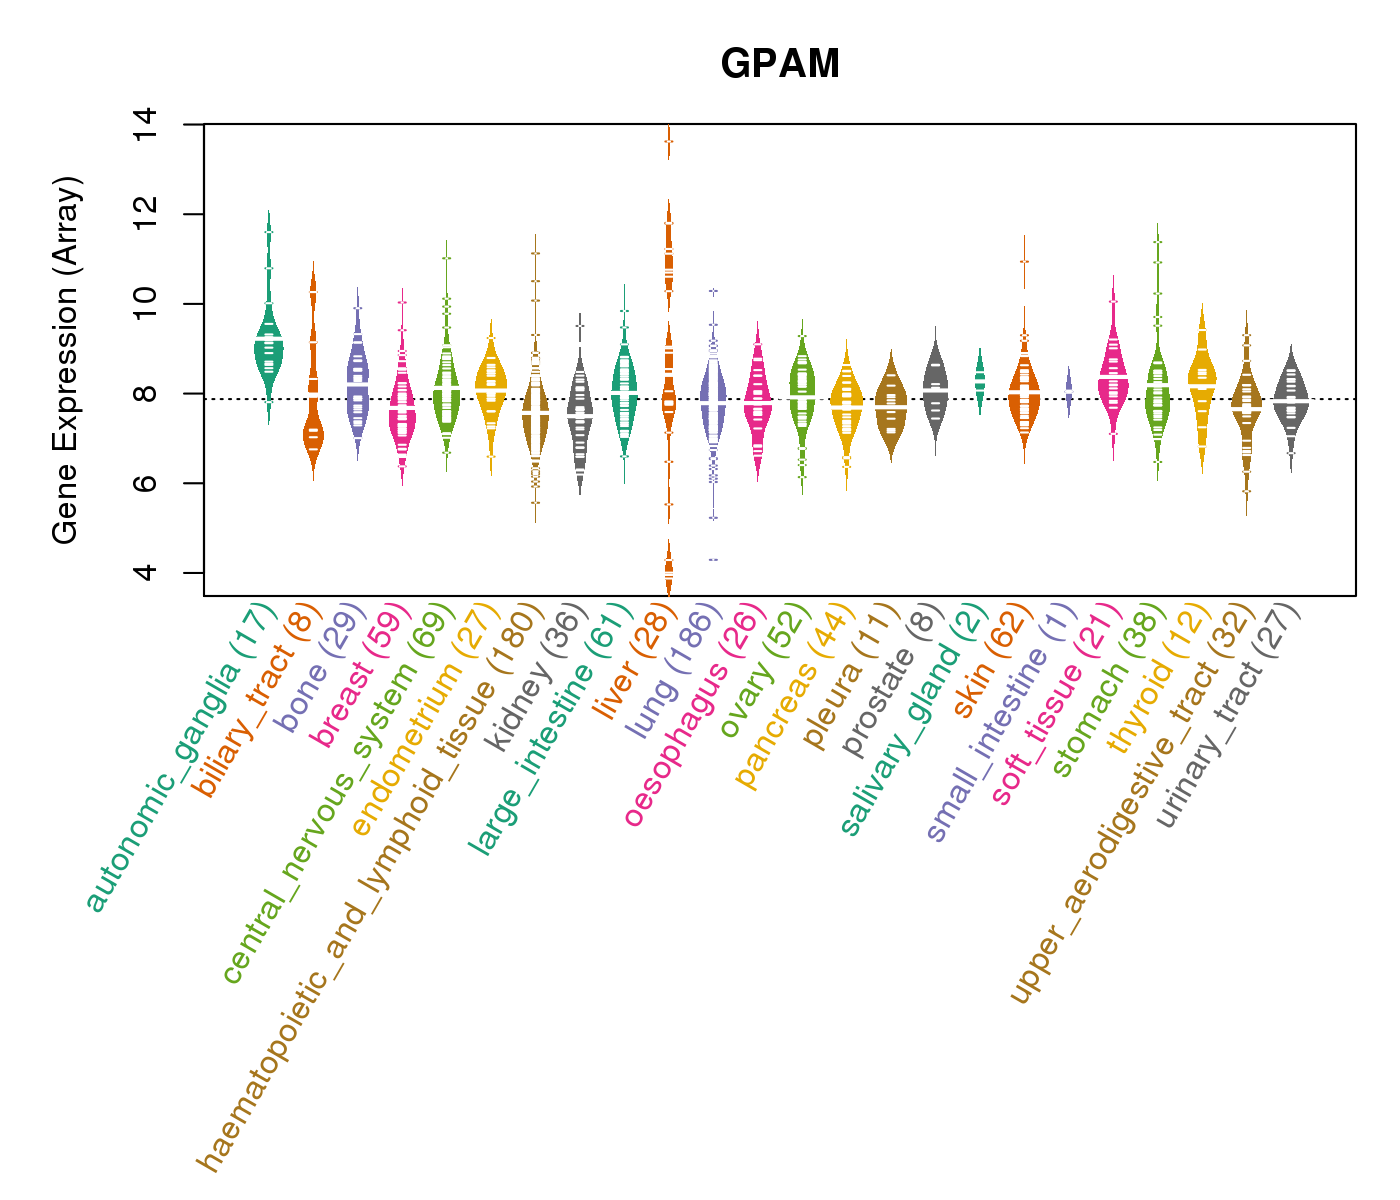
| Gene Expression for GPAM |
| * CCLE gene expression data were extracted from CCLE_Expression_Entrez_2012-10-18.res: Gene-centric RMA-normalized mRNA expression data. |
 |
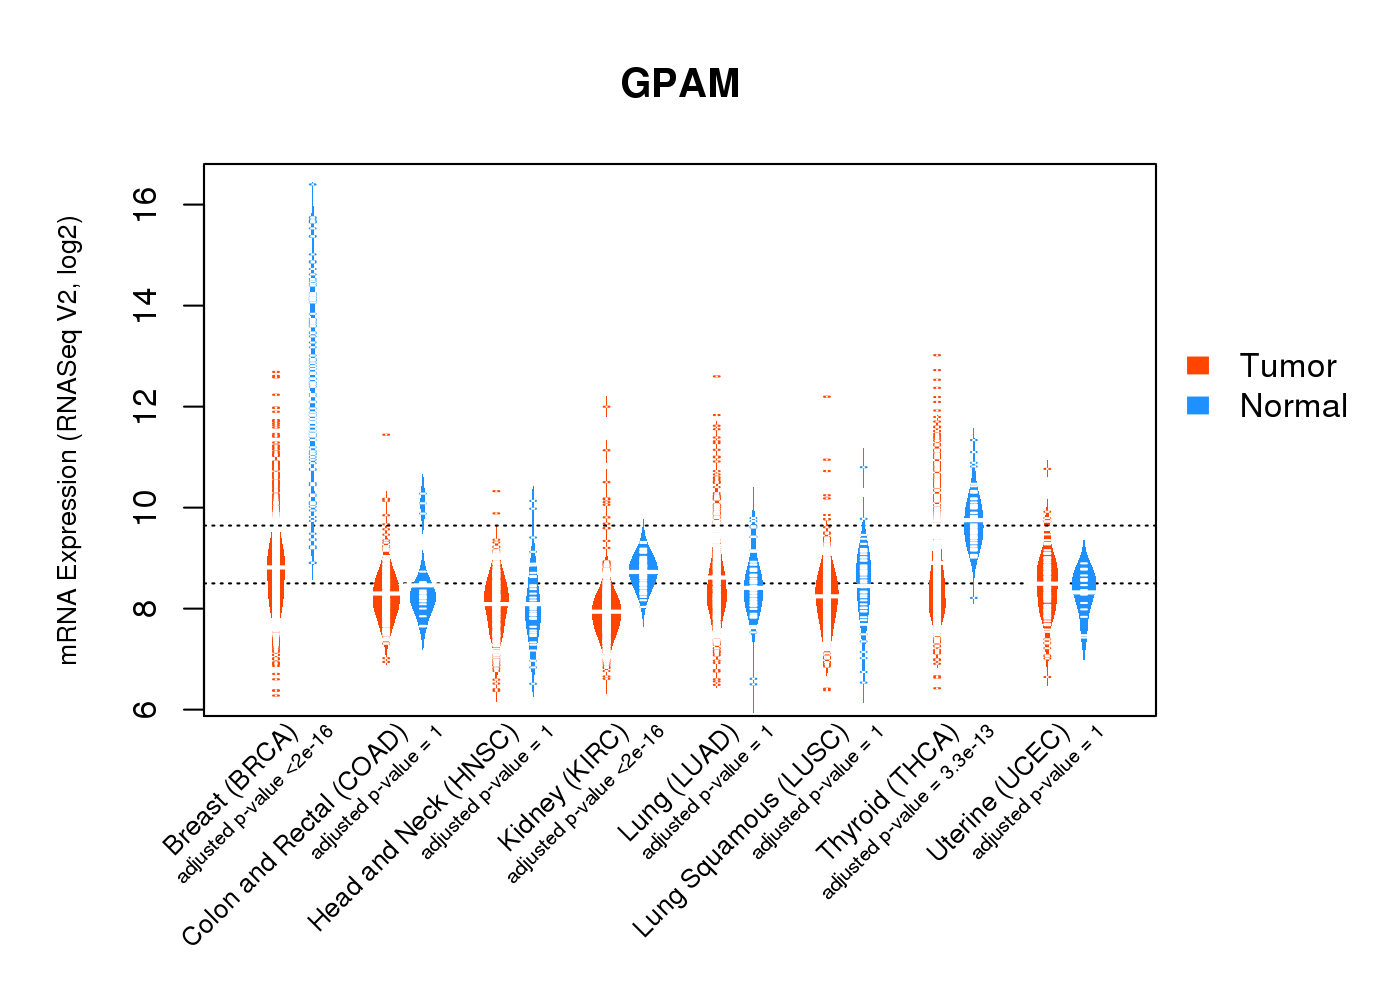
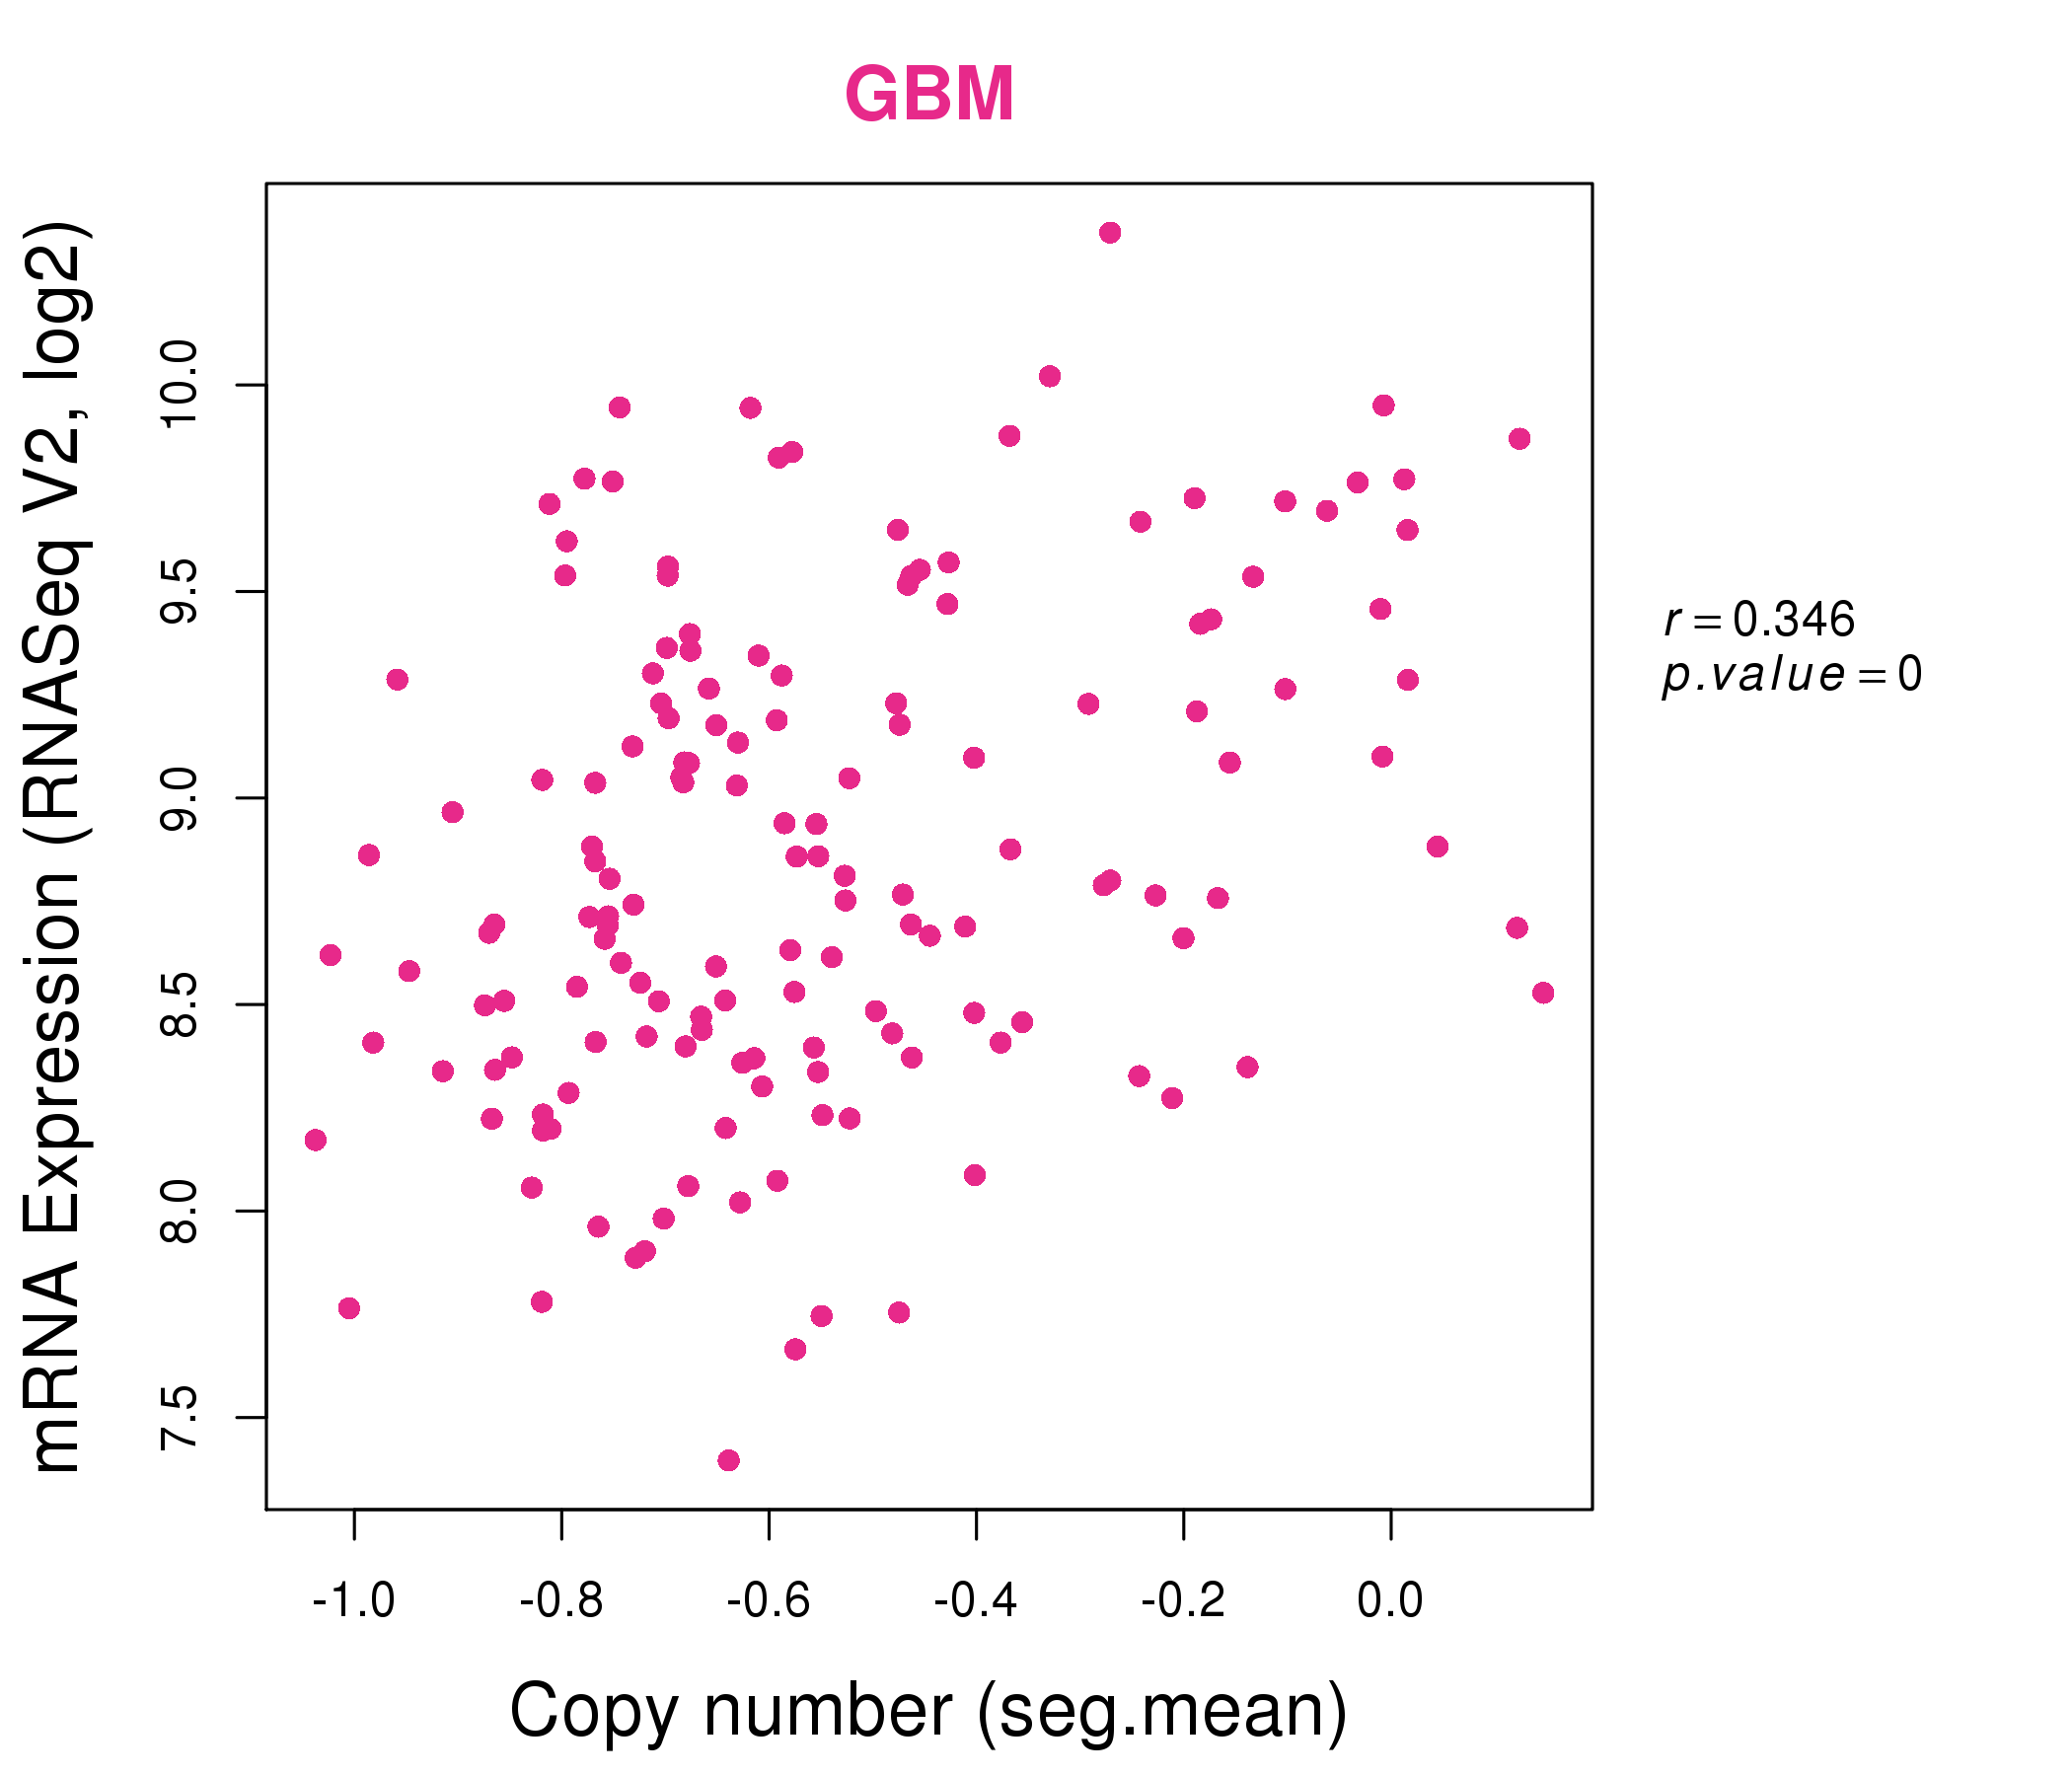
| * Normalized gene expression data of RNASeqV2 was extracted from TCGA using R package TCGA-Assembler. The URLs of all public data files on TCGA DCC data server were gathered at Jan-05-2015. Only eight cancer types have enough normal control samples for differential expression analysis. (t test, adjusted p<0.05 (using Benjamini-Hochberg FDR)) |
 |
| Top |
| * This plots show the correlation between CNV and gene expression. |
: Open all plots for all cancer types
 |
|
 |
|
| Top |
| Gene-Gene Network Information |
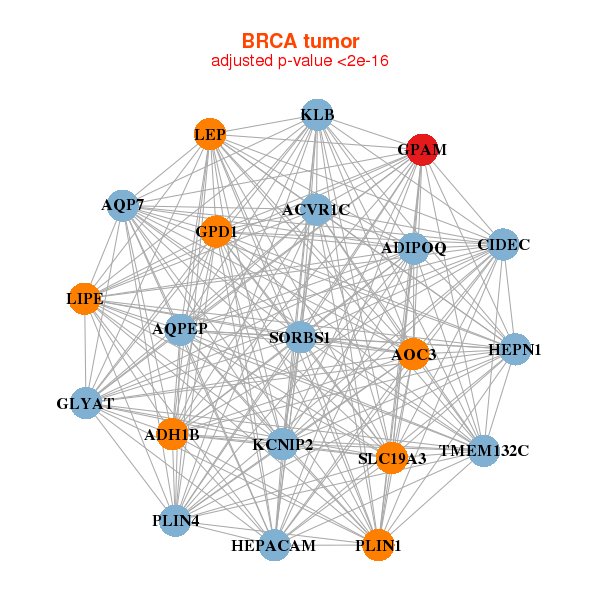
| * Co-Expression network figures were drawn using R package igraph. Only the top 20 genes with the highest correlations were shown. Red circle: input gene, orange circle: cell metabolism gene, sky circle: other gene |
: Open all plots for all cancer types
 |
|
| ACVR1C,ADH1B,ADIPOQ,AOC3,AQP7,AQPEP,CIDEC, GLYAT,GPAM,GPD1,HEPACAM,HEPN1,KCNIP2,KLB, LEP,LIPE,PLIN1,PLIN4,SLC19A3,SORBS1,TMEM132C | ABCD2,ACER3,ACO1,ACSL1,ADIPOR2,ADRBK2,DMGDH, ESYT1,GPAM,HRASLS5,LPL,SLC25A51,MMD,MARC1, MRAS,PEX19,PLIN1,PRKAR2B,PYGL,TSPAN3,VKORC1L1 |
 |
|
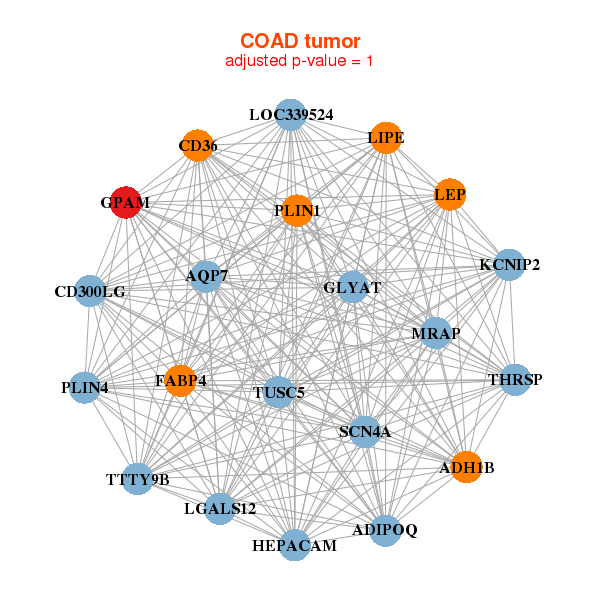
| ADH1B,ADIPOQ,AQP7,CD300LG,CD36,FABP4,GLYAT, GPAM,HEPACAM,KCNIP2,LEP,LGALS12,LIPE,LOC339524, MRAP,PLIN1,PLIN4,SCN4A,THRSP,TTTY9B,TUSC5 | ADIPOQ,CIDEA,DGAT2,FABP4,FCN2,G0S2,GPAM, KCNIP2,KRT79,LGALS12,LOC283392,LPL,MRAP,NAT8L, PFKFB1,PLIN1,SAA1,SCD,SLC7A10,THRSP,TUSC5 |
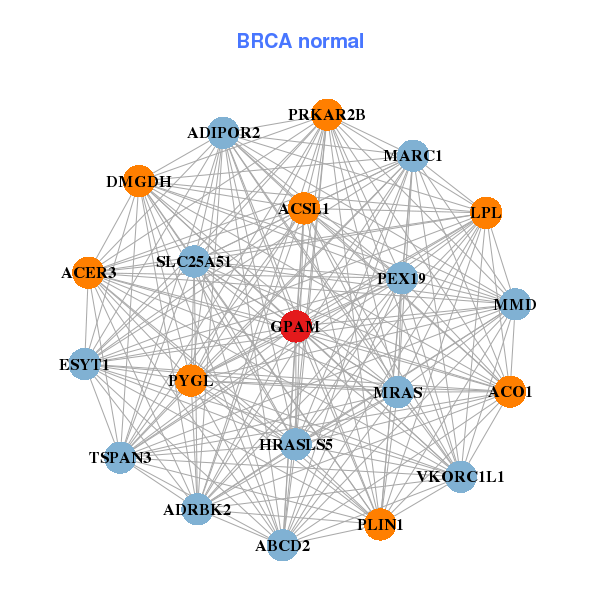
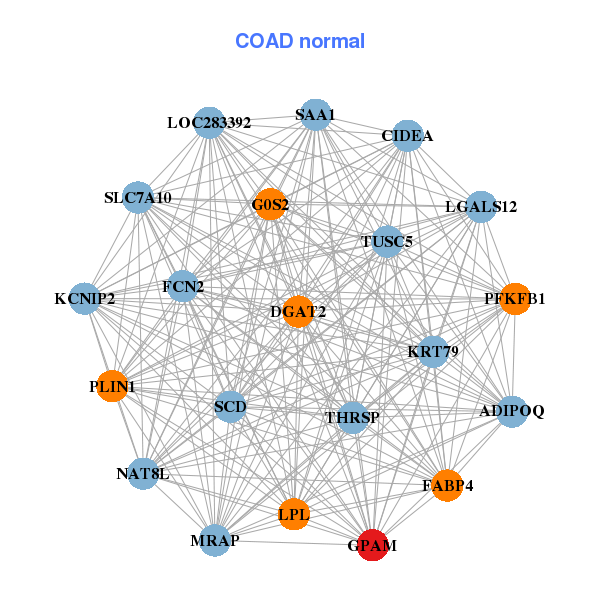
| * Co-Expression network figures were drawn using R package igraph. Only the top 20 genes with the highest correlations were shown. Red circle: input gene, orange circle: cell metabolism gene, sky circle: other gene |
: Open all plots for all cancer types
| Top |
: Open all interacting genes' information including KEGG pathway for all interacting genes from DAVID
| Top |
| Pharmacological Information for GPAM |
| There's no related Drug. |
| Top |
| Cross referenced IDs for GPAM |
| * We obtained these cross-references from Uniprot database. It covers 150 different DBs, 18 categories. http://www.uniprot.org/help/cross_references_section |
: Open all cross reference information
|
Copyright © 2016-Present - The Univsersity of Texas Health Science Center at Houston @ |