|
||||||||||||||||||||||||||||||||||||||||||||||||||||||||||||||||||||||||||||||||||||||||||||||||||||||||||||||||||||||||||||||||||||||||||||||||||||||||||||||||||||||||||||||||||||||||||||||||||||||||||||||||||||||||||||||||||||||||||||||||||||||||||||||||||||||||||||||||||||||||||||||||||||||||||||||||||||||||||
| |
| Phenotypic Information (metabolism pathway, cancer, disease, phenome) |
| |
| |
| Gene-Gene Network Information: Co-Expression Network, Interacting Genes & KEGG |
| |
|


| Gene Summary for TRIB3 |
| Basic gene info. | Gene symbol | TRIB3 |
| Gene name | tribbles pseudokinase 3 | |
| Synonyms | C20orf97|NIPK|SINK|SKIP3|TRB3 | |
| Cytomap | UCSC genome browser: 20p13-p12.2 | |
| Genomic location | chr20 :361307-378203 | |
| Type of gene | protein-coding | |
| RefGenes | NM_001301188.1, NM_001301190.1,NM_001301193.1,NM_001301196.1,NM_001301201.1, NM_021158.4, | |
| Ensembl id | ENSG00000101255 | |
| Description | TRB-3neuronal cell death inducible putative kinaseneuronal cell death-inducible putative kinasep65-interacting inhibitor of NF-kappa-Bp65-interacting inhibitor of NF-kappaBtribbles homolog 3 | |
| Modification date | 20141207 | |
| dbXrefs | MIM : 607898 | |
| HGNC : HGNC | ||
| Ensembl : ENSG00000101255 | ||
| HPRD : 09836 | ||
| Vega : OTTHUMG00000031627 | ||
| Protein | UniProt: Q96RU7 go to UniProt's Cross Reference DB Table | |
| Expression | CleanEX: HS_TRIB3 | |
| BioGPS: 57761 | ||
| Gene Expression Atlas: ENSG00000101255 | ||
| The Human Protein Atlas: ENSG00000101255 | ||
| Pathway | NCI Pathway Interaction Database: TRIB3 | |
| KEGG: TRIB3 | ||
| REACTOME: TRIB3 | ||
| ConsensusPathDB | ||
| Pathway Commons: TRIB3 | ||
| Metabolism | MetaCyc: TRIB3 | |
| HUMANCyc: TRIB3 | ||
| Regulation | Ensembl's Regulation: ENSG00000101255 | |
| miRBase: chr20 :361,307-378,203 | ||
| TargetScan: NM_001301188 | ||
| cisRED: ENSG00000101255 | ||
| Context | iHOP: TRIB3 | |
| cancer metabolism search in PubMed: TRIB3 | ||
| UCL Cancer Institute: TRIB3 | ||
| Assigned class in ccmGDB | A - This gene has a literature evidence and it belongs to cancer gene. | |
| References showing role of TRIB3 in cancer cell metabolism | 1. Salazar M, Lorente M, Garcia-Taboada E, Hernández-Tiedra S, Davila D, et al. (2013) The pseudokinase tribbles homologue-3 plays a crucial role in cannabinoid anticancer action. Biochimica et Biophysica Acta (BBA)-Molecular and Cell Biology of Lipids 1831: 1573-1578. go to article | |
| Top |
| Phenotypic Information for TRIB3(metabolism pathway, cancer, disease, phenome) |
| Cancer | CGAP: TRIB3 |
| Familial Cancer Database: TRIB3 | |
| * This gene is included in those cancer gene databases. |
|
|
|
|
|
| . | ||||||||||||||||||||||||||||||||||||||||||||||||||||||||||||||||||||||||||||||||||||||||||||||||||||||||||||||||||||||||||||||||||||||||||||||||||||||||||||||||||||||||||||||||||||||||||||||||||||||||||||||||||||||||||||||||||||||||||||||||||||||||||||||||||||||||||||||||||||||||||||||||||||||||||||||||||||
Oncogene 1 | Significant driver gene in | |||||||||||||||||||||||||||||||||||||||||||||||||||||||||||||||||||||||||||||||||||||||||||||||||||||||||||||||||||||||||||||||||||||||||||||||||||||||||||||||||||||||||||||||||||||||||||||||||||||||||||||||||||||||||||||||||||||||||||||||||||||||||||||||||||||||||||||||||||||||||||||||||||||||||||||||||||||||||
| cf) number; DB name 1 Oncogene; http://nar.oxfordjournals.org/content/35/suppl_1/D721.long, 2 Tumor Suppressor gene; https://bioinfo.uth.edu/TSGene/, 3 Cancer Gene Census; http://www.nature.com/nrc/journal/v4/n3/abs/nrc1299.html, 4 CancerGenes; http://nar.oxfordjournals.org/content/35/suppl_1/D721.long, 5 Network of Cancer Gene; http://ncg.kcl.ac.uk/index.php, 1Therapeutic Vulnerabilities in Cancer; http://cbio.mskcc.org/cancergenomics/statius/ |
| REACTOME_METABOLISM_OF_LIPIDS_AND_LIPOPROTEINS | |
| OMIM | 607898; gene. |
| Orphanet | |
| Disease | KEGG Disease: TRIB3 |
| MedGen: TRIB3 (Human Medical Genetics with Condition) | |
| ClinVar: TRIB3 | |
| Phenotype | MGI: TRIB3 (International Mouse Phenotyping Consortium) |
| PhenomicDB: TRIB3 | |
| Mutations for TRIB3 |
| * Under tables are showing count per each tissue to give us broad intuition about tissue specific mutation patterns.You can go to the detailed page for each mutation database's web site. |
| There's no structural variation information in COSMIC data for this gene. |
| * From mRNA Sanger sequences, Chitars2.0 arranged chimeric transcripts. This table shows TRIB3 related fusion information. |
| ID | Head Gene | Tail Gene | Accession | Gene_a | qStart_a | qEnd_a | Chromosome_a | tStart_a | tEnd_a | Gene_a | qStart_a | qEnd_a | Chromosome_a | tStart_a | tEnd_a |
| BP240144 | TRIB3 | 1 | 326 | 20 | 361708 | 368874 | NADK2 | 323 | 509 | 5 | 36227578 | 36241697 | |
| U02019 | TRIB3 | 1041 | 2512 | 20 | 375921 | 377410 | WASF2 | 2506 | 2552 | 1 | 27783598 | 27783644 | |
| Top |
| Mutation type/ Tissue ID | brca | cns | cerv | endome | haematopo | kidn | Lintest | liver | lung | ns | ovary | pancre | prost | skin | stoma | thyro | urina | |||
| Total # sample | 1 | 1 | ||||||||||||||||||
| GAIN (# sample) | 1 | 1 | ||||||||||||||||||
| LOSS (# sample) |
| cf) Tissue ID; Tissue type (1; Breast, 2; Central_nervous_system, 3; Cervix, 4; Endometrium, 5; Haematopoietic_and_lymphoid_tissue, 6; Kidney, 7; Large_intestine, 8; Liver, 9; Lung, 10; NS, 11; Ovary, 12; Pancreas, 13; Prostate, 14; Skin, 15; Stomach, 16; Thyroid, 17; Urinary_tract) |
| Top |
|
 |
| Top |
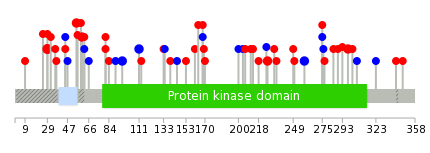
| Stat. for Non-Synonymous SNVs (# total SNVs=38) | (# total SNVs=20) |
 |  |
(# total SNVs=1) | (# total SNVs=0) |
 |
| Top |
| * When you move the cursor on each content, you can see more deailed mutation information on the Tooltip. Those are primary_site,primary_histology,mutation(aa),pubmedID. |
| GRCh37 position | Mutation(aa) | Unique sampleID count |
| chr20:368740-368740 | p.R29H | 3 |
| chr20:368658-368658 | p.R2* | 2 |
| chr20:368818-368818 | p.A55V | 2 |
| chr20:376933-376933 | p.V226M | 2 |
| chr20:371972-371972 | p.Y111Y | 2 |
| chr20:377149-377149 | p.R298W | 2 |
| chr20:372232-372232 | p.? | 2 |
| chr20:368760-368760 | p.R36* | 2 |
| chr20:377034-377034 | p.Y259Y | 2 |
| chr20:372074-372074 | p.H145H | 1 |
| Top |
|
 |
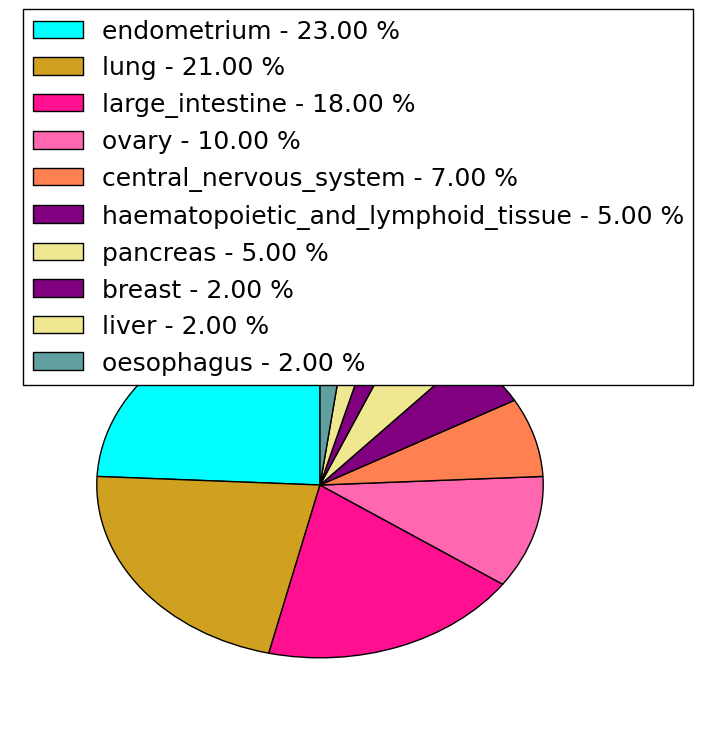
| Point Mutation/ Tissue ID | 1 | 2 | 3 | 4 | 5 | 6 | 7 | 8 | 9 | 10 | 11 | 12 | 13 | 14 | 15 | 16 | 17 | 18 | 19 | 20 |
| # sample | 2 | 2 | 5 | 3 | 4 | 5 | 3 | 3 | 4 | 1 | 7 | |||||||||
| # mutation | 2 | 2 | 5 | 3 | 4 | 5 | 3 | 3 | 4 | 1 | 8 | |||||||||
| nonsynonymous SNV | 2 | 1 | 1 | 2 | 4 | 2 | 2 | 2 | 1 | 6 | ||||||||||
| synonymous SNV | 1 | 4 | 3 | 2 | 1 | 1 | 1 | 2 | 2 |
| cf) Tissue ID; Tissue type (1; BLCA[Bladder Urothelial Carcinoma], 2; BRCA[Breast invasive carcinoma], 3; CESC[Cervical squamous cell carcinoma and endocervical adenocarcinoma], 4; COAD[Colon adenocarcinoma], 5; GBM[Glioblastoma multiforme], 6; Glioma Low Grade, 7; HNSC[Head and Neck squamous cell carcinoma], 8; KICH[Kidney Chromophobe], 9; KIRC[Kidney renal clear cell carcinoma], 10; KIRP[Kidney renal papillary cell carcinoma], 11; LAML[Acute Myeloid Leukemia], 12; LUAD[Lung adenocarcinoma], 13; LUSC[Lung squamous cell carcinoma], 14; OV[Ovarian serous cystadenocarcinoma ], 15; PAAD[Pancreatic adenocarcinoma], 16; PRAD[Prostate adenocarcinoma], 17; SKCM[Skin Cutaneous Melanoma], 18:STAD[Stomach adenocarcinoma], 19:THCA[Thyroid carcinoma], 20:UCEC[Uterine Corpus Endometrial Carcinoma]) |
| Top |
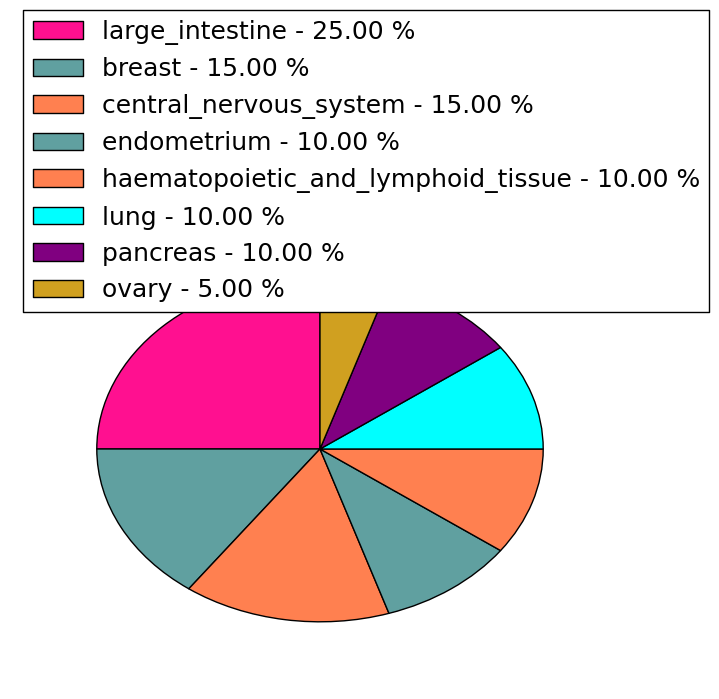
| * We represented just top 10 SNVs. When you move the cursor on each content, you can see more deailed mutation information on the Tooltip. Those are primary_site, primary_histology, mutation(aa), pubmedID. |
| Genomic Position | Mutation(aa) | Unique sampleID count |
| chr20:368740 | p.R29H | 2 |
| chr20:377081 | p.L47L | 1 |
| chr20:368818 | p.S206F | 1 |
| chr20:372144 | p.A55V | 1 |
| chr20:377082 | p.G211R | 1 |
| chr20:368838 | p.V62L | 1 |
| chr20:372148 | p.D218G | 1 |
| chr20:377085 | p.V62V | 1 |
| chr20:368670 | p.Y225Y | 1 |
| chr20:368840 | p.V226M | 1 |
| * Copy number data were extracted from TCGA using R package TCGA-Assembler. The URLs of all public data files on TCGA DCC data server were gathered on Jan-05-2015. Function ProcessCNAData in TCGA-Assembler package was used to obtain gene-level copy number value which is calculated as the average copy number of the genomic region of a gene. |
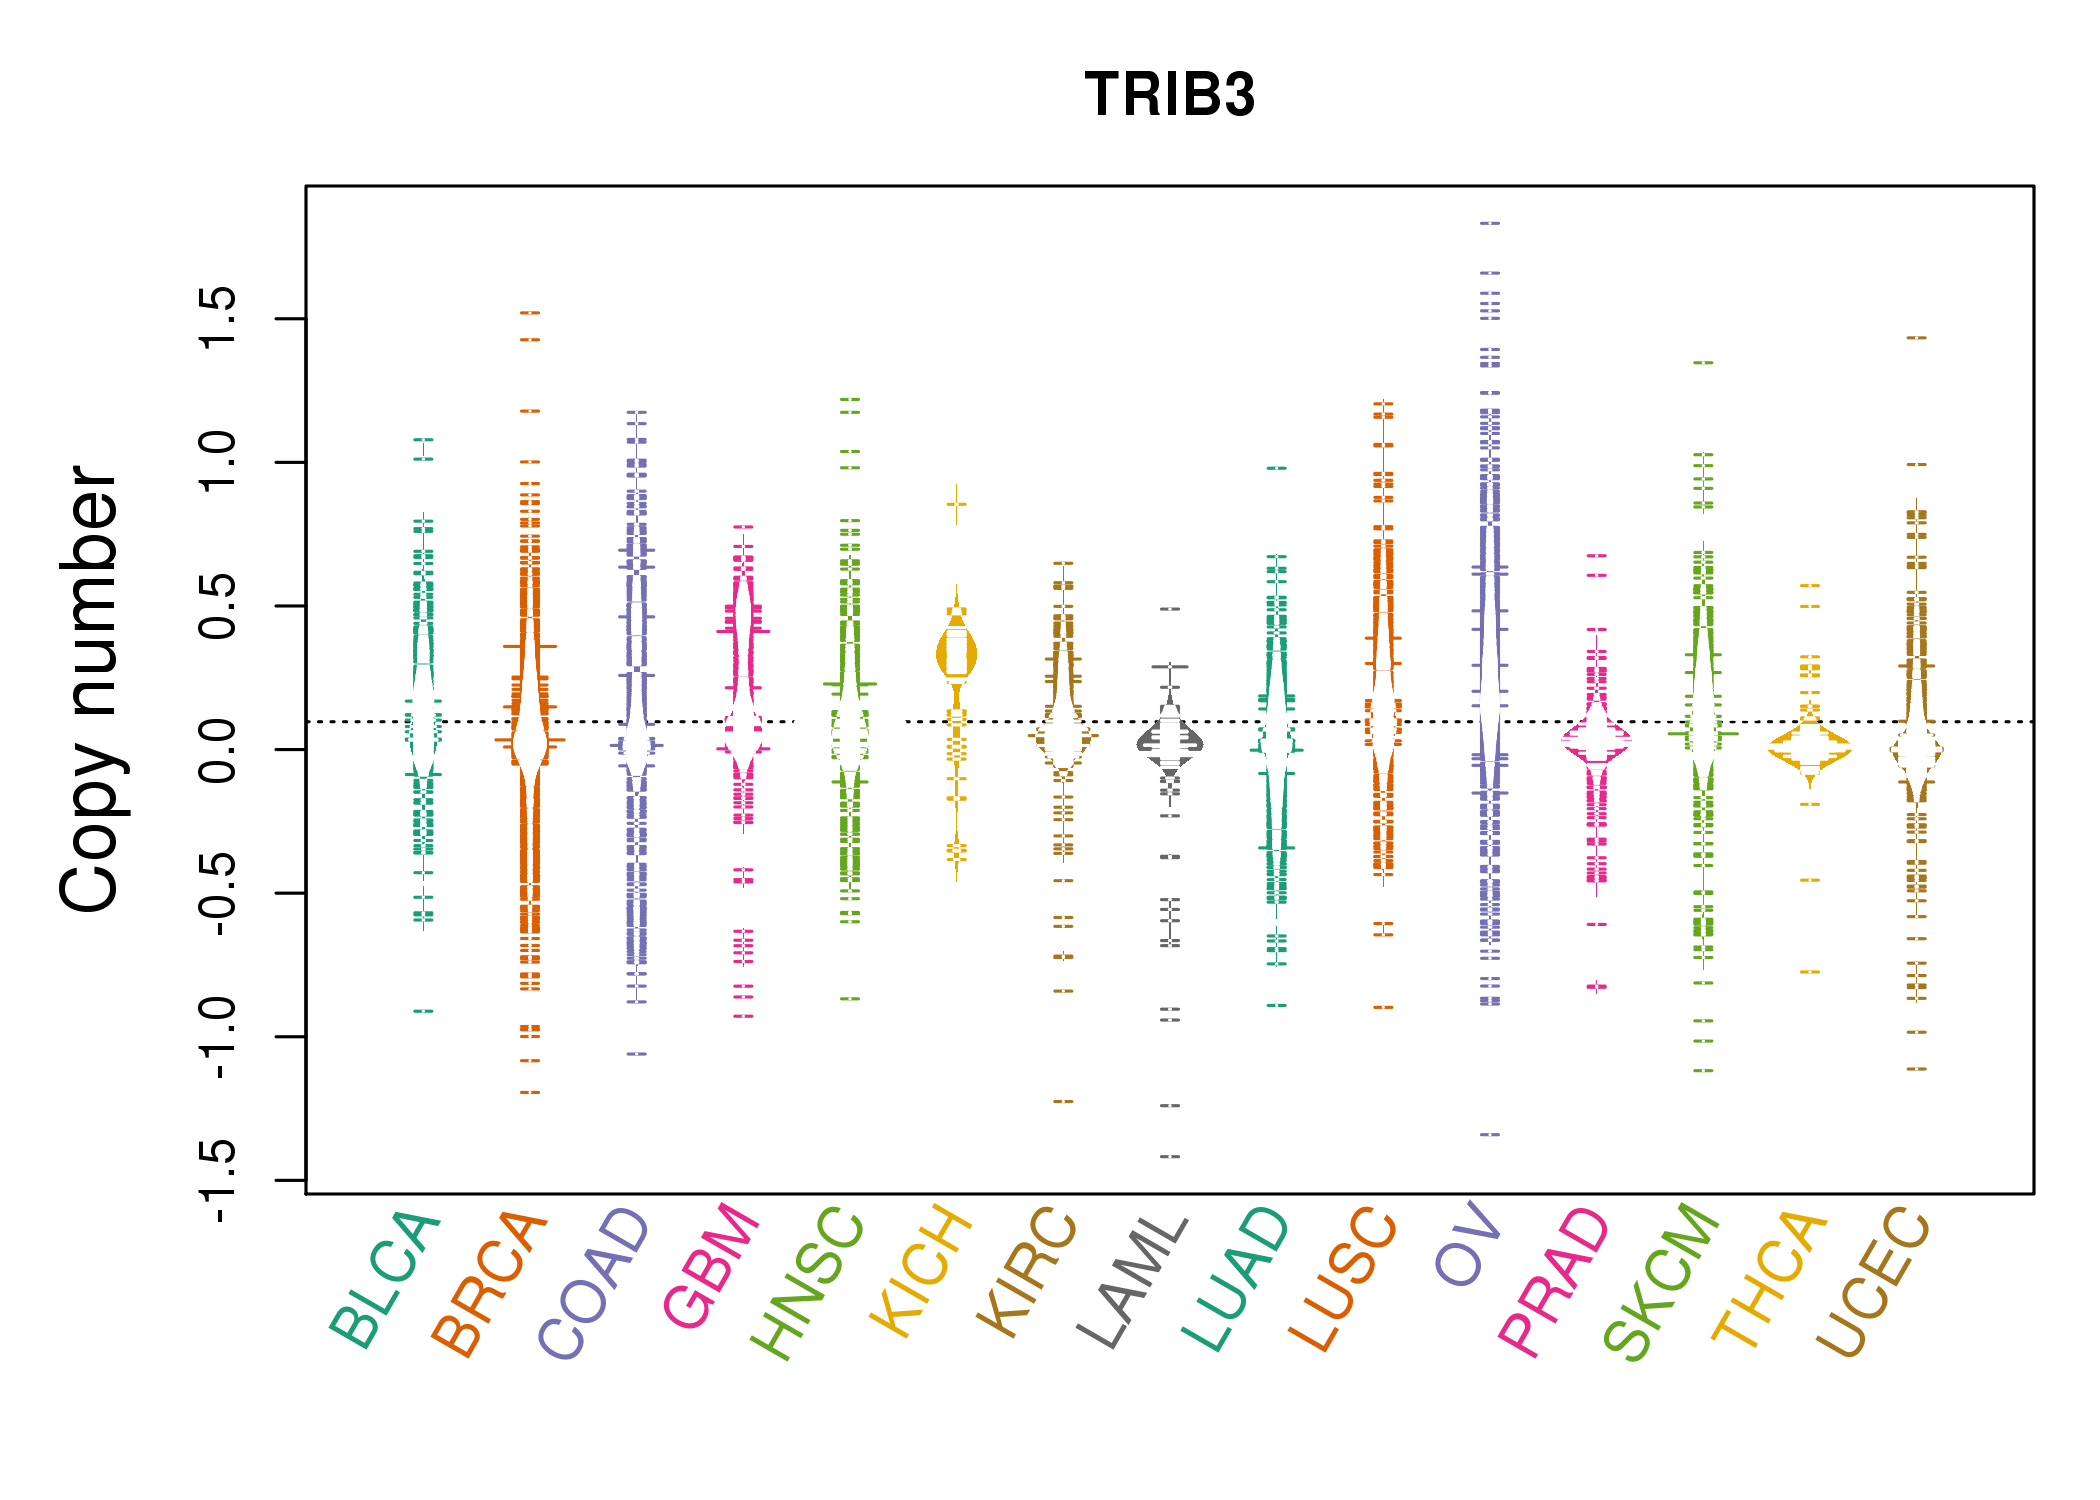 |
| cf) Tissue ID[Tissue type]: BLCA[Bladder Urothelial Carcinoma], BRCA[Breast invasive carcinoma], CESC[Cervical squamous cell carcinoma and endocervical adenocarcinoma], COAD[Colon adenocarcinoma], GBM[Glioblastoma multiforme], Glioma Low Grade, HNSC[Head and Neck squamous cell carcinoma], KICH[Kidney Chromophobe], KIRC[Kidney renal clear cell carcinoma], KIRP[Kidney renal papillary cell carcinoma], LAML[Acute Myeloid Leukemia], LUAD[Lung adenocarcinoma], LUSC[Lung squamous cell carcinoma], OV[Ovarian serous cystadenocarcinoma ], PAAD[Pancreatic adenocarcinoma], PRAD[Prostate adenocarcinoma], SKCM[Skin Cutaneous Melanoma], STAD[Stomach adenocarcinoma], THCA[Thyroid carcinoma], UCEC[Uterine Corpus Endometrial Carcinoma] |
| Top |
| Gene Expression for TRIB3 |
| * CCLE gene expression data were extracted from CCLE_Expression_Entrez_2012-10-18.res: Gene-centric RMA-normalized mRNA expression data. |
 |
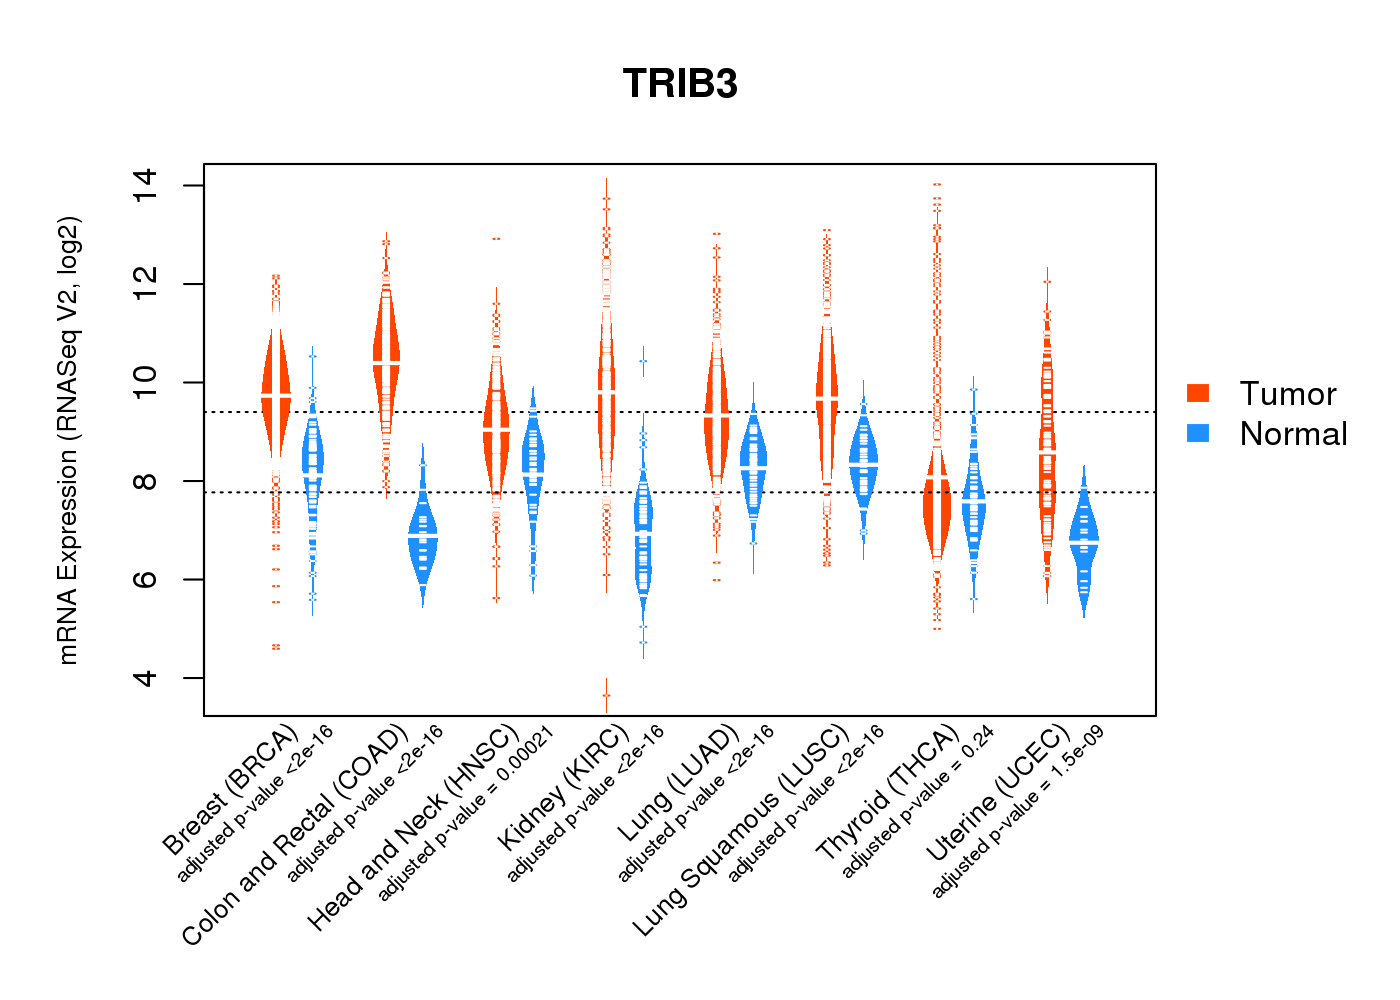
| * Normalized gene expression data of RNASeqV2 was extracted from TCGA using R package TCGA-Assembler. The URLs of all public data files on TCGA DCC data server were gathered at Jan-05-2015. Only eight cancer types have enough normal control samples for differential expression analysis. (t test, adjusted p<0.05 (using Benjamini-Hochberg FDR)) |
 |
| Top |
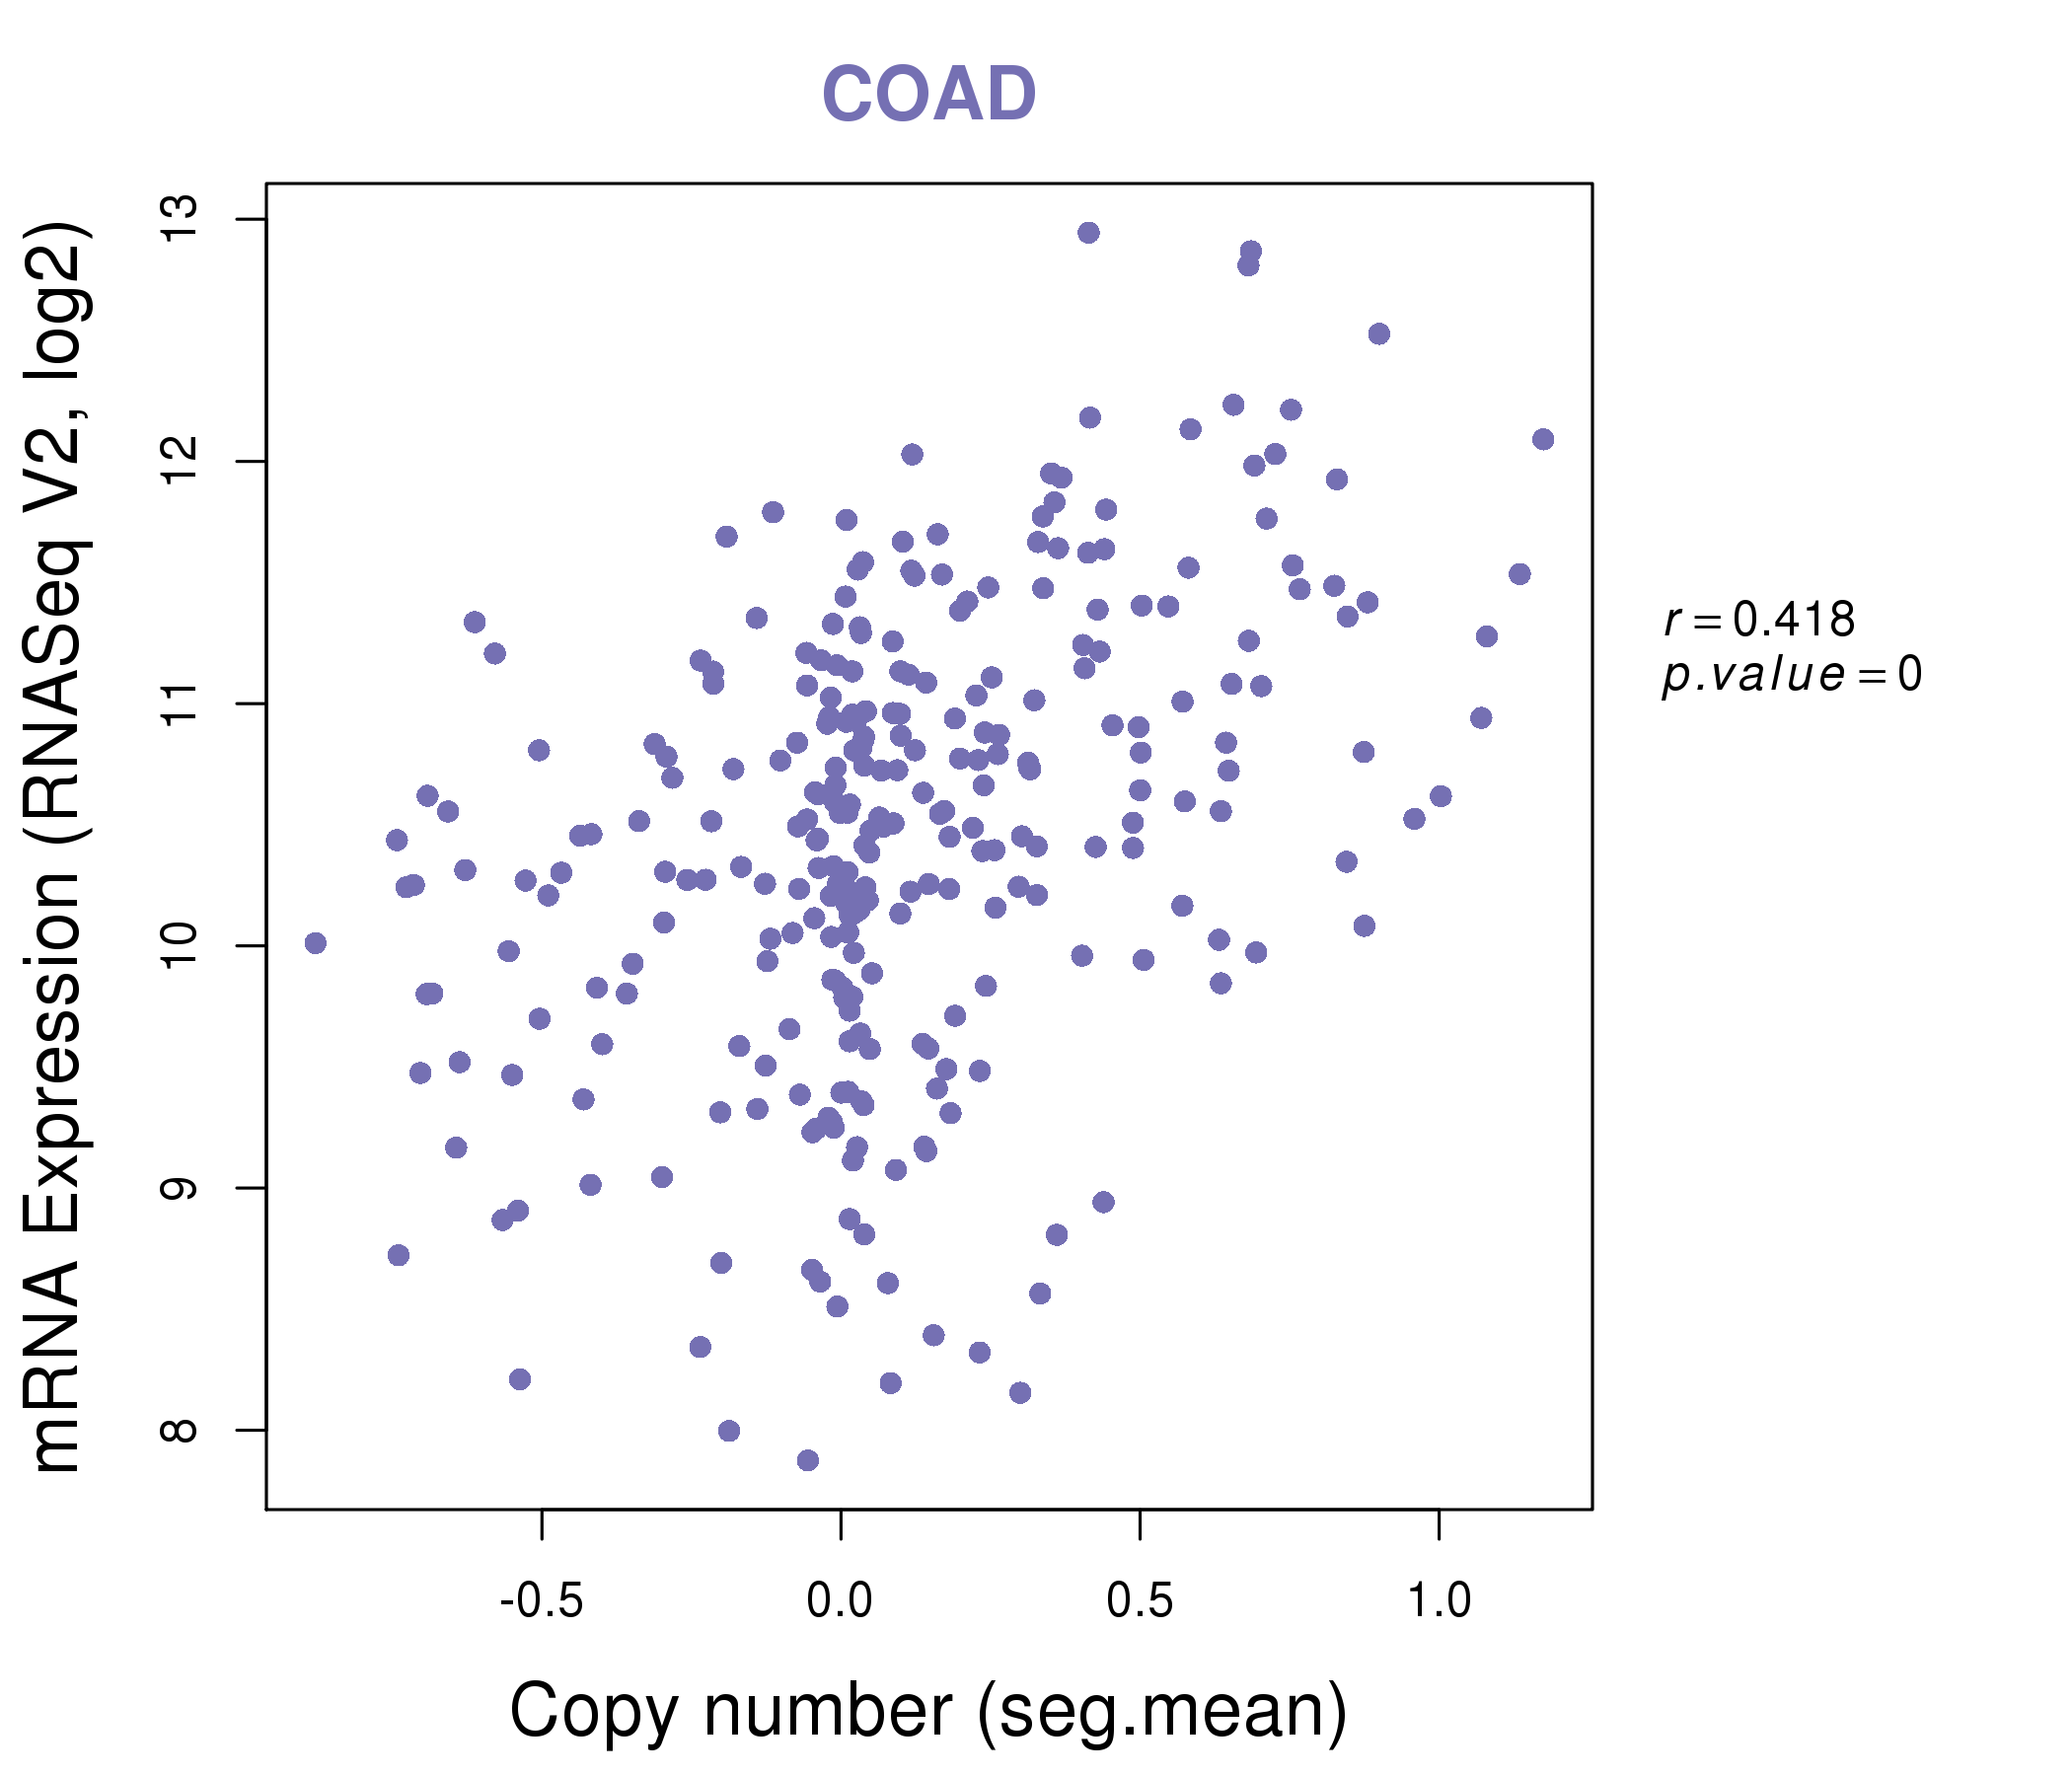
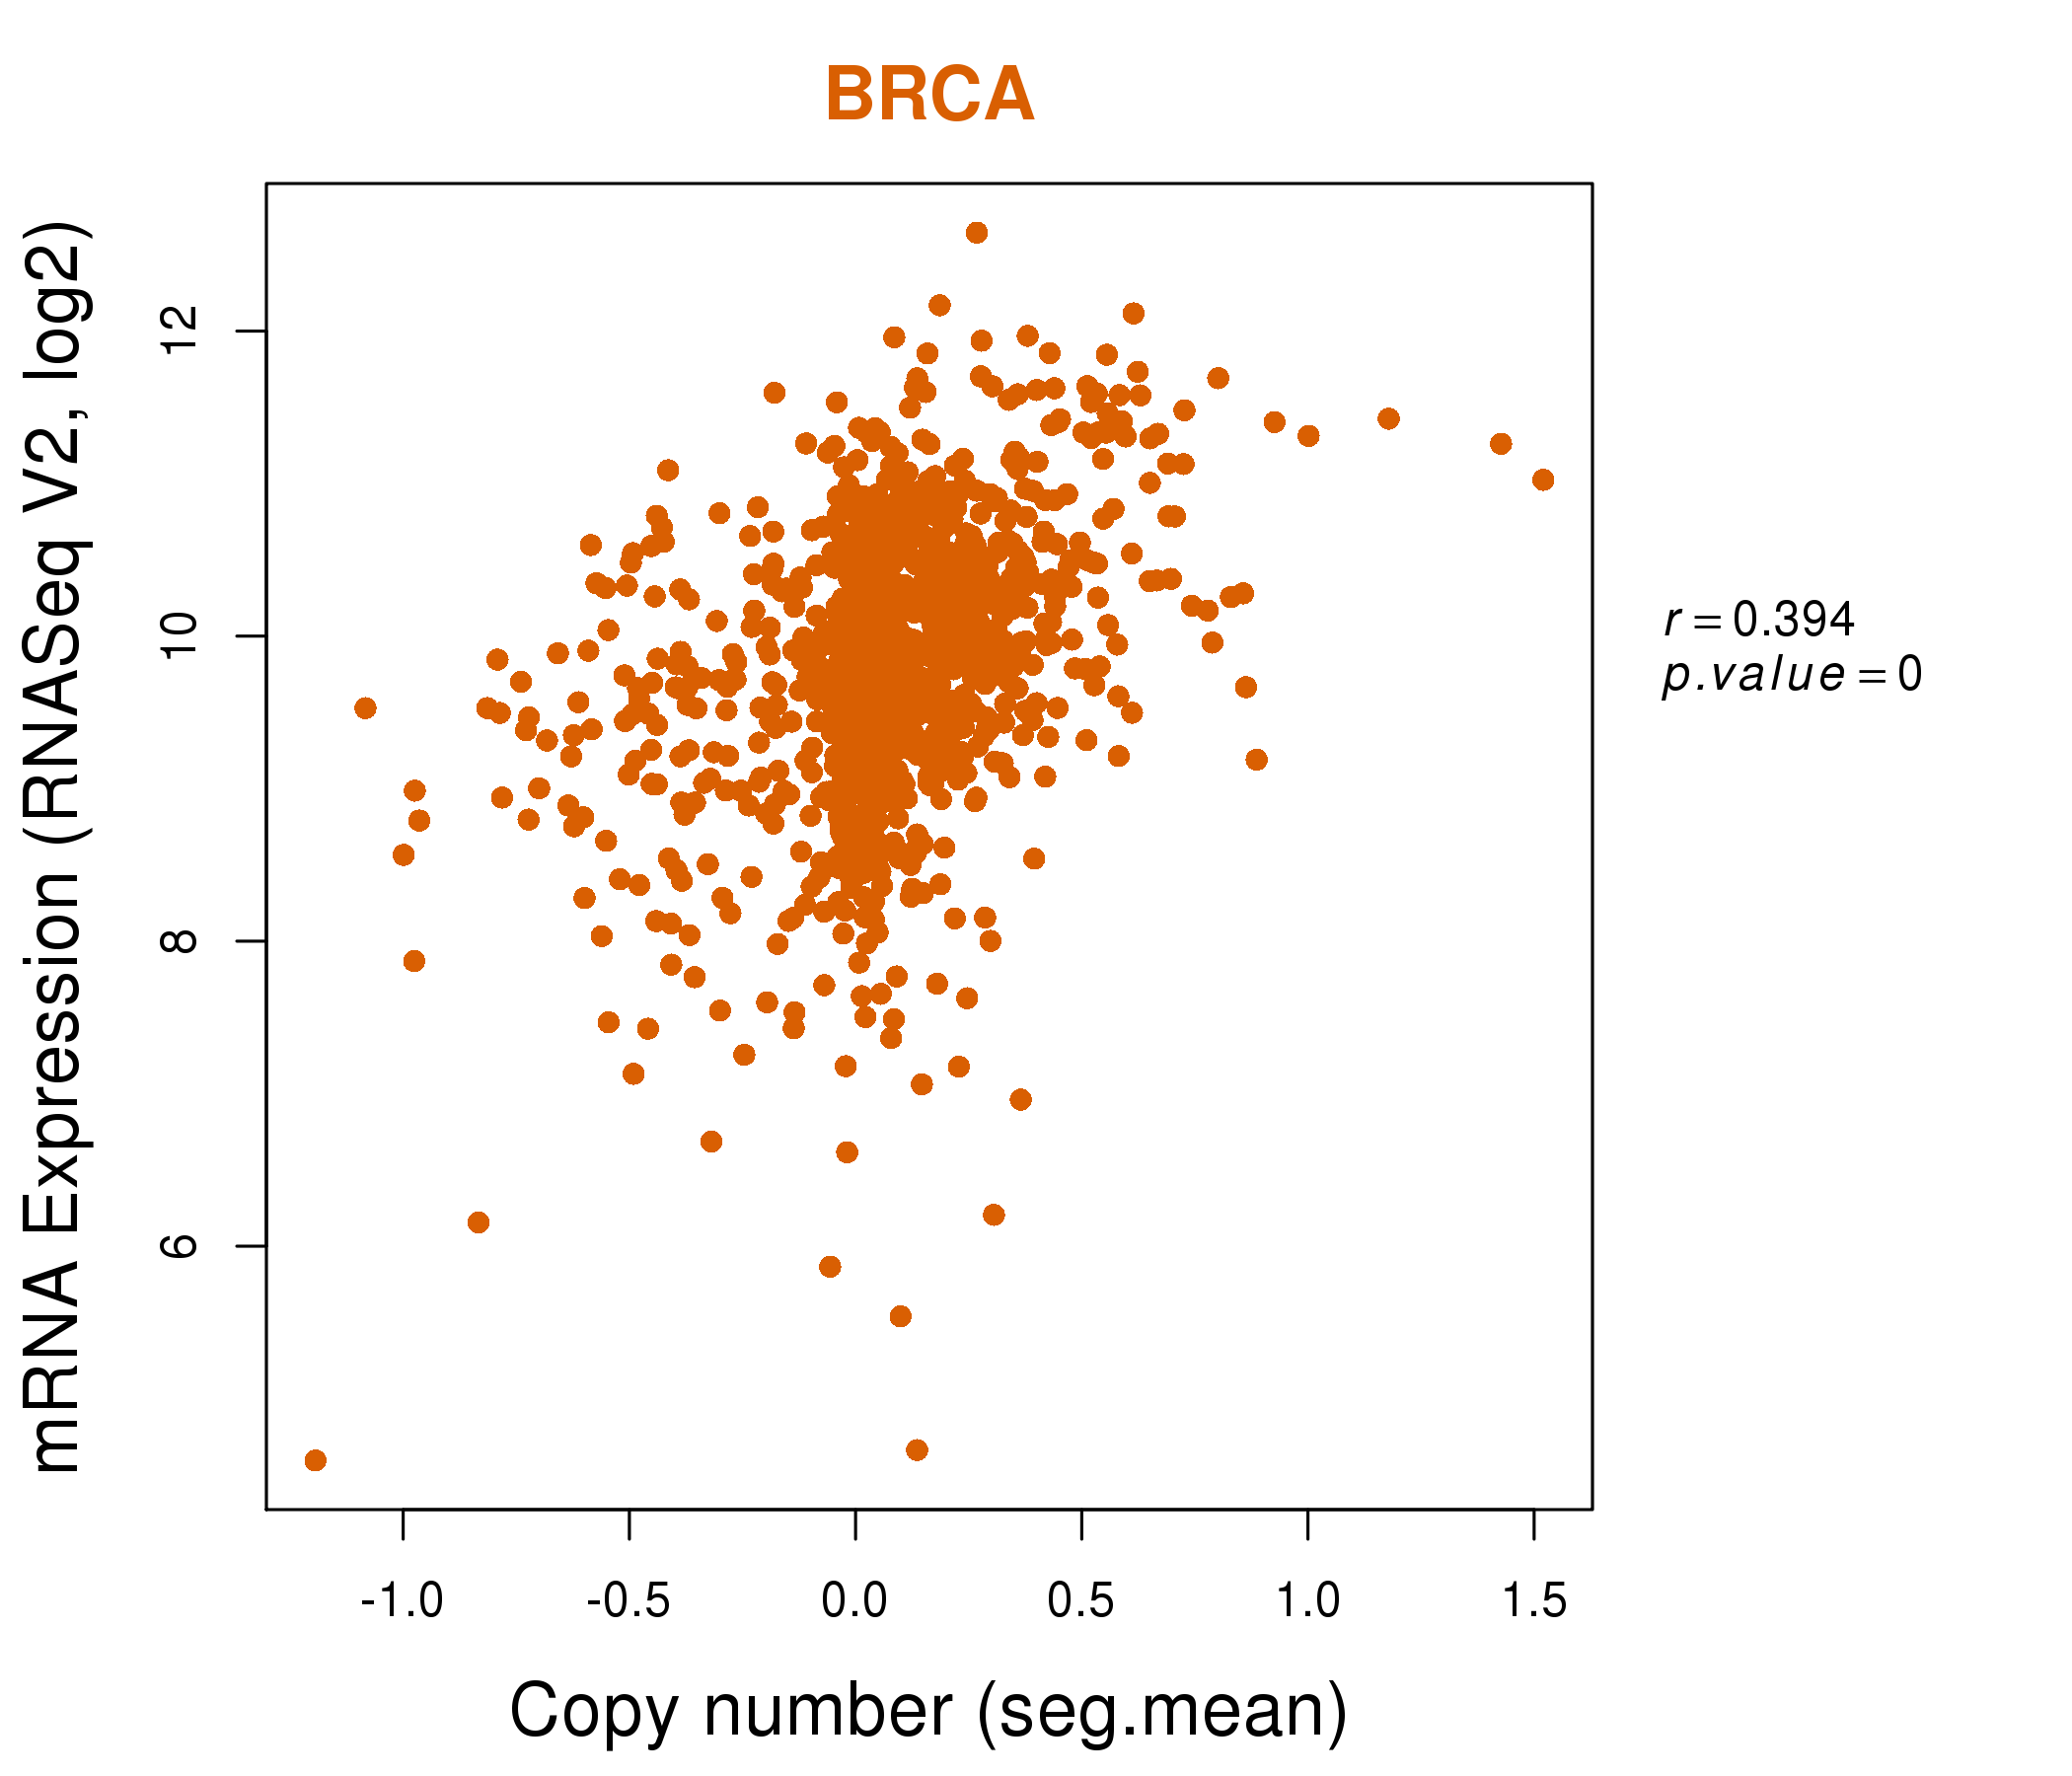
| * This plots show the correlation between CNV and gene expression. |
: Open all plots for all cancer types
 |
|
 |
|

| Top |
| Gene-Gene Network Information |
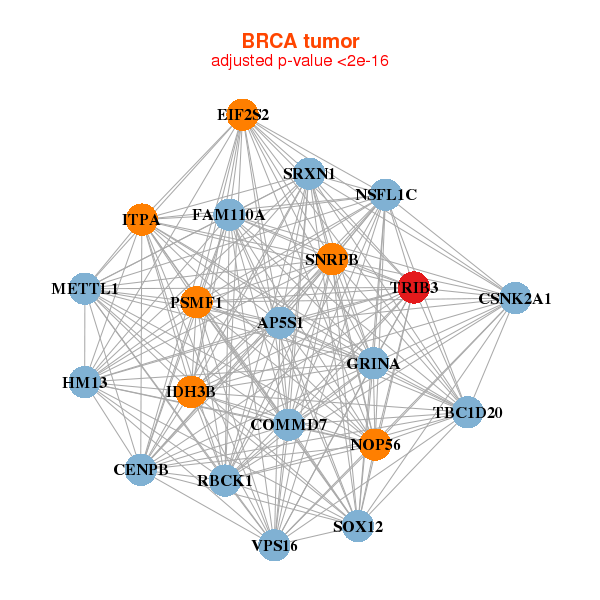
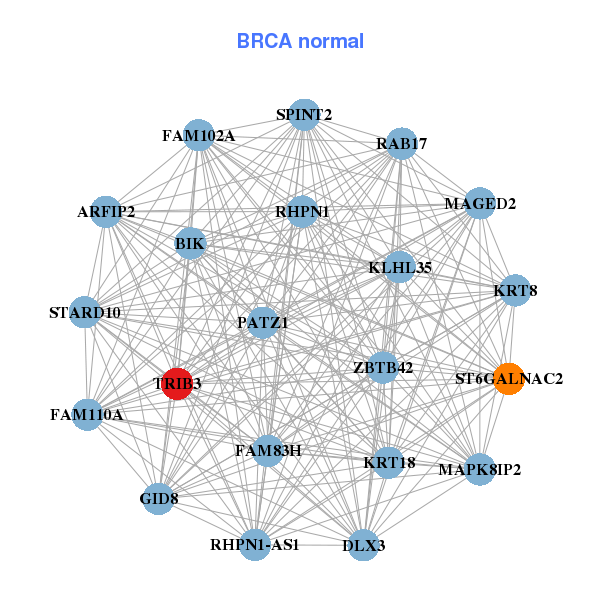
| * Co-Expression network figures were drawn using R package igraph. Only the top 20 genes with the highest correlations were shown. Red circle: input gene, orange circle: cell metabolism gene, sky circle: other gene |
: Open all plots for all cancer types
 |
|
| AP5S1,CENPB,COMMD7,CSNK2A1,EIF2S2,FAM110A,GRINA, HM13,IDH3B,ITPA,METTL1,NOP56,NSFL1C,PSMF1, RBCK1,SNRPB,SOX12,SRXN1,TBC1D20,TRIB3,VPS16 | ARFIP2,BIK,GID8,RHPN1-AS1,DLX3,FAM102A,FAM110A, FAM83H,KLHL35,KRT18,KRT8,MAGED2,MAPK8IP2,PATZ1, RAB17,RHPN1,SPINT2,ST6GALNAC2,STARD10,TRIB3,ZBTB42 |
 |
|
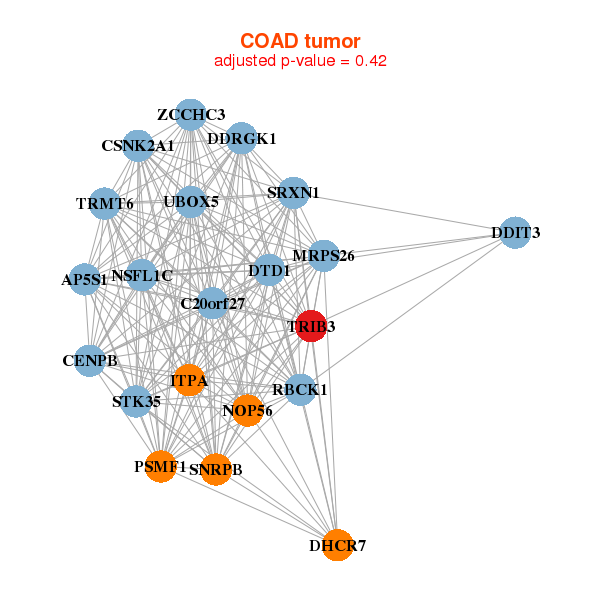
| C20orf27,AP5S1,CENPB,CSNK2A1,DDIT3,DDRGK1,DHCR7, DTD1,ITPA,MRPS26,NOP56,NSFL1C,PSMF1,RBCK1, SNRPB,SRXN1,STK35,TRIB3,TRMT6,UBOX5,ZCCHC3 | AADACL4,AFM,C2CD4A,CATSPERB,CHAC1,CHI3L1,DMBT1, DPYS,EGFL6,MROH5,FFAR4,GRHL1,HPD,MICB, PDX1,RAB27A,RAET1E,SCGB3A1,TACSTD2,TRIB3,VTN |
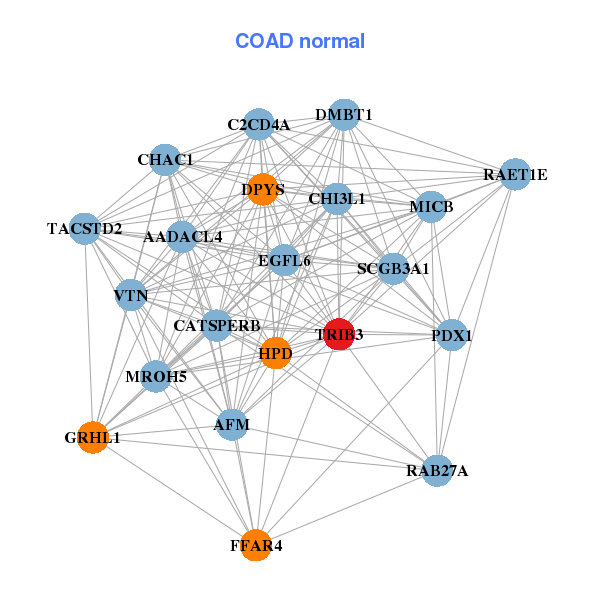
| * Co-Expression network figures were drawn using R package igraph. Only the top 20 genes with the highest correlations were shown. Red circle: input gene, orange circle: cell metabolism gene, sky circle: other gene |
: Open all plots for all cancer types
| Top |
: Open all interacting genes' information including KEGG pathway for all interacting genes from DAVID
| Top |
| Pharmacological Information for TRIB3 |
| There's no related Drug. |
| Top |
| Cross referenced IDs for TRIB3 |
| * We obtained these cross-references from Uniprot database. It covers 150 different DBs, 18 categories. http://www.uniprot.org/help/cross_references_section |
: Open all cross reference information
|
Copyright © 2016-Present - The Univsersity of Texas Health Science Center at Houston @ |