|
||||||||||||||||||||
| |
| Phenotypic Information (metabolism pathway, cancer, disease, phenome) |
| |
| |
| Gene-Gene Network Information: Co-Expression Network, Interacting Genes & KEGG |
| |
|


| Gene Summary for POLD4 |
| Top |
| Phenotypic Information for POLD4(metabolism pathway, cancer, disease, phenome) |
| Cancer | CGAP: POLD4 |
| Familial Cancer Database: POLD4 | |
| * This gene is included in those cancer gene databases. |
|
|
|
|
|
| . | ||||||||||||||
Oncogene 1 | Significant driver gene in | |||||||||||||||||||
| cf) number; DB name 1 Oncogene; http://nar.oxfordjournals.org/content/35/suppl_1/D721.long, 2 Tumor Suppressor gene; https://bioinfo.uth.edu/TSGene/, 3 Cancer Gene Census; http://www.nature.com/nrc/journal/v4/n3/abs/nrc1299.html, 4 CancerGenes; http://nar.oxfordjournals.org/content/35/suppl_1/D721.long, 5 Network of Cancer Gene; http://ncg.kcl.ac.uk/index.php, 1Therapeutic Vulnerabilities in Cancer; http://cbio.mskcc.org/cancergenomics/statius/ |
| KEGG_PURINE_METABOLISM KEGG_PYRIMIDINE_METABOLISM | |
| OMIM | 611525; gene. |
| Orphanet | |
| Disease | KEGG Disease: POLD4 |
| MedGen: POLD4 (Human Medical Genetics with Condition) | |
| ClinVar: POLD4 | |
| Phenotype | MGI: POLD4 (International Mouse Phenotyping Consortium) |
| PhenomicDB: POLD4 | |
| Mutations for POLD4 |
| * Under tables are showing count per each tissue to give us broad intuition about tissue specific mutation patterns.You can go to the detailed page for each mutation database's web site. |
| There's no structural variation information in COSMIC data for this gene. |
| * From mRNA Sanger sequences, Chitars2.0 arranged chimeric transcripts. This table shows POLD4 related fusion information. |
| ID | Head Gene | Tail Gene | Accession | Gene_a | qStart_a | qEnd_a | Chromosome_a | tStart_a | tEnd_a | Gene_a | qStart_a | qEnd_a | Chromosome_a | tStart_a | tEnd_a |
| Top |
| There's no copy number variation information in COSMIC data for this gene. |
| Top |
|
 |
| Top |
| Stat. for Non-Synonymous SNVs (# total SNVs=7) | (# total SNVs=1) |
 |  |
(# total SNVs=0) | (# total SNVs=0) |
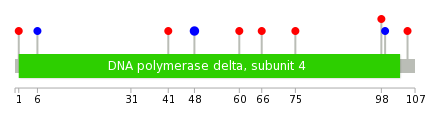
| Top |
| * When you move the cursor on each content, you can see more deailed mutation information on the Tooltip. Those are primary_site,primary_histology,mutation(aa),pubmedID. |
| GRCh37 position | Mutation(aa) | Unique sampleID count |
| chr11:67120167-67120167 | p.Q98H | 1 |
| chr11:67120206-67120206 | p.W85* | 1 |
| chr11:67120236-67120236 | p.Q75H | 1 |
| chr11:67120265-67120265 | p.R66W | 1 |
| chr11:67120468-67120468 | p.P60S | 1 |
| chr11:67120502-67120502 | p.L48L | 1 |
| chr11:67120504-67120504 | p.L48L | 1 |
| chr11:67120525-67120525 | p.E41K | 1 |
| chr11:67120853-67120853 | p.L6L | 1 |
| chr11:67119477-67119477 | p.Y105H | 1 |
| Top |
|
 |
| Point Mutation/ Tissue ID | 1 | 2 | 3 | 4 | 5 | 6 | 7 | 8 | 9 | 10 | 11 | 12 | 13 | 14 | 15 | 16 | 17 | 18 | 19 | 20 |
| # sample | 1 | 1 | 1 | 3 | 1 | 1 | 1 | |||||||||||||
| # mutation | 1 | 1 | 1 | 3 | 1 | 1 | 1 | |||||||||||||
| nonsynonymous SNV | 1 | 1 | 2 | 1 | ||||||||||||||||
| synonymous SNV | 1 | 1 | 1 | 1 |
| cf) Tissue ID; Tissue type (1; BLCA[Bladder Urothelial Carcinoma], 2; BRCA[Breast invasive carcinoma], 3; CESC[Cervical squamous cell carcinoma and endocervical adenocarcinoma], 4; COAD[Colon adenocarcinoma], 5; GBM[Glioblastoma multiforme], 6; Glioma Low Grade, 7; HNSC[Head and Neck squamous cell carcinoma], 8; KICH[Kidney Chromophobe], 9; KIRC[Kidney renal clear cell carcinoma], 10; KIRP[Kidney renal papillary cell carcinoma], 11; LAML[Acute Myeloid Leukemia], 12; LUAD[Lung adenocarcinoma], 13; LUSC[Lung squamous cell carcinoma], 14; OV[Ovarian serous cystadenocarcinoma ], 15; PAAD[Pancreatic adenocarcinoma], 16; PRAD[Prostate adenocarcinoma], 17; SKCM[Skin Cutaneous Melanoma], 18:STAD[Stomach adenocarcinoma], 19:THCA[Thyroid carcinoma], 20:UCEC[Uterine Corpus Endometrial Carcinoma]) |
| Top |
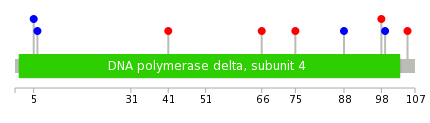
| * We represented just top 10 SNVs. When you move the cursor on each content, you can see more deailed mutation information on the Tooltip. Those are primary_site, primary_histology, mutation(aa), pubmedID. |
| Genomic Position | Mutation(aa) | Unique sampleID count |
| chr11:67120167 | p.Q98H | 1 |
| chr11:67120197 | p.L88L | 1 |
| chr11:67120236 | p.Q75H | 1 |
| chr11:67120265 | p.R66W | 1 |
| chr11:67120525 | p.E41K,POLD4 | 1 |
| chr11:67120853 | p.L6L,POLD4 | 1 |
| chr11:67120856 | p.R5R,POLD4 | 1 |
| chr11:67119477 | p.Y105H | 1 |
| chr11:67120164 | p.C99C | 1 |
| * Copy number data were extracted from TCGA using R package TCGA-Assembler. The URLs of all public data files on TCGA DCC data server were gathered on Jan-05-2015. Function ProcessCNAData in TCGA-Assembler package was used to obtain gene-level copy number value which is calculated as the average copy number of the genomic region of a gene. |
 |
| cf) Tissue ID[Tissue type]: BLCA[Bladder Urothelial Carcinoma], BRCA[Breast invasive carcinoma], CESC[Cervical squamous cell carcinoma and endocervical adenocarcinoma], COAD[Colon adenocarcinoma], GBM[Glioblastoma multiforme], Glioma Low Grade, HNSC[Head and Neck squamous cell carcinoma], KICH[Kidney Chromophobe], KIRC[Kidney renal clear cell carcinoma], KIRP[Kidney renal papillary cell carcinoma], LAML[Acute Myeloid Leukemia], LUAD[Lung adenocarcinoma], LUSC[Lung squamous cell carcinoma], OV[Ovarian serous cystadenocarcinoma ], PAAD[Pancreatic adenocarcinoma], PRAD[Prostate adenocarcinoma], SKCM[Skin Cutaneous Melanoma], STAD[Stomach adenocarcinoma], THCA[Thyroid carcinoma], UCEC[Uterine Corpus Endometrial Carcinoma] |
| Top |
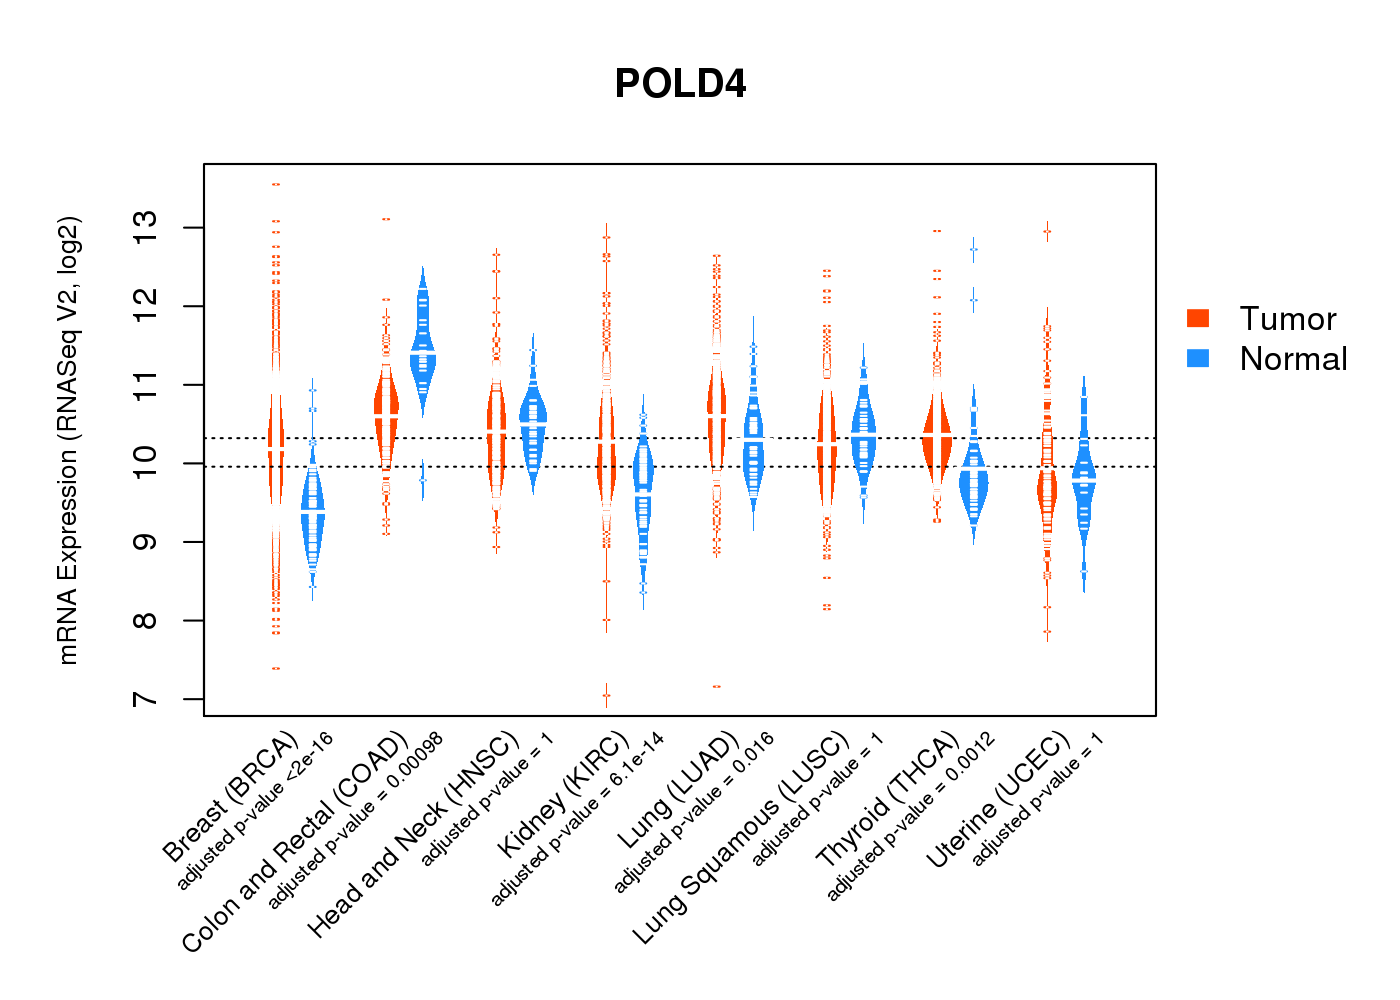
| Gene Expression for POLD4 |
| * CCLE gene expression data were extracted from CCLE_Expression_Entrez_2012-10-18.res: Gene-centric RMA-normalized mRNA expression data. |
 |
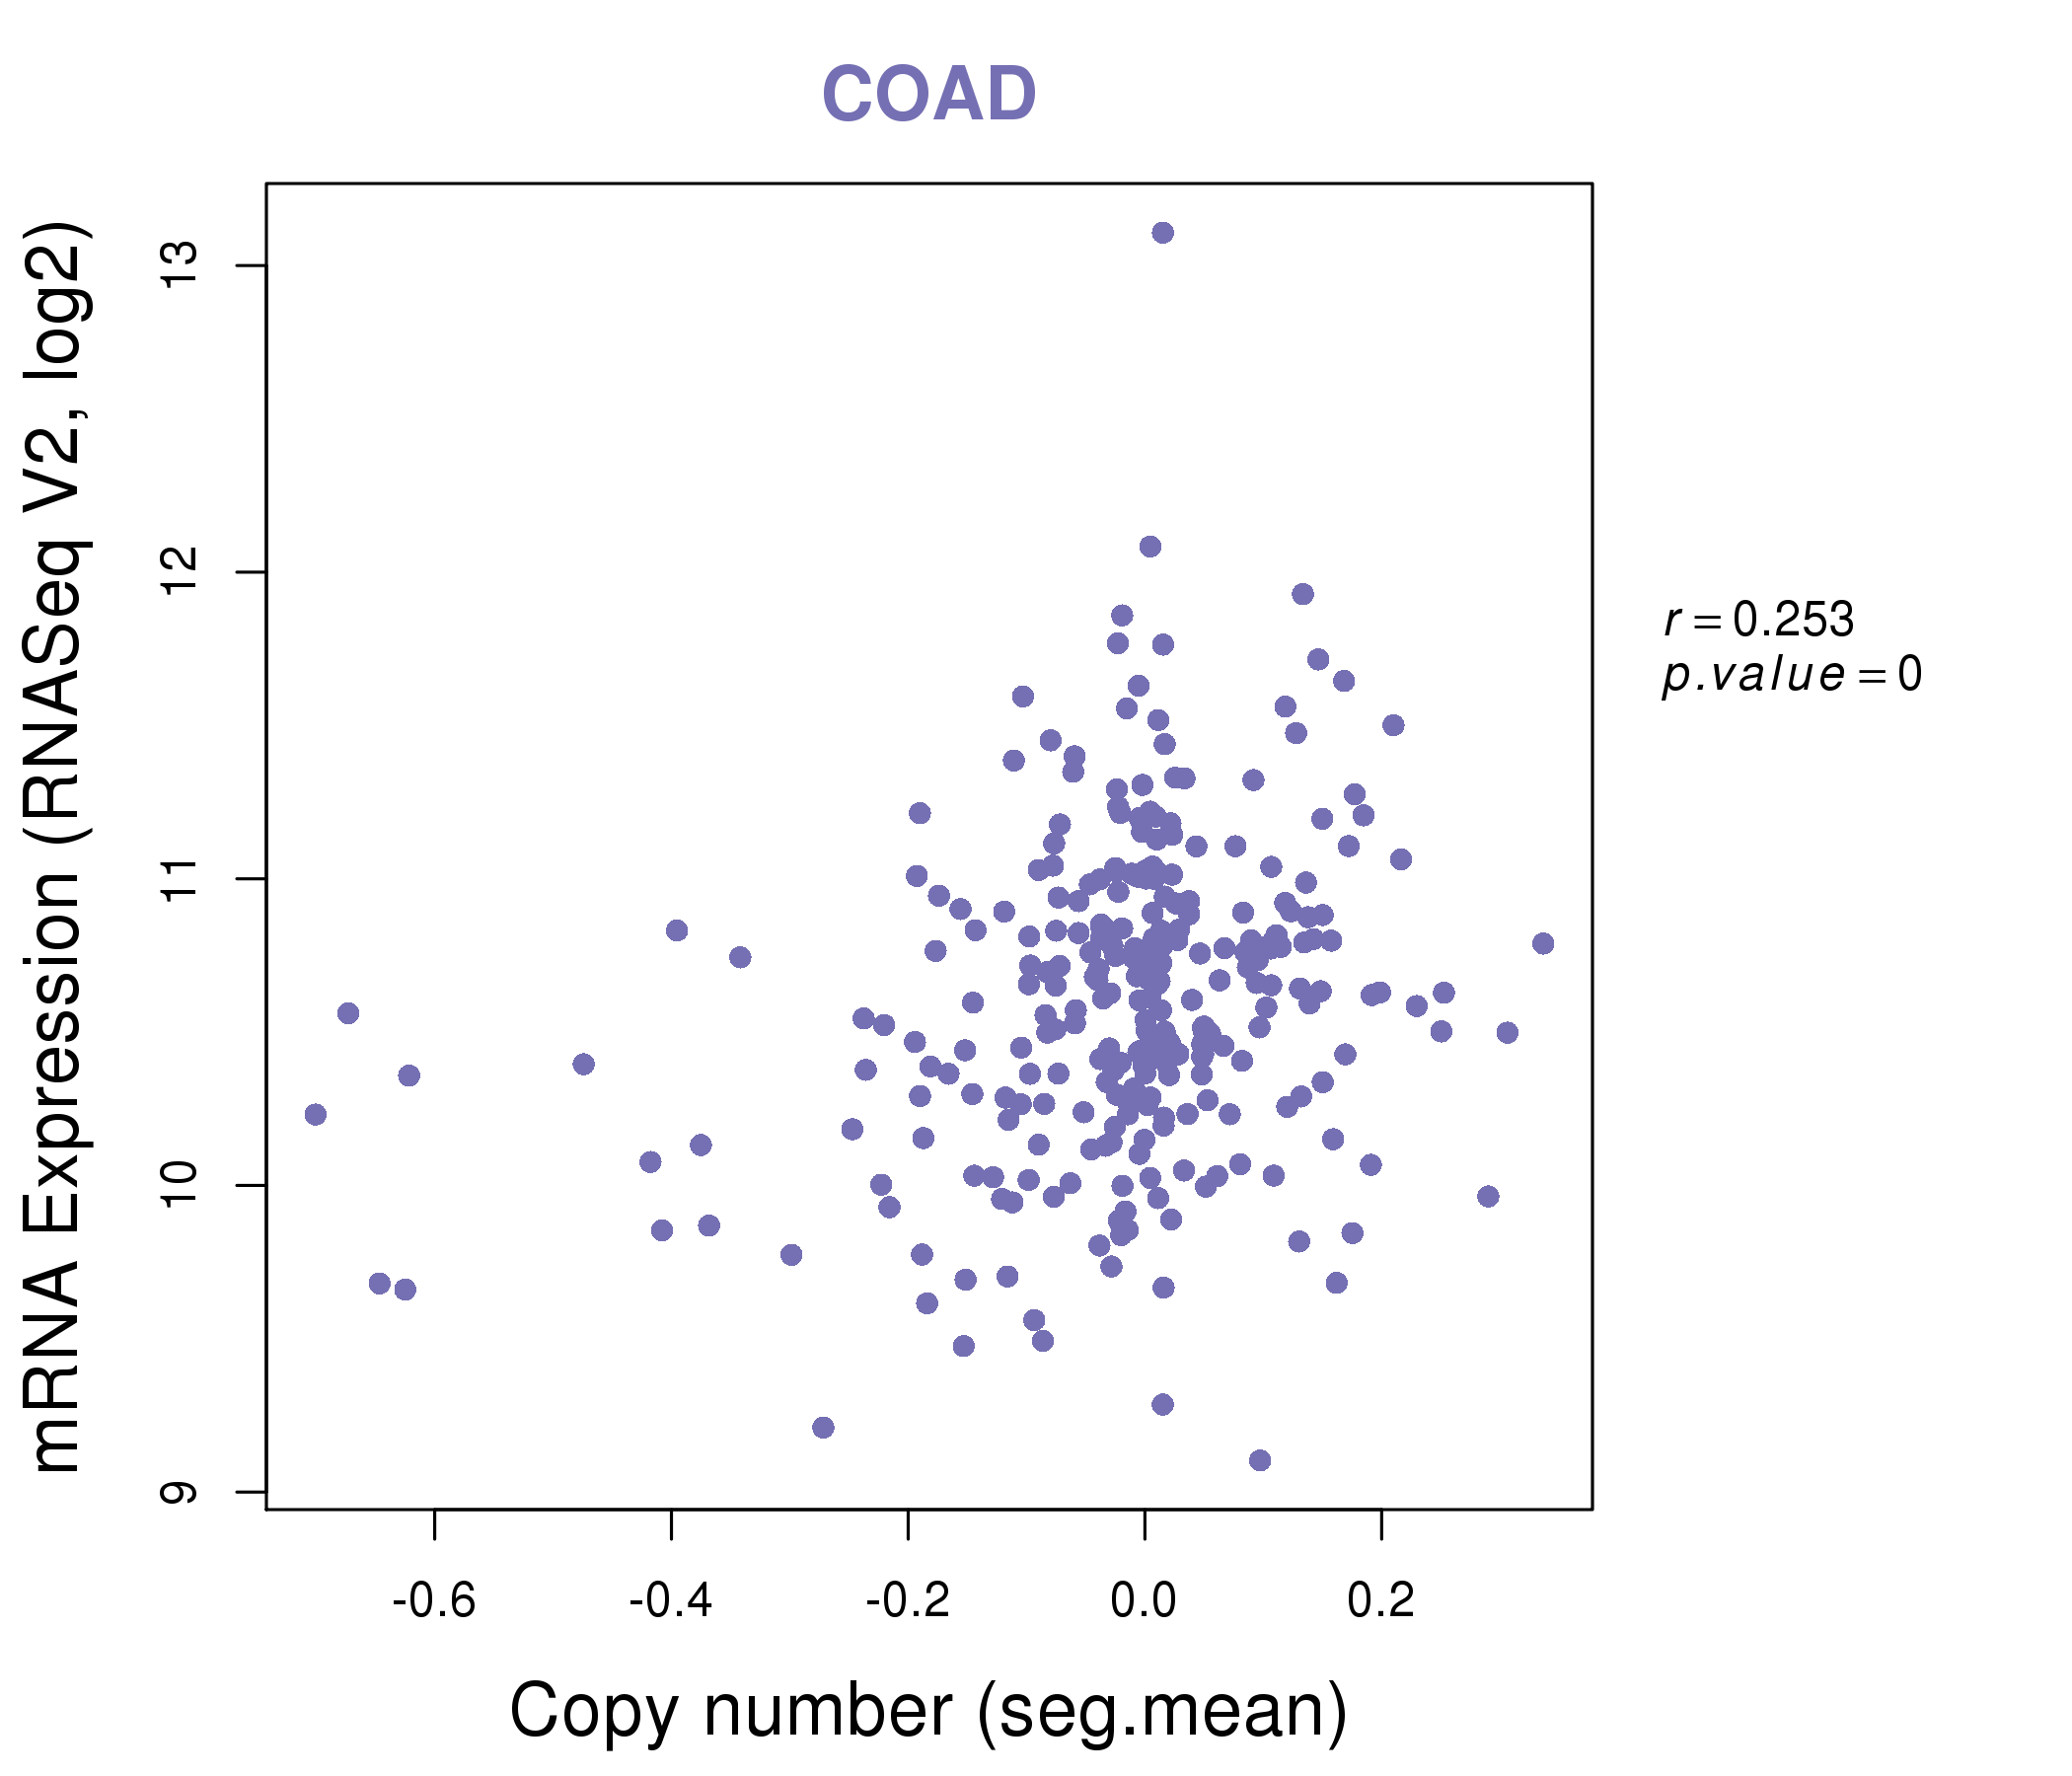
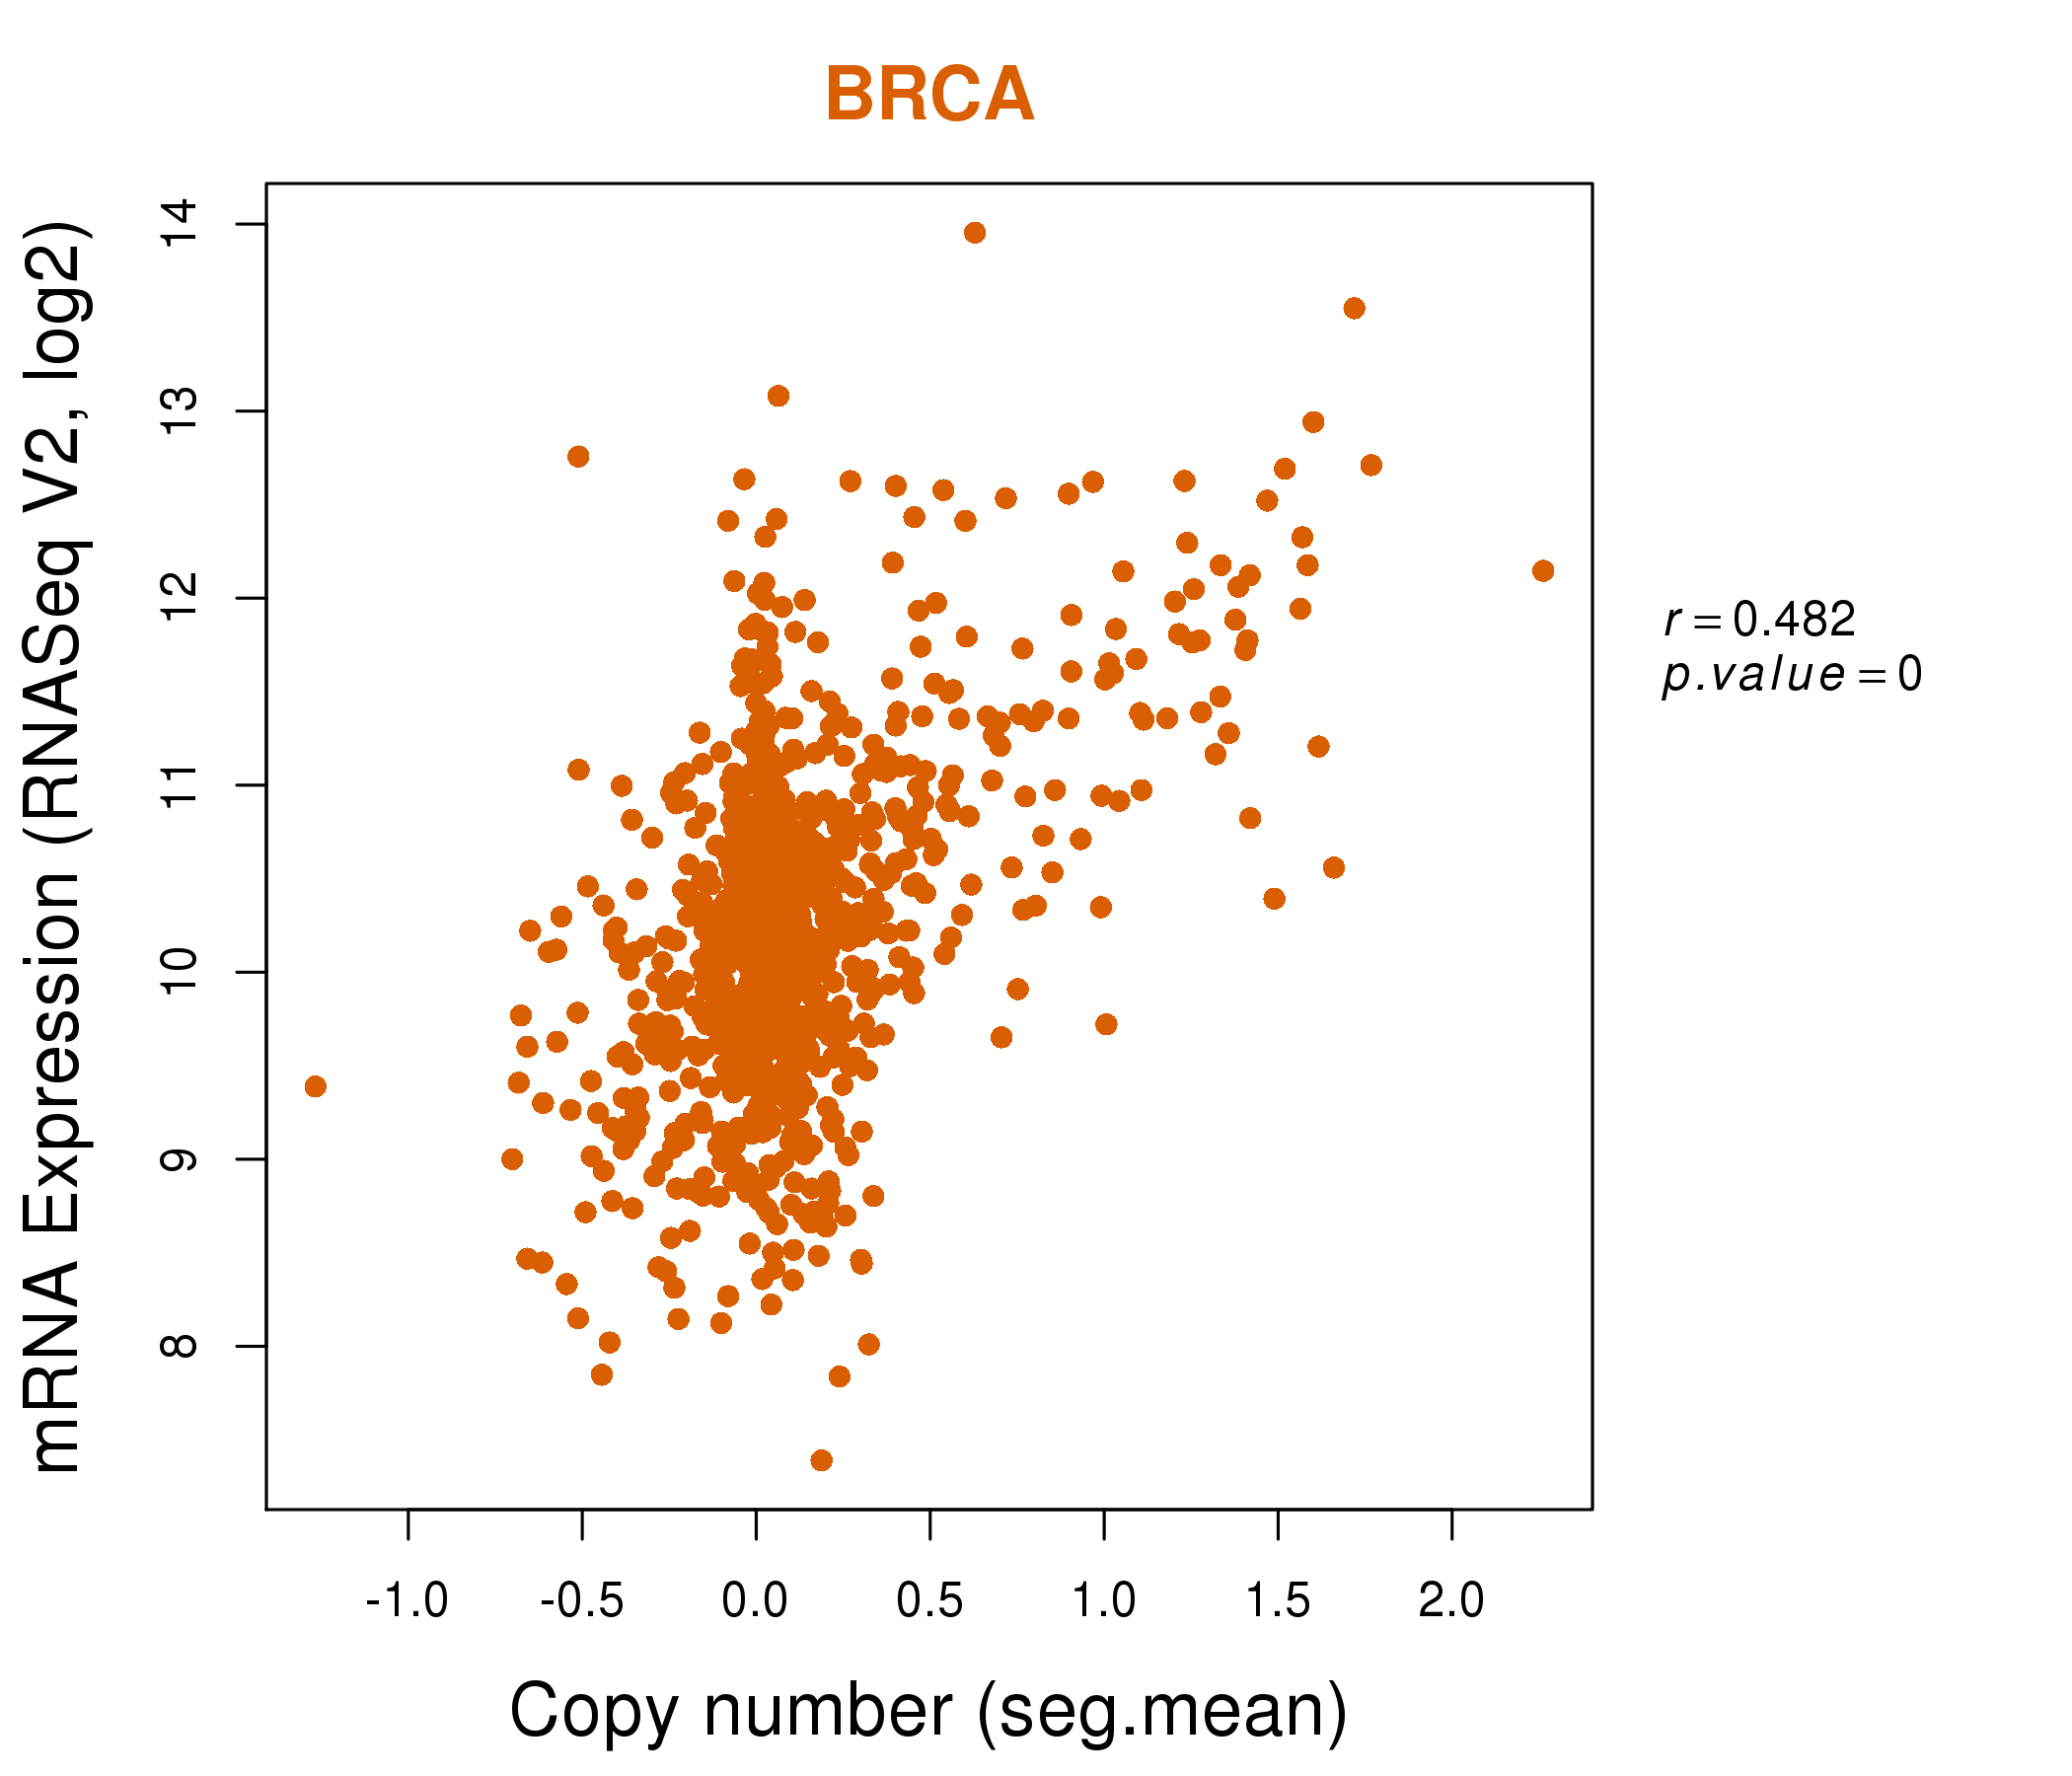
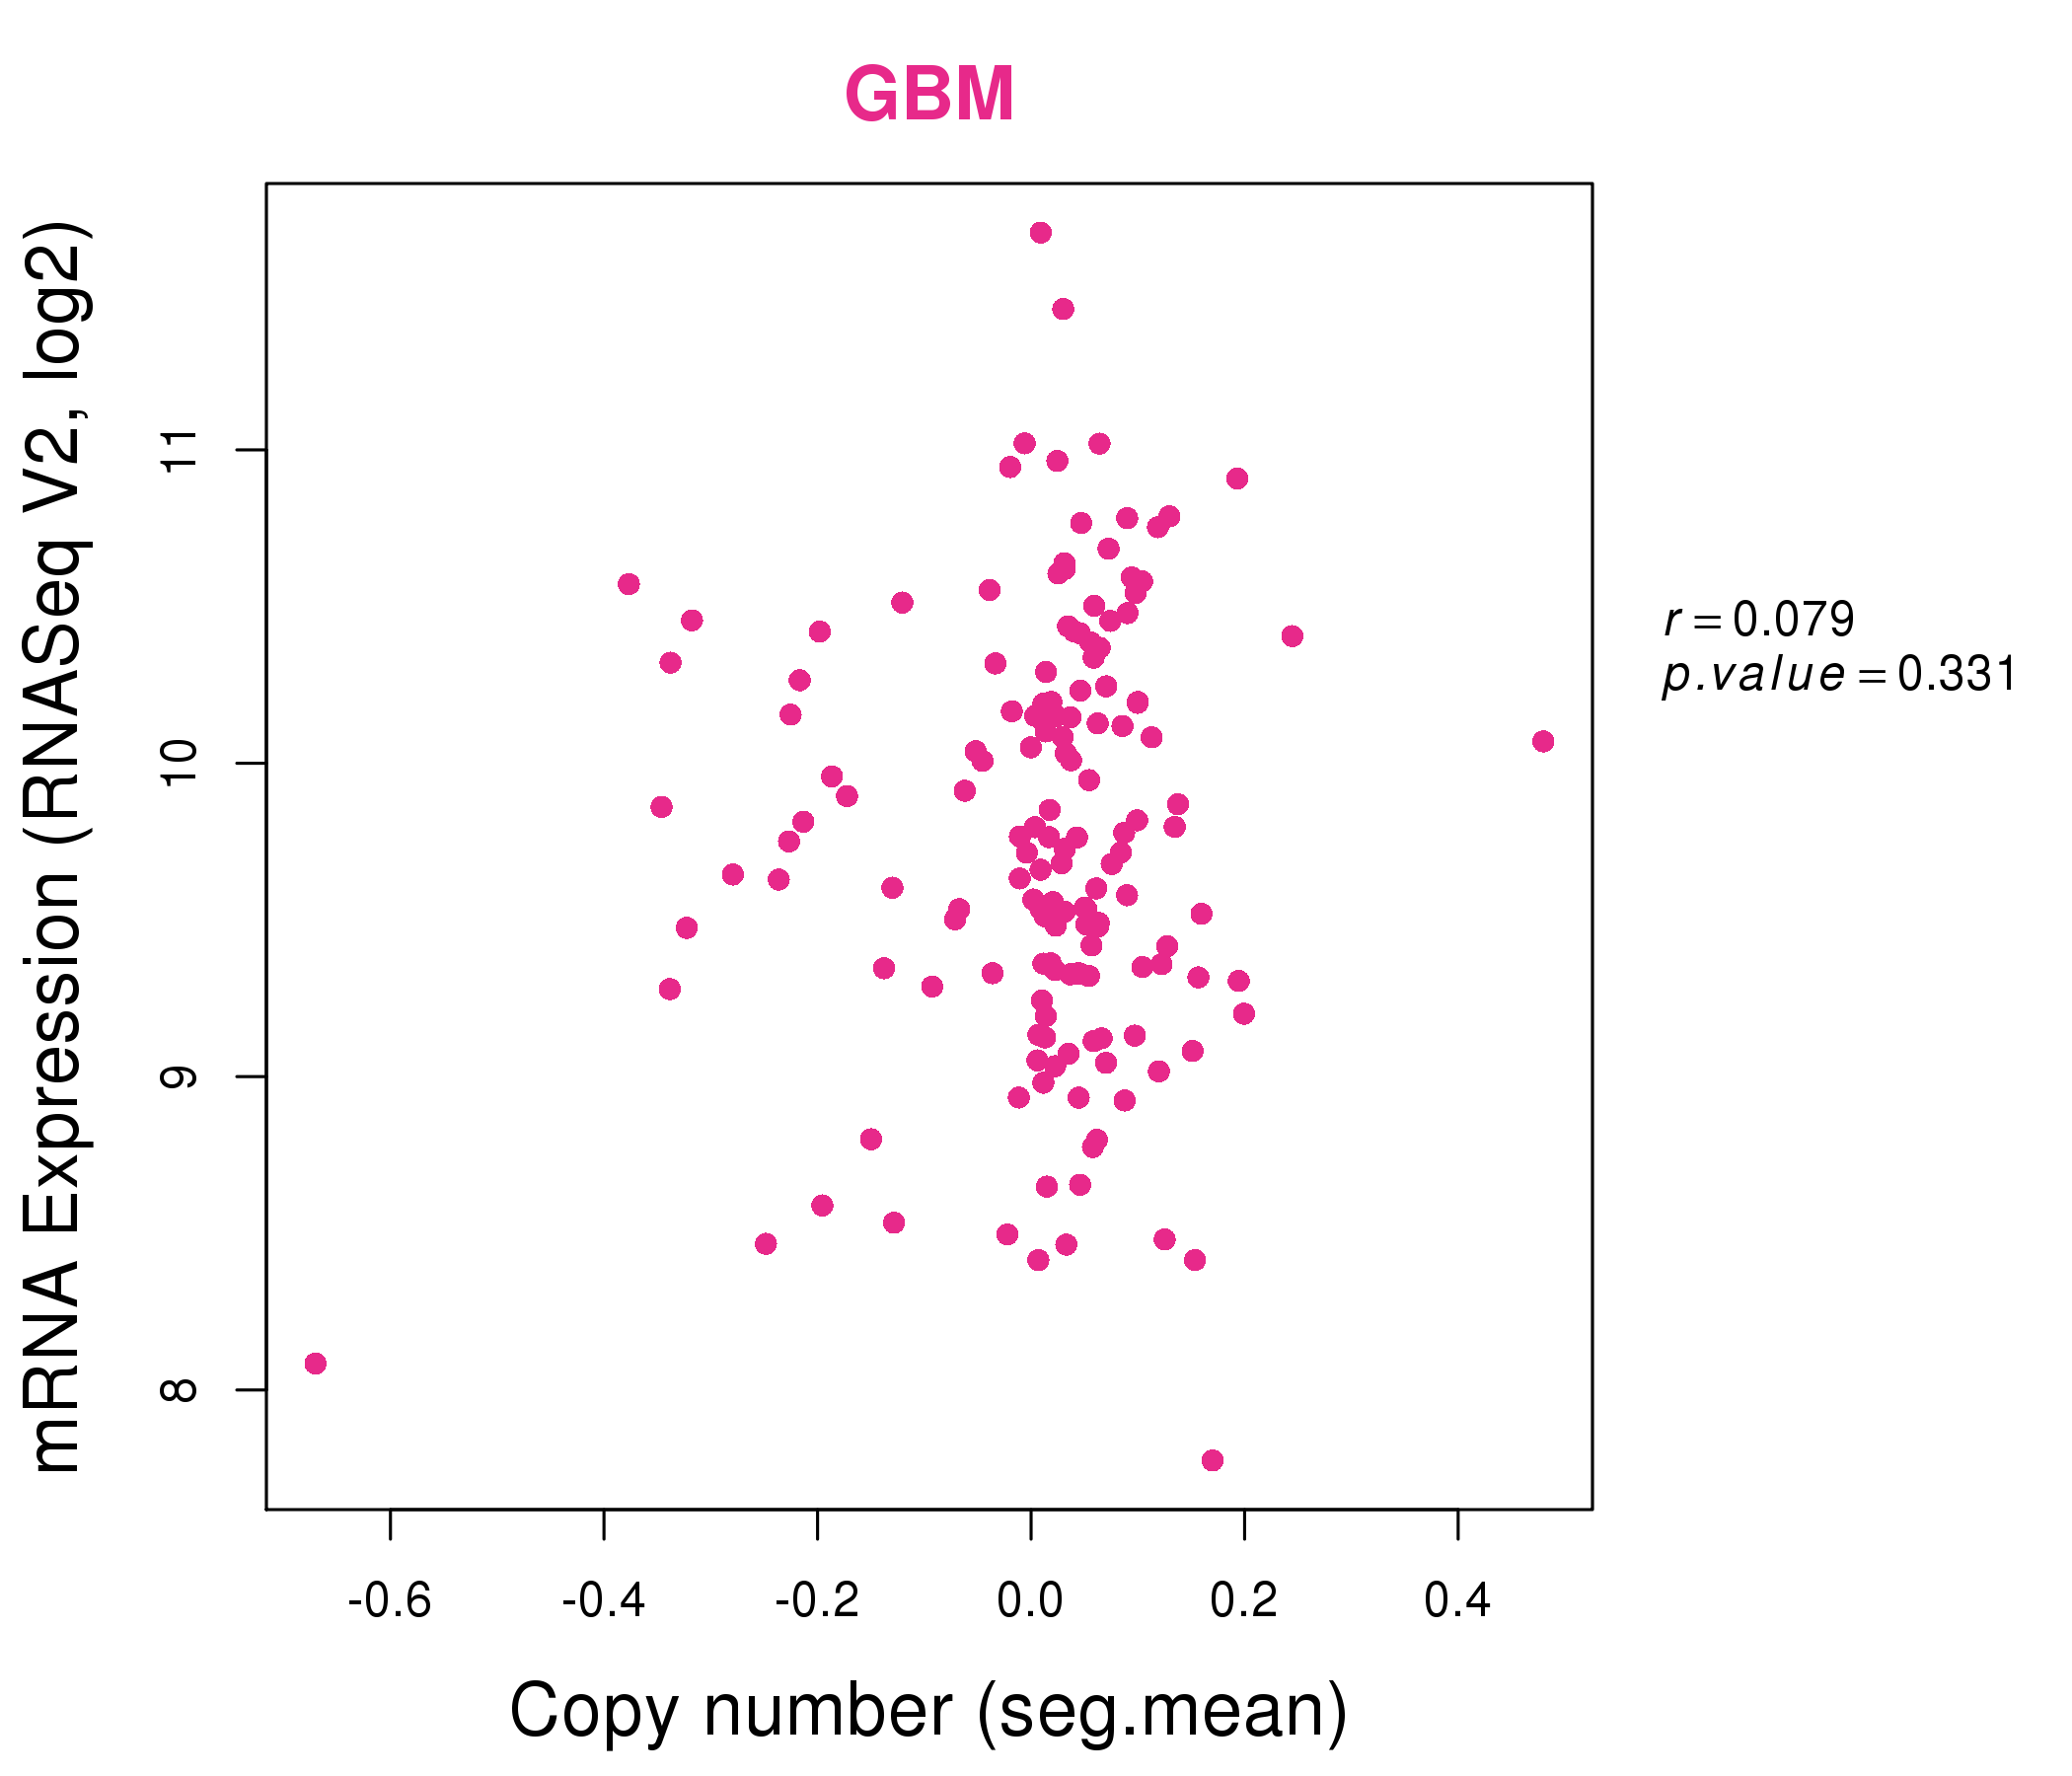
| * Normalized gene expression data of RNASeqV2 was extracted from TCGA using R package TCGA-Assembler. The URLs of all public data files on TCGA DCC data server were gathered at Jan-05-2015. Only eight cancer types have enough normal control samples for differential expression analysis. (t test, adjusted p<0.05 (using Benjamini-Hochberg FDR)) |
 |
| Top |
| * This plots show the correlation between CNV and gene expression. |
: Open all plots for all cancer types
 |
|
 |
|
| Top |
| Gene-Gene Network Information |
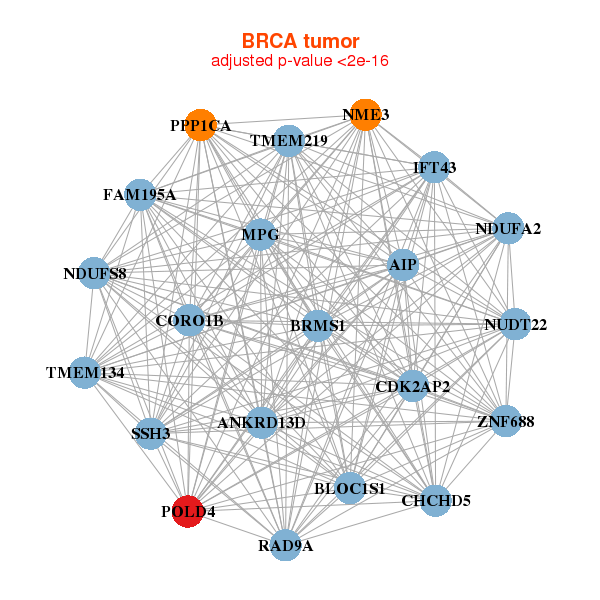
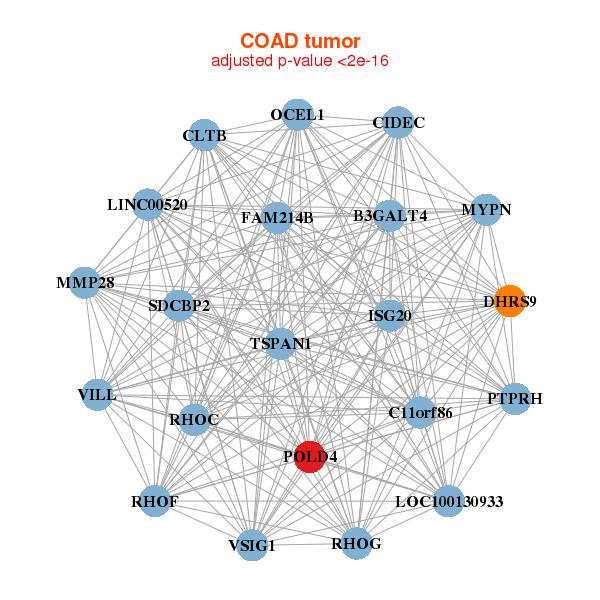
| * Co-Expression network figures were drawn using R package igraph. Only the top 20 genes with the highest correlations were shown. Red circle: input gene, orange circle: cell metabolism gene, sky circle: other gene |
: Open all plots for all cancer types
 |
|
| AIP,ANKRD13D,BLOC1S1,BRMS1,IFT43,CDK2AP2,CHCHD5, CORO1B,FAM195A,MPG,NDUFA2,NDUFS8,NME3,NUDT22, POLD4,PPP1CA,RAD9A,SSH3,TMEM134,TMEM219,ZNF688 | ARL2,BLOC1S1,BLVRB,LAMTOR4,CISD3,EGLN2,FAM50A, GNPTG,MTX1,NAGPA,OAZ1,PNKD,POLD4,RNPEPL1, LAMTOR2,SHARPIN,SLC2A8,STUB1,TRAPPC2L,URM1,WDR45 |
 |
|
| B3GALT4,C11orf86,LINC00520,CIDEC,CLTB,DHRS9,ISG20, FAM214B,LOC100130933,MMP28,MYPN,OCEL1,POLD4,PTPRH, RHOC,RHOF,RHOG,SDCBP2,TSPAN1,VILL,VSIG1 | ACOT8,ATP6V0D1,C1orf210,CHMP2A,CIB1,CLDN7,DOK4, HTATIP2,POLD4,PPP1CA,PRRG2,PRSS3,RAB4B,RAB5C, RER1,RHOC,SIRT7,STXBP2,TAF10,TMEM45B,ZFAND2B |

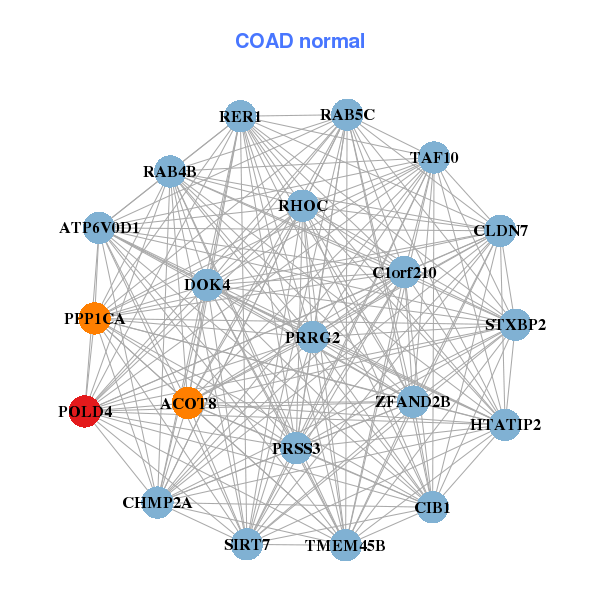
| * Co-Expression network figures were drawn using R package igraph. Only the top 20 genes with the highest correlations were shown. Red circle: input gene, orange circle: cell metabolism gene, sky circle: other gene |
: Open all plots for all cancer types
| Top |
: Open all interacting genes' information including KEGG pathway for all interacting genes from DAVID
| Top |
| Pharmacological Information for POLD4 |
| There's no related Drug. |
| Top |
| Cross referenced IDs for POLD4 |
| * We obtained these cross-references from Uniprot database. It covers 150 different DBs, 18 categories. http://www.uniprot.org/help/cross_references_section |
: Open all cross reference information
|
Copyright © 2016-Present - The Univsersity of Texas Health Science Center at Houston @ |