|
||||||||||||||||||||
| |
| Phenotypic Information (metabolism pathway, cancer, disease, phenome) |
| |
| |
| Gene-Gene Network Information: Co-Expression Network, Interacting Genes & KEGG |
| |
|


| Gene Summary for ALDH18A1 |
| Basic gene info. | Gene symbol | ALDH18A1 |
| Gene name | aldehyde dehydrogenase 18 family, member A1 | |
| Synonyms | ARCL3A|GSAS|P5CS|PYCS | |
| Cytomap | UCSC genome browser: 10q24.3 | |
| Genomic location | chr10 :97365685-97416567 | |
| Type of gene | protein-coding | |
| RefGenes | NM_001017423.1, NM_002860.3, | |
| Ensembl id | ENSG00000059573 | |
| Description | aldehyde dehydrogenase family 18 member A1delta-1-pyrroline-5-carboxylate synthasedelta-1-pyrroline-5-carboxylate synthetasedelta1-pyrroline-5-carboxlate synthetasepyrroline-5-carboxylate synthetase (glutamate gamma-semialdehyde synthetase) | |
| Modification date | 20141211 | |
| dbXrefs | MIM : 138250 | |
| HGNC : HGNC | ||
| Ensembl : ENSG00000059573 | ||
| HPRD : 00696 | ||
| Vega : OTTHUMG00000018815 | ||
| Protein | UniProt: go to UniProt's Cross Reference DB Table | |
| Expression | CleanEX: HS_ALDH18A1 | |
| BioGPS: 5832 | ||
| Gene Expression Atlas: ENSG00000059573 | ||
| The Human Protein Atlas: ENSG00000059573 | ||
| Pathway | NCI Pathway Interaction Database: ALDH18A1 | |
| KEGG: ALDH18A1 | ||
| REACTOME: ALDH18A1 | ||
| ConsensusPathDB | ||
| Pathway Commons: ALDH18A1 | ||
| Metabolism | MetaCyc: ALDH18A1 | |
| HUMANCyc: ALDH18A1 | ||
| Regulation | Ensembl's Regulation: ENSG00000059573 | |
| miRBase: chr10 :97,365,685-97,416,567 | ||
| TargetScan: NM_001017423 | ||
| cisRED: ENSG00000059573 | ||
| Context | iHOP: ALDH18A1 | |
| cancer metabolism search in PubMed: ALDH18A1 | ||
| UCL Cancer Institute: ALDH18A1 | ||
| Assigned class in ccmGDB | C | |
| Top |
| Phenotypic Information for ALDH18A1(metabolism pathway, cancer, disease, phenome) |
| Cancer | CGAP: ALDH18A1 |
| Familial Cancer Database: ALDH18A1 | |
| * This gene is included in those cancer gene databases. |
|
|
|
|
|
| . | ||||||||||||||
Oncogene 1 | Significant driver gene in | |||||||||||||||||||
| cf) number; DB name 1 Oncogene; http://nar.oxfordjournals.org/content/35/suppl_1/D721.long, 2 Tumor Suppressor gene; https://bioinfo.uth.edu/TSGene/, 3 Cancer Gene Census; http://www.nature.com/nrc/journal/v4/n3/abs/nrc1299.html, 4 CancerGenes; http://nar.oxfordjournals.org/content/35/suppl_1/D721.long, 5 Network of Cancer Gene; http://ncg.kcl.ac.uk/index.php, 1Therapeutic Vulnerabilities in Cancer; http://cbio.mskcc.org/cancergenomics/statius/ |
| KEGG_ARGININE_AND_PROLINE_METABOLISM REACTOME_METABOLISM_OF_AMINO_ACIDS_AND_DERIVATIVES | |
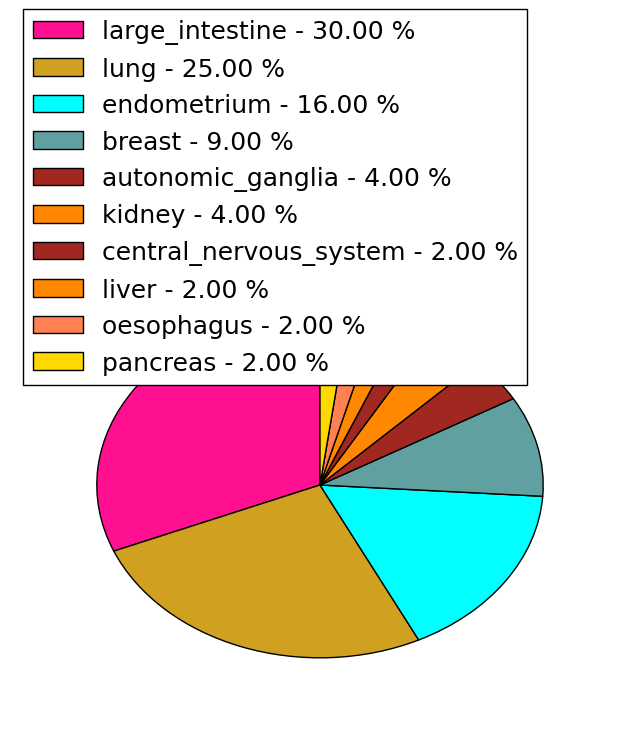
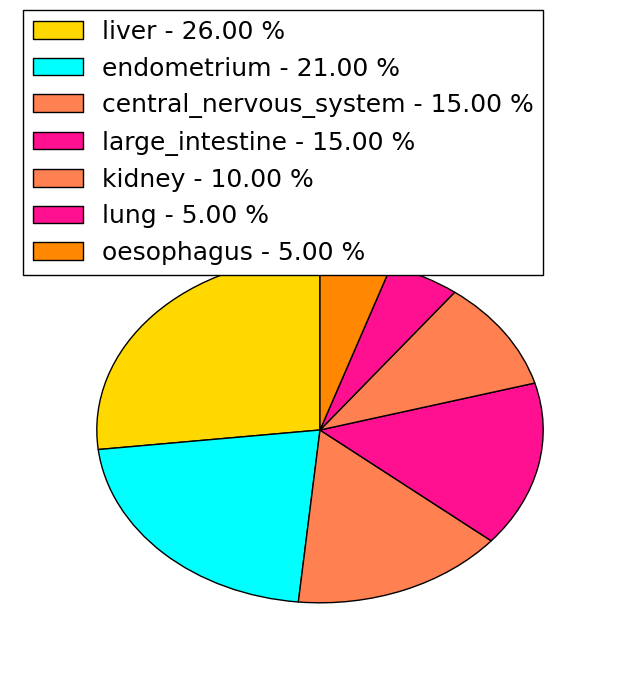
| Mutations for ALDH18A1 |
| * Under tables are showing count per each tissue to give us broad intuition about tissue specific mutation patterns.You can go to the detailed page for each mutation database's web site. |
| - Statistics for Tissue and Mutation type | Top |
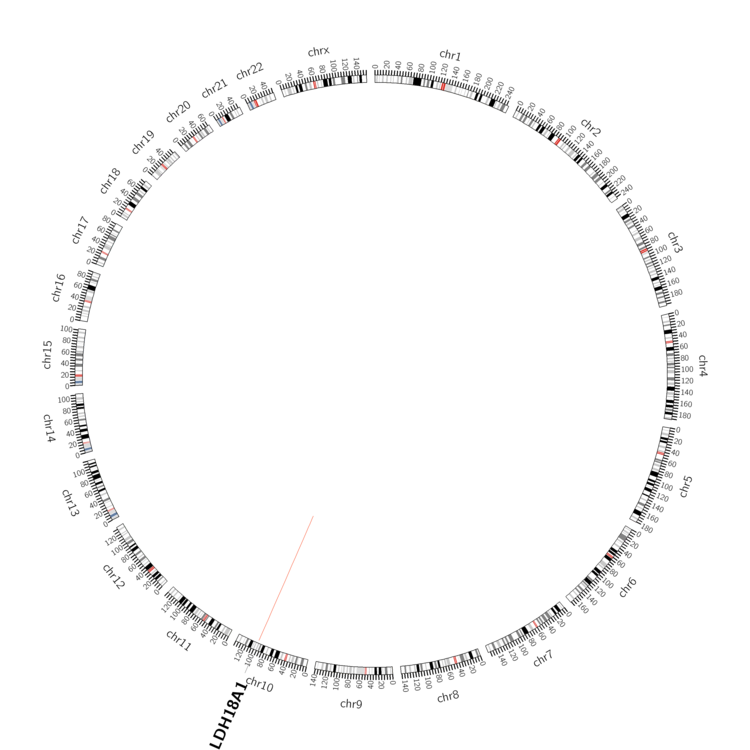 |
| - For Inter-chromosomal Variations |
| There's no inter-chromosomal structural variation. |
| - For Intra-chromosomal Variations |
| * Intra-chromosomal variantions includes 'intrachromosomal amplicon to amplicon', 'intrachromosomal amplicon to non-amplified dna', 'intrachromosomal deletion', 'intrachromosomal fold-back inversion', 'intrachromosomal inversion', 'intrachromosomal tandem duplication', 'Intrachromosomal unknown type', 'intrachromosomal with inverted orientation', 'intrachromosomal with non-inverted orientation'. |
 |
| Sample | Symbol_a | Chr_a | Start_a | End_a | Symbol_b | Chr_b | Start_b | End_b |
| ovary | ALDH18A1 | chr10 | 97378419 | 97378439 | ALDH18A1 | chr10 | 97378144 | 97378164 |
| cf) Tissue number; Tissue name (1;Breast, 2;Central_nervous_system, 3;Haematopoietic_and_lymphoid_tissue, 4;Large_intestine, 5;Liver, 6;Lung, 7;Ovary, 8;Pancreas, 9;Prostate, 10;Skin, 11;Soft_tissue, 12;Upper_aerodigestive_tract) |
| * From mRNA Sanger sequences, Chitars2.0 arranged chimeric transcripts. This table shows ALDH18A1 related fusion information. |
| ID | Head Gene | Tail Gene | Accession | Gene_a | qStart_a | qEnd_a | Chromosome_a | tStart_a | tEnd_a | Gene_a | qStart_a | qEnd_a | Chromosome_a | tStart_a | tEnd_a |
| BX503218 | ALDH18A1 | 1 | 264 | 10 | 97385120 | 97387295 | ZNF271 | 259 | 488 | 18 | 32888363 | 32888589 | |
| EY198528 | ALDH18A1 | 1 | 241 | 10 | 97366159 | 97366399 | CALCOCO2 | 238 | 406 | 17 | 46937745 | 46940272 | |
| BG959752 | ALDH18A1 | 6 | 81 | 10 | 97373570 | 97373750 | HGSNAT | 76 | 153 | 8 | 43056307 | 43056388 | |
| BP341719 | ALDH18A1 | 1 | 463 | 10 | 97371083 | 97416468 | ALDH18A1 | 454 | 579 | 10 | 97402862 | 97413070 | |
| Top |
| There's no copy number variation information in COSMIC data for this gene. |
| Top |
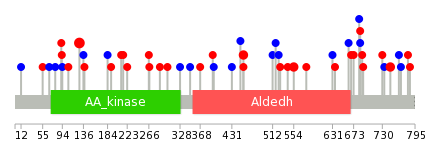
|
 |
| Top |
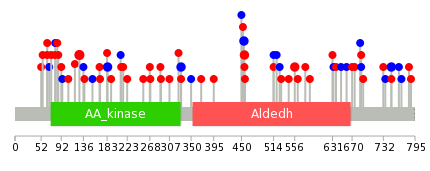
| Stat. for Non-Synonymous SNVs (# total SNVs=43) | (# total SNVs=19) |
 |  |
(# total SNVs=1) | (# total SNVs=0) |
 |
| Top |
| * When you move the cursor on each content, you can see more deailed mutation information on the Tooltip. Those are primary_site,primary_histology,mutation(aa),pubmedID. |
| GRCh37 position | Mutation(aa) | Unique sampleID count |
| chr10:97397115-97397115 | p.R128C | 3 |
| chr10:97366663-97366663 | p.A748A | 2 |
| chr10:97387287-97387287 | p.G330G | 2 |
| chr10:97402861-97402861 | p.R64H | 2 |
| chr10:97380889-97380889 | p.R456C | 2 |
| chr10:97396856-97396856 | p.A184A | 2 |
| chr10:97380890-97380890 | p.L455L | 2 |
| chr10:97373858-97373858 | p.I556V | 2 |
| chr10:97371130-97371130 | p.R665* | 2 |
| chr10:97385182-97385182 | p.L395M | 1 |
| Top |
|
 |
| Point Mutation/ Tissue ID | 1 | 2 | 3 | 4 | 5 | 6 | 7 | 8 | 9 | 10 | 11 | 12 | 13 | 14 | 15 | 16 | 17 | 18 | 19 | 20 |
| # sample | 1 | 2 | 1 | 13 | 1 | 2 | 4 | 3 | 4 | 1 | 4 | 7 | 7 | |||||||
| # mutation | 1 | 2 | 1 | 10 | 1 | 2 | 4 | 5 | 4 | 1 | 5 | 8 | 11 | |||||||
| nonsynonymous SNV | 2 | 6 | 2 | 2 | 1 | 4 | 1 | 4 | 5 | 7 | ||||||||||
| synonymous SNV | 1 | 1 | 4 | 1 | 2 | 4 | 1 | 3 | 4 |
| cf) Tissue ID; Tissue type (1; BLCA[Bladder Urothelial Carcinoma], 2; BRCA[Breast invasive carcinoma], 3; CESC[Cervical squamous cell carcinoma and endocervical adenocarcinoma], 4; COAD[Colon adenocarcinoma], 5; GBM[Glioblastoma multiforme], 6; Glioma Low Grade, 7; HNSC[Head and Neck squamous cell carcinoma], 8; KICH[Kidney Chromophobe], 9; KIRC[Kidney renal clear cell carcinoma], 10; KIRP[Kidney renal papillary cell carcinoma], 11; LAML[Acute Myeloid Leukemia], 12; LUAD[Lung adenocarcinoma], 13; LUSC[Lung squamous cell carcinoma], 14; OV[Ovarian serous cystadenocarcinoma ], 15; PAAD[Pancreatic adenocarcinoma], 16; PRAD[Prostate adenocarcinoma], 17; SKCM[Skin Cutaneous Melanoma], 18:STAD[Stomach adenocarcinoma], 19:THCA[Thyroid carcinoma], 20:UCEC[Uterine Corpus Endometrial Carcinoma]) |
| Top |
| * We represented just top 10 SNVs. When you move the cursor on each content, you can see more deailed mutation information on the Tooltip. Those are primary_site, primary_histology, mutation(aa), pubmedID. |
| Genomic Position | Mutation(aa) | Unique sampleID count |
| chr10:97397115 | p.R128C,ALDH18A1 | 4 |
| chr10:97373858 | p.I554V,ALDH18A1 | 2 |
| chr10:97380888 | p.A746T,ALDH18A1 | 2 |
| chr10:97366665 | p.R454H,ALDH18A1 | 2 |
| chr10:97369966 | p.I686I,ALDH18A1 | 1 |
| chr10:97393321 | p.R454C,ALDH18A1 | 1 |
| chr10:97373783 | p.A184A,ALDH18A1 | 1 |
| chr10:97402812 | p.I686T,ALDH18A1 | 1 |
| chr10:97385174 | p.S448S,ALDH18A1 | 1 |
| chr10:97371042 | p.R138Q,ALDH18A1 | 1 |
| * Copy number data were extracted from TCGA using R package TCGA-Assembler. The URLs of all public data files on TCGA DCC data server were gathered on Jan-05-2015. Function ProcessCNAData in TCGA-Assembler package was used to obtain gene-level copy number value which is calculated as the average copy number of the genomic region of a gene. |
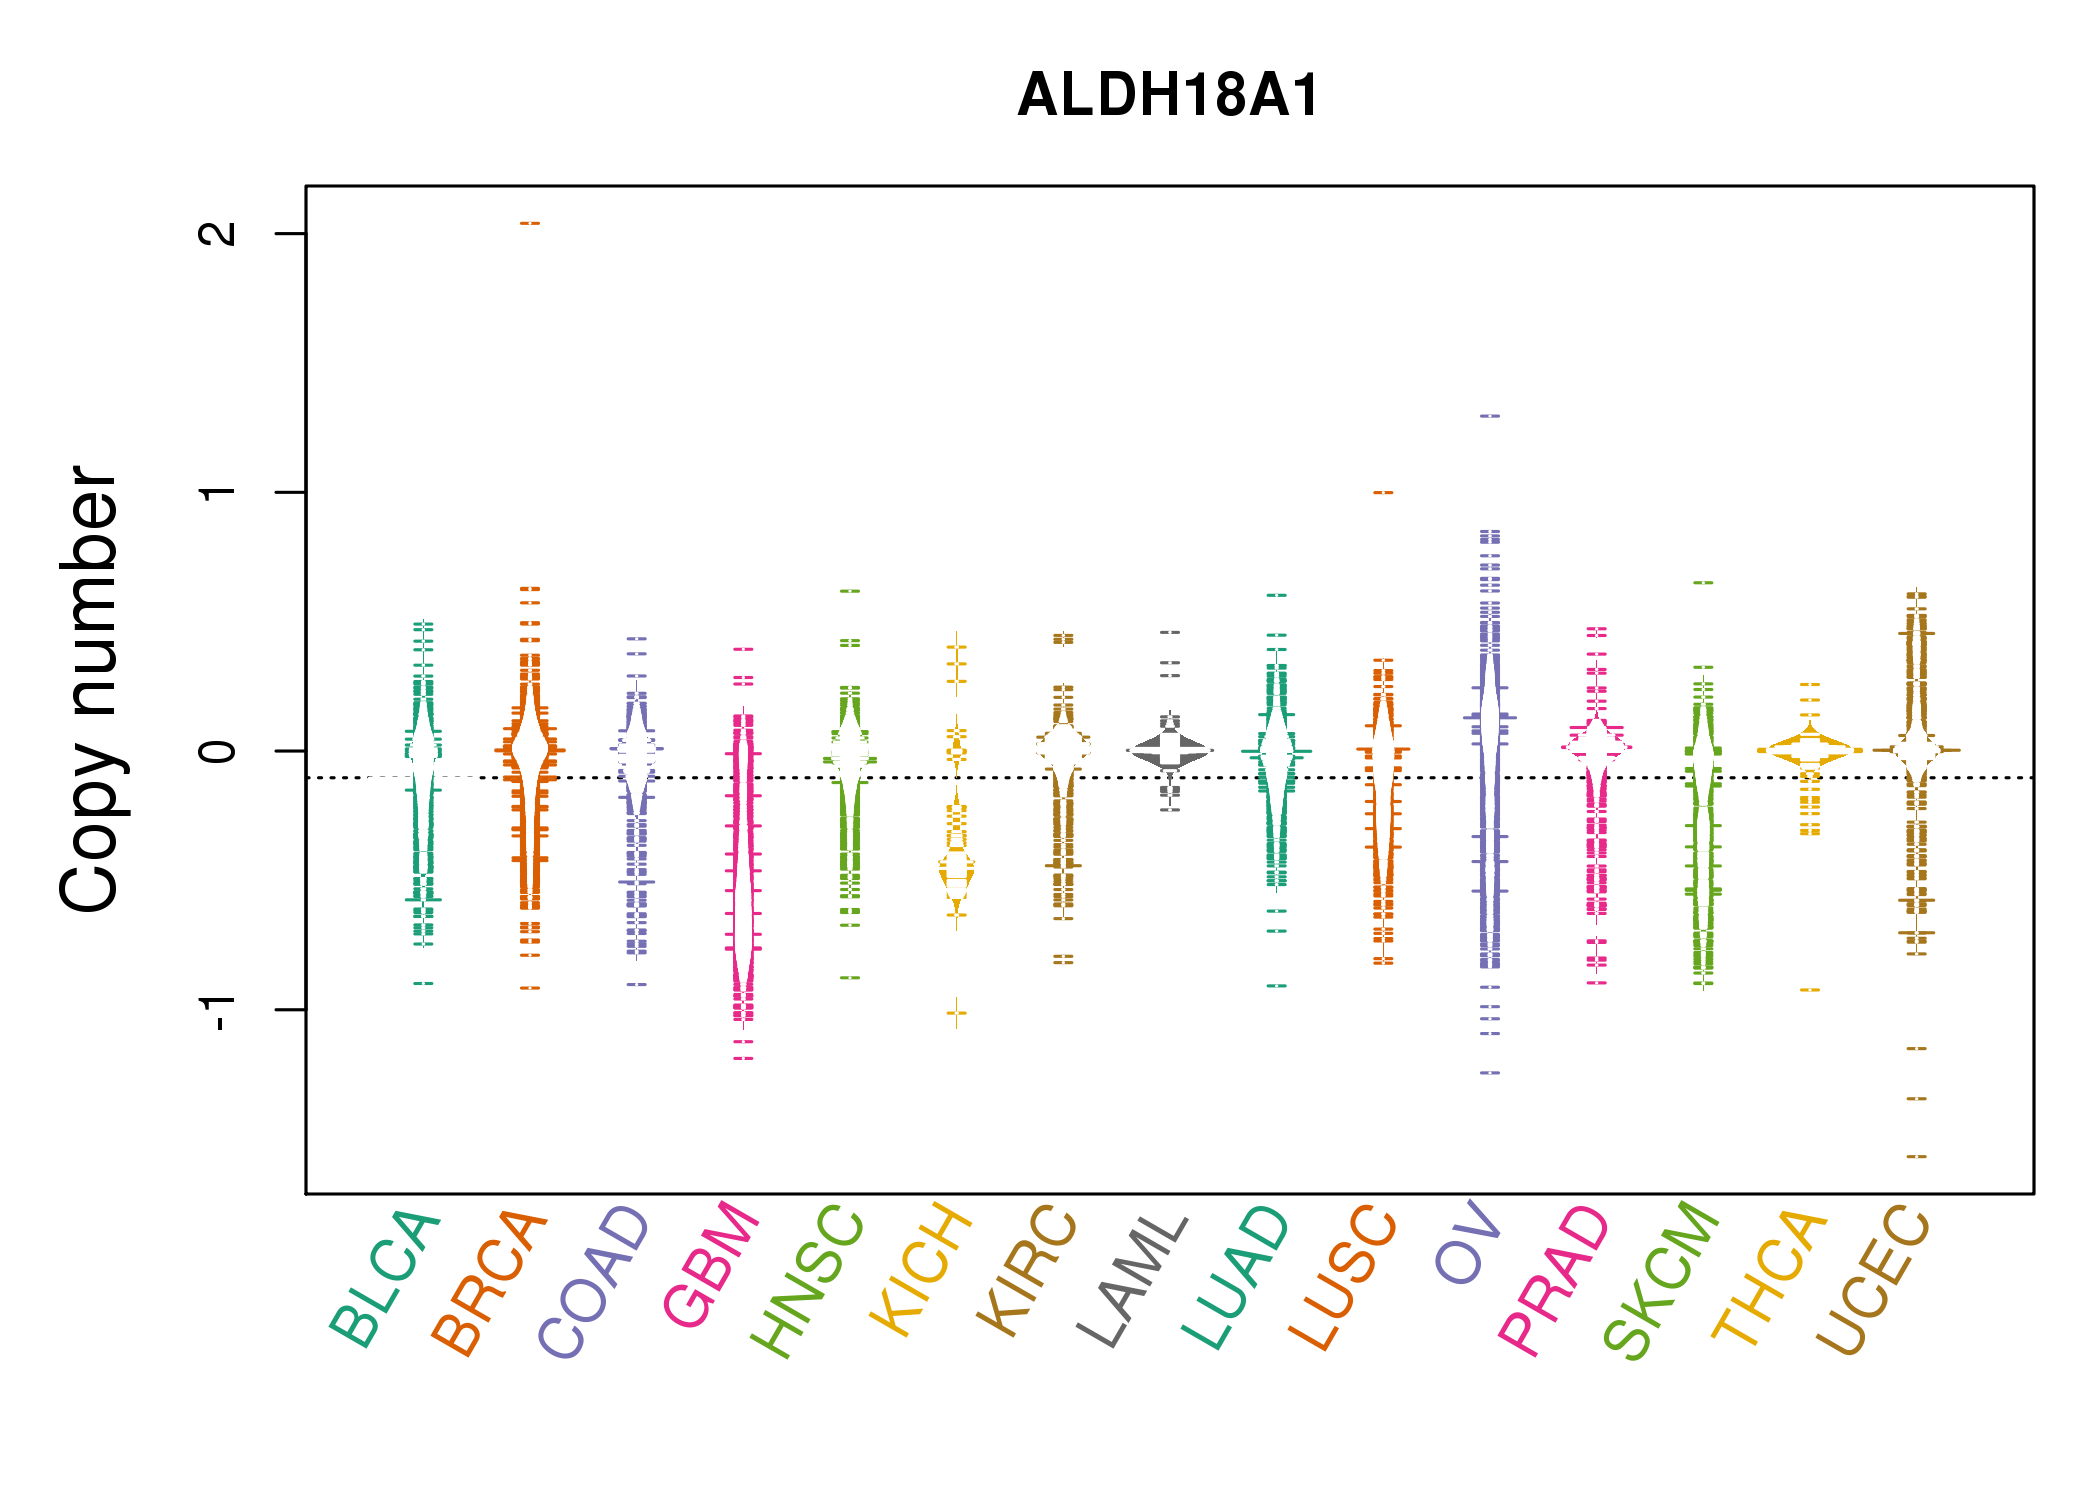 |
| cf) Tissue ID[Tissue type]: BLCA[Bladder Urothelial Carcinoma], BRCA[Breast invasive carcinoma], CESC[Cervical squamous cell carcinoma and endocervical adenocarcinoma], COAD[Colon adenocarcinoma], GBM[Glioblastoma multiforme], Glioma Low Grade, HNSC[Head and Neck squamous cell carcinoma], KICH[Kidney Chromophobe], KIRC[Kidney renal clear cell carcinoma], KIRP[Kidney renal papillary cell carcinoma], LAML[Acute Myeloid Leukemia], LUAD[Lung adenocarcinoma], LUSC[Lung squamous cell carcinoma], OV[Ovarian serous cystadenocarcinoma ], PAAD[Pancreatic adenocarcinoma], PRAD[Prostate adenocarcinoma], SKCM[Skin Cutaneous Melanoma], STAD[Stomach adenocarcinoma], THCA[Thyroid carcinoma], UCEC[Uterine Corpus Endometrial Carcinoma] |
| Top |
| Gene Expression for ALDH18A1 |
| * CCLE gene expression data were extracted from CCLE_Expression_Entrez_2012-10-18.res: Gene-centric RMA-normalized mRNA expression data. |
 |
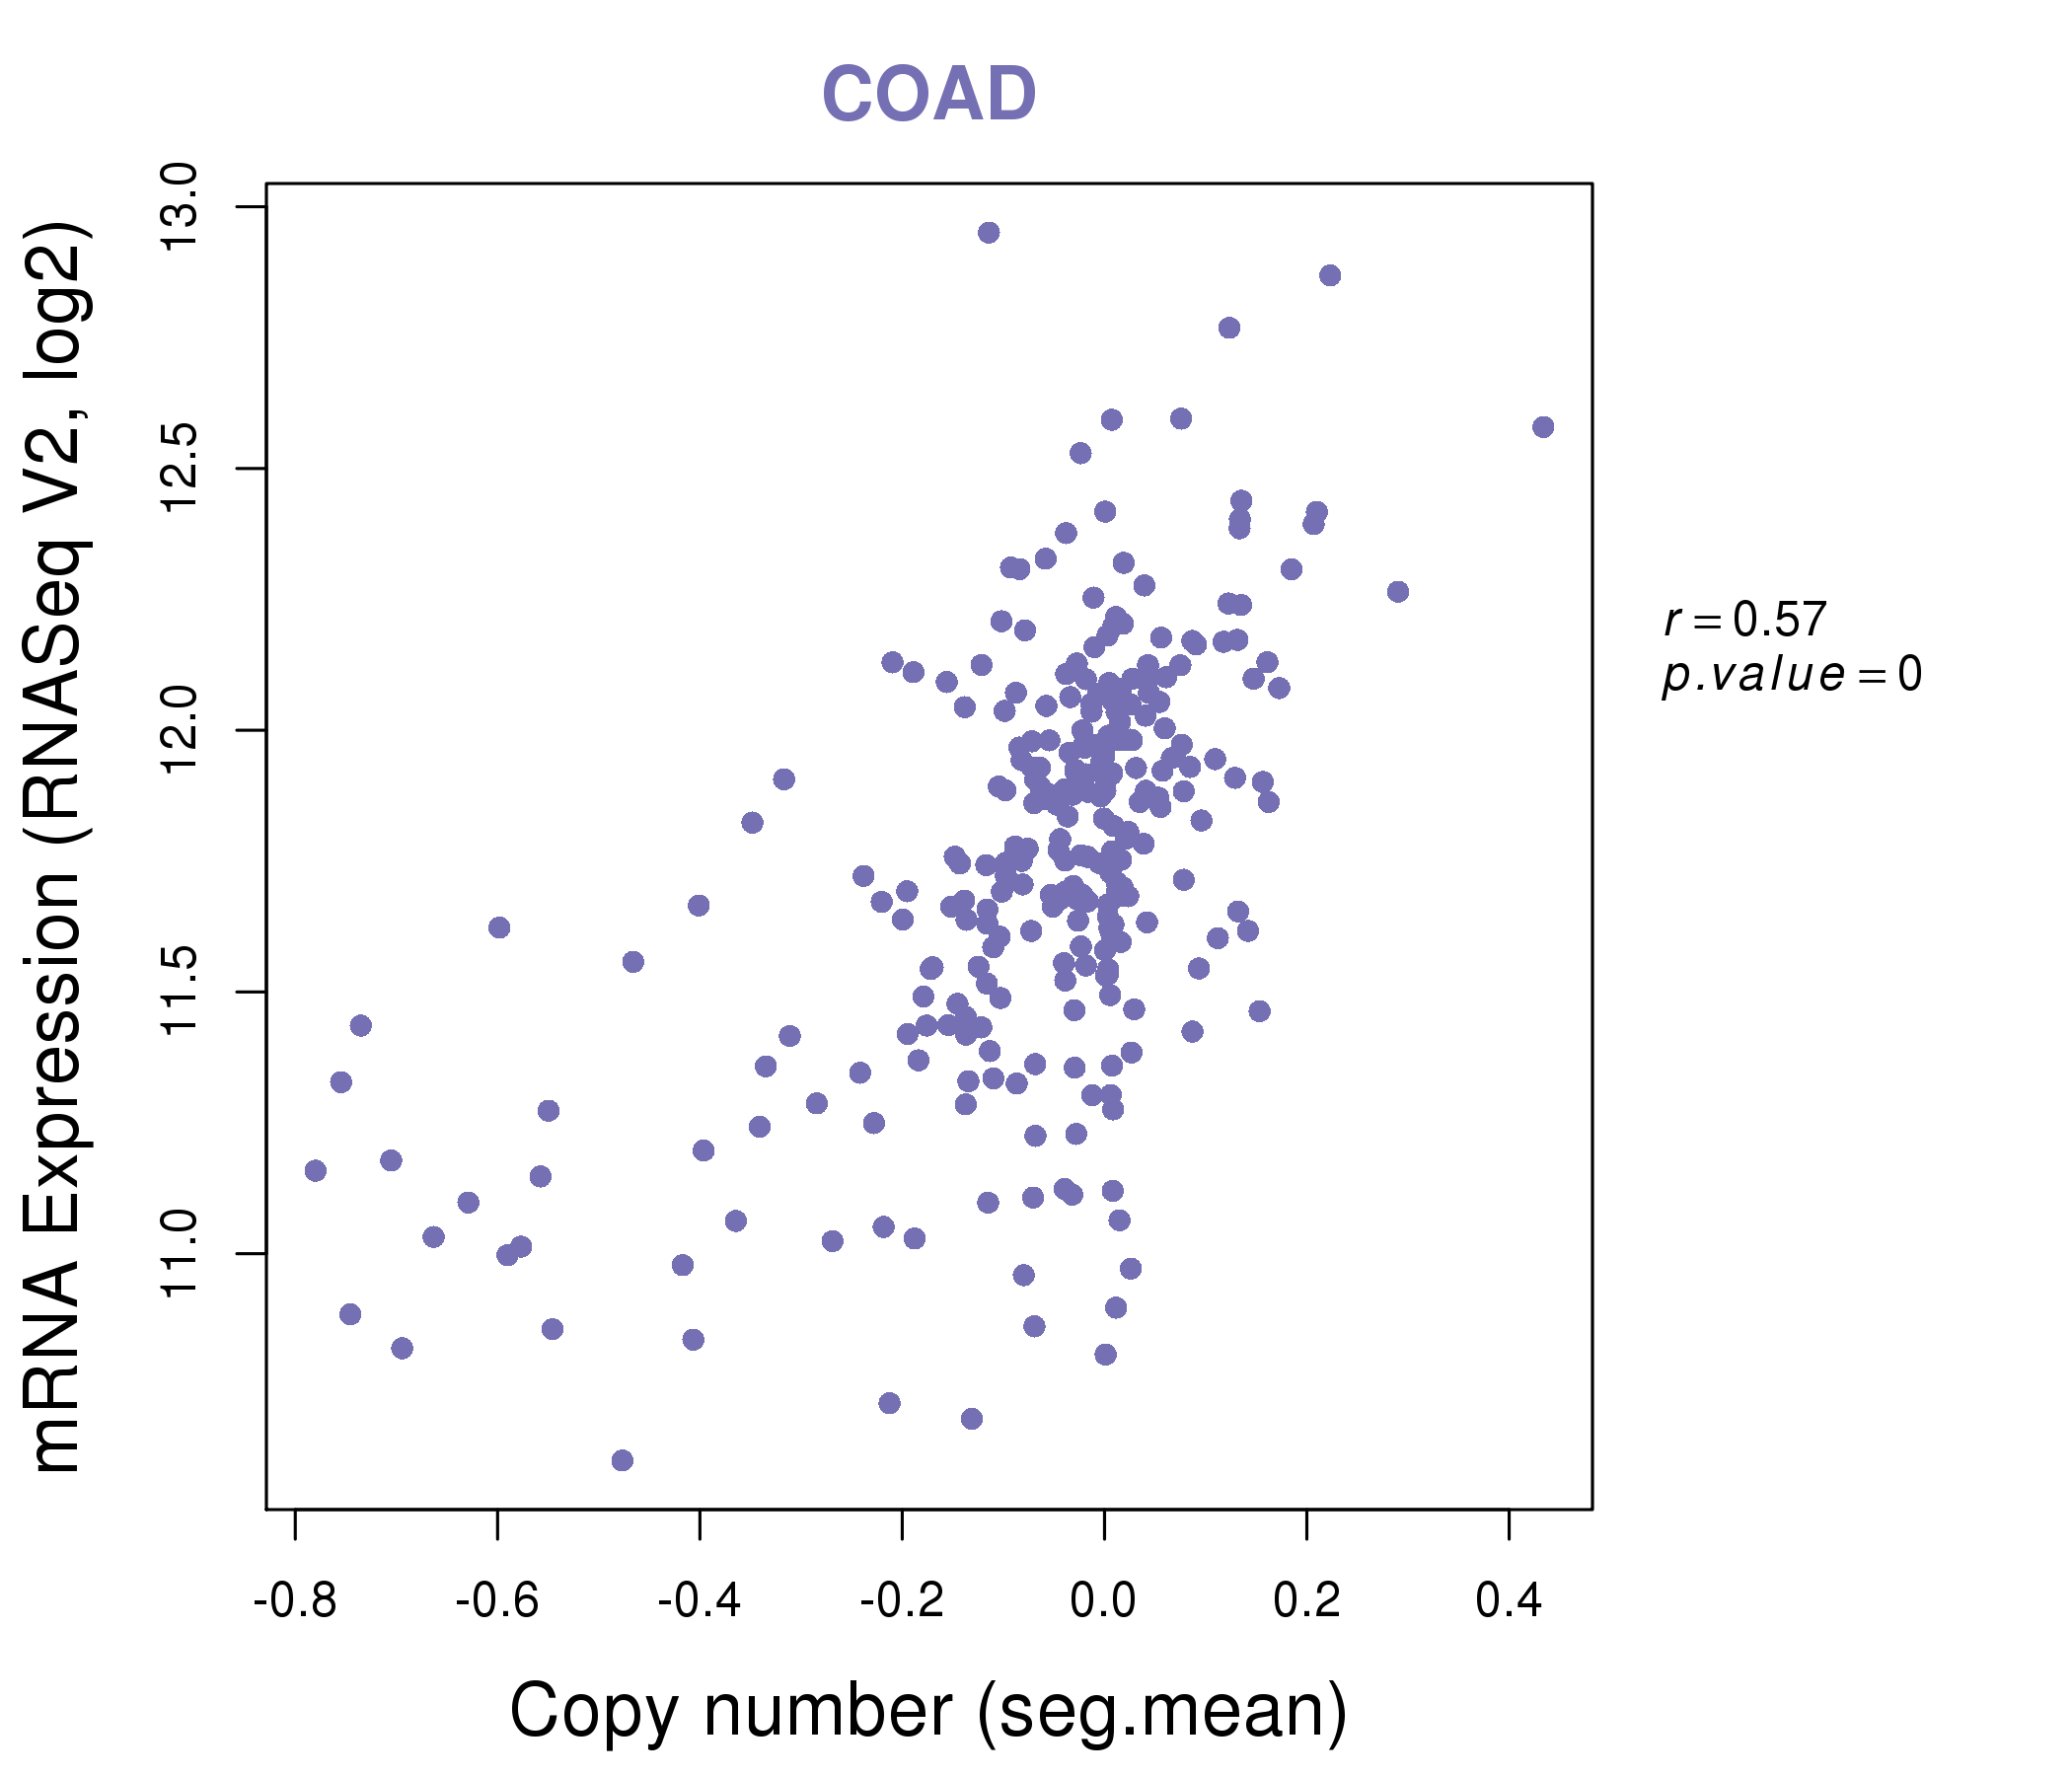
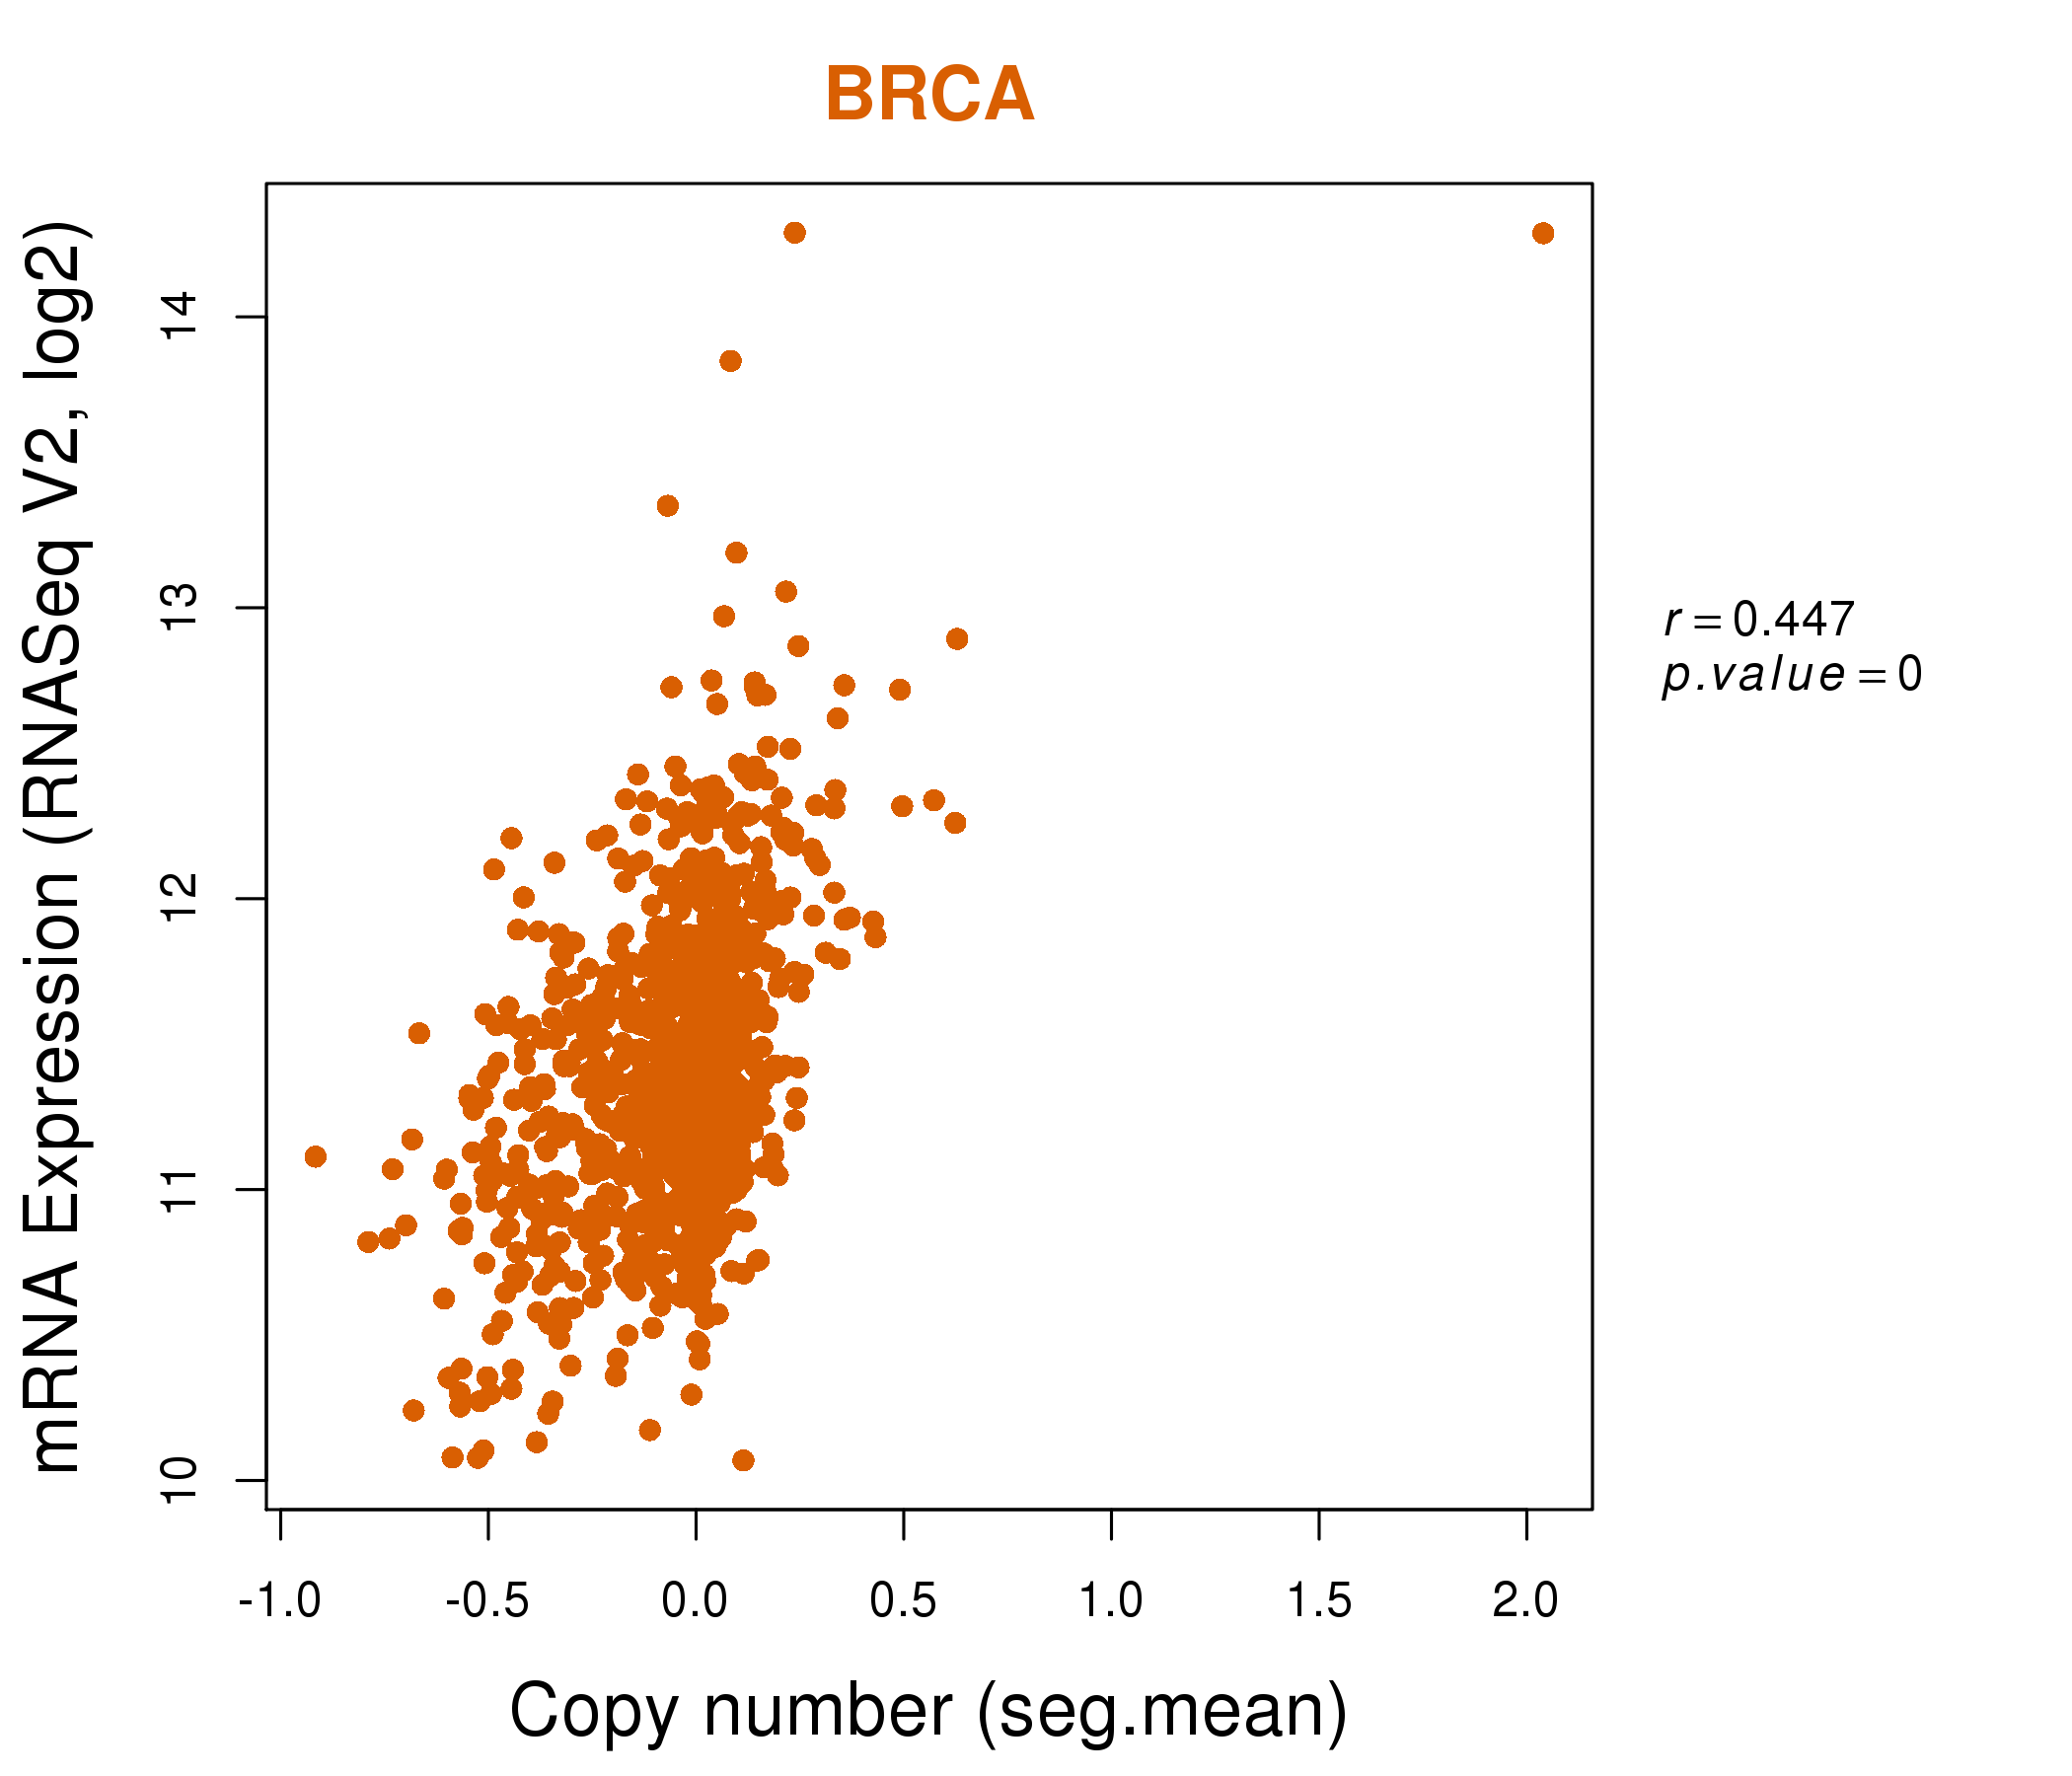
| * Normalized gene expression data of RNASeqV2 was extracted from TCGA using R package TCGA-Assembler. The URLs of all public data files on TCGA DCC data server were gathered at Jan-05-2015. Only eight cancer types have enough normal control samples for differential expression analysis. (t test, adjusted p<0.05 (using Benjamini-Hochberg FDR)) |
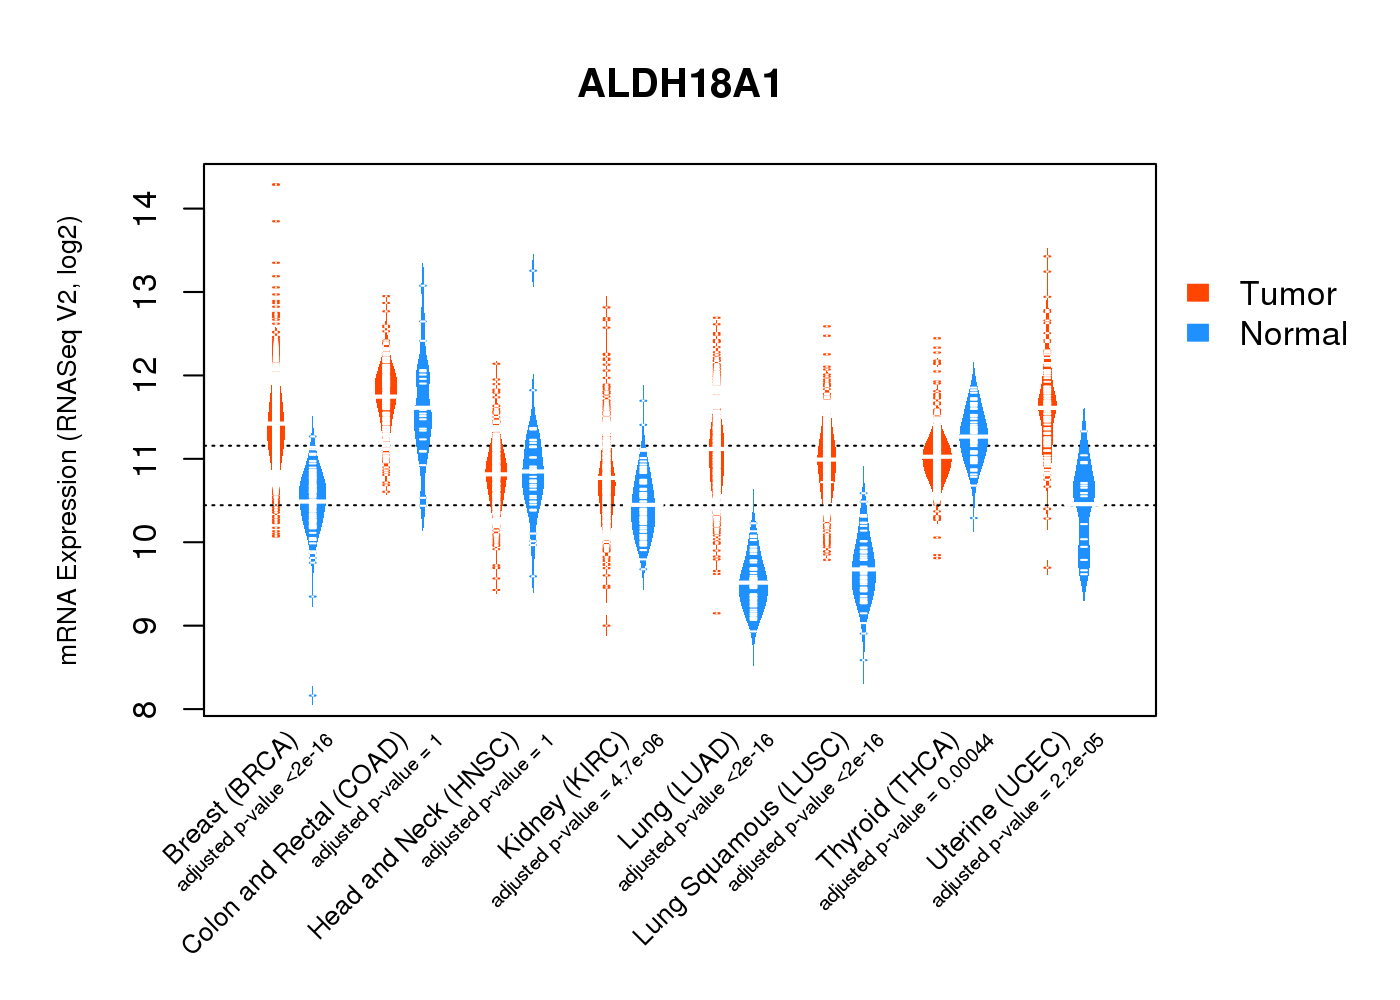 |
| Top |
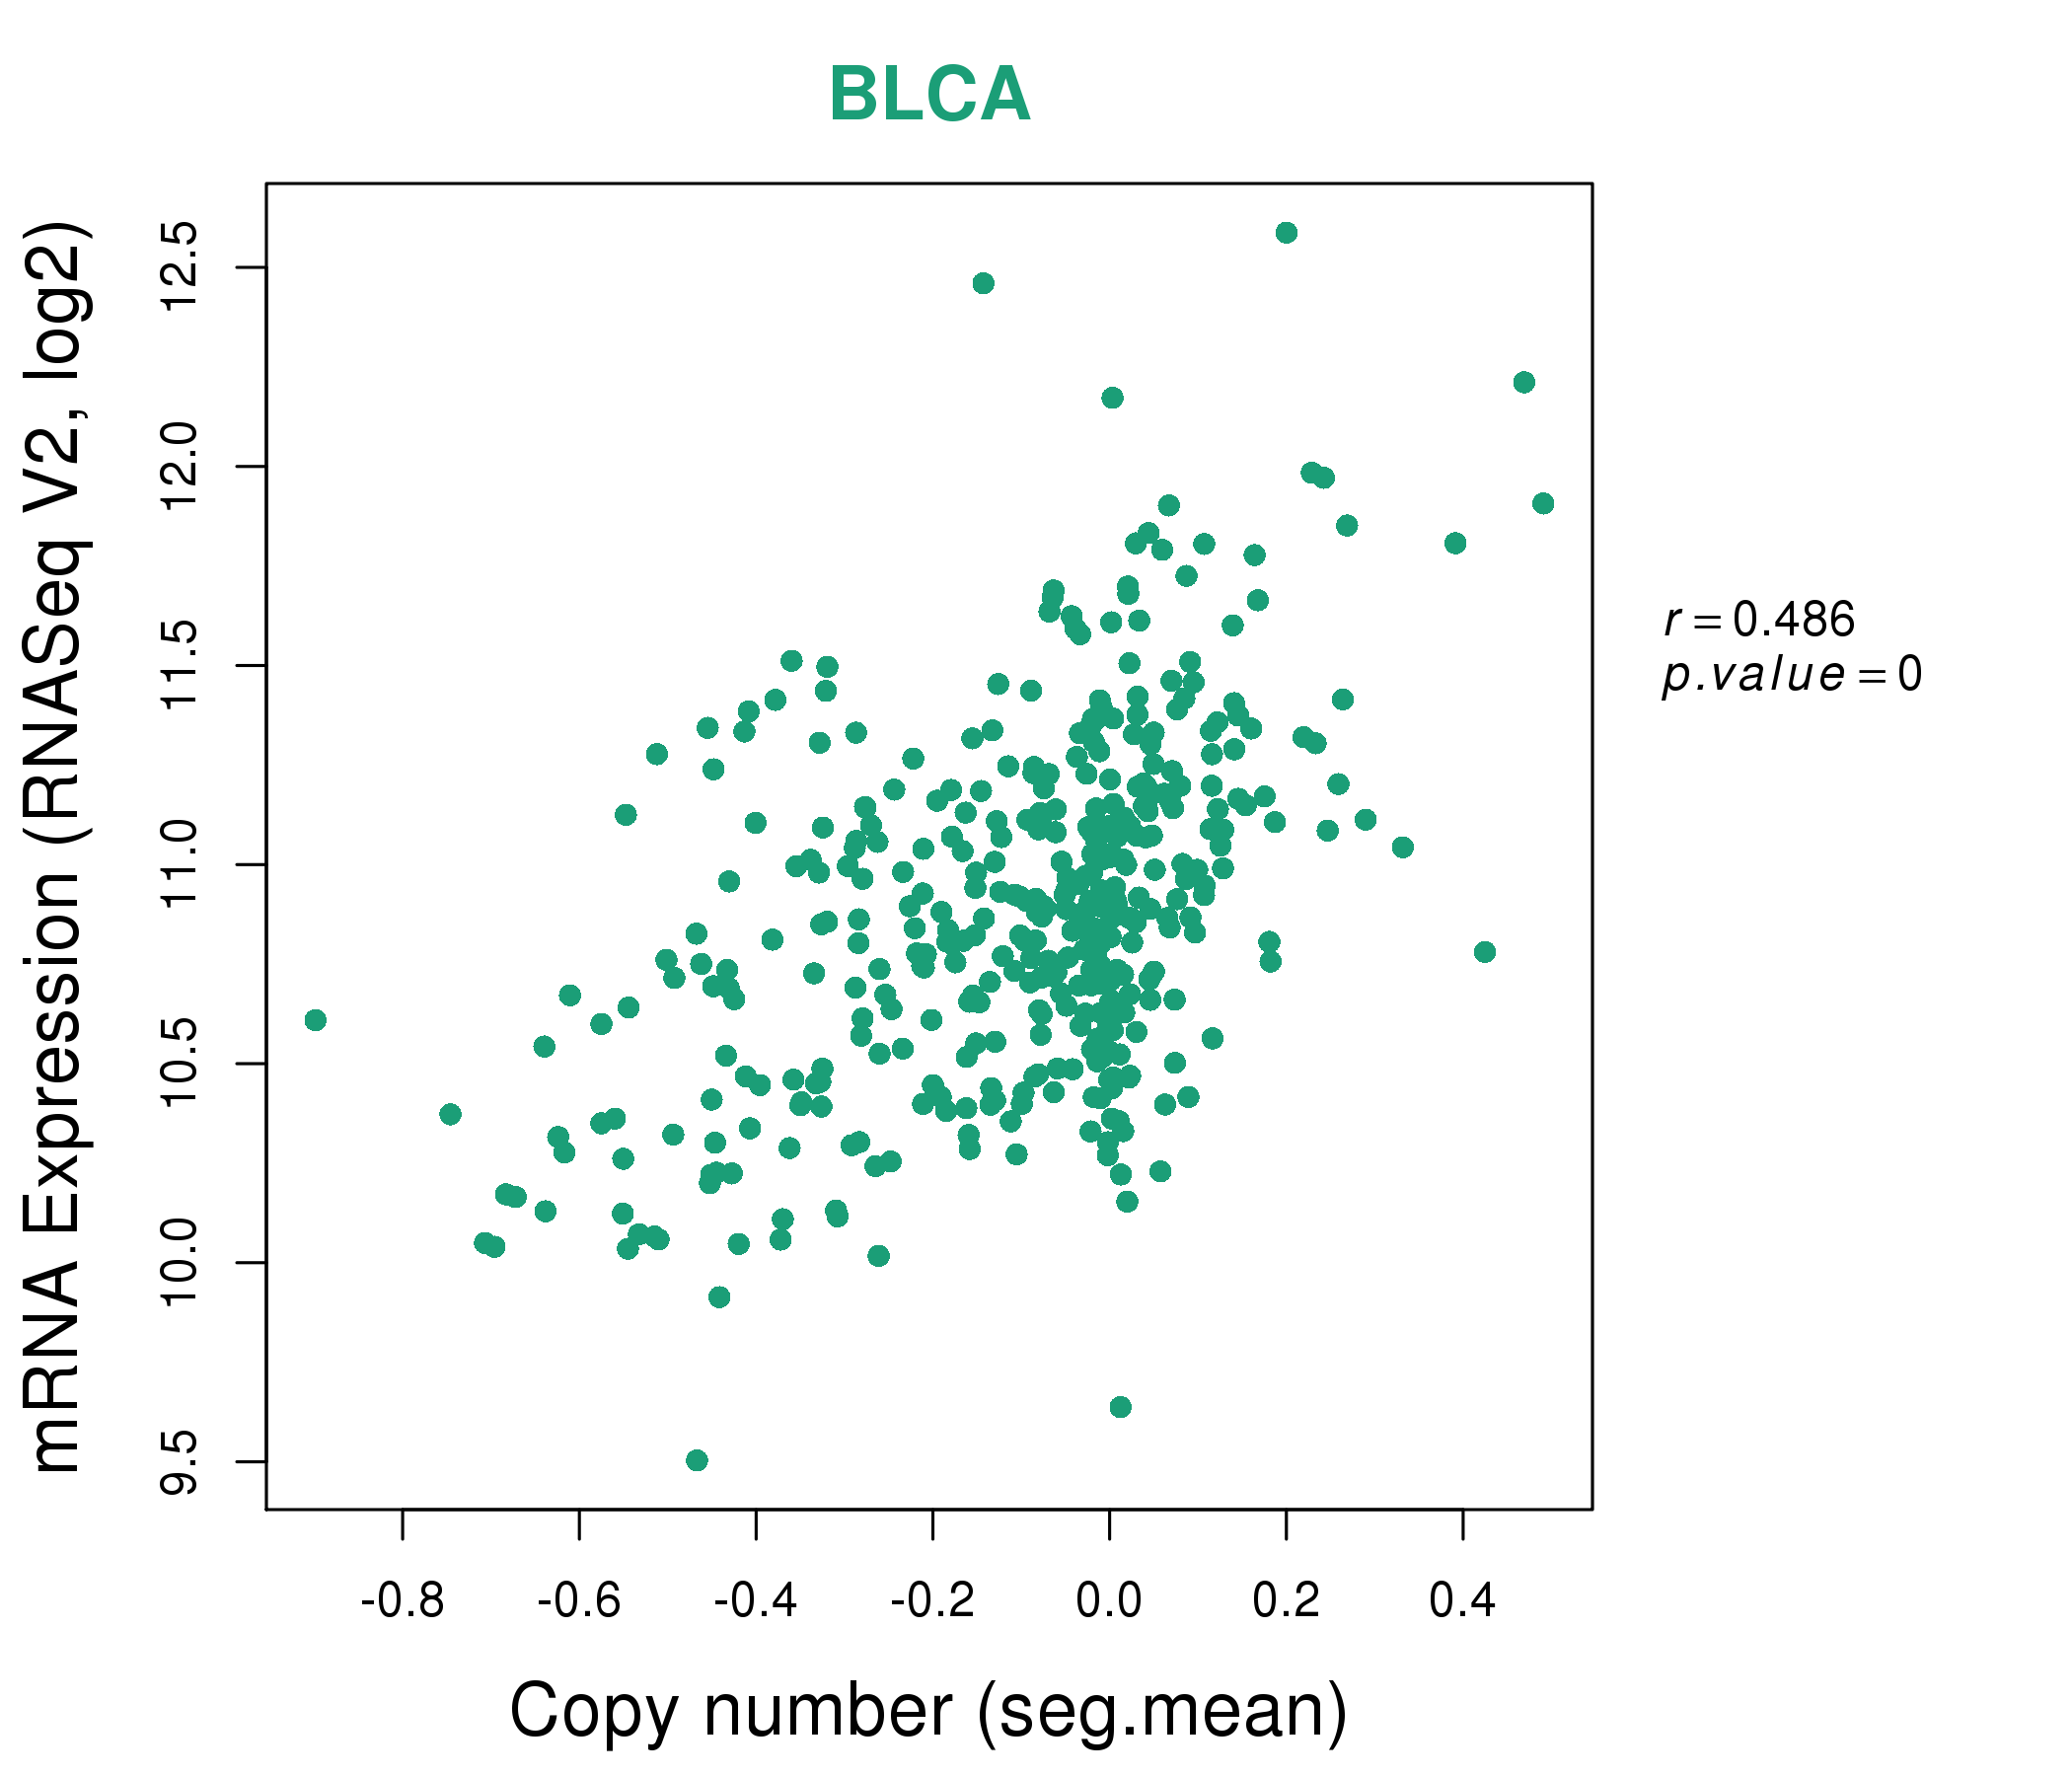
| * This plots show the correlation between CNV and gene expression. |
: Open all plots for all cancer types
 |
|
 |
|

| Top |
| Gene-Gene Network Information |
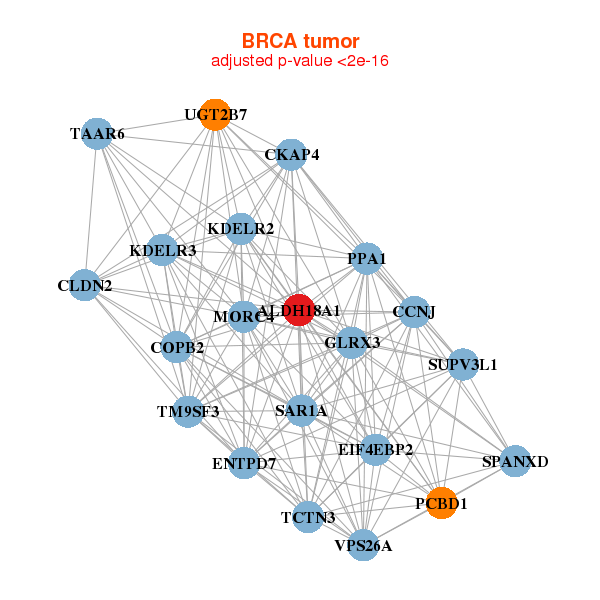
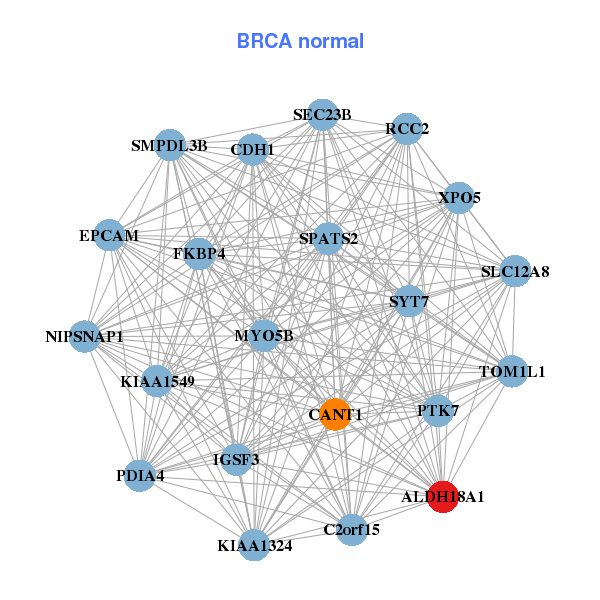
| * Co-Expression network figures were drawn using R package igraph. Only the top 20 genes with the highest correlations were shown. Red circle: input gene, orange circle: cell metabolism gene, sky circle: other gene |
: Open all plots for all cancer types
 |
| ||||
| ALDH18A1,CCNJ,CKAP4,CLDN2,COPB2,EIF4EBP2,ENTPD7, GLRX3,KDELR2,KDELR3,MORC4,PCBD1,PPA1,SAR1A, SPANXD,SUPV3L1,TAAR6,TCTN3,TM9SF3,UGT2B7,VPS26A | ALDH18A1,C2orf15,CANT1,CDH1,EPCAM,FKBP4,IGSF3, KIAA1324,KIAA1549,MYO5B,NIPSNAP1,PDIA4,PTK7,RCC2, SEC23B,SLC12A8,SMPDL3B,SPATS2,SYT7,TOM1L1,XPO5 | ||||
 |
| ||||
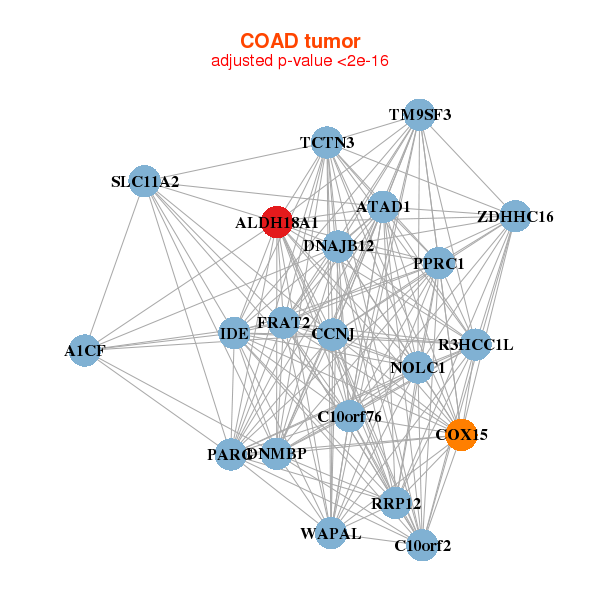
| A1CF,ALDH18A1,ATAD1,C10orf2,R3HCC1L,C10orf76,CCNJ, COX15,DNAJB12,DNMBP,FRAT2,IDE,NOLC1,PARG, PPRC1,RRP12,SLC11A2,TCTN3,TM9SF3,WAPAL,ZDHHC16 | ACOX1,AGPAT3,ALDH18A1,APLP2,ATP9A,ERBB3,LAMB3, MAST2,MGAT4A,MYO1D,NDRG1,PAG1,PSEN1,PTPRF, RETSAT,RMND5A,RNF103,SLC41A2,SORL1,SOS2,TRHDE |
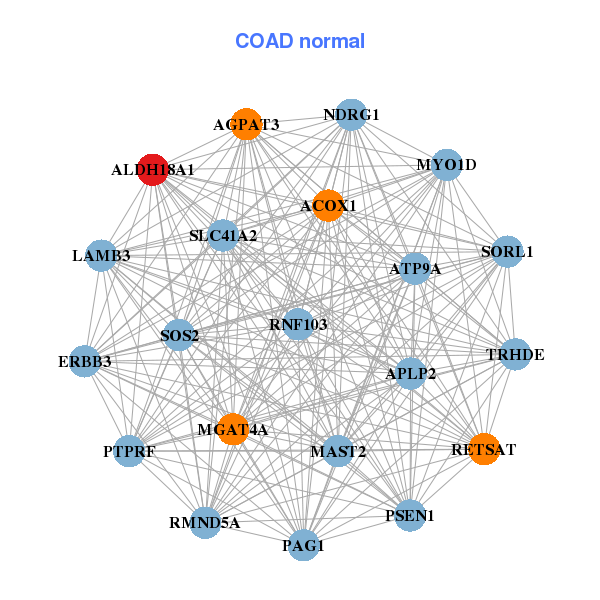
| * Co-Expression network figures were drawn using R package igraph. Only the top 20 genes with the highest correlations were shown. Red circle: input gene, orange circle: cell metabolism gene, sky circle: other gene |
: Open all plots for all cancer types
| Top |
: Open all interacting genes' information including KEGG pathway for all interacting genes from DAVID
| Top |
| Pharmacological Information for ALDH18A1 |
| DB Category | DB Name | DB's ID and Url link |
| * Gene Centered Interaction Network. |
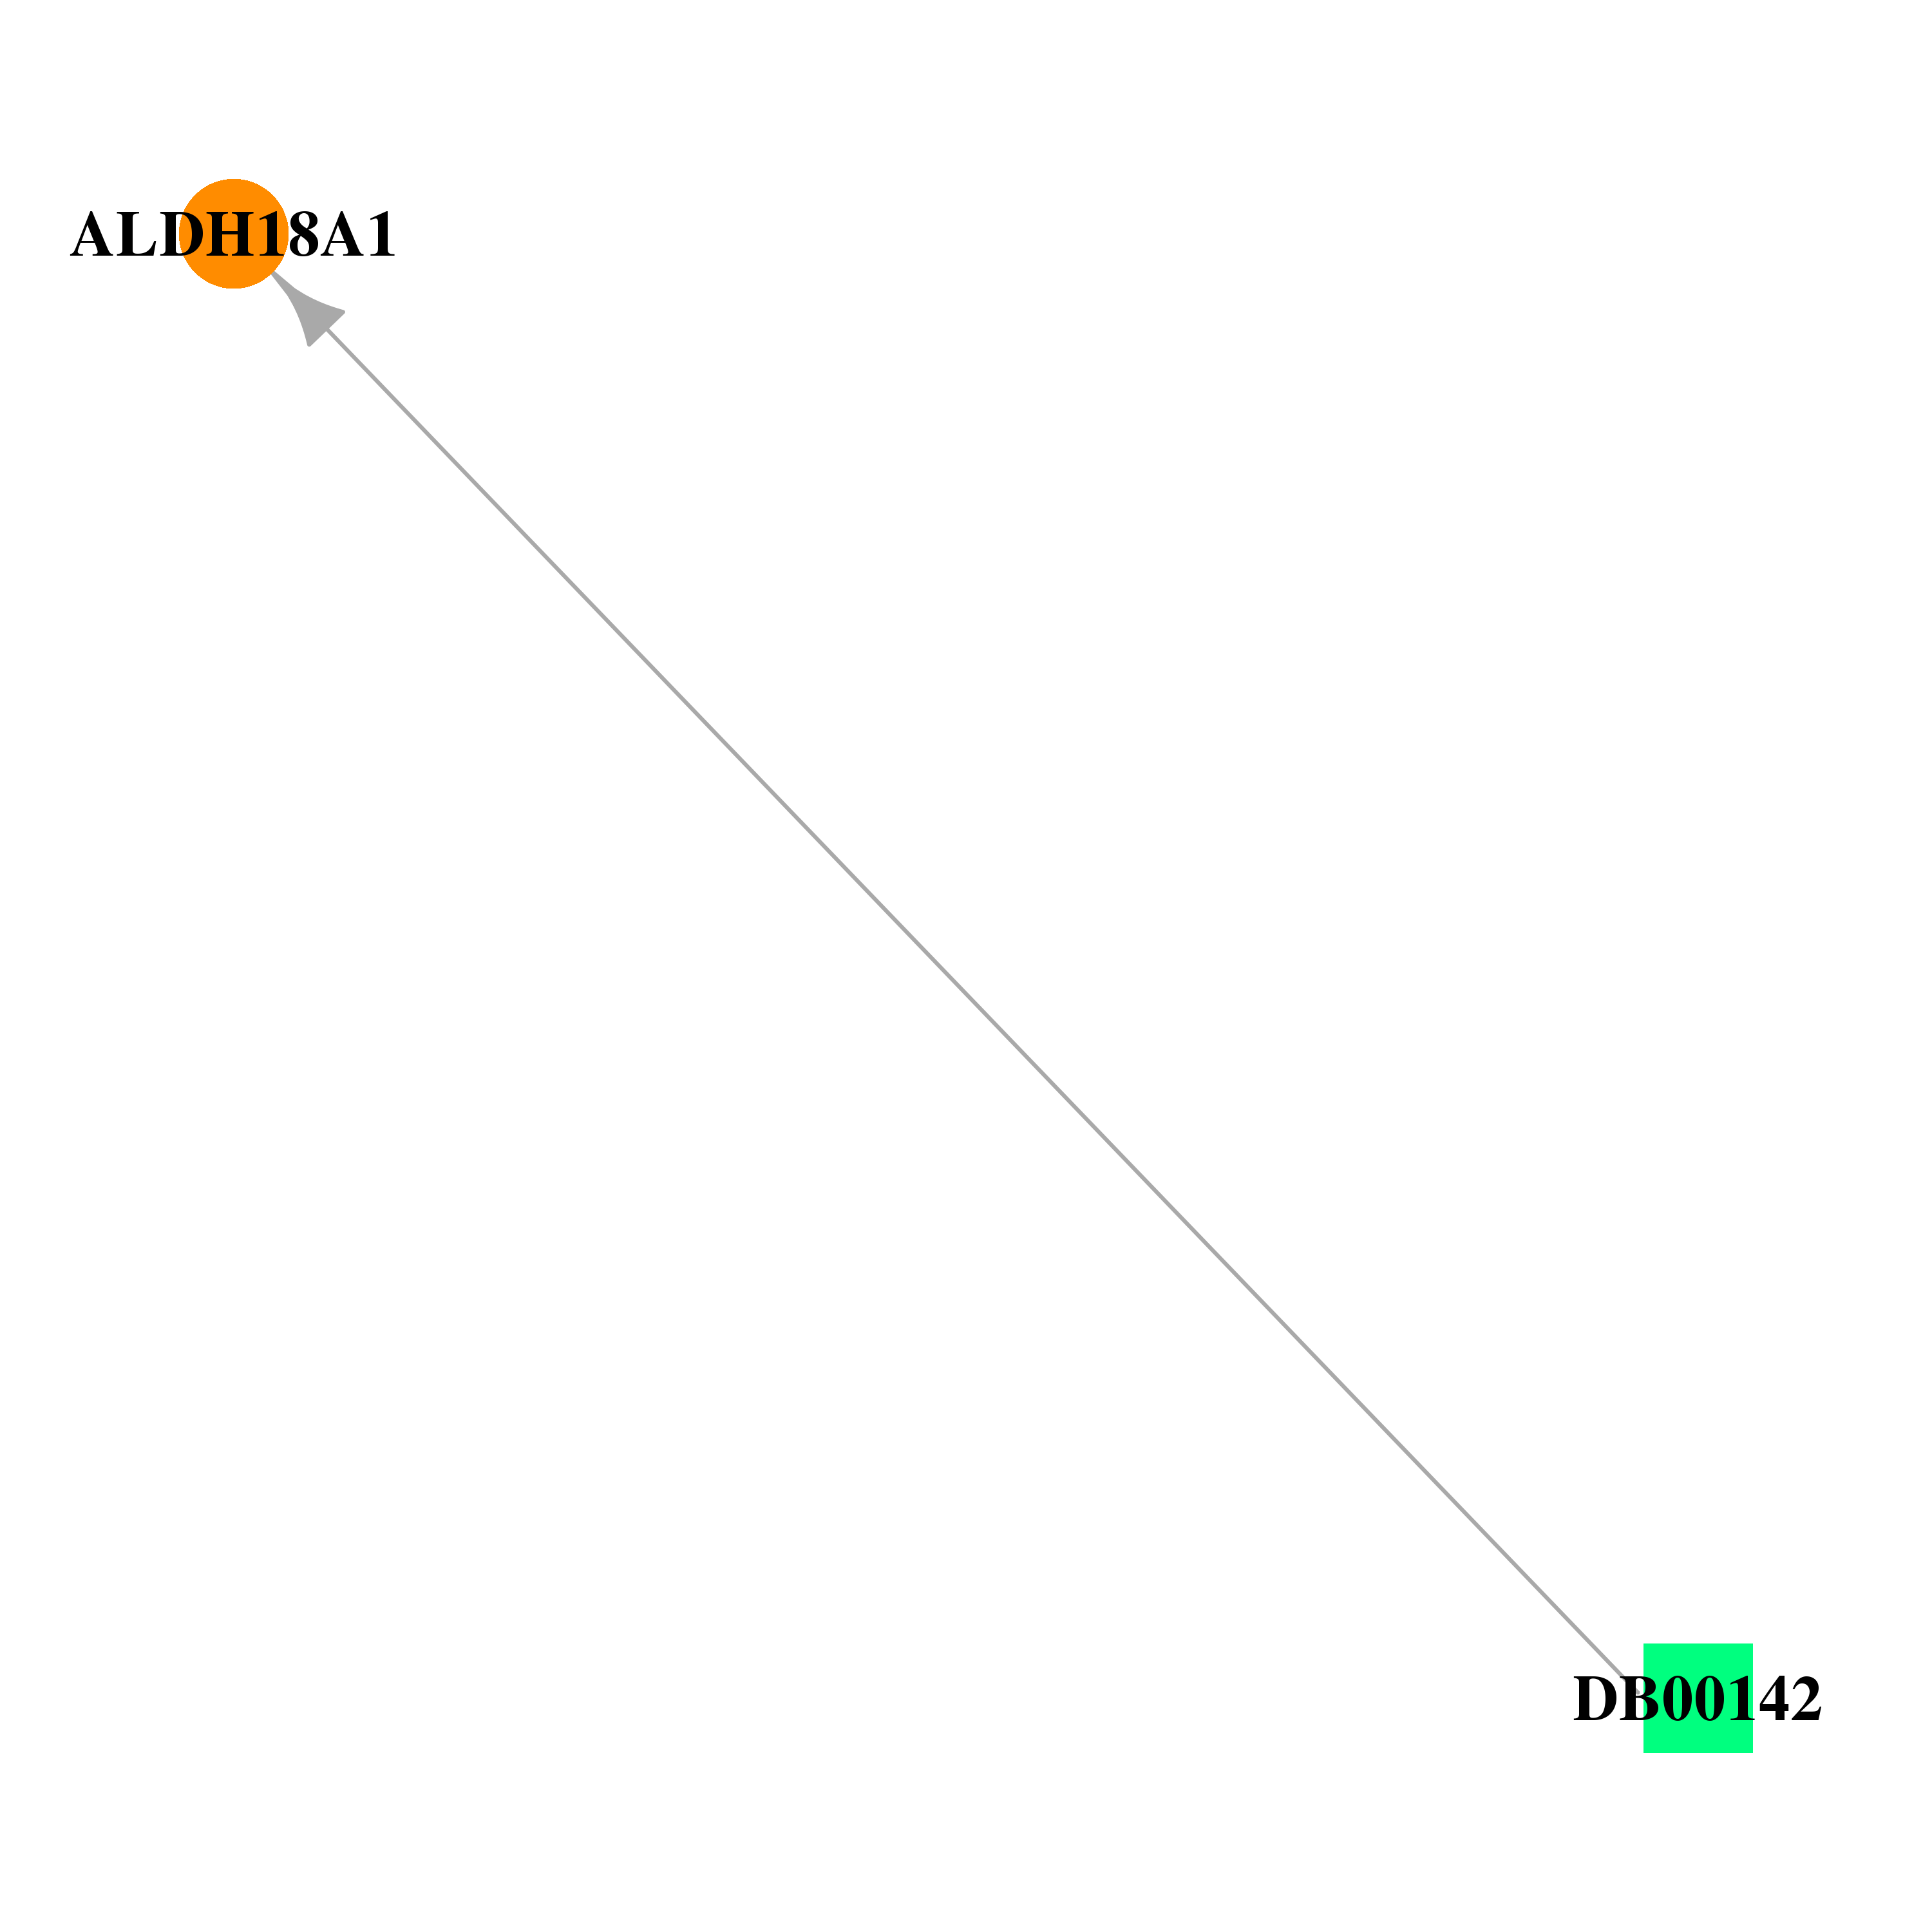 |
| * Drug Centered Interaction Network. |
| DrugBank ID | Target Name | Drug Groups | Generic Name | Drug Centered Network | Drug Structure |
| DB00142 | aldehyde dehydrogenase 18 family, member A1 | approved; nutraceutical | L-Glutamic Acid | 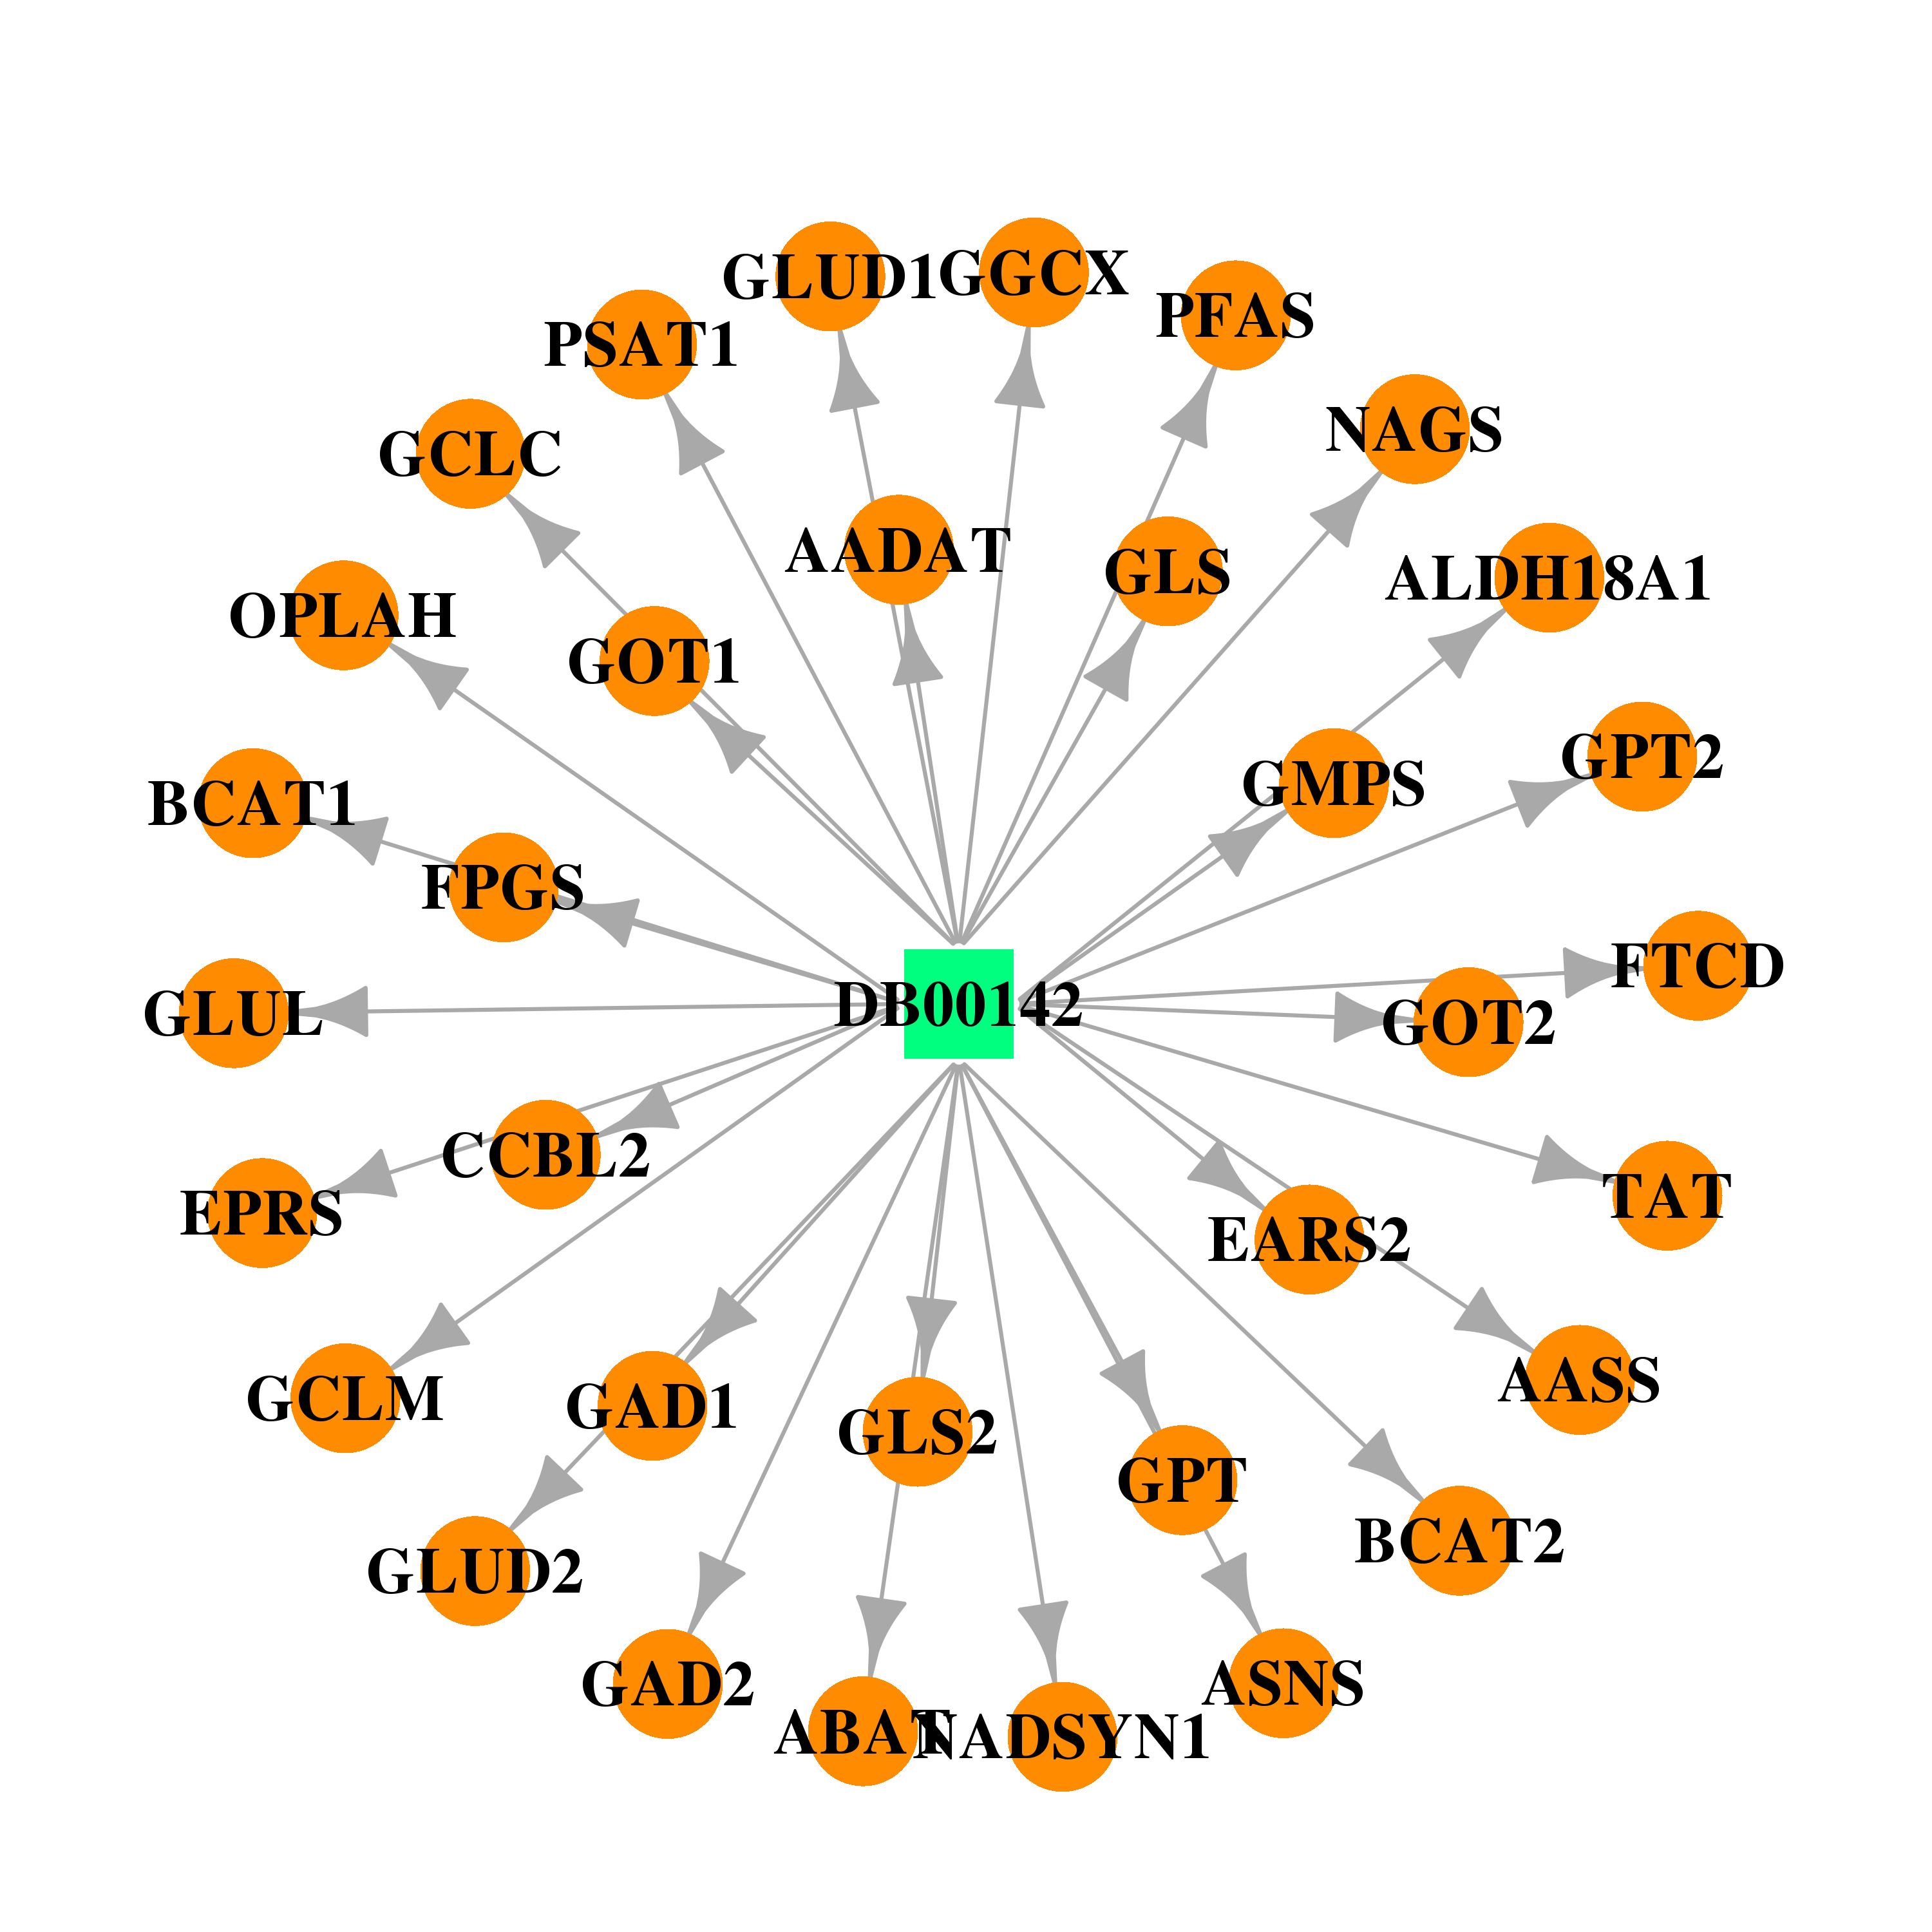 | 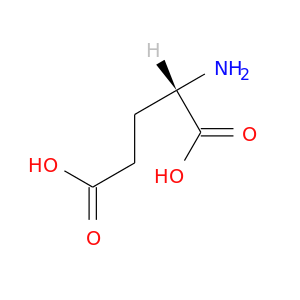 |
| Top |
| Cross referenced IDs for ALDH18A1 |
| * We obtained these cross-references from Uniprot database. It covers 150 different DBs, 18 categories. http://www.uniprot.org/help/cross_references_section |
: Open all cross reference information
|
Copyright © 2016-Present - The Univsersity of Texas Health Science Center at Houston @ |