|
||||||||||||||||||||
| |
| Phenotypic Information (metabolism pathway, cancer, disease, phenome) |
| |
| |
| Gene-Gene Network Information: Co-Expression Network, Interacting Genes & KEGG |
| |
|


| Gene Summary for PCYT2 |
| Top |
| Phenotypic Information for PCYT2(metabolism pathway, cancer, disease, phenome) |
| Cancer | CGAP: PCYT2 |
| Familial Cancer Database: PCYT2 | |
| * This gene is included in those cancer gene databases. |
|
|
|
|
|
| . | ||||||||||||||
Oncogene 1 | Significant driver gene in | |||||||||||||||||||
| cf) number; DB name 1 Oncogene; http://nar.oxfordjournals.org/content/35/suppl_1/D721.long, 2 Tumor Suppressor gene; https://bioinfo.uth.edu/TSGene/, 3 Cancer Gene Census; http://www.nature.com/nrc/journal/v4/n3/abs/nrc1299.html, 4 CancerGenes; http://nar.oxfordjournals.org/content/35/suppl_1/D721.long, 5 Network of Cancer Gene; http://ncg.kcl.ac.uk/index.php, 1Therapeutic Vulnerabilities in Cancer; http://cbio.mskcc.org/cancergenomics/statius/ |
| KEGG_GLYCEROPHOSPHOLIPID_METABOLISM REACTOME_PHOSPHOLIPID_METABOLISM REACTOME_METABOLISM_OF_LIPIDS_AND_LIPOPROTEINS | |
| OMIM | |
| Orphanet | |
| Disease | KEGG Disease: PCYT2 |
| MedGen: PCYT2 (Human Medical Genetics with Condition) | |
| ClinVar: PCYT2 | |
| Phenotype | MGI: PCYT2 (International Mouse Phenotyping Consortium) |
| PhenomicDB: PCYT2 | |
| Mutations for PCYT2 |
| * Under tables are showing count per each tissue to give us broad intuition about tissue specific mutation patterns.You can go to the detailed page for each mutation database's web site. |
| - Statistics for Tissue and Mutation type | Top |
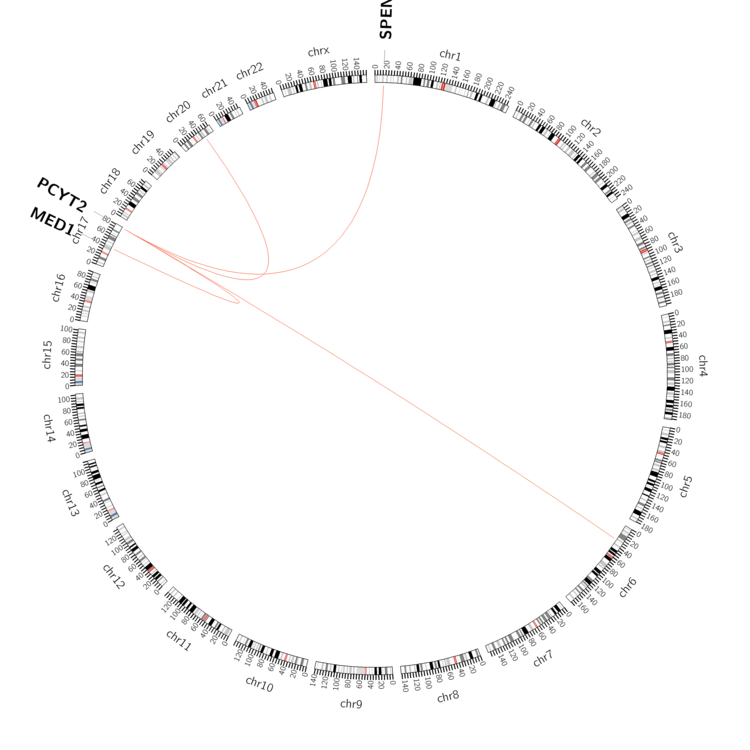 |
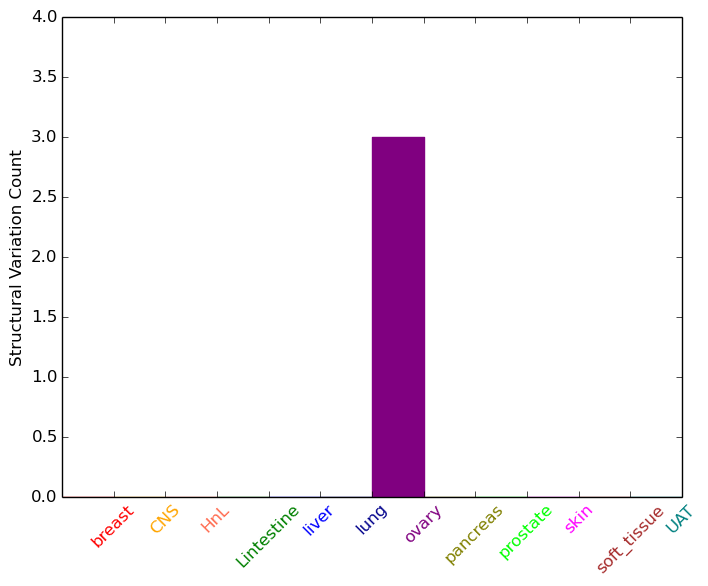
| - For Inter-chromosomal Variations |
| * Inter-chromosomal variantions includes 'interchromosomal amplicon to amplicon', 'interchromosomal amplicon to non-amplified dna', 'interchromosomal insertion', 'Interchromosomal unknown type'. |
 |
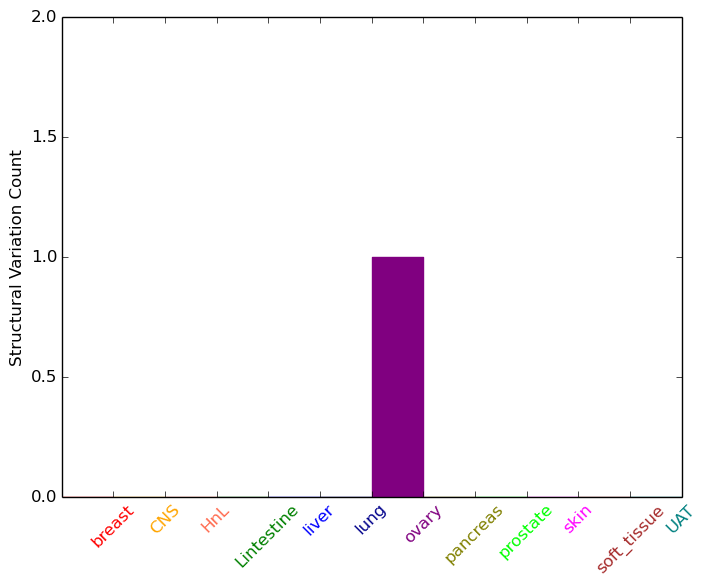
| - For Intra-chromosomal Variations |
| * Intra-chromosomal variantions includes 'intrachromosomal amplicon to amplicon', 'intrachromosomal amplicon to non-amplified dna', 'intrachromosomal deletion', 'intrachromosomal fold-back inversion', 'intrachromosomal inversion', 'intrachromosomal tandem duplication', 'Intrachromosomal unknown type', 'intrachromosomal with inverted orientation', 'intrachromosomal with non-inverted orientation'. |
 |
| Sample | Symbol_a | Chr_a | Start_a | End_a | Symbol_b | Chr_b | Start_b | End_b |
| ovary | PCYT2 | chr17 | 79862377 | 79862397 | chr20 | 44733434 | 44733454 | |
| ovary | PCYT2 | chr17 | 79863063 | 79863083 | MED1 | chr17 | 37586229 | 37586249 |
| cf) Tissue number; Tissue name (1;Breast, 2;Central_nervous_system, 3;Haematopoietic_and_lymphoid_tissue, 4;Large_intestine, 5;Liver, 6;Lung, 7;Ovary, 8;Pancreas, 9;Prostate, 10;Skin, 11;Soft_tissue, 12;Upper_aerodigestive_tract) |
| * From mRNA Sanger sequences, Chitars2.0 arranged chimeric transcripts. This table shows PCYT2 related fusion information. |
| ID | Head Gene | Tail Gene | Accession | Gene_a | qStart_a | qEnd_a | Chromosome_a | tStart_a | tEnd_a | Gene_a | qStart_a | qEnd_a | Chromosome_a | tStart_a | tEnd_a |
| Top |
| There's no copy number variation information in COSMIC data for this gene. |
| Top |
|
 |
| Top |
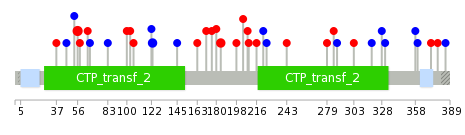
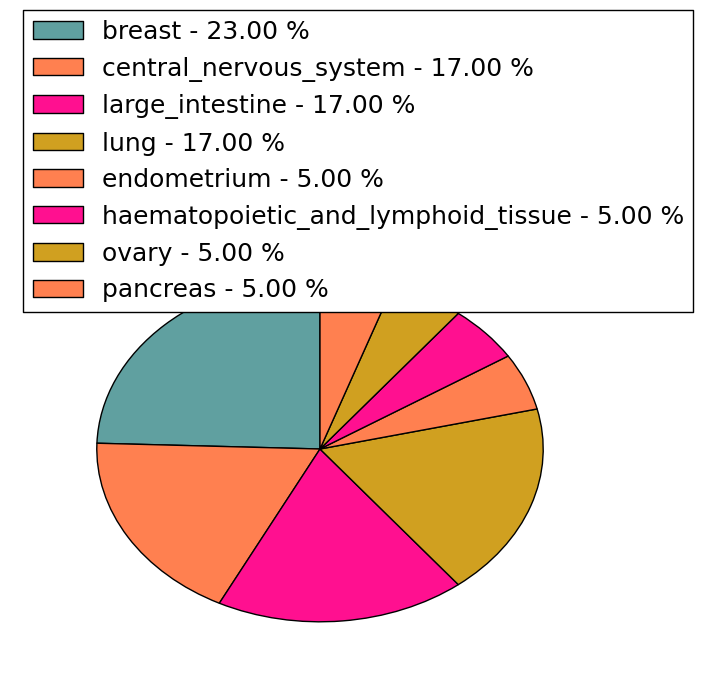
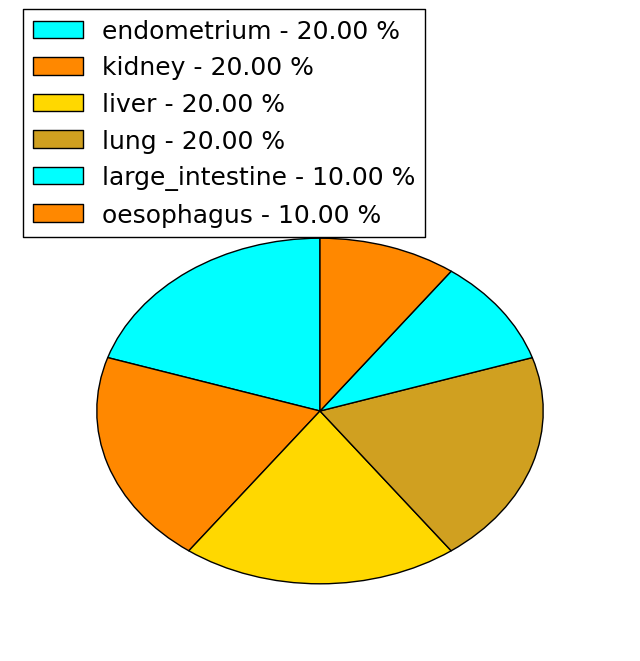
| Stat. for Non-Synonymous SNVs (# total SNVs=17) | (# total SNVs=10) |
 |  |
(# total SNVs=0) | (# total SNVs=0) |
| Top |
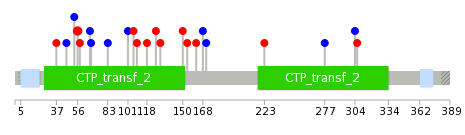
| * When you move the cursor on each content, you can see more deailed mutation information on the Tooltip. Those are primary_site,primary_histology,mutation(aa),pubmedID. |
| GRCh37 position | Mutation(aa) | Unique sampleID count |
| chr17:79867402-79867402 | p.V56M | 3 |
| chr17:79866482-79866482 | p.R123R | 2 |
| chr17:79864762-79864762 | p.R184W | 2 |
| chr17:79863007-79863007 | p.F331F | 1 |
| chr17:79867409-79867409 | p.I53I | 1 |
| chr17:79864664-79864664 | p.I216M | 1 |
| chr17:79863016-79863016 | p.R328R | 1 |
| chr17:79867430-79867430 | p.R46R | 1 |
| chr17:79864686-79864686 | p.P209L | 1 |
| chr17:79866485-79866485 | p.G122G | 1 |
| Top |
|
 |
| Point Mutation/ Tissue ID | 1 | 2 | 3 | 4 | 5 | 6 | 7 | 8 | 9 | 10 | 11 | 12 | 13 | 14 | 15 | 16 | 17 | 18 | 19 | 20 |
| # sample | 2 | 1 | 1 | 1 | 2 | 2 | 2 | 4 | 5 | 3 | ||||||||||
| # mutation | 2 | 1 | 1 | 1 | 2 | 2 | 2 | 4 | 6 | 3 | ||||||||||
| nonsynonymous SNV | 1 | 1 | 1 | 1 | 1 | 1 | 2 | 5 | 1 | |||||||||||
| synonymous SNV | 1 | 1 | 2 | 1 | 2 | 1 | 2 |
| cf) Tissue ID; Tissue type (1; BLCA[Bladder Urothelial Carcinoma], 2; BRCA[Breast invasive carcinoma], 3; CESC[Cervical squamous cell carcinoma and endocervical adenocarcinoma], 4; COAD[Colon adenocarcinoma], 5; GBM[Glioblastoma multiforme], 6; Glioma Low Grade, 7; HNSC[Head and Neck squamous cell carcinoma], 8; KICH[Kidney Chromophobe], 9; KIRC[Kidney renal clear cell carcinoma], 10; KIRP[Kidney renal papillary cell carcinoma], 11; LAML[Acute Myeloid Leukemia], 12; LUAD[Lung adenocarcinoma], 13; LUSC[Lung squamous cell carcinoma], 14; OV[Ovarian serous cystadenocarcinoma ], 15; PAAD[Pancreatic adenocarcinoma], 16; PRAD[Prostate adenocarcinoma], 17; SKCM[Skin Cutaneous Melanoma], 18:STAD[Stomach adenocarcinoma], 19:THCA[Thyroid carcinoma], 20:UCEC[Uterine Corpus Endometrial Carcinoma]) |
| Top |
| * We represented just top 10 SNVs. When you move the cursor on each content, you can see more deailed mutation information on the Tooltip. Those are primary_site, primary_histology, mutation(aa), pubmedID. |
| Genomic Position | Mutation(aa) | Unique sampleID count |
| chr17:79867402 | p.V56M,PCYT2 | 2 |
| chr17:79864664 | p.A150V,PCYT2 | 1 |
| chr17:79866891 | p.R130W,PCYT2 | 1 |
| chr17:79864690 | p.C126Y,PCYT2 | 1 |
| chr17:79867395 | p.E118G,PCYT2 | 1 |
| chr17:79864701 | p.S109T,PCYT2 | 1 |
| chr17:79864762 | p.G68G,PCYT2 | 1 |
| chr17:79867409 | p.N106H,PCYT2 | 1 |
| chr17:79864773 | p.T101T,PCYT2 | 1 |
| chr17:79867430 | p.N306K,PCYT2 | 1 |
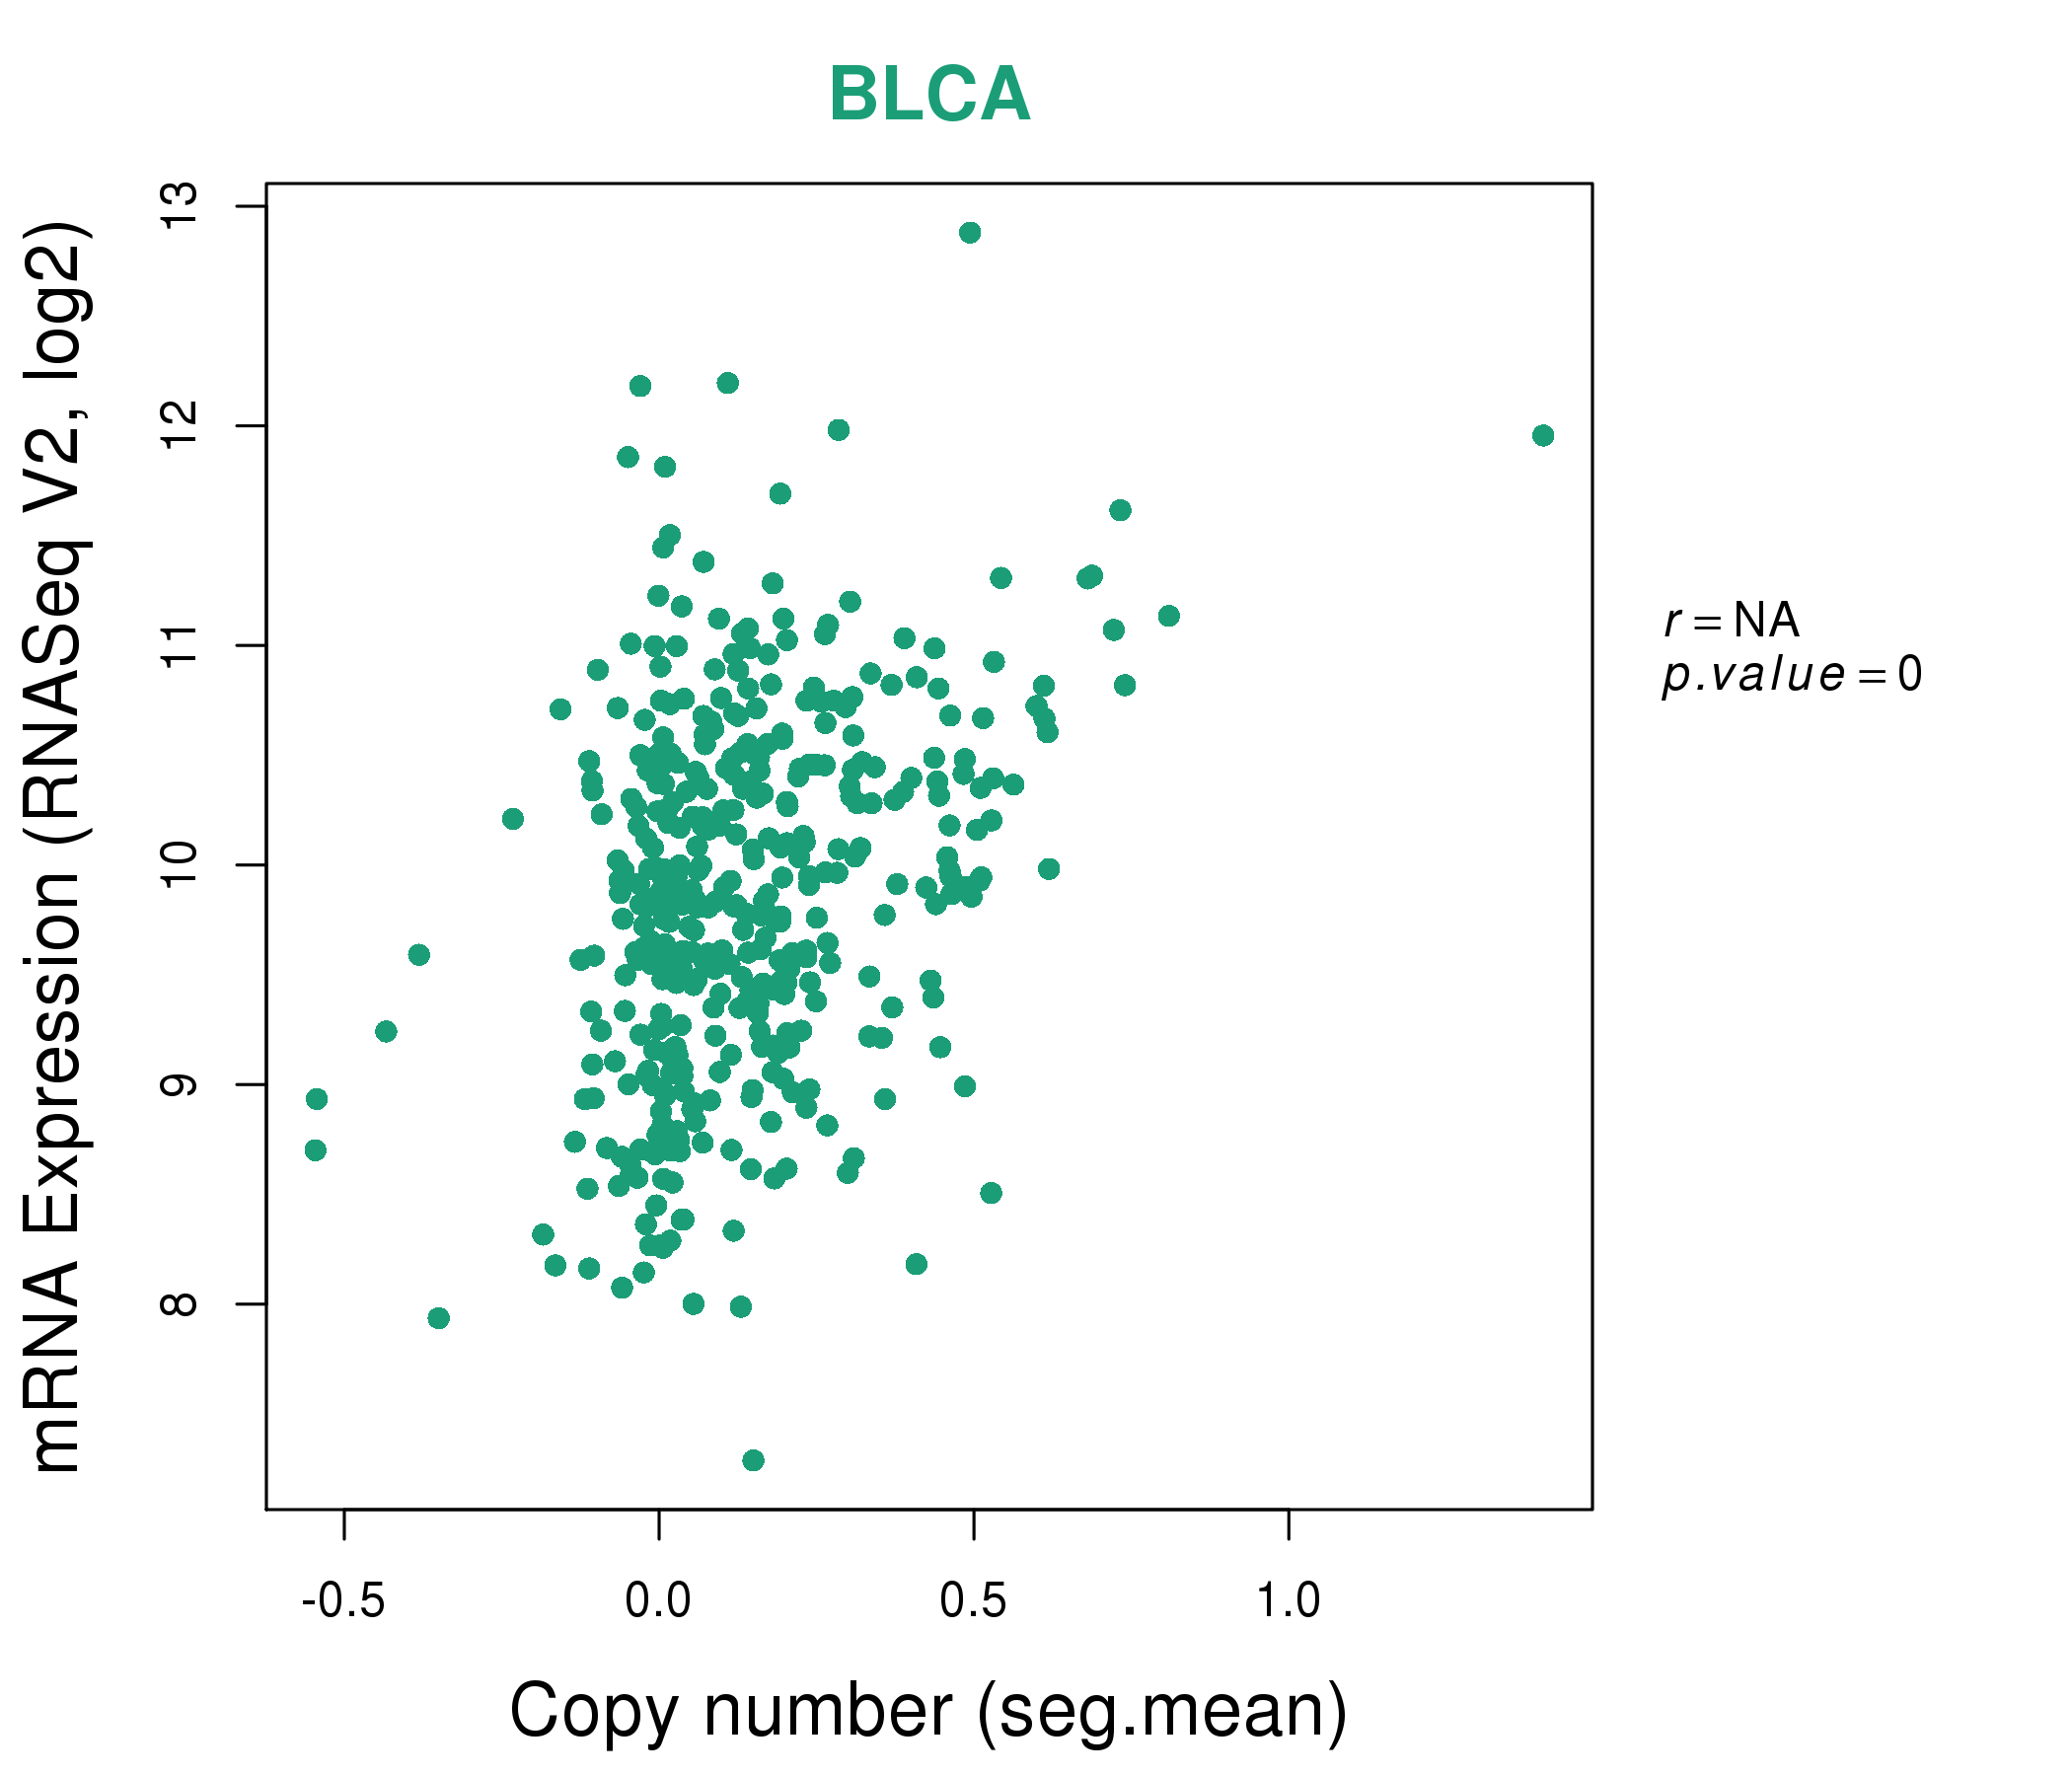
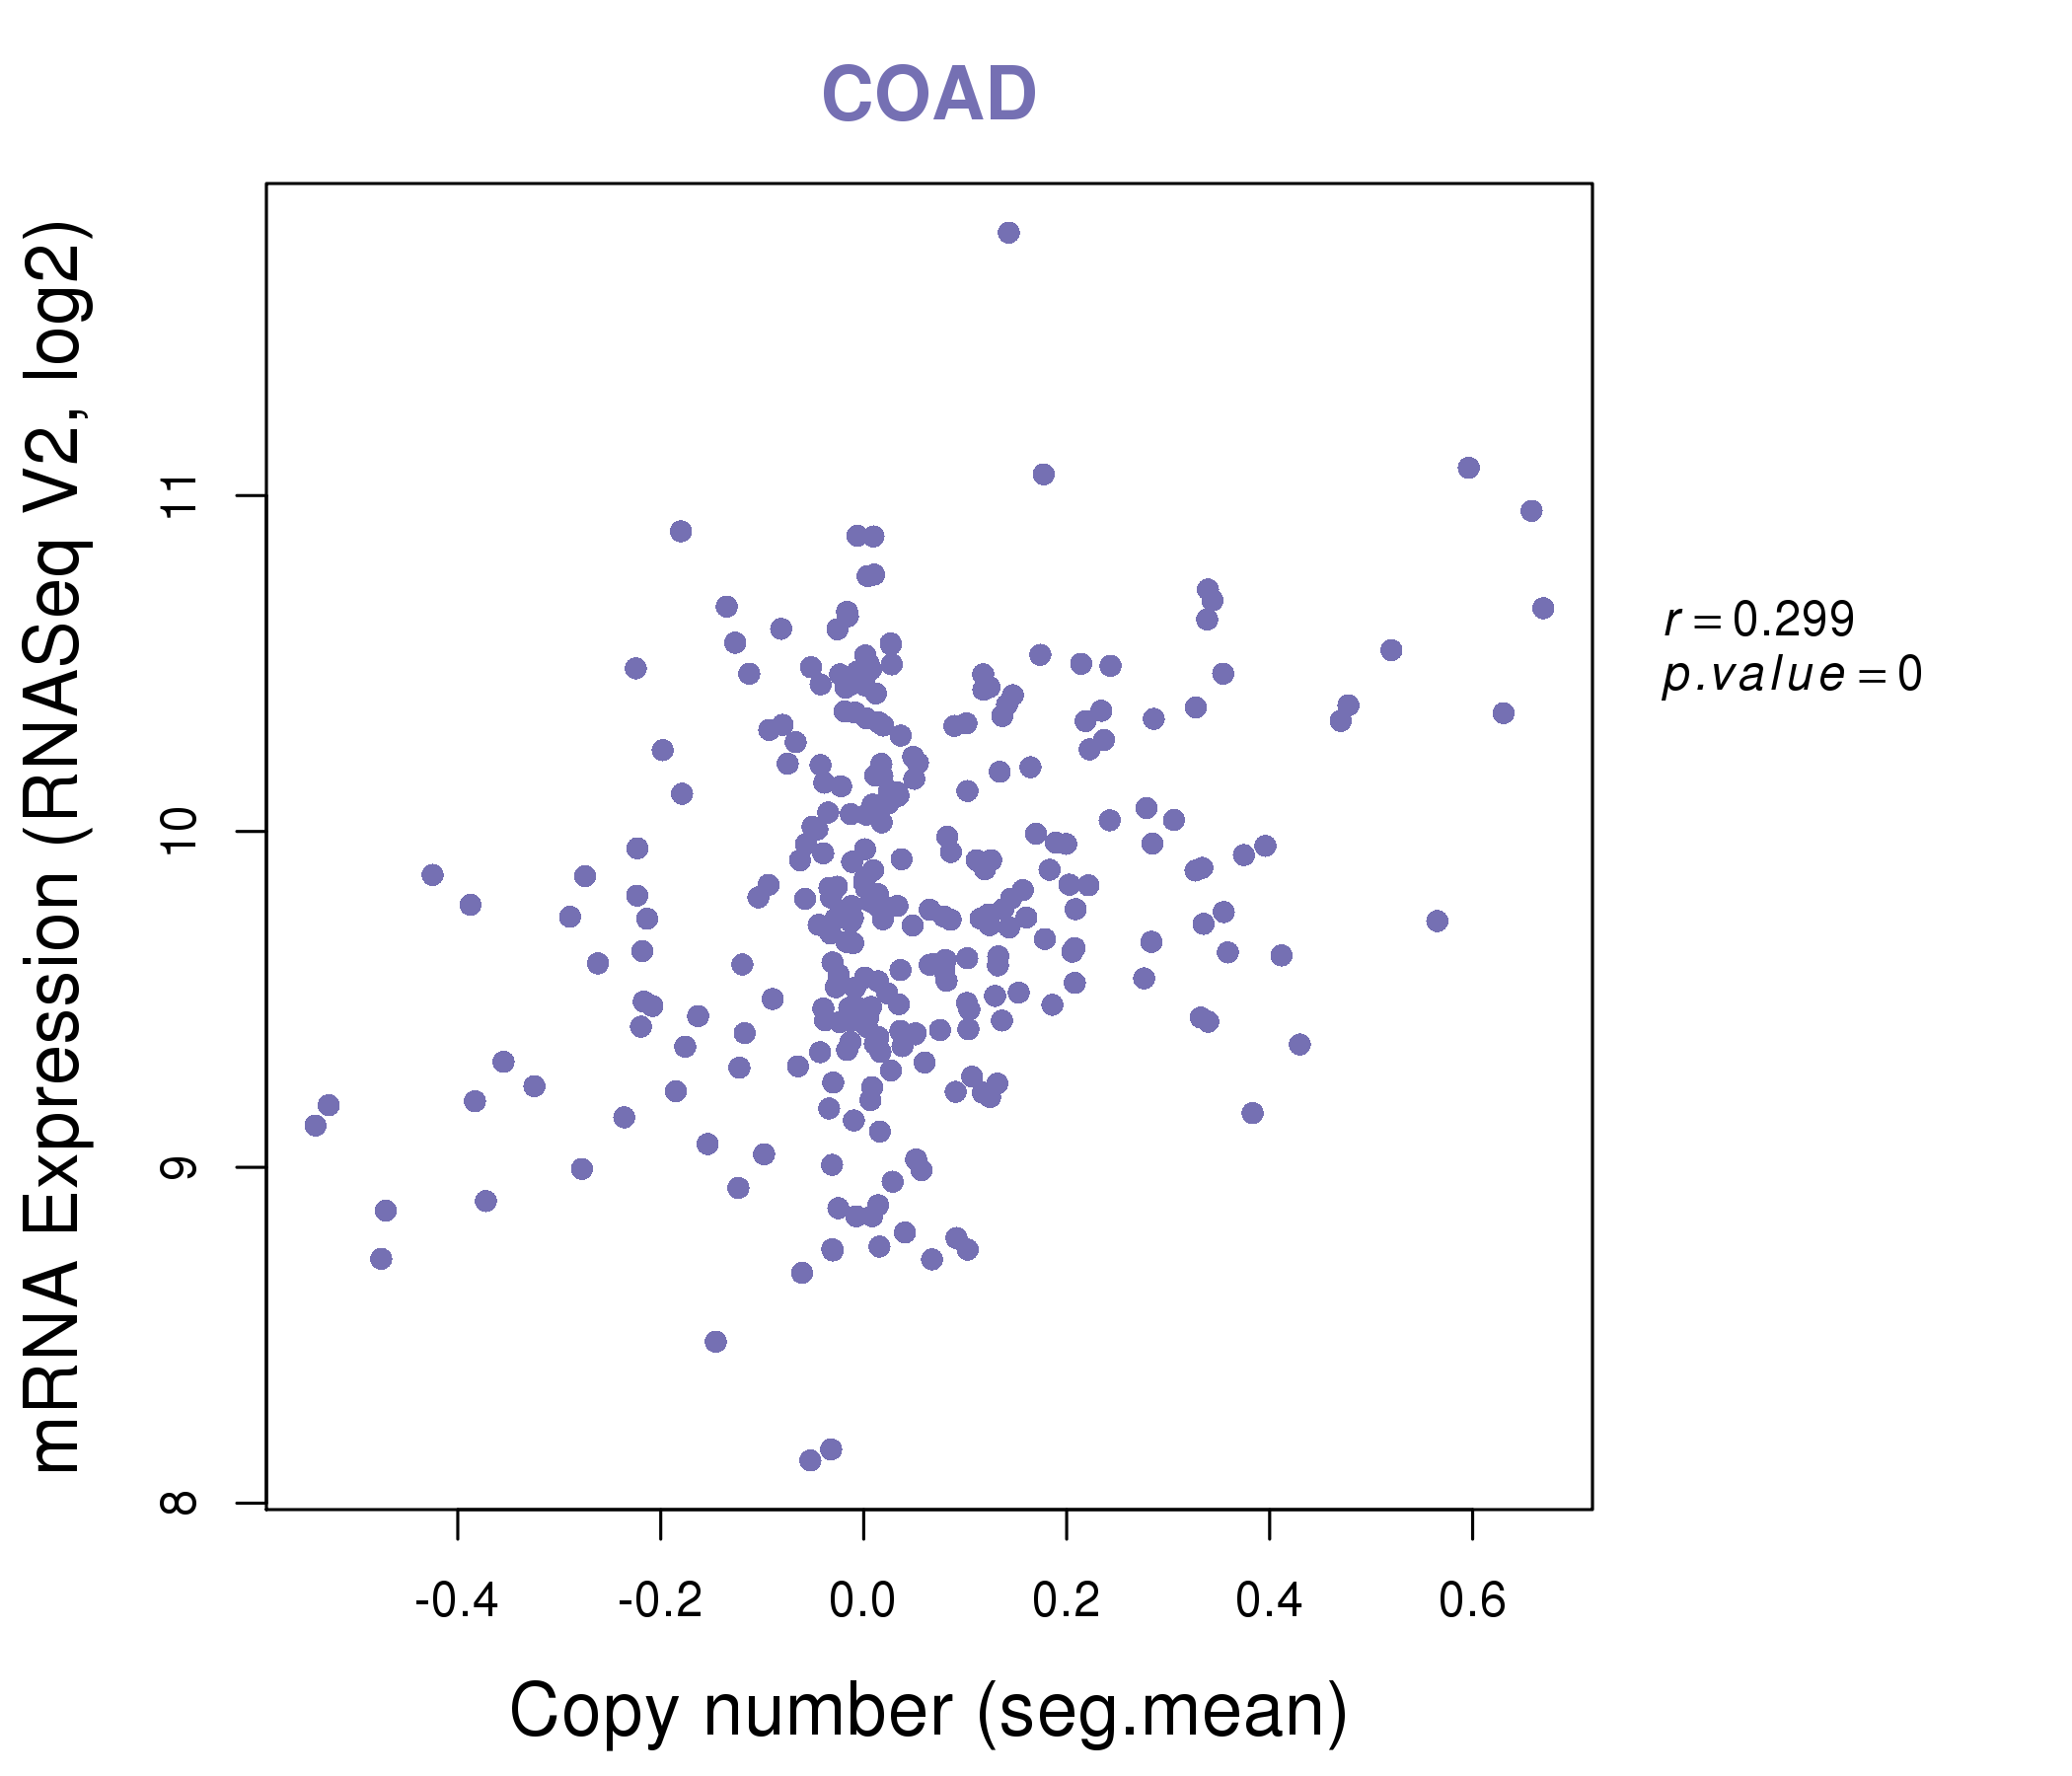
| * Copy number data were extracted from TCGA using R package TCGA-Assembler. The URLs of all public data files on TCGA DCC data server were gathered on Jan-05-2015. Function ProcessCNAData in TCGA-Assembler package was used to obtain gene-level copy number value which is calculated as the average copy number of the genomic region of a gene. |
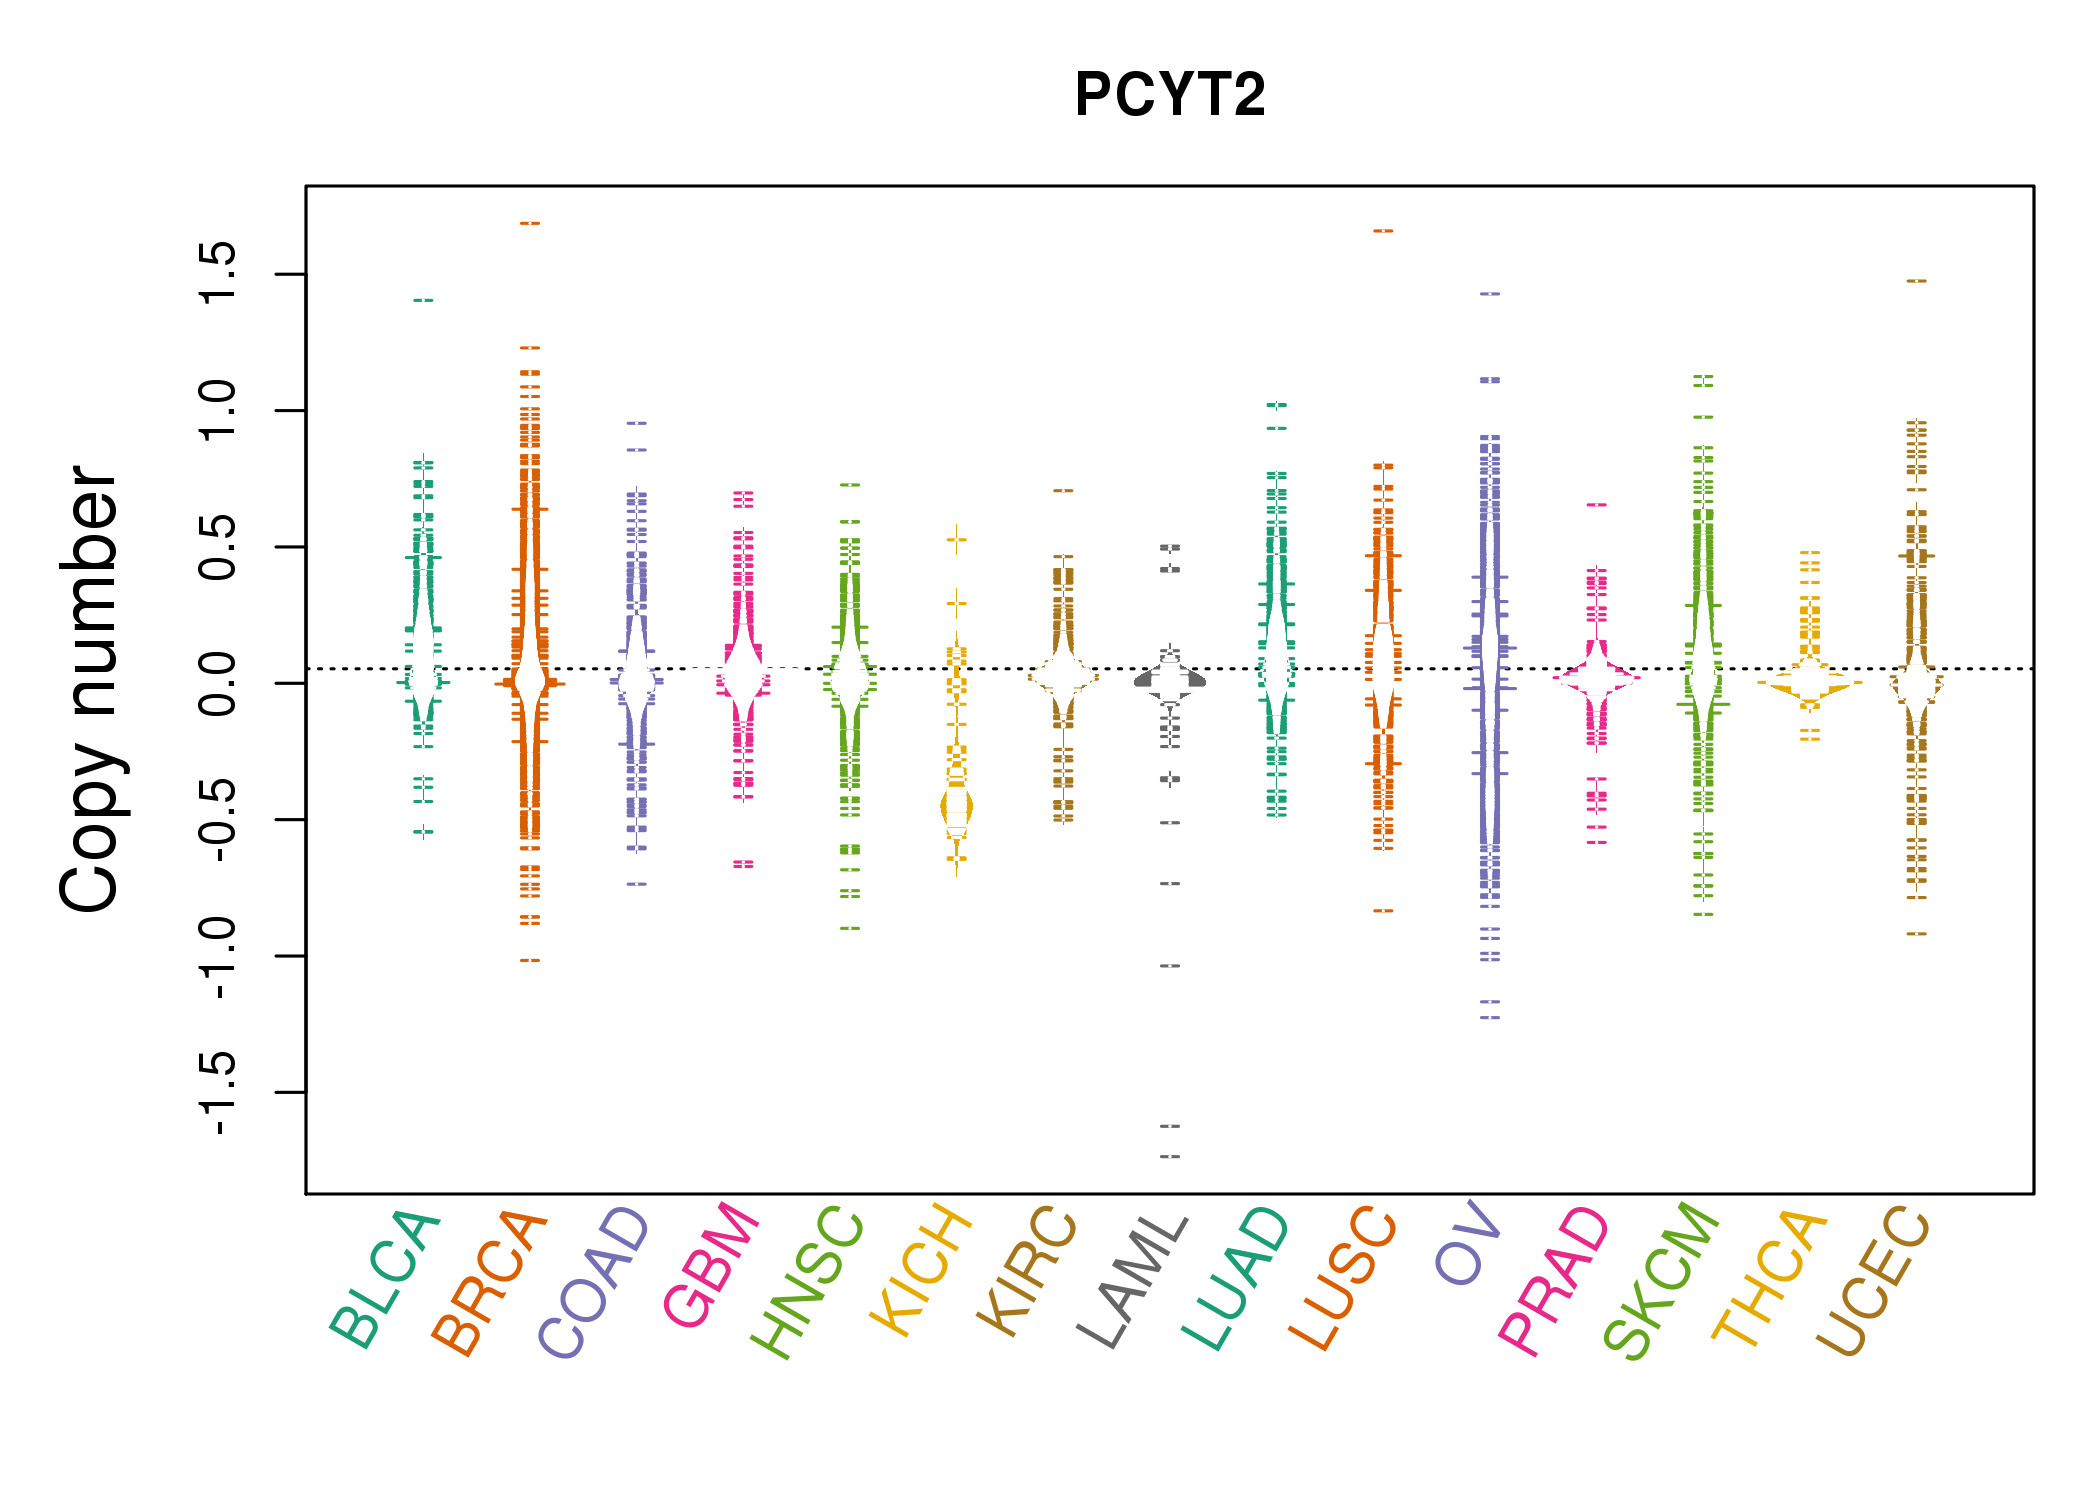 |
| cf) Tissue ID[Tissue type]: BLCA[Bladder Urothelial Carcinoma], BRCA[Breast invasive carcinoma], CESC[Cervical squamous cell carcinoma and endocervical adenocarcinoma], COAD[Colon adenocarcinoma], GBM[Glioblastoma multiforme], Glioma Low Grade, HNSC[Head and Neck squamous cell carcinoma], KICH[Kidney Chromophobe], KIRC[Kidney renal clear cell carcinoma], KIRP[Kidney renal papillary cell carcinoma], LAML[Acute Myeloid Leukemia], LUAD[Lung adenocarcinoma], LUSC[Lung squamous cell carcinoma], OV[Ovarian serous cystadenocarcinoma ], PAAD[Pancreatic adenocarcinoma], PRAD[Prostate adenocarcinoma], SKCM[Skin Cutaneous Melanoma], STAD[Stomach adenocarcinoma], THCA[Thyroid carcinoma], UCEC[Uterine Corpus Endometrial Carcinoma] |
| Top |
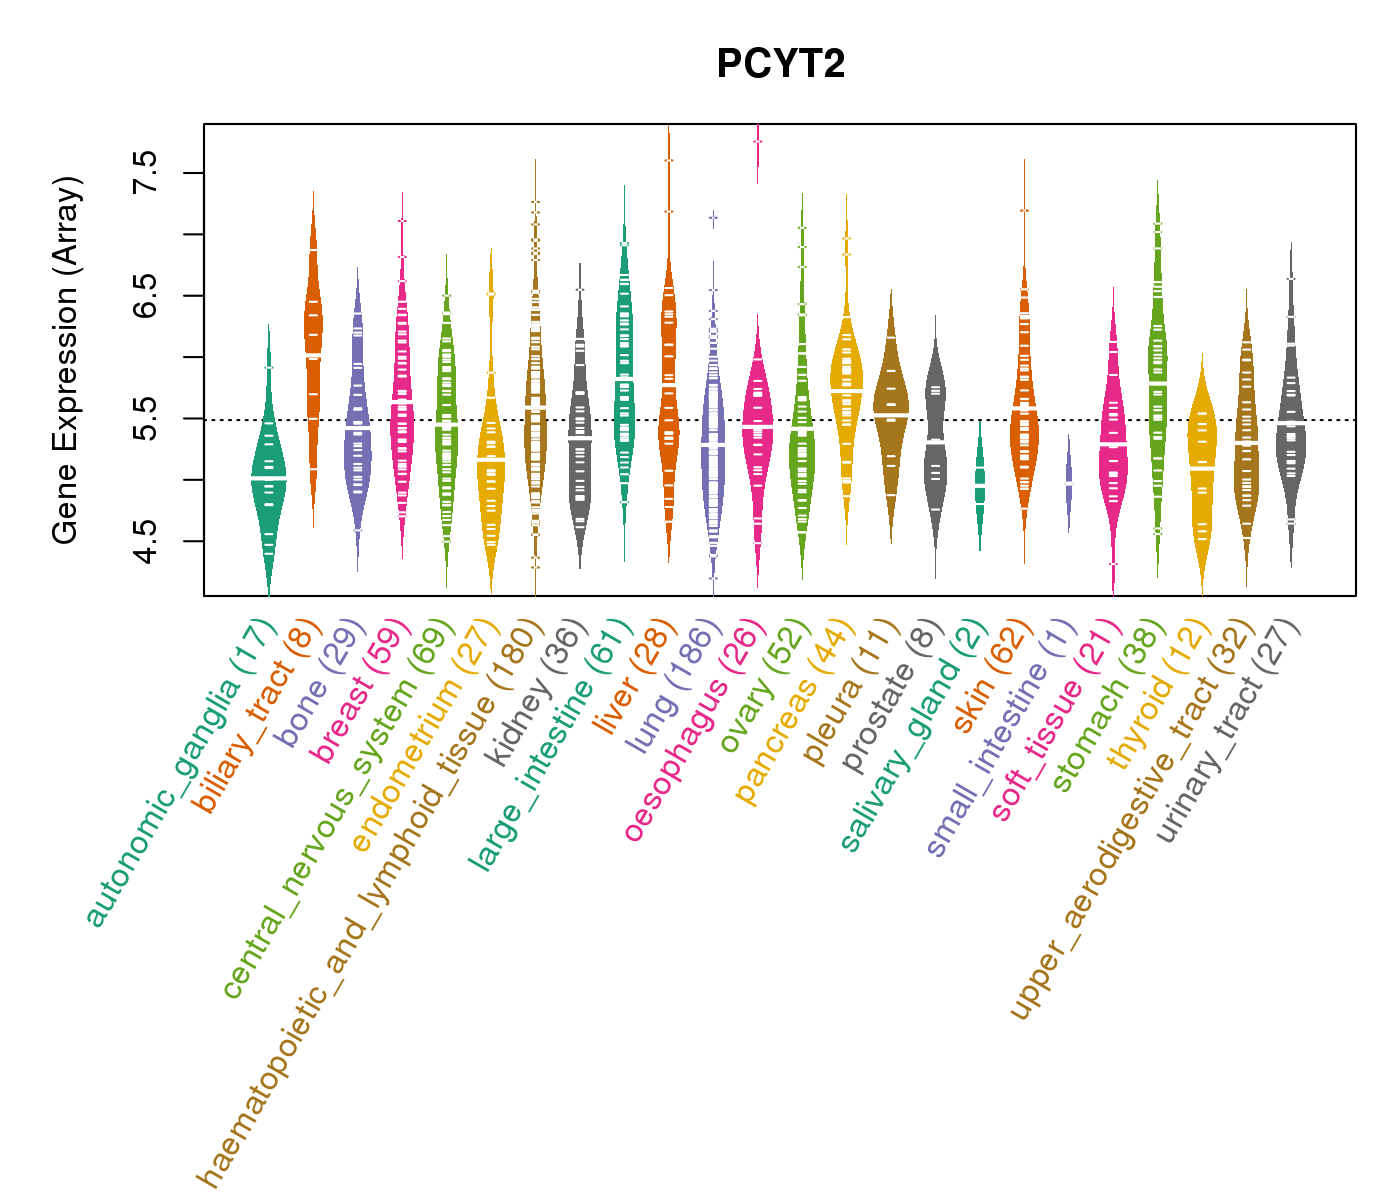
| Gene Expression for PCYT2 |
| * CCLE gene expression data were extracted from CCLE_Expression_Entrez_2012-10-18.res: Gene-centric RMA-normalized mRNA expression data. |
 |
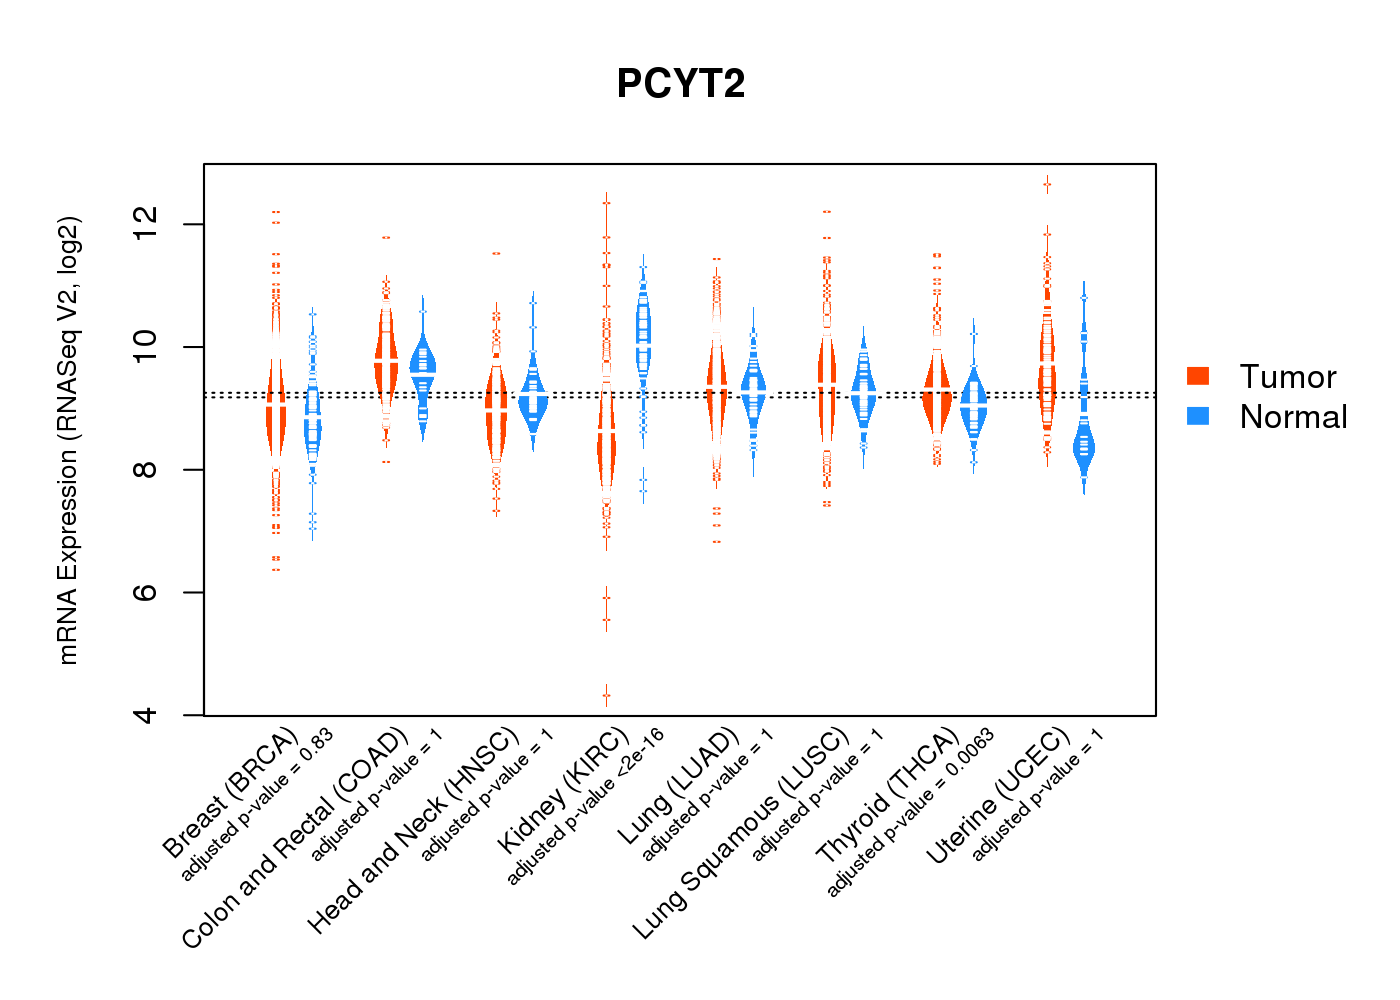
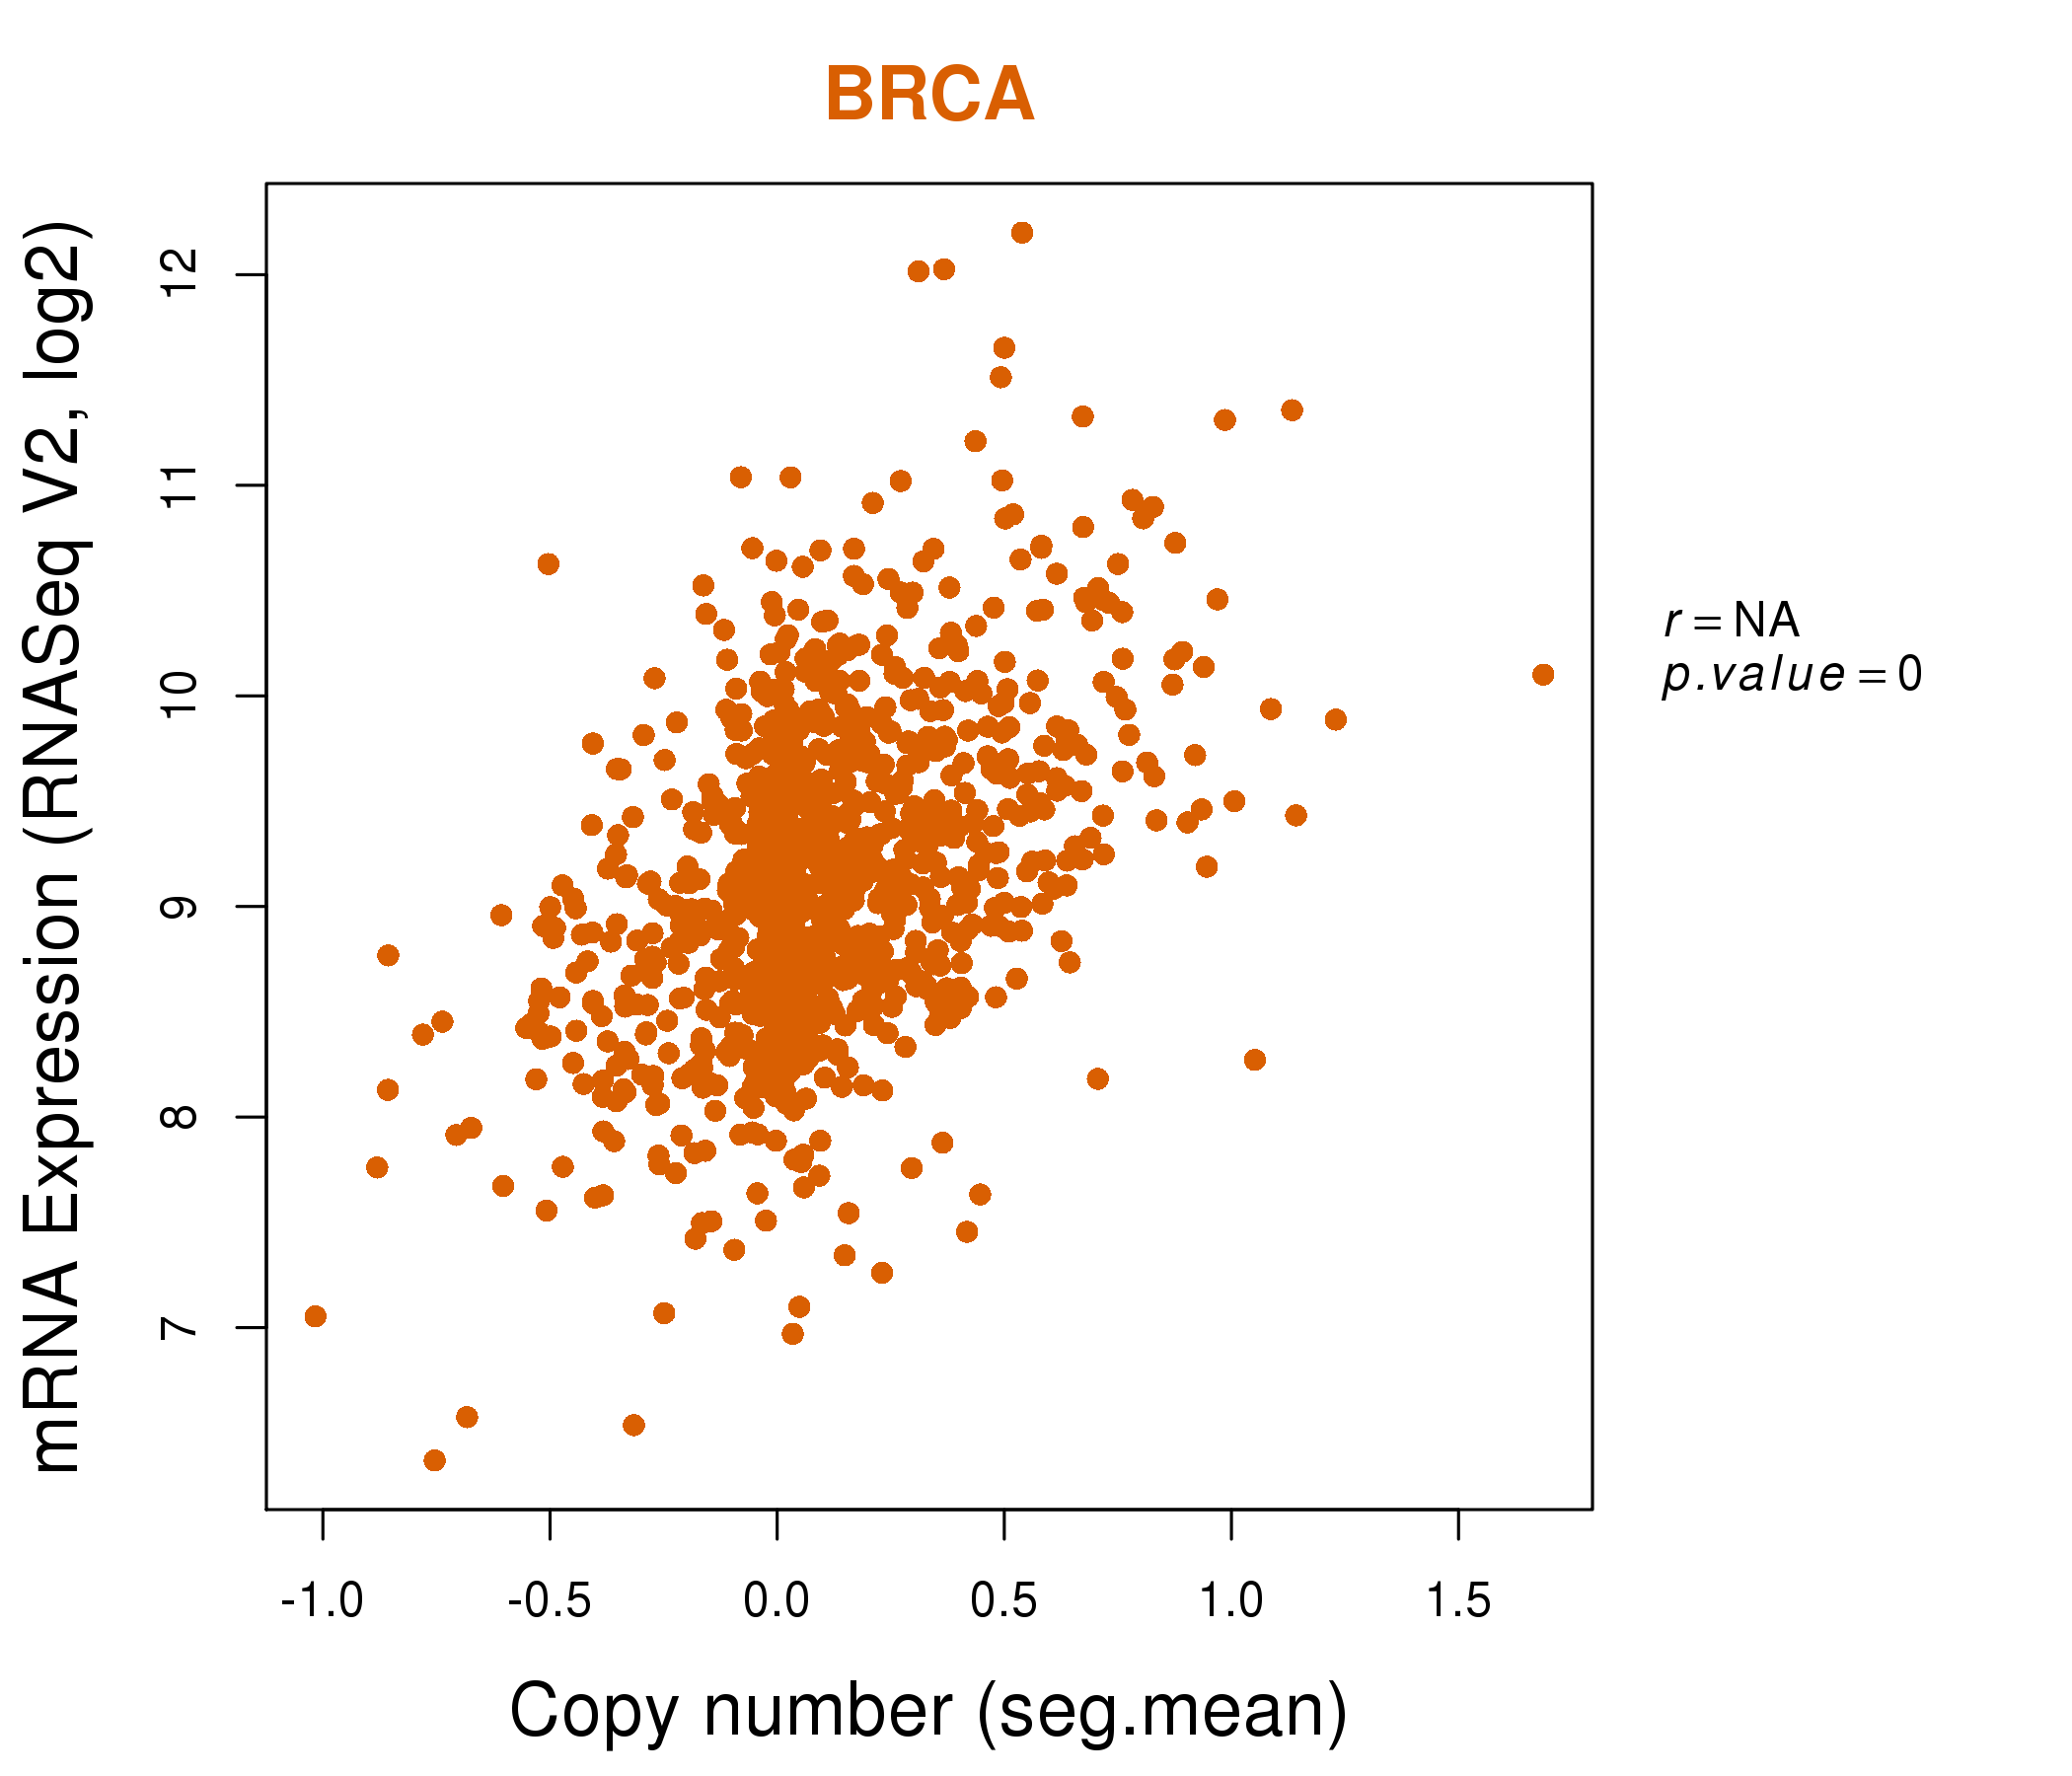
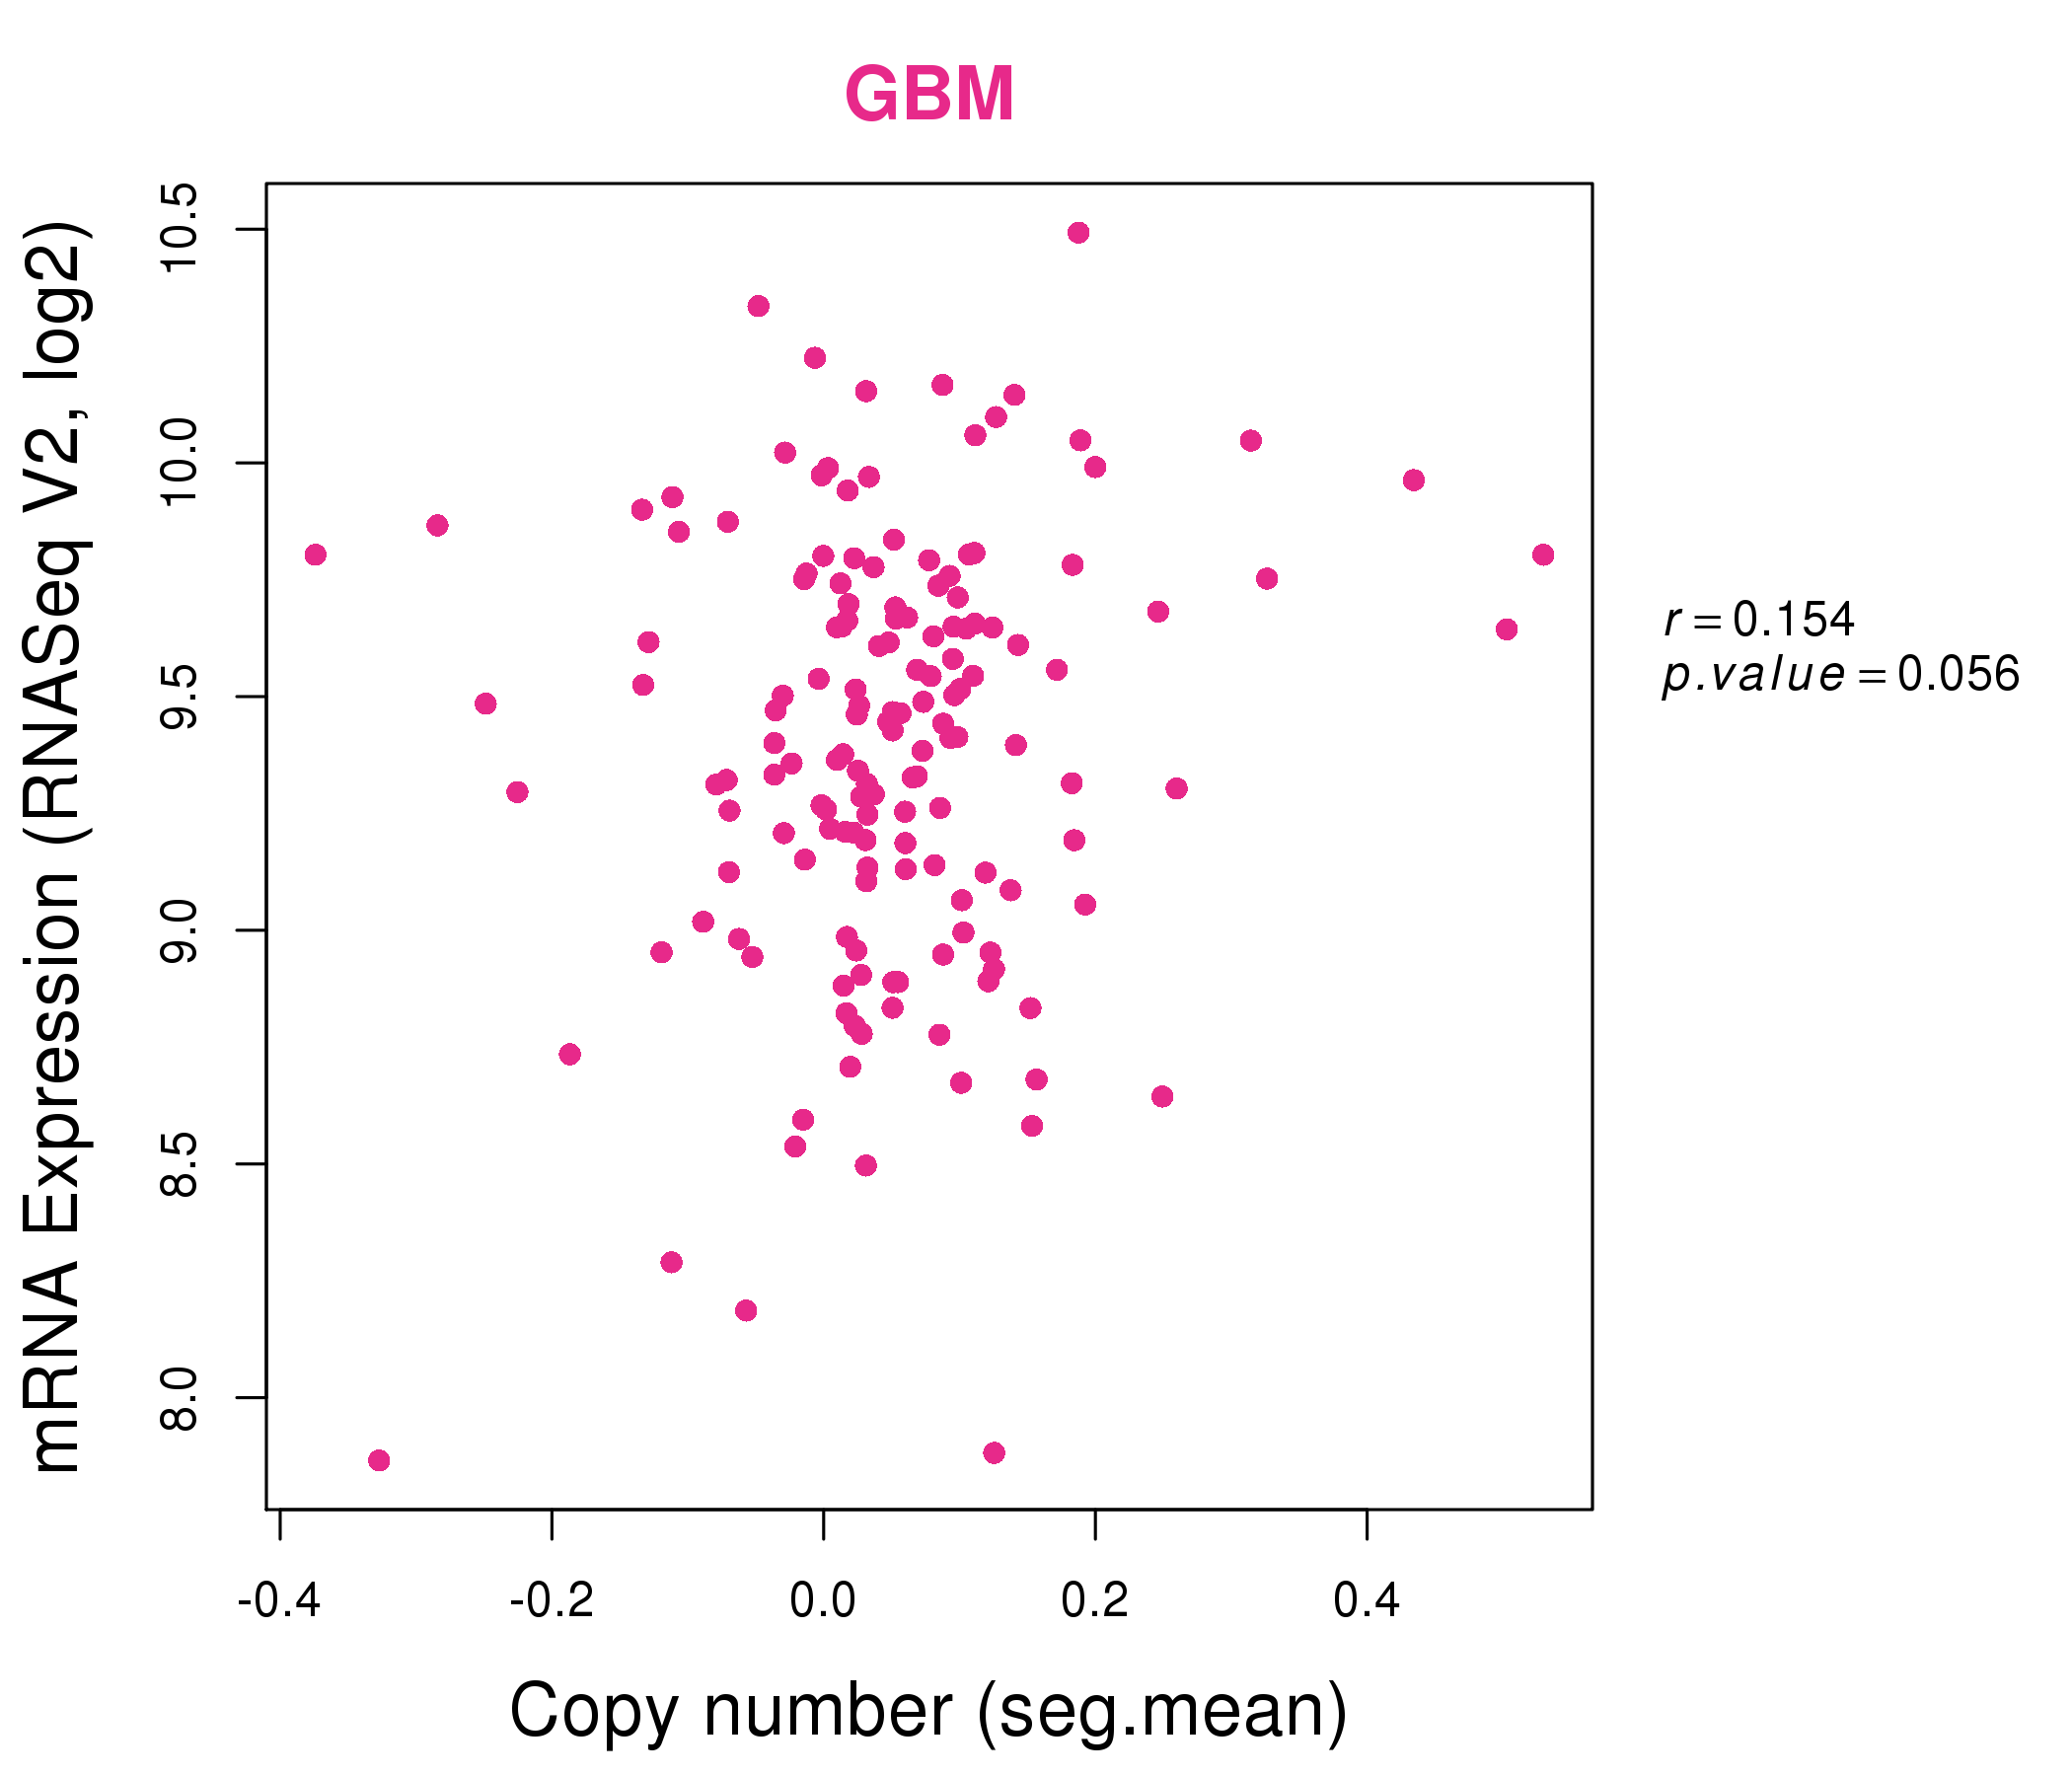
| * Normalized gene expression data of RNASeqV2 was extracted from TCGA using R package TCGA-Assembler. The URLs of all public data files on TCGA DCC data server were gathered at Jan-05-2015. Only eight cancer types have enough normal control samples for differential expression analysis. (t test, adjusted p<0.05 (using Benjamini-Hochberg FDR)) |
 |
| Top |
| * This plots show the correlation between CNV and gene expression. |
: Open all plots for all cancer types
 |
|
 |
|
| Top |
| Gene-Gene Network Information |
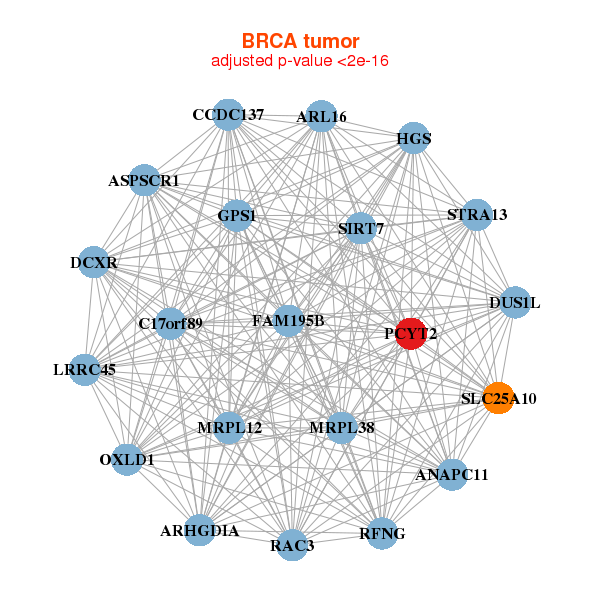
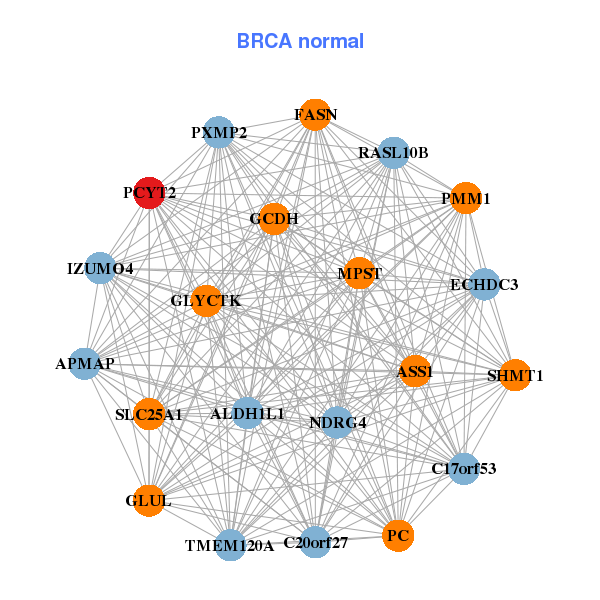
| * Co-Expression network figures were drawn using R package igraph. Only the top 20 genes with the highest correlations were shown. Red circle: input gene, orange circle: cell metabolism gene, sky circle: other gene |
: Open all plots for all cancer types
 |
| ||||
| ANAPC11,ARHGDIA,ARL16,ASPSCR1,C17orf89,OXLD1,CCDC137, DCXR,DUS1L,FAM195B,GPS1,HGS,LRRC45,MRPL12, MRPL38,PCYT2,RAC3,RFNG,SIRT7,SLC25A10,STRA13 | ALDH1L1,ASS1,C17orf53,IZUMO4,C20orf27,APMAP,ECHDC3, FASN,GCDH,GLUL,GLYCTK,MPST,NDRG4,PC, PCYT2,PMM1,PXMP2,RASL10B,SHMT1,SLC25A1,TMEM120A | ||||
 |
| ||||
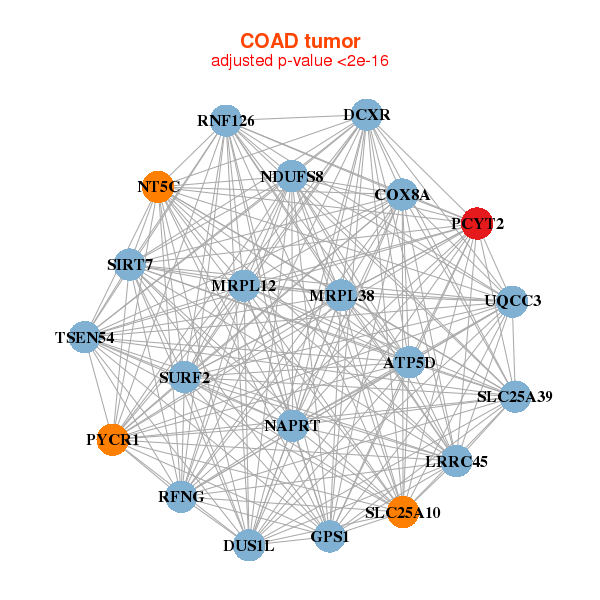
| ATP5D,UQCC3,COX8A,DCXR,DUS1L,GPS1,LRRC45, MRPL12,MRPL38,NAPRT,NDUFS8,NT5C,PCYT2,PYCR1, RFNG,RNF126,SIRT7,SLC25A10,SLC25A39,SURF2,TSEN54 | AGMAT,AIMP2,AKR7A3,DNPH1,CENPV,CISD3,COQ4, FAM195A,FAM35A,FAM35BP,HADH,IMP3,MTCH2,NDUFC2, OXNAD1,PCYT2,PRR5,SHMT1,SLC25A10,SUCLG1,TRAF4 |
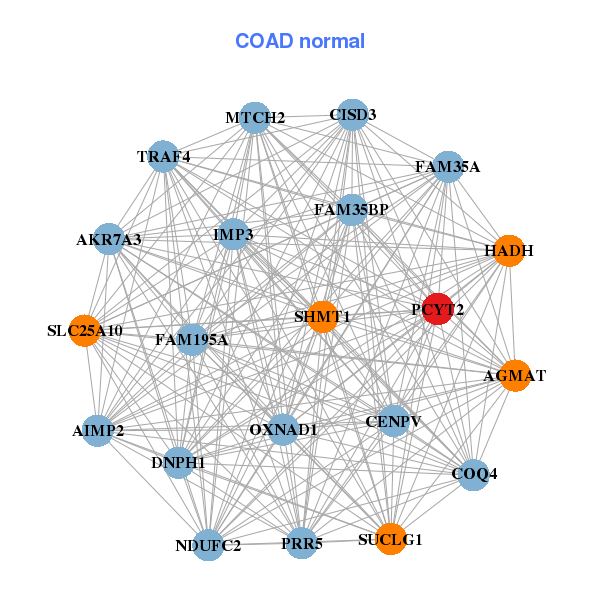
| * Co-Expression network figures were drawn using R package igraph. Only the top 20 genes with the highest correlations were shown. Red circle: input gene, orange circle: cell metabolism gene, sky circle: other gene |
: Open all plots for all cancer types
| Top |
: Open all interacting genes' information including KEGG pathway for all interacting genes from DAVID
| Top |
| Pharmacological Information for PCYT2 |
| DB Category | DB Name | DB's ID and Url link |
| * Gene Centered Interaction Network. |
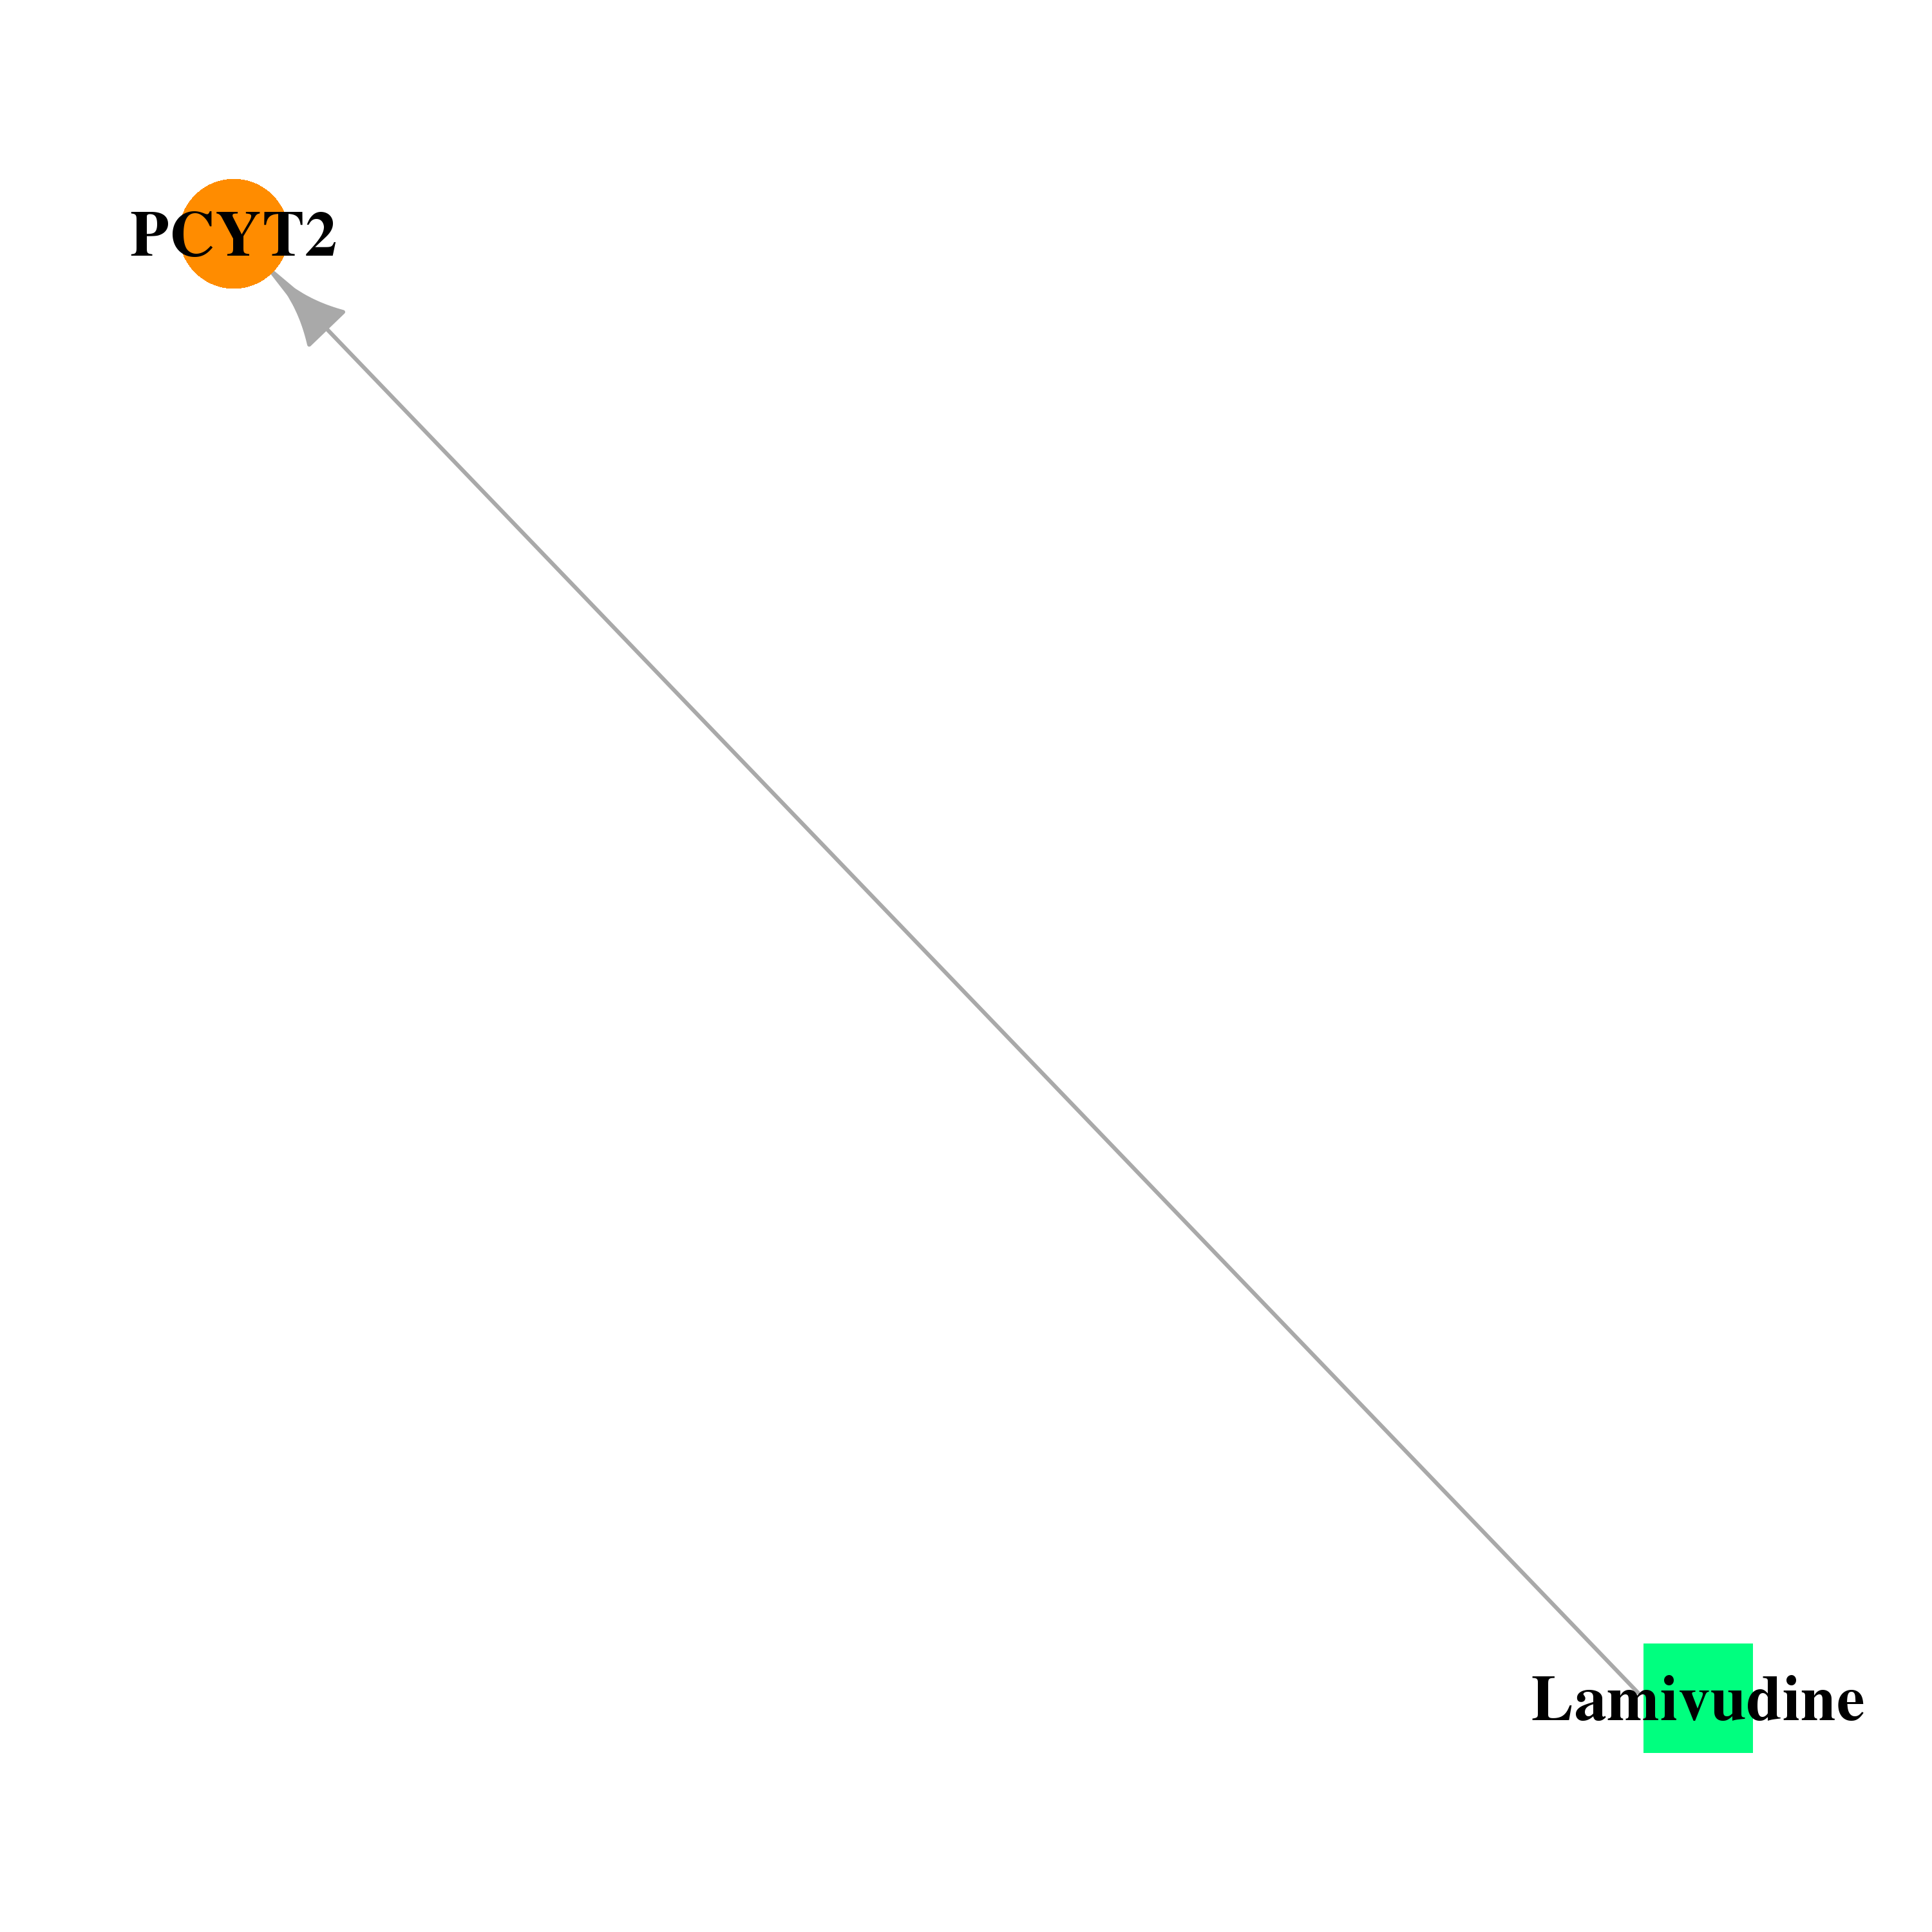 |
| * Drug Centered Interaction Network. |
| DrugBank ID | Target Name | Drug Groups | Generic Name | Drug Centered Network | Drug Structure |
| DB00709 | phosphate cytidylyltransferase 2, ethanolamine | approved; investigational | Lamivudine |  | 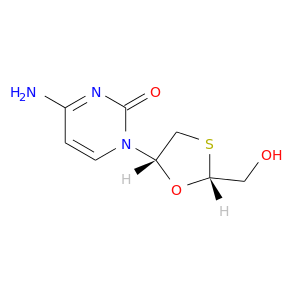 |
| Top |
| Cross referenced IDs for PCYT2 |
| * We obtained these cross-references from Uniprot database. It covers 150 different DBs, 18 categories. http://www.uniprot.org/help/cross_references_section |
: Open all cross reference information
|
Copyright © 2016-Present - The Univsersity of Texas Health Science Center at Houston @ |