|
|||||||||||||||||||||||||||||||||||||||||||||||||||||||||||||||||||||||||||||||||||||||||||||||||||||||||||||||||||||||||||||||||||||||||||||||||||||||||||||||||||||||||||||||||||||||||||||||||||||||||||||||||||||||||||||||||||||||||||||||||||||||||||||||||||||||||||||||||||||||||||||||||||||||||||||||||||||||||||||||||||||||||||||
| |
| Phenotypic Information (metabolism pathway, cancer, disease, phenome) |
| |
| |
| Gene-Gene Network Information: Co-Expression Network, Interacting Genes & KEGG |
| |
|


| Gene Summary for PYGB |
| Basic gene info. | Gene symbol | PYGB |
| Gene name | phosphorylase, glycogen; brain | |
| Synonyms | GPBB | |
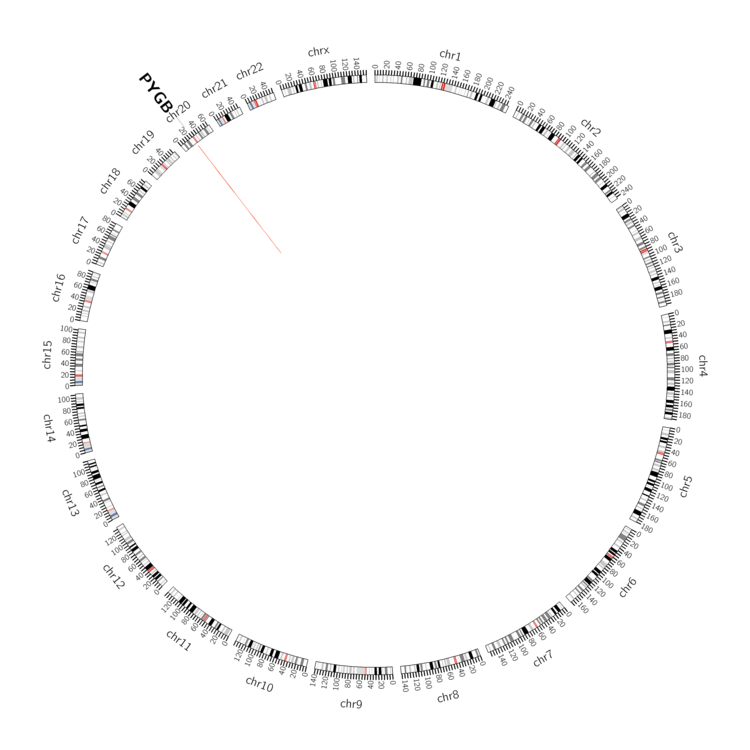
| Cytomap | UCSC genome browser: 20p11.21 | |
| Genomic location | chr20 :25228705-25278648 | |
| Type of gene | protein-coding | |
| RefGenes | NM_002862.3, | |
| Ensembl id | ENSG00000100994 | |
| Description | glycogen phosphorylase Bglycogen phosphorylase, brain form | |
| Modification date | 20141207 | |
| dbXrefs | MIM : 138550 | |
| HGNC : HGNC | ||
| Ensembl : ENSG00000100994 | ||
| HPRD : 00720 | ||
| Vega : OTTHUMG00000032117 | ||
| Protein | UniProt: go to UniProt's Cross Reference DB Table | |
| Expression | CleanEX: HS_PYGB | |
| BioGPS: 5834 | ||
| Gene Expression Atlas: ENSG00000100994 | ||
| The Human Protein Atlas: ENSG00000100994 | ||
| Pathway | NCI Pathway Interaction Database: PYGB | |
| KEGG: PYGB | ||
| REACTOME: PYGB | ||
| ConsensusPathDB | ||
| Pathway Commons: PYGB | ||
| Metabolism | MetaCyc: PYGB | |
| HUMANCyc: PYGB | ||
| Regulation | Ensembl's Regulation: ENSG00000100994 | |
| miRBase: chr20 :25,228,705-25,278,648 | ||
| TargetScan: NM_002862 | ||
| cisRED: ENSG00000100994 | ||
| Context | iHOP: PYGB | |
| cancer metabolism search in PubMed: PYGB | ||
| UCL Cancer Institute: PYGB | ||
| Assigned class in ccmGDB | C | |
| Top |
| Phenotypic Information for PYGB(metabolism pathway, cancer, disease, phenome) |
| Cancer | CGAP: PYGB |
| Familial Cancer Database: PYGB | |
| * This gene is included in those cancer gene databases. |
|
|
|
|
|
|
| |||||||||||||||||||||||||||||||||||||||||||||||||||||||||||||||||||||||||||||||||||||||||||||||||||||||||||||||||||||||||||||||||||||||||||||||||||||||||||||||||||||||||||||||||||||||||||||||||||||||||||||||||||||||||||||||||||||||||||||||||||||||||||||||||||||||||||||||||||||||||||||||||||||||||||||||||||||||||||||||||||||||
Oncogene 1 | Significant driver gene in | ||||||||||||||||||||||||||||||||||||||||||||||||||||||||||||||||||||||||||||||||||||||||||||||||||||||||||||||||||||||||||||||||||||||||||||||||||||||||||||||||||||||||||||||||||||||||||||||||||||||||||||||||||||||||||||||||||||||||||||||||||||||||||||||||||||||||||||||||||||||||||||||||||||||||||||||||||||||||||||||||||||||||||||
| cf) number; DB name 1 Oncogene; http://nar.oxfordjournals.org/content/35/suppl_1/D721.long, 2 Tumor Suppressor gene; https://bioinfo.uth.edu/TSGene/, 3 Cancer Gene Census; http://www.nature.com/nrc/journal/v4/n3/abs/nrc1299.html, 4 CancerGenes; http://nar.oxfordjournals.org/content/35/suppl_1/D721.long, 5 Network of Cancer Gene; http://ncg.kcl.ac.uk/index.php, 1Therapeutic Vulnerabilities in Cancer; http://cbio.mskcc.org/cancergenomics/statius/ |
| KEGG_STARCH_AND_SUCROSE_METABOLISM REACTOME_METABOLISM_OF_CARBOHYDRATES REACTOME_GLUCOSE_METABOLISM | |
| OMIM | |
| Orphanet | |
| Disease | KEGG Disease: PYGB |
| MedGen: PYGB (Human Medical Genetics with Condition) | |
| ClinVar: PYGB | |
| Phenotype | MGI: PYGB (International Mouse Phenotyping Consortium) |
| PhenomicDB: PYGB | |
| Mutations for PYGB |
| * Under tables are showing count per each tissue to give us broad intuition about tissue specific mutation patterns.You can go to the detailed page for each mutation database's web site. |
| - Statistics for Tissue and Mutation type | Top |
 |
| - For Inter-chromosomal Variations |
| There's no inter-chromosomal structural variation. |
| - For Intra-chromosomal Variations |
| * Intra-chromosomal variantions includes 'intrachromosomal amplicon to amplicon', 'intrachromosomal amplicon to non-amplified dna', 'intrachromosomal deletion', 'intrachromosomal fold-back inversion', 'intrachromosomal inversion', 'intrachromosomal tandem duplication', 'Intrachromosomal unknown type', 'intrachromosomal with inverted orientation', 'intrachromosomal with non-inverted orientation'. |
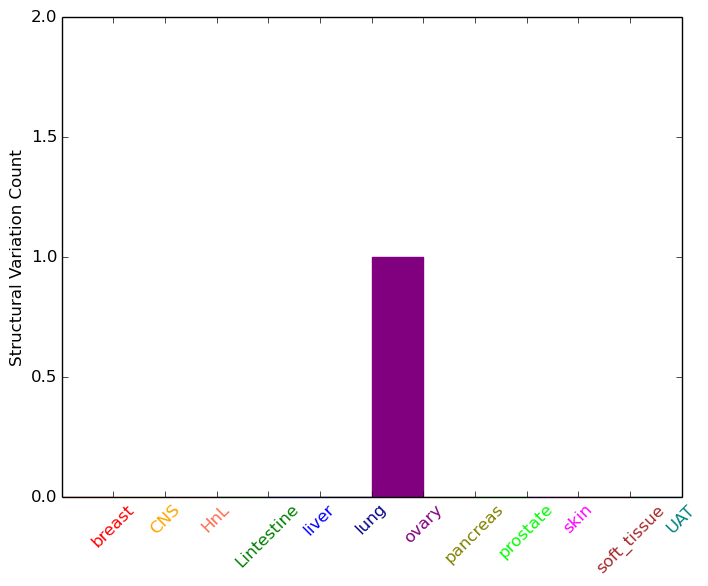 |
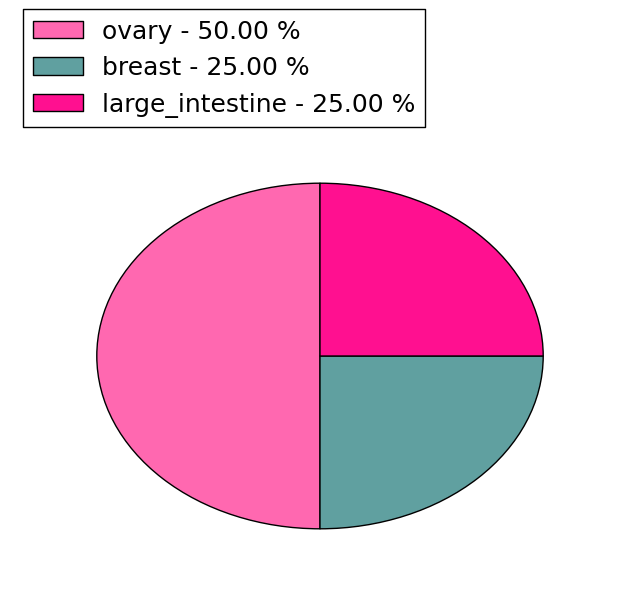
| Sample | Symbol_a | Chr_a | Start_a | End_a | Symbol_b | Chr_b | Start_b | End_b |
| ovary | PYGB | chr20 | 25234122 | 25234142 | chr20 | 24832709 | 24832729 |
| cf) Tissue number; Tissue name (1;Breast, 2;Central_nervous_system, 3;Haematopoietic_and_lymphoid_tissue, 4;Large_intestine, 5;Liver, 6;Lung, 7;Ovary, 8;Pancreas, 9;Prostate, 10;Skin, 11;Soft_tissue, 12;Upper_aerodigestive_tract) |
| * From mRNA Sanger sequences, Chitars2.0 arranged chimeric transcripts. This table shows PYGB related fusion information. |
| ID | Head Gene | Tail Gene | Accession | Gene_a | qStart_a | qEnd_a | Chromosome_a | tStart_a | tEnd_a | Gene_a | qStart_a | qEnd_a | Chromosome_a | tStart_a | tEnd_a |
| DA055429 | PYGB | 1 | 514 | 20 | 25228918 | 25255316 | ACAA1 | 514 | 581 | 3 | 38168011 | 38168078 | |
| BF088479 | LOC100507463 | 4 | 88 | 6 | 4244041 | 4244125 | PYGB | 83 | 346 | 20 | 25277025 | 25277288 | |
| BF764783 | CLIP2 | 1 | 247 | 7 | 73790387 | 73790631 | PYGB | 247 | 383 | 20 | 25266898 | 25267034 | |
| BF908082 | PYGB | 15 | 162 | 20 | 25231048 | 25231195 | PYGB | 154 | 324 | 20 | 25231278 | 25231448 | |
| BE696989 | PYGB | 7 | 287 | 20 | 25266110 | 25266394 | TMEM53 | 281 | 332 | 1 | 45120425 | 45120476 | |
| Z18966 | RPS6KA2 | 5 | 139 | 6 | 166945316 | 166945450 | PYGB | 140 | 342 | 20 | 25277317 | 25277515 | |
| Top |
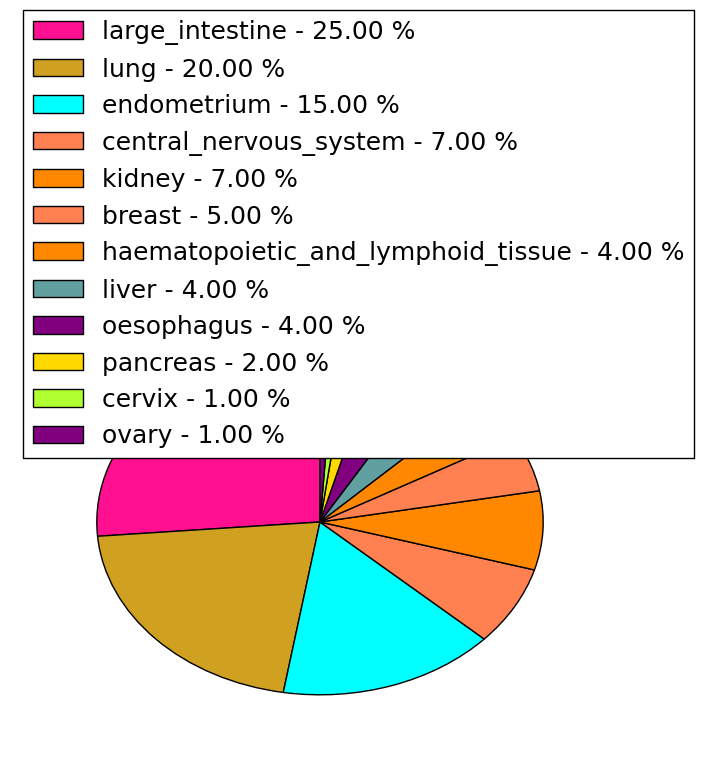
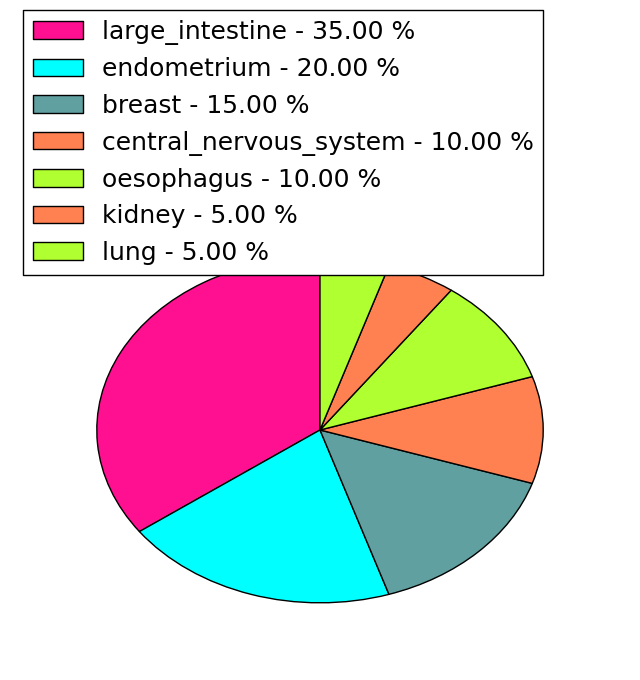
| Mutation type/ Tissue ID | brca | cns | cerv | endome | haematopo | kidn | Lintest | liver | lung | ns | ovary | pancre | prost | skin | stoma | thyro | urina | |||
| Total # sample | 1 | |||||||||||||||||||
| GAIN (# sample) | ||||||||||||||||||||
| LOSS (# sample) | 1 |
| cf) Tissue ID; Tissue type (1; Breast, 2; Central_nervous_system, 3; Cervix, 4; Endometrium, 5; Haematopoietic_and_lymphoid_tissue, 6; Kidney, 7; Large_intestine, 8; Liver, 9; Lung, 10; NS, 11; Ovary, 12; Pancreas, 13; Prostate, 14; Skin, 15; Stomach, 16; Thyroid, 17; Urinary_tract) |
| Top |
|
 |
| Top |
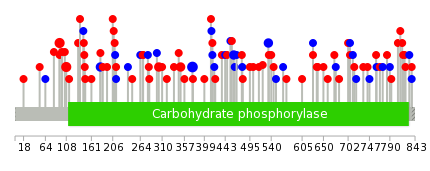
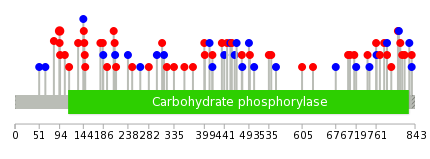
| Stat. for Non-Synonymous SNVs (# total SNVs=70) | (# total SNVs=20) |
 |  |
(# total SNVs=4) | (# total SNVs=0) |
 |
| Top |
| * When you move the cursor on each content, you can see more deailed mutation information on the Tooltip. Those are primary_site,primary_histology,mutation(aa),pubmedID. |
| GRCh37 position | Mutation(aa) | Unique sampleID count |
| chr20:25260931-25260931 | p.A374A | 4 |
| chr20:25239910-25239910 | p.R94H | 3 |
| chr20:25239951-25239951 | p.A108S | 3 |
| chr20:25259739-25259739 | p.E349V | 2 |
| chr20:25259006-25259006 | p.A303S | 2 |
| chr20:25255239-25255239 | p.A180A | 2 |
| chr20:25263895-25263895 | p.D534D | 2 |
| chr20:25261728-25261728 | p.S461S | 2 |
| chr20:25259702-25259702 | p.Q337* | 1 |
| chr20:25263913-25263913 | p.Q540H | 1 |
| Top |
|
 |
| Point Mutation/ Tissue ID | 1 | 2 | 3 | 4 | 5 | 6 | 7 | 8 | 9 | 10 | 11 | 12 | 13 | 14 | 15 | 16 | 17 | 18 | 19 | 20 |
| # sample | 3 | 1 | 15 | 2 | 5 | 2 | 3 | 3 | 1 | 8 | 11 | 1 | 13 | |||||||
| # mutation | 3 | 1 | 14 | 2 | 5 | 2 | 3 | 3 | 1 | 8 | 14 | 1 | 15 | |||||||
| nonsynonymous SNV | 2 | 1 | 13 | 2 | 3 | 2 | 1 | 3 | 1 | 1 | 8 | 1 | 11 | |||||||
| synonymous SNV | 1 | 1 | 2 | 2 | 7 | 6 | 4 |
| cf) Tissue ID; Tissue type (1; BLCA[Bladder Urothelial Carcinoma], 2; BRCA[Breast invasive carcinoma], 3; CESC[Cervical squamous cell carcinoma and endocervical adenocarcinoma], 4; COAD[Colon adenocarcinoma], 5; GBM[Glioblastoma multiforme], 6; Glioma Low Grade, 7; HNSC[Head and Neck squamous cell carcinoma], 8; KICH[Kidney Chromophobe], 9; KIRC[Kidney renal clear cell carcinoma], 10; KIRP[Kidney renal papillary cell carcinoma], 11; LAML[Acute Myeloid Leukemia], 12; LUAD[Lung adenocarcinoma], 13; LUSC[Lung squamous cell carcinoma], 14; OV[Ovarian serous cystadenocarcinoma ], 15; PAAD[Pancreatic adenocarcinoma], 16; PRAD[Prostate adenocarcinoma], 17; SKCM[Skin Cutaneous Melanoma], 18:STAD[Stomach adenocarcinoma], 19:THCA[Thyroid carcinoma], 20:UCEC[Uterine Corpus Endometrial Carcinoma]) |
| Top |
| * We represented just top 10 SNVs. When you move the cursor on each content, you can see more deailed mutation information on the Tooltip. Those are primary_site, primary_histology, mutation(aa), pubmedID. |
| Genomic Position | Mutation(aa) | Unique sampleID count |
| chr20:25239909 | p.R94C | 2 |
| chr20:25262702 | p.R410R | 1 |
| chr20:25255237 | p.Q540H | 1 |
| chr20:25273189 | p.C784C | 1 |
| chr20:25257951 | p.T210S | 1 |
| chr20:25261592 | p.A416G | 1 |
| chr20:25276304 | p.L550L | 1 |
| chr20:25239910 | p.R793W | 1 |
| chr20:25262744 | p.R94H | 1 |
| chr20:25255252 | p.P211P | 1 |
| * Copy number data were extracted from TCGA using R package TCGA-Assembler. The URLs of all public data files on TCGA DCC data server were gathered on Jan-05-2015. Function ProcessCNAData in TCGA-Assembler package was used to obtain gene-level copy number value which is calculated as the average copy number of the genomic region of a gene. |
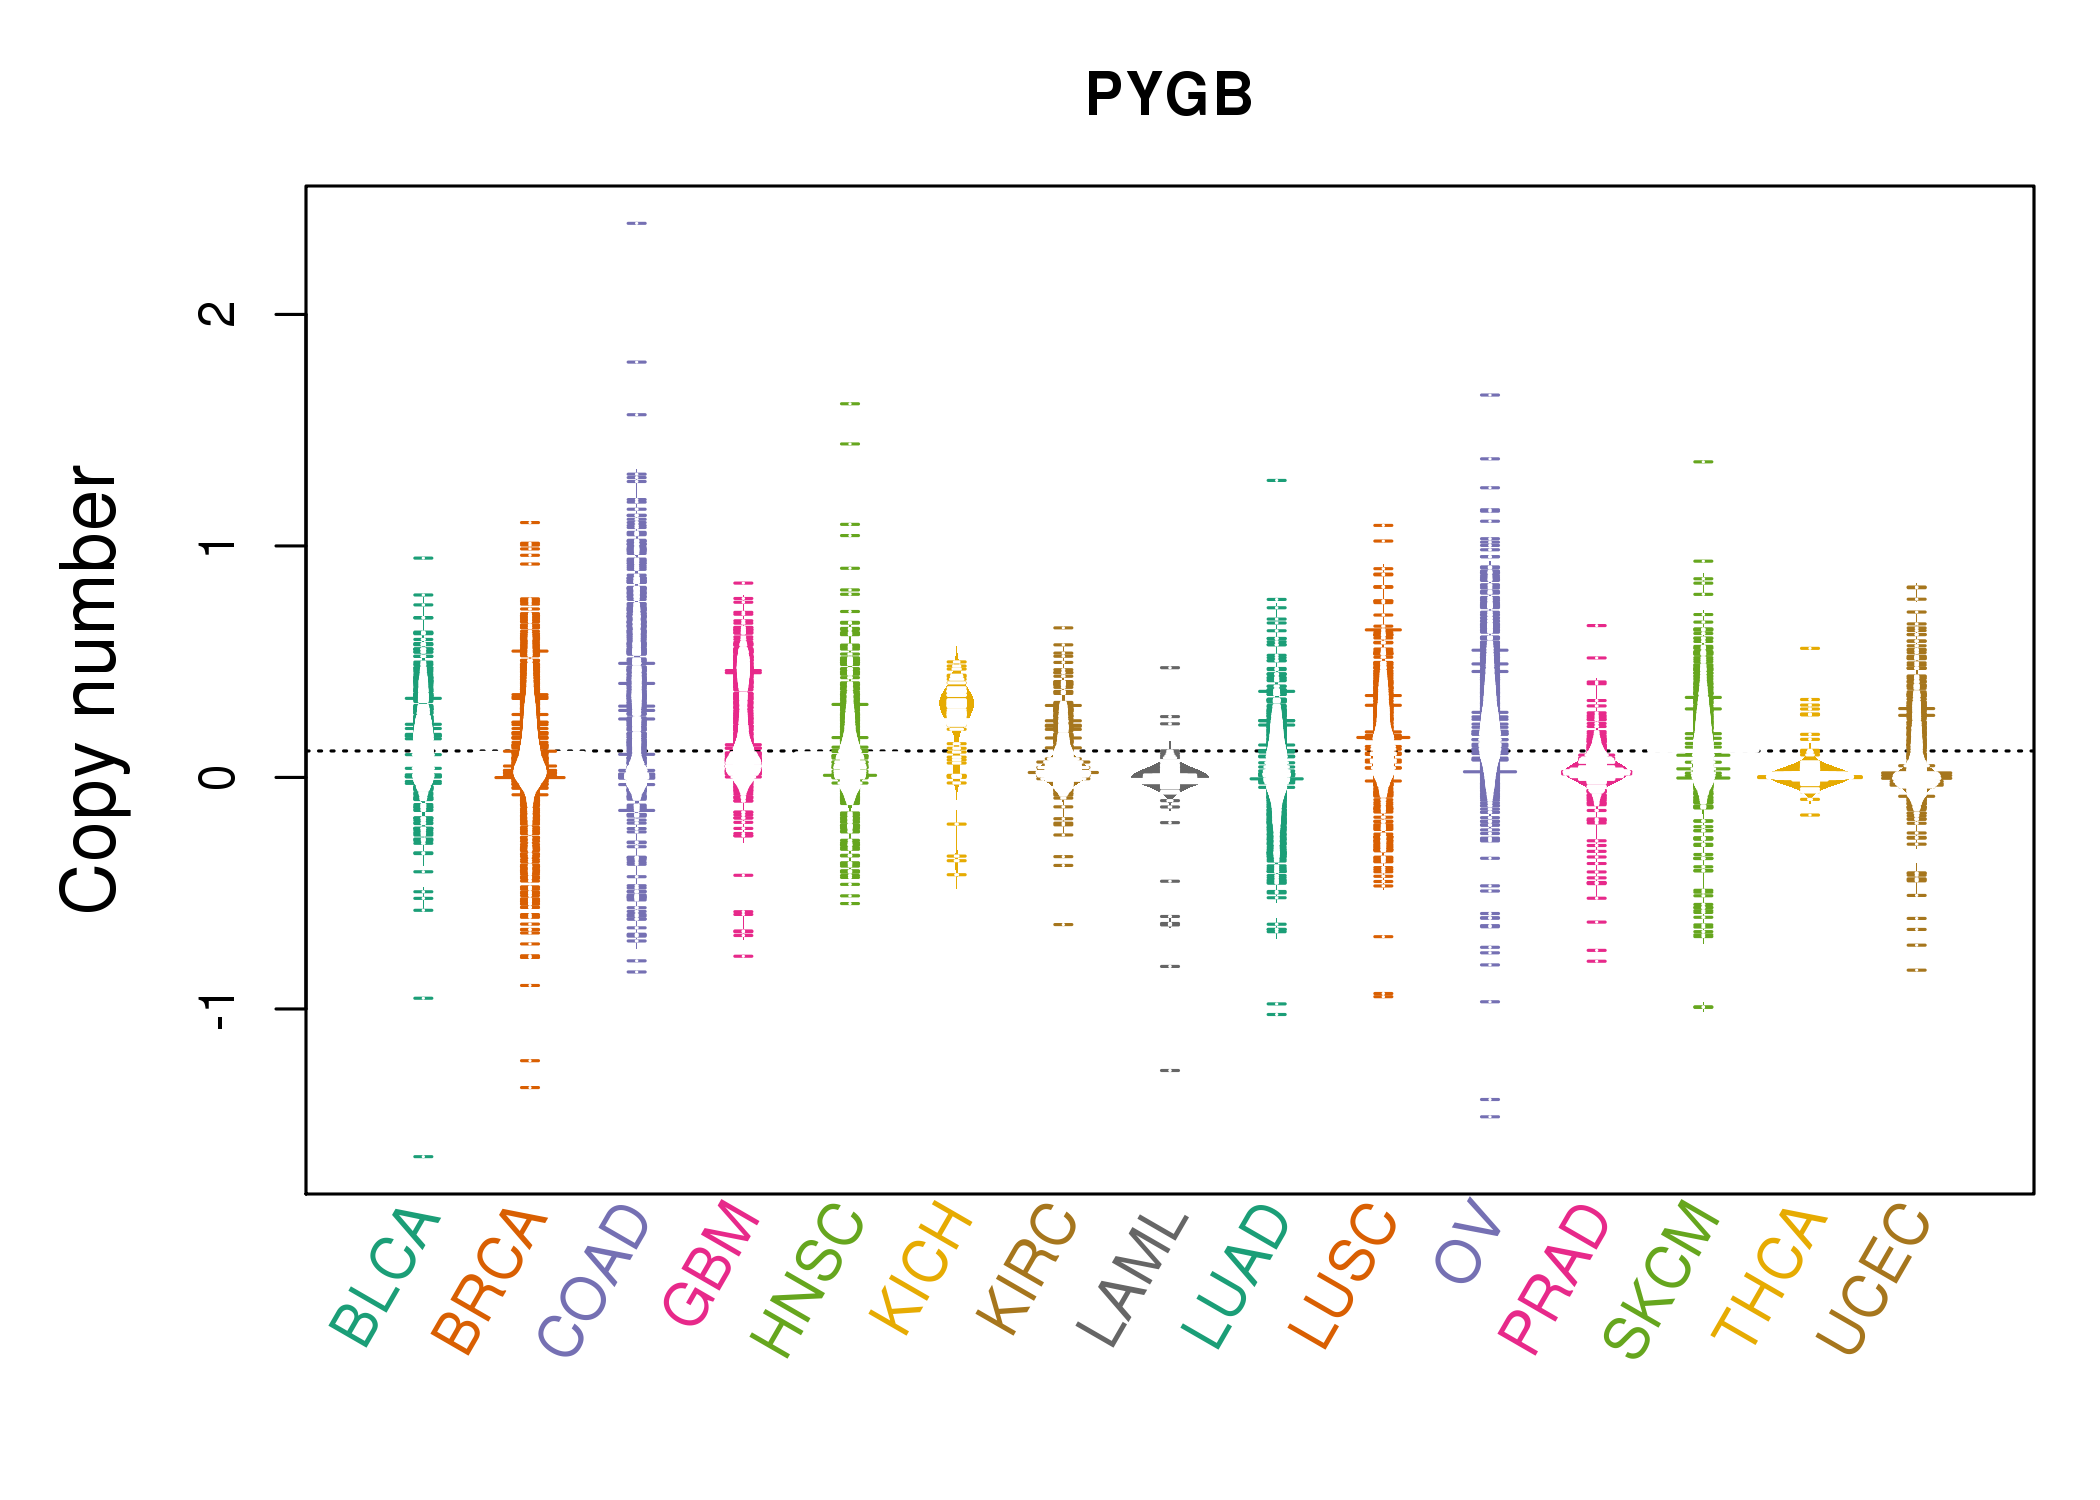 |
| cf) Tissue ID[Tissue type]: BLCA[Bladder Urothelial Carcinoma], BRCA[Breast invasive carcinoma], CESC[Cervical squamous cell carcinoma and endocervical adenocarcinoma], COAD[Colon adenocarcinoma], GBM[Glioblastoma multiforme], Glioma Low Grade, HNSC[Head and Neck squamous cell carcinoma], KICH[Kidney Chromophobe], KIRC[Kidney renal clear cell carcinoma], KIRP[Kidney renal papillary cell carcinoma], LAML[Acute Myeloid Leukemia], LUAD[Lung adenocarcinoma], LUSC[Lung squamous cell carcinoma], OV[Ovarian serous cystadenocarcinoma ], PAAD[Pancreatic adenocarcinoma], PRAD[Prostate adenocarcinoma], SKCM[Skin Cutaneous Melanoma], STAD[Stomach adenocarcinoma], THCA[Thyroid carcinoma], UCEC[Uterine Corpus Endometrial Carcinoma] |
| Top |
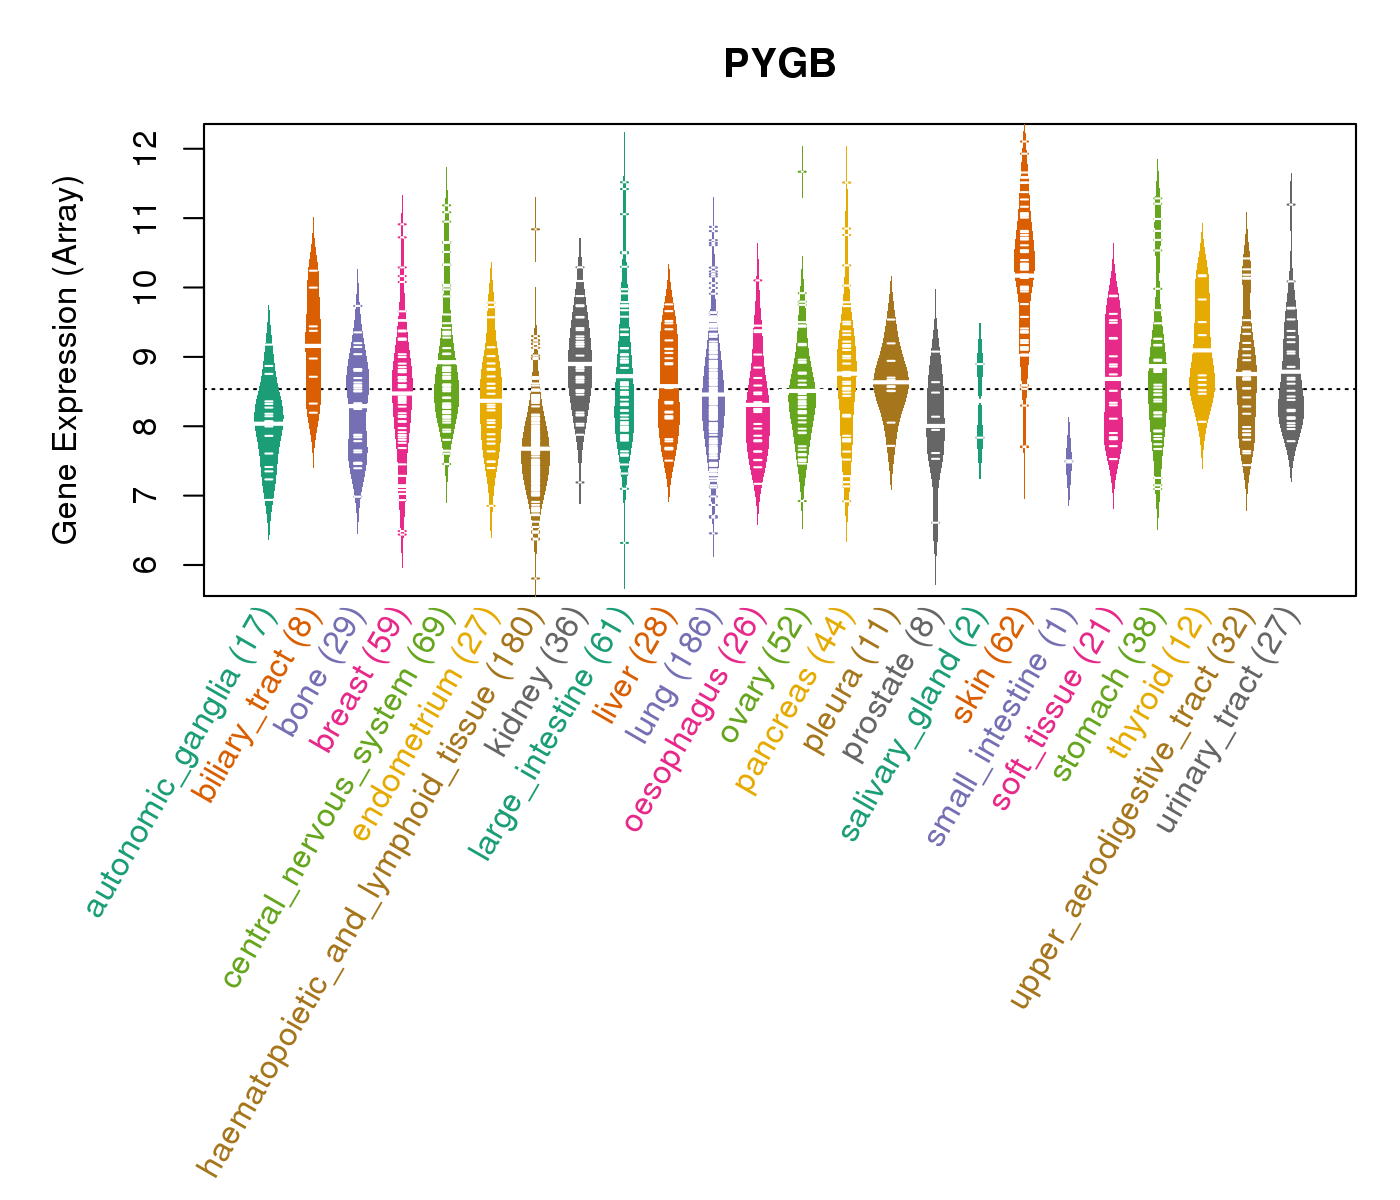
| Gene Expression for PYGB |
| * CCLE gene expression data were extracted from CCLE_Expression_Entrez_2012-10-18.res: Gene-centric RMA-normalized mRNA expression data. |
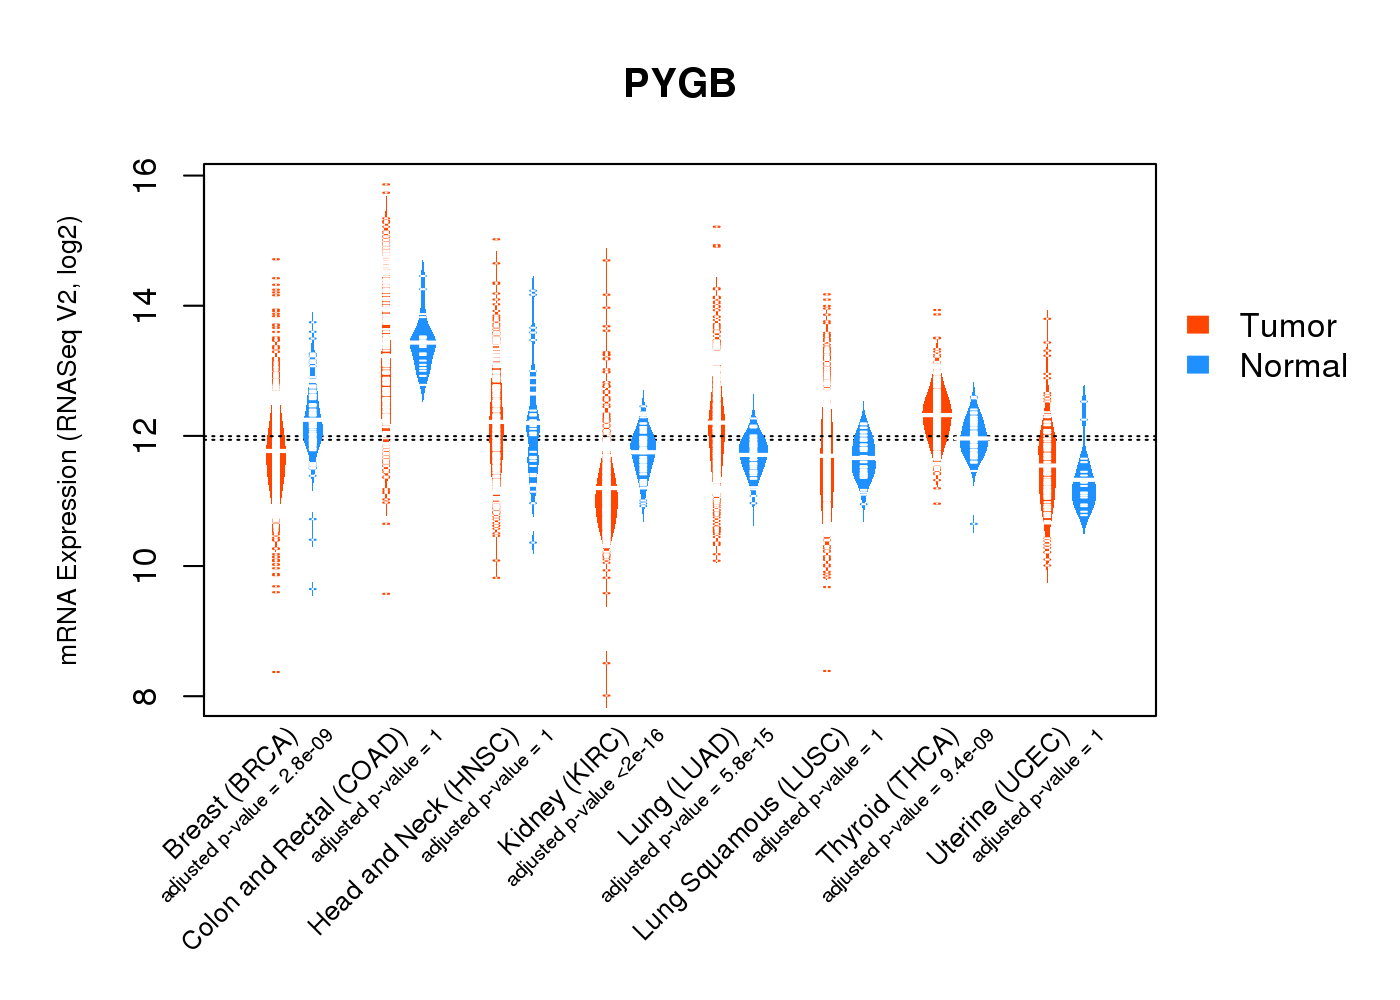
 |
| * Normalized gene expression data of RNASeqV2 was extracted from TCGA using R package TCGA-Assembler. The URLs of all public data files on TCGA DCC data server were gathered at Jan-05-2015. Only eight cancer types have enough normal control samples for differential expression analysis. (t test, adjusted p<0.05 (using Benjamini-Hochberg FDR)) |
 |
| Top |
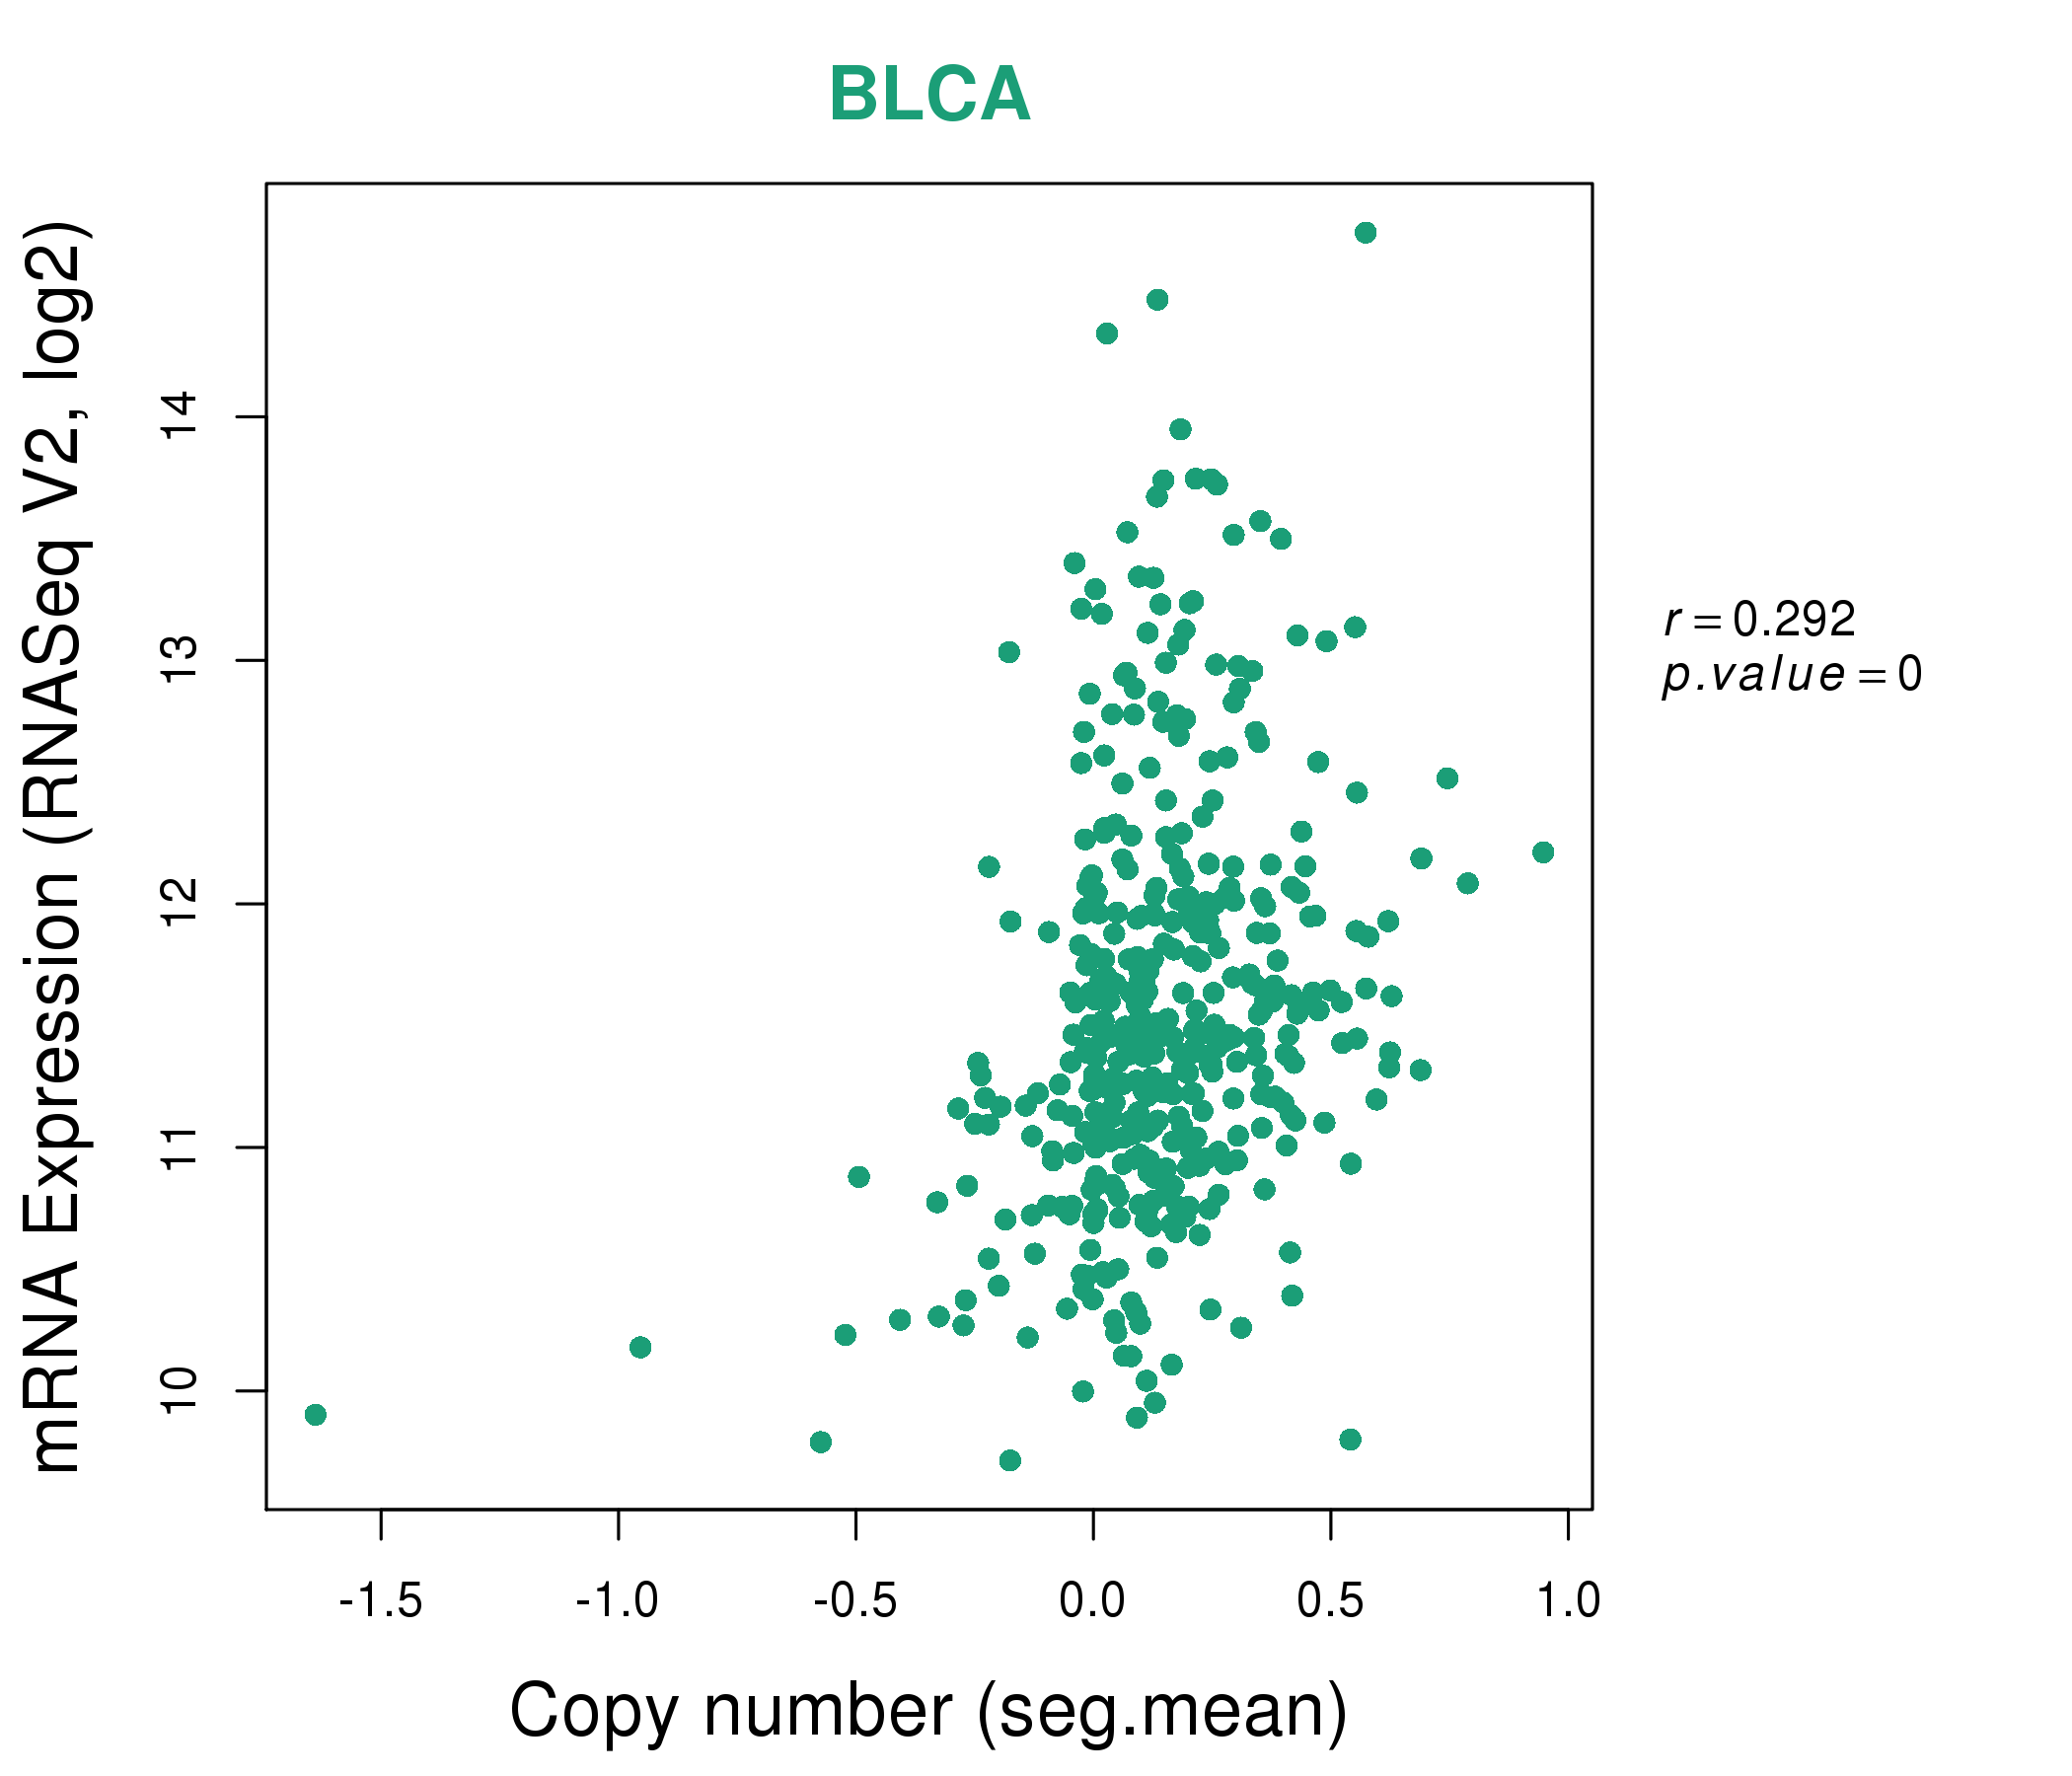
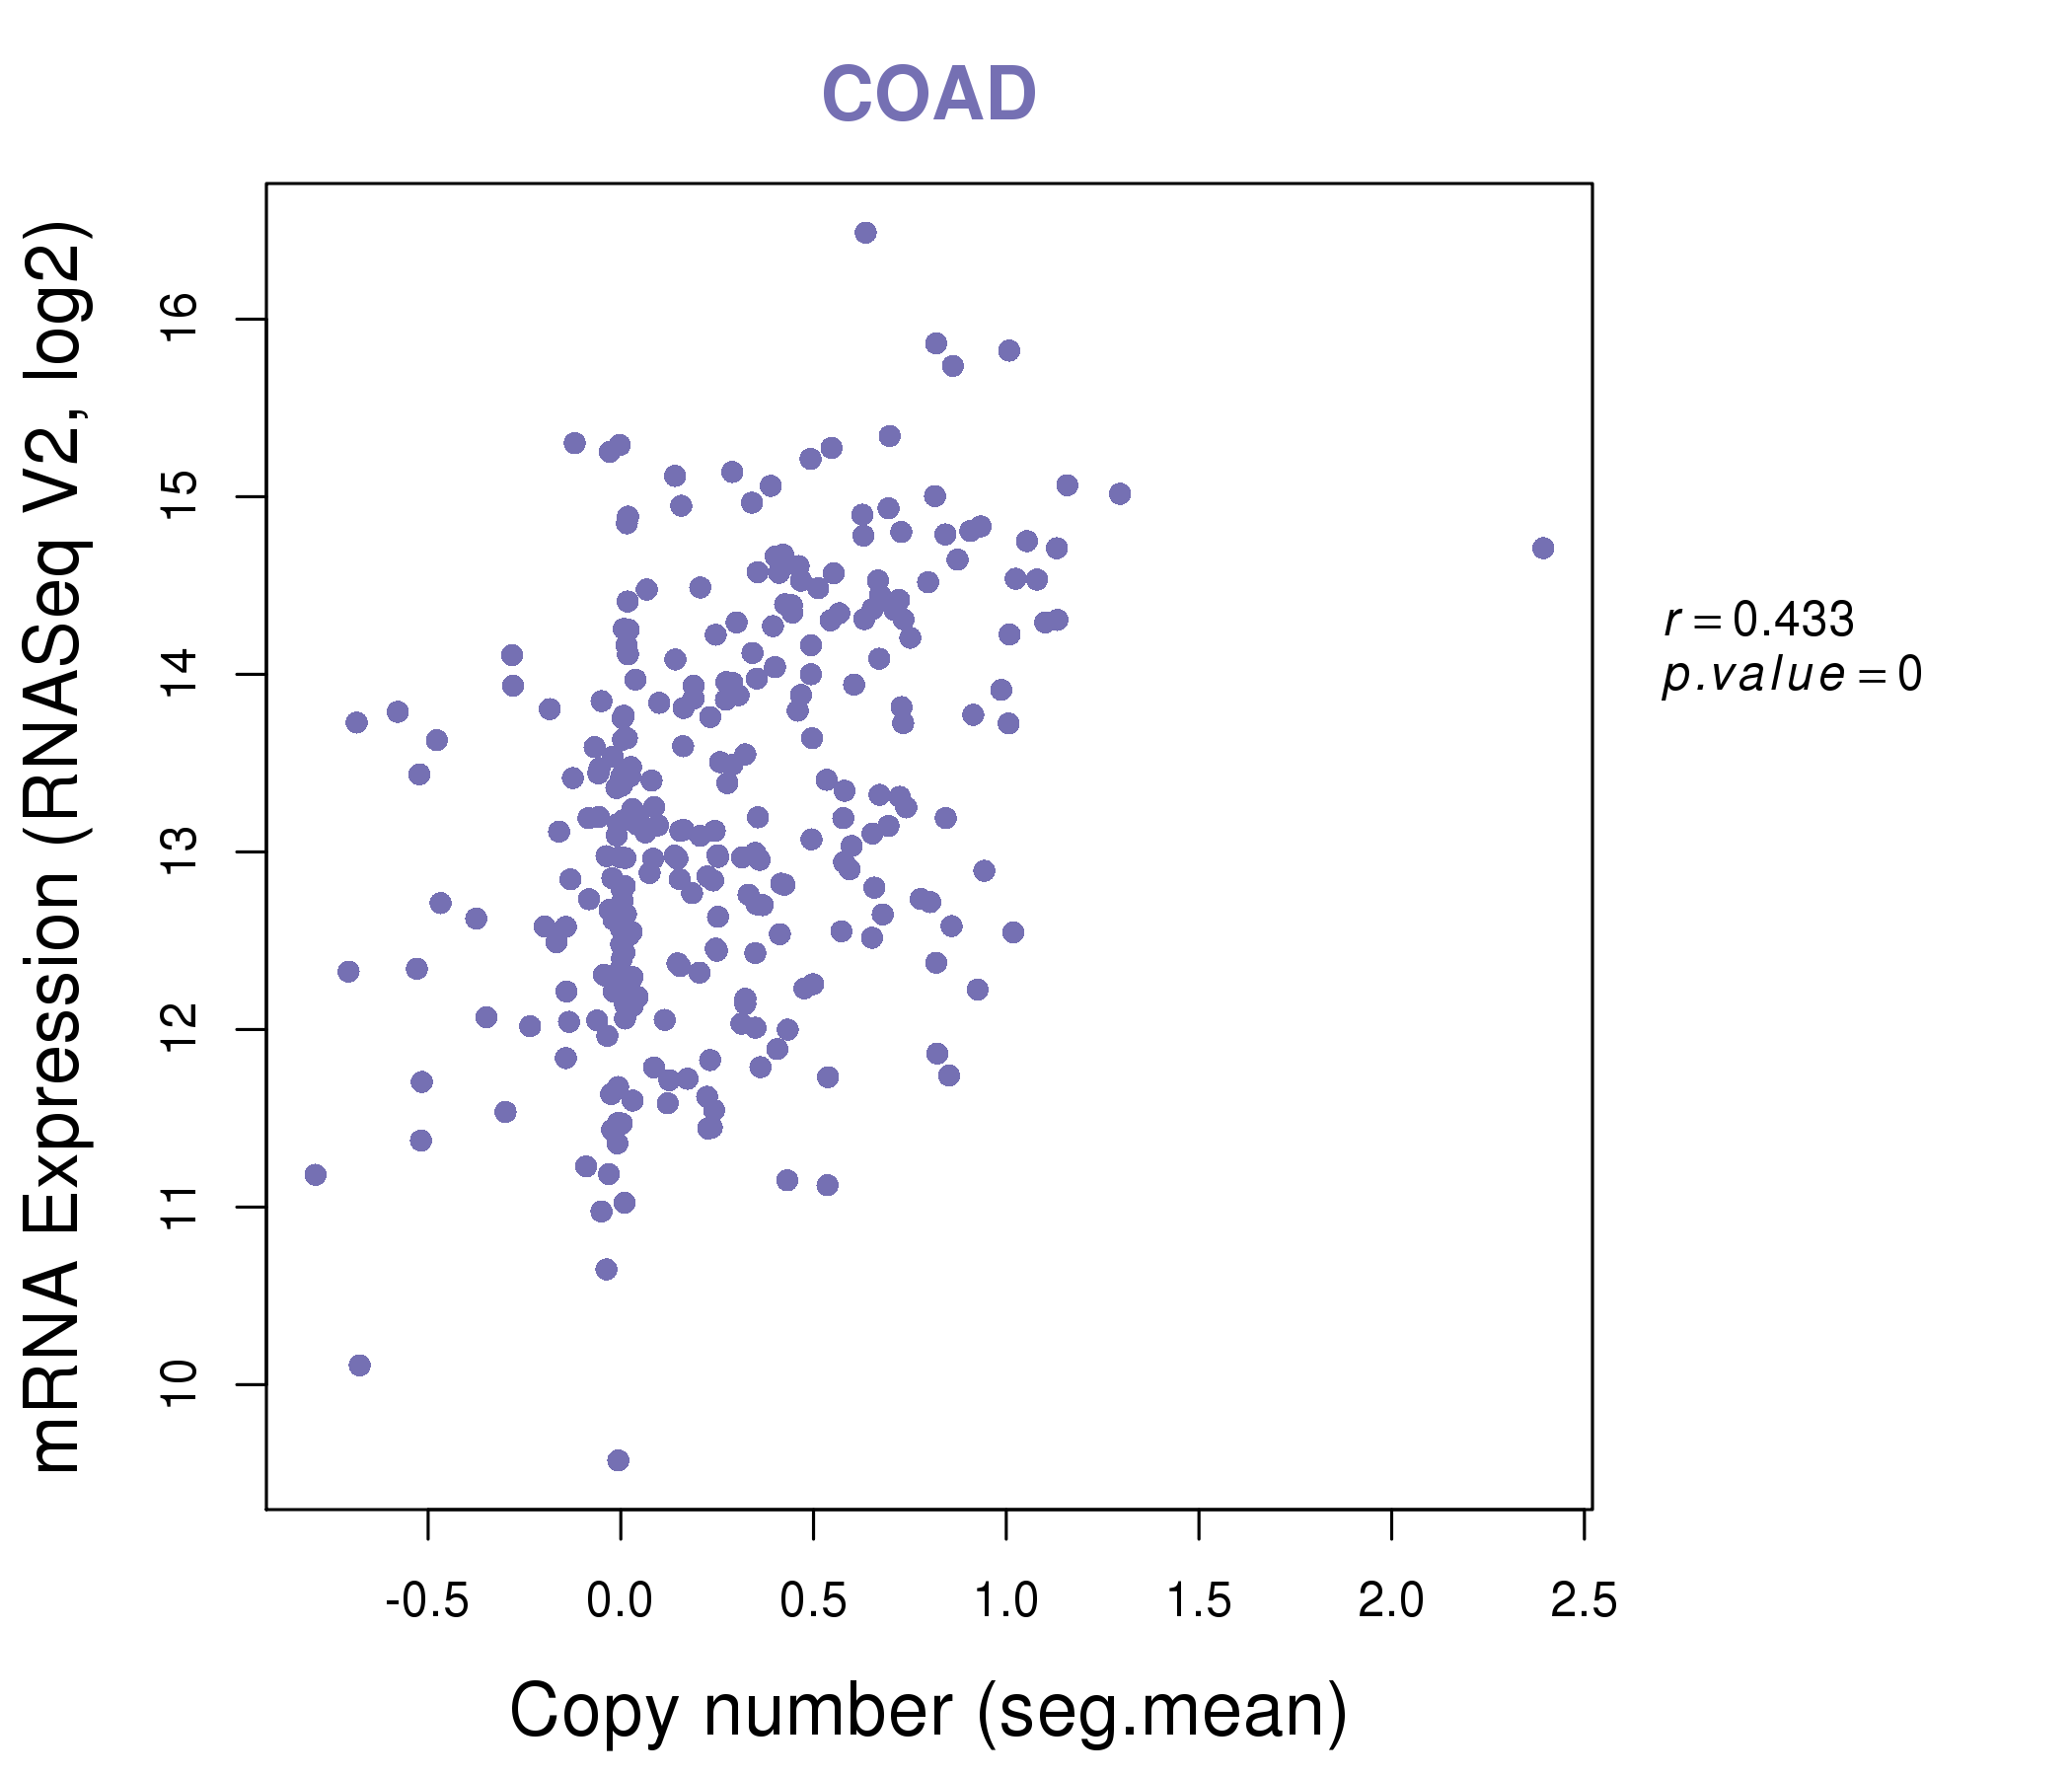
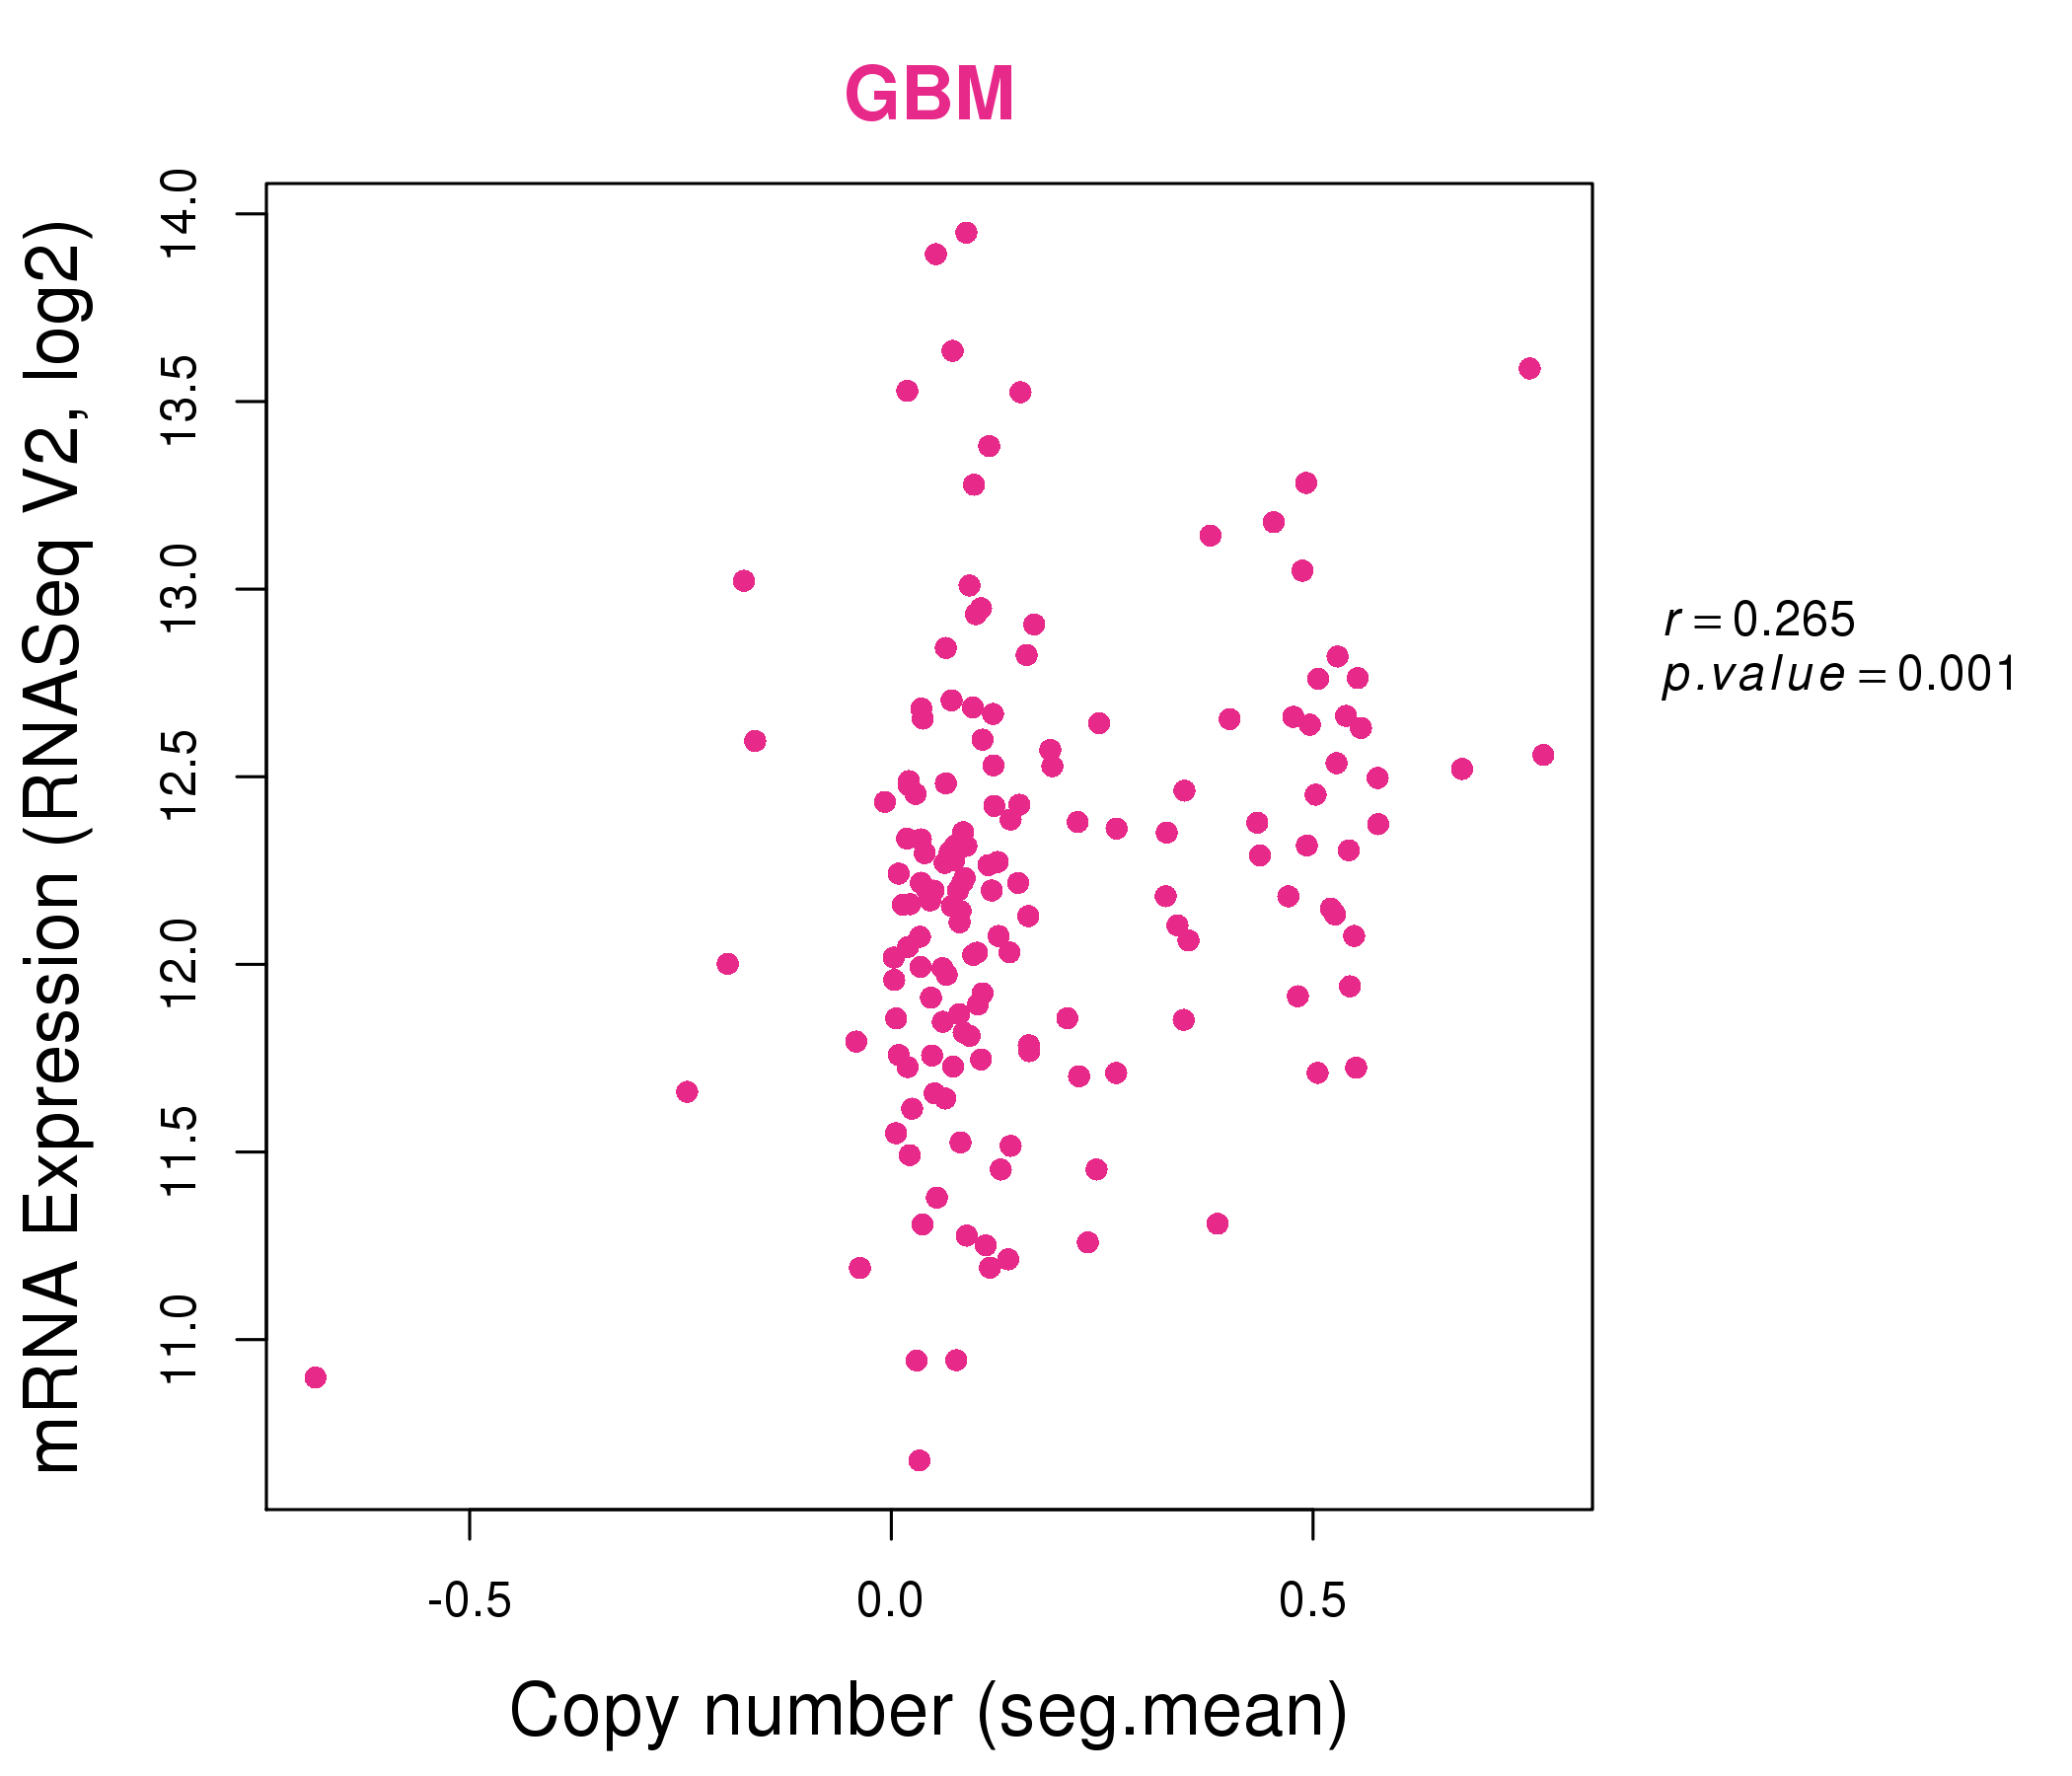
| * This plots show the correlation between CNV and gene expression. |
: Open all plots for all cancer types
 |
|
 |
|

| Top |
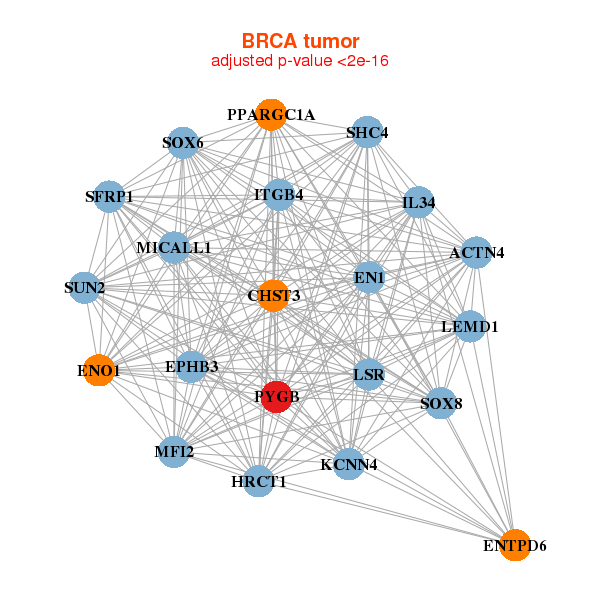
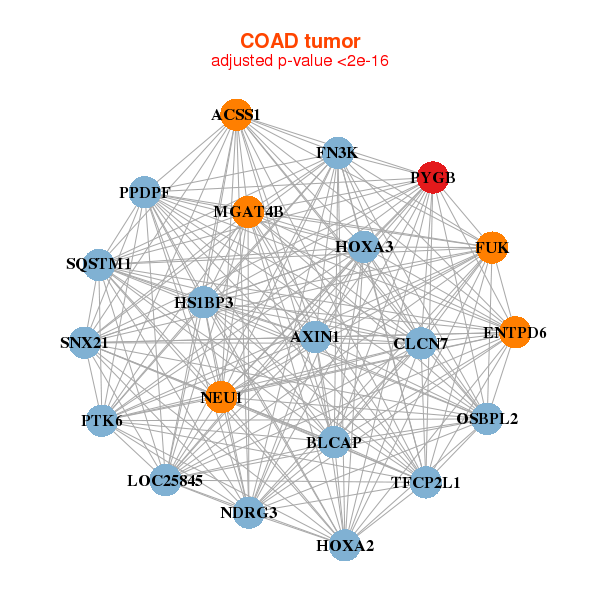
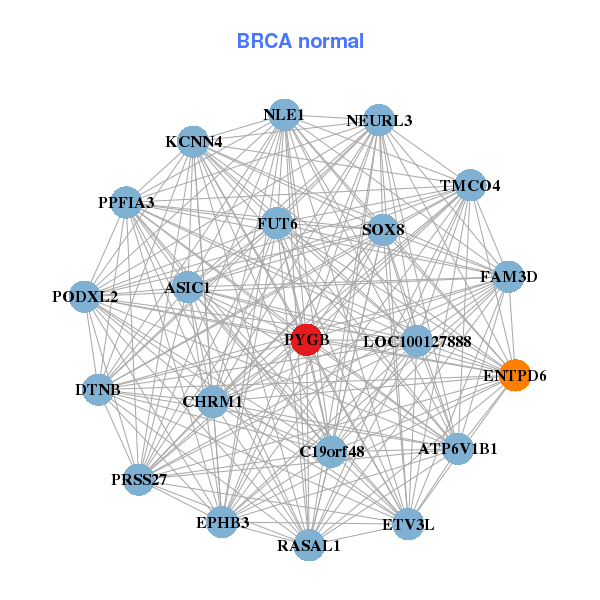
| Gene-Gene Network Information |
| * Co-Expression network figures were drawn using R package igraph. Only the top 20 genes with the highest correlations were shown. Red circle: input gene, orange circle: cell metabolism gene, sky circle: other gene |
: Open all plots for all cancer types
 |
| ||||
| ACTN4,CHST3,EN1,ENO1,ENTPD6,EPHB3,HRCT1, IL34,ITGB4,KCNN4,LEMD1,LSR,MFI2,MICALL1, PPARGC1A,PYGB,SFRP1,SHC4,SOX6,SOX8,SUN2 | ASIC1,ATP6V1B1,C19orf48,CHRM1,DTNB,ENTPD6,EPHB3, ETV3L,FAM3D,FUT6,KCNN4,LOC100127888,NEURL3,NLE1, PODXL2,PPFIA3,PRSS27,PYGB,RASAL1,SOX8,TMCO4 | ||||
 |
| ||||
| ACSS1,AXIN1,BLCAP,CLCN7,ENTPD6,FN3K,FUK, HOXA2,HOXA3,HS1BP3,LOC25845,MGAT4B,NDRG3,NEU1, OSBPL2,PPDPF,PTK6,PYGB,SNX21,SQSTM1,TFCP2L1 | ARRB1,BMP3,CSNK1D,DAB2IP,DGCR2,MVB12B,GPR37L1, IL4R,IP6K1,CIPC,MTMR3,OTUD7B,PYGB,RNF144A, SLC25A23,SSBP3,STIM1,SUN2,TEF,TOM1L2,USP19 |
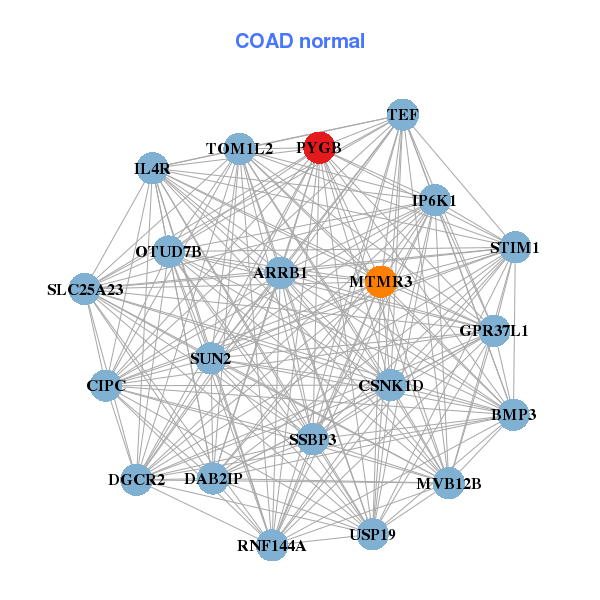
| * Co-Expression network figures were drawn using R package igraph. Only the top 20 genes with the highest correlations were shown. Red circle: input gene, orange circle: cell metabolism gene, sky circle: other gene |
: Open all plots for all cancer types
| Top |
: Open all interacting genes' information including KEGG pathway for all interacting genes from DAVID
| Top |
| Pharmacological Information for PYGB |
| DB Category | DB Name | DB's ID and Url link |
| * Gene Centered Interaction Network. |
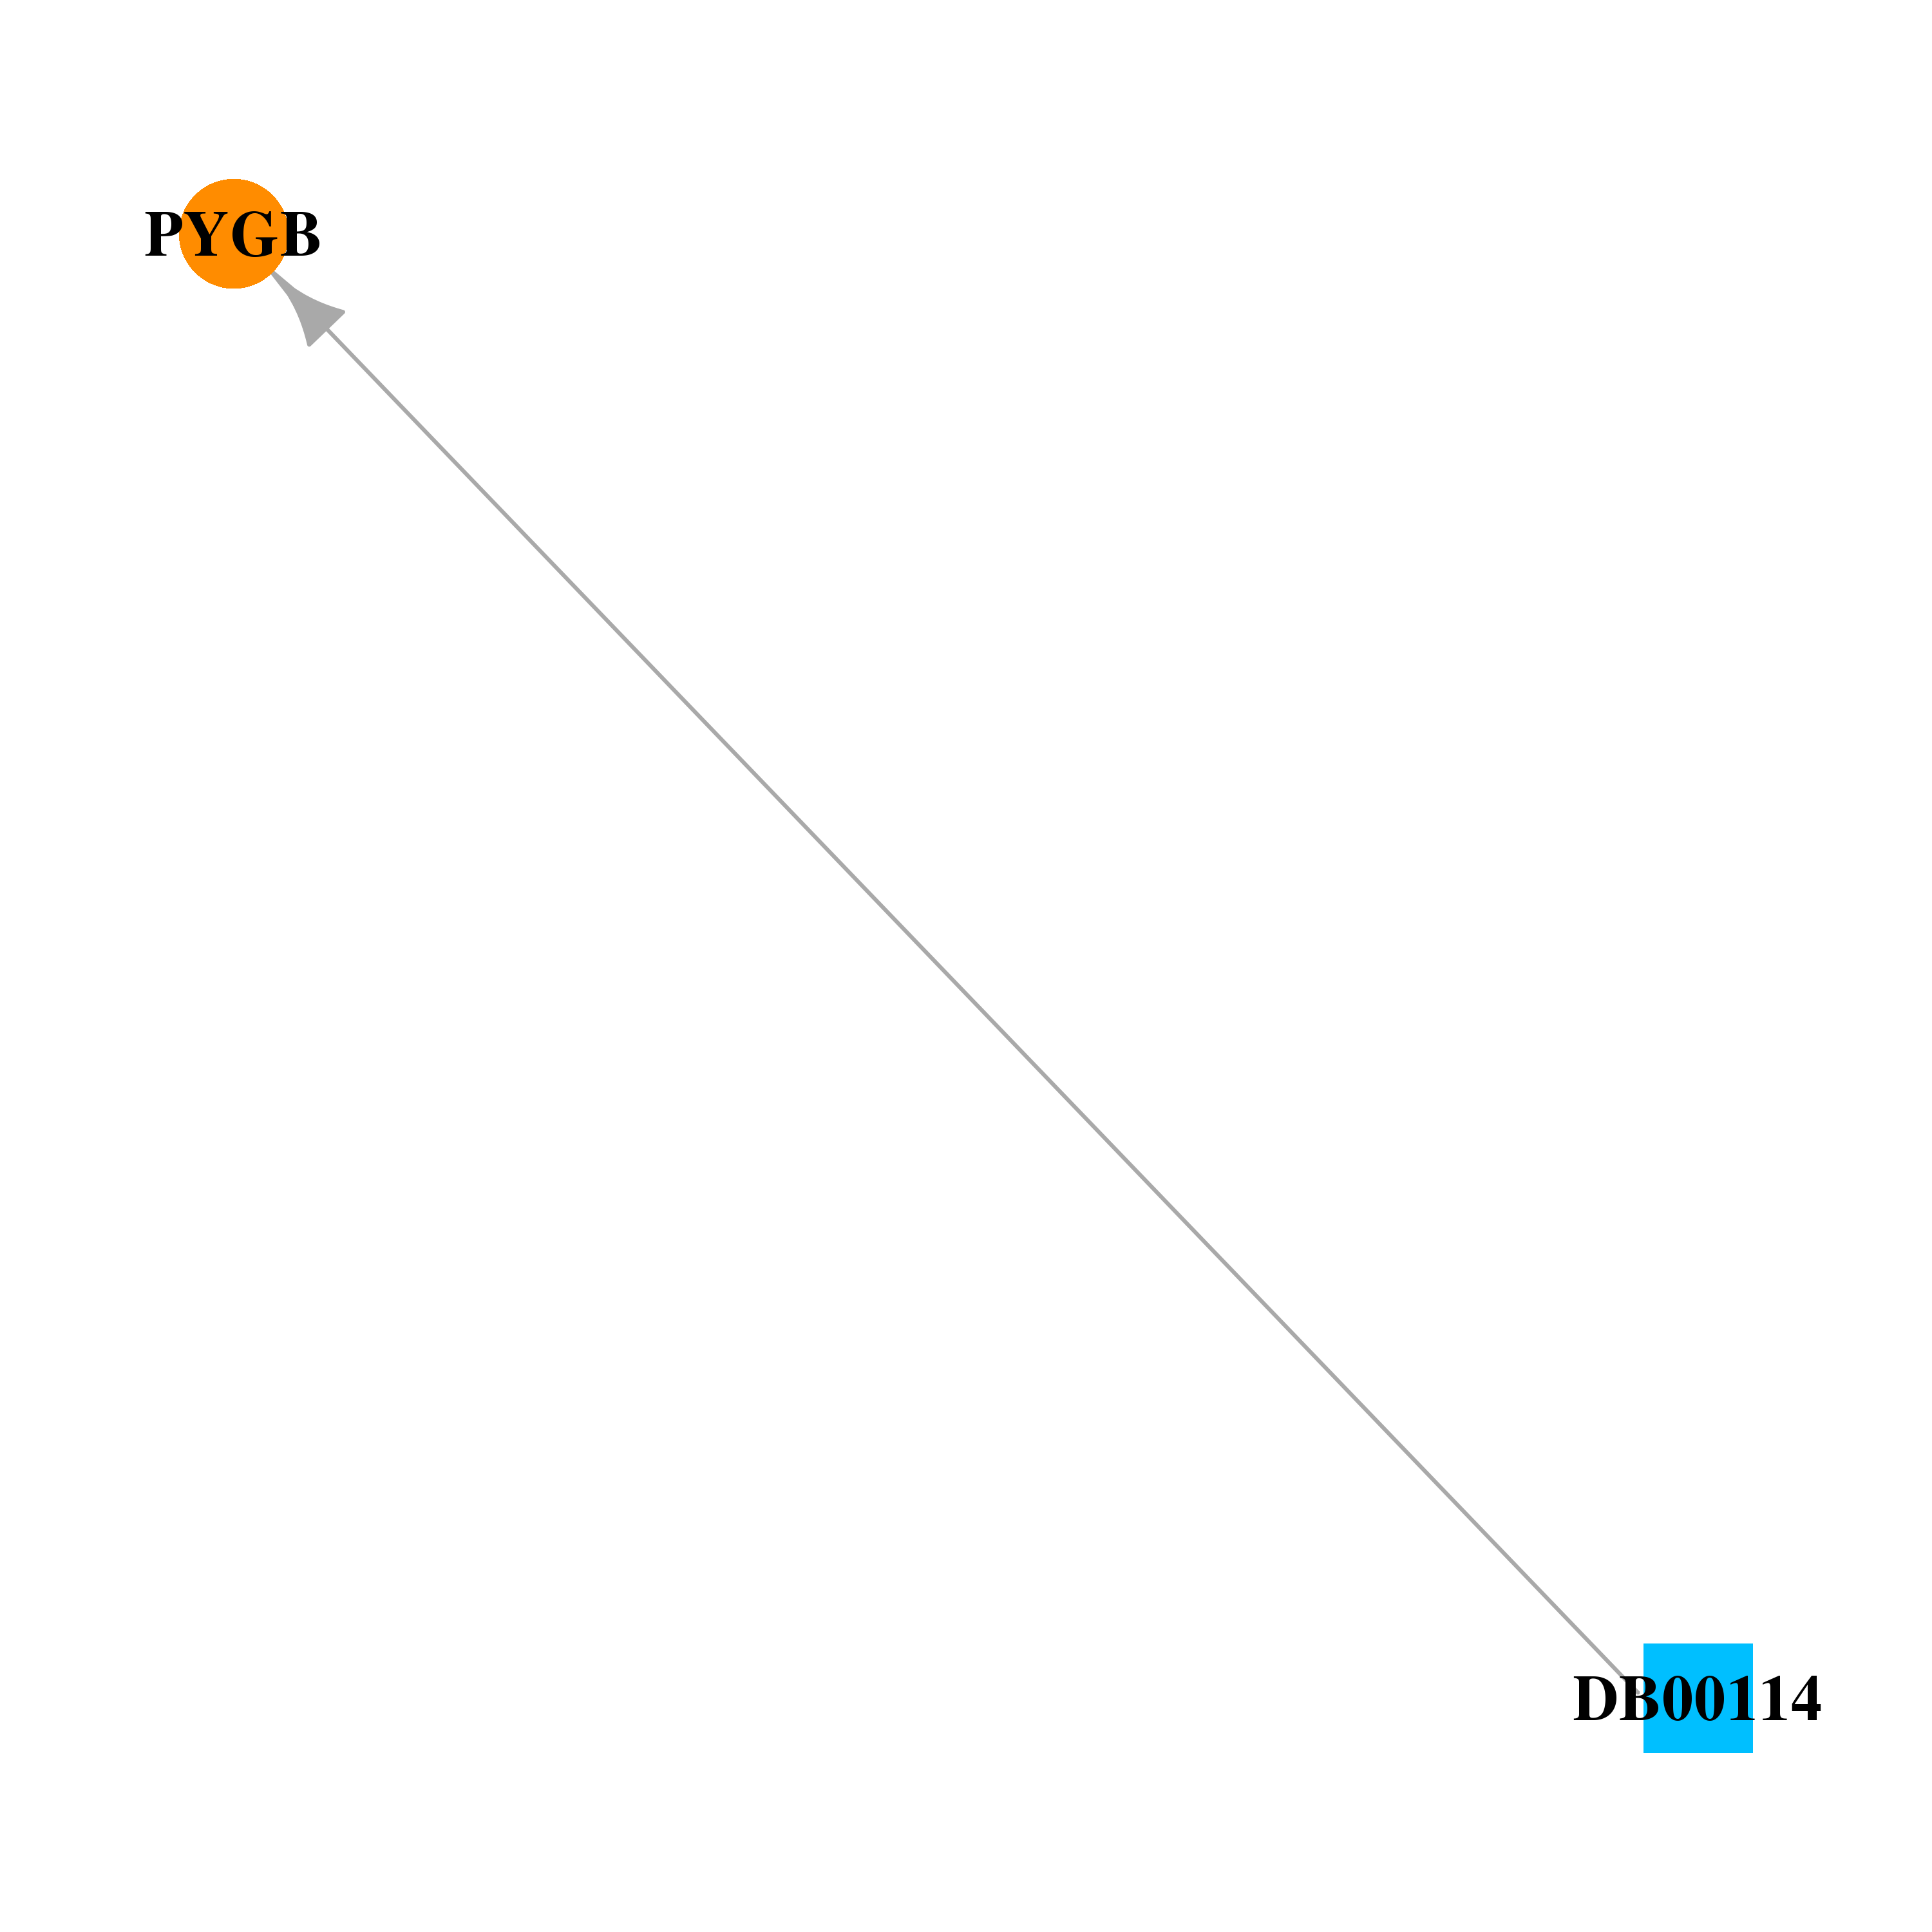 |
| * Drug Centered Interaction Network. |
| DrugBank ID | Target Name | Drug Groups | Generic Name | Drug Centered Network | Drug Structure |
| DB00114 | phosphorylase, glycogen; brain | nutraceutical | Pyridoxal Phosphate |  |  |
| Top |
| Cross referenced IDs for PYGB |
| * We obtained these cross-references from Uniprot database. It covers 150 different DBs, 18 categories. http://www.uniprot.org/help/cross_references_section |
: Open all cross reference information
|
Copyright © 2016-Present - The Univsersity of Texas Health Science Center at Houston @ |