|
||||||||||||||||||||||||||||||||||||||||||||||||||||||||||||||||||||||||||||||||||||||||||||||||||||||||||||||||||||||||||||||||||||||||||||||||||||||||||||||||||||||||||||||||||||||||||||||||||||||||||||||||||||||||||||||||||||||||||||||||||||||||||||||||||||||||||||||||||||||||||||||||||||||||||||||||||||||||||
| |
| Phenotypic Information (metabolism pathway, cancer, disease, phenome) |
| |
| |
| Gene-Gene Network Information: Co-Expression Network, Interacting Genes & KEGG |
| |
|


| Gene Summary for RANBP2 |
| Basic gene info. | Gene symbol | RANBP2 |
| Gene name | RAN binding protein 2 | |
| Synonyms | ADANE|ANE1|IIAE3|NUP358|TRP1|TRP2 | |
| Cytomap | UCSC genome browser: 2q12.3 | |
| Genomic location | chr2 :109335936-109402267 | |
| Type of gene | protein-coding | |
| RefGenes | NM_006267.4, | |
| Ensembl id | ENSG00000153201 | |
| Description | 358 kDa nucleoporinE3 SUMO-protein ligase RanBP2P270acute necrotizing encephalopathy 1 (autosomal dominant)nuclear pore complex protein Nup358nucleoporin 358nucleoporin Nup358ran-binding protein 2transformation-related protein 2 | |
| Modification date | 20141218 | |
| dbXrefs | MIM : 601181 | |
| HGNC : HGNC | ||
| Ensembl : ENSG00000153201 | ||
| HPRD : 03111 | ||
| Vega : OTTHUMG00000130981 | ||
| Protein | UniProt: P49792 go to UniProt's Cross Reference DB Table | |
| Expression | CleanEX: HS_RANBP2 | |
| BioGPS: 5903 | ||
| Gene Expression Atlas: ENSG00000153201 | ||
| The Human Protein Atlas: ENSG00000153201 | ||
| Pathway | NCI Pathway Interaction Database: RANBP2 | |
| KEGG: RANBP2 | ||
| REACTOME: RANBP2 | ||
| ConsensusPathDB | ||
| Pathway Commons: RANBP2 | ||
| Metabolism | MetaCyc: RANBP2 | |
| HUMANCyc: RANBP2 | ||
| Regulation | Ensembl's Regulation: ENSG00000153201 | |
| miRBase: chr2 :109,335,936-109,402,267 | ||
| TargetScan: NM_006267 | ||
| cisRED: ENSG00000153201 | ||
| Context | iHOP: RANBP2 | |
| cancer metabolism search in PubMed: RANBP2 | ||
| UCL Cancer Institute: RANBP2 | ||
| Assigned class in ccmGDB | B - This gene belongs to cancer gene. | |
| Top |
| Phenotypic Information for RANBP2(metabolism pathway, cancer, disease, phenome) |
| Cancer | CGAP: RANBP2 |
| Familial Cancer Database: RANBP2 | |
| * This gene is included in those cancer gene databases. |
|
|
|
|
|
| . | ||||||||||||||||||||||||||||||||||||||||||||||||||||||||||||||||||||||||||||||||||||||||||||||||||||||||||||||||||||||||||||||||||||||||||||||||||||||||||||||||||||||||||||||||||||||||||||||||||||||||||||||||||||||||||||||||||||||||||||||||||||||||||||||||||||||||||||||||||||||||||||||||||||||||||||||||||||
Oncogene 1 | Significant driver gene in | |||||||||||||||||||||||||||||||||||||||||||||||||||||||||||||||||||||||||||||||||||||||||||||||||||||||||||||||||||||||||||||||||||||||||||||||||||||||||||||||||||||||||||||||||||||||||||||||||||||||||||||||||||||||||||||||||||||||||||||||||||||||||||||||||||||||||||||||||||||||||||||||||||||||||||||||||||||||||
| cf) number; DB name 1 Oncogene; http://nar.oxfordjournals.org/content/35/suppl_1/D721.long, 2 Tumor Suppressor gene; https://bioinfo.uth.edu/TSGene/, 3 Cancer Gene Census; http://www.nature.com/nrc/journal/v4/n3/abs/nrc1299.html, 4 CancerGenes; http://nar.oxfordjournals.org/content/35/suppl_1/D721.long, 5 Network of Cancer Gene; http://ncg.kcl.ac.uk/index.php, 1Therapeutic Vulnerabilities in Cancer; http://cbio.mskcc.org/cancergenomics/statius/ |
| REACTOME_METABOLISM_OF_NON_CODING_RNA REACTOME_METABOLISM_OF_RNA REACTOME_METABOLISM_OF_CARBOHYDRATES | |
| OMIM | 601181; gene. 608033; phenotype. |
| Orphanet | 178342; Inflammatory myofibroblastic tumor. 263524; Acute necrotizing encephalopathy of childhood. 88619; Familial acute necrotizing encephalopathy. |
| Disease | KEGG Disease: RANBP2 |
| MedGen: RANBP2 (Human Medical Genetics with Condition) | |
| ClinVar: RANBP2 | |
| Phenotype | MGI: RANBP2 (International Mouse Phenotyping Consortium) |
| PhenomicDB: RANBP2 | |
| Mutations for RANBP2 |
| * Under tables are showing count per each tissue to give us broad intuition about tissue specific mutation patterns.You can go to the detailed page for each mutation database's web site. |
| There's no structural variation information in COSMIC data for this gene. |
| * From mRNA Sanger sequences, Chitars2.0 arranged chimeric transcripts. This table shows RANBP2 related fusion information. |
| ID | Head Gene | Tail Gene | Accession | Gene_a | qStart_a | qEnd_a | Chromosome_a | tStart_a | tEnd_a | Gene_a | qStart_a | qEnd_a | Chromosome_a | tStart_a | tEnd_a |
| CR738758 | RANBP2 | 6 | 230 | 2 | 109401034 | 109401258 | INPP5B | 223 | 543 | 1 | 38327455 | 38327775 | |
| AA682348 | RANBP2 | 1 | 52 | 2 | 109345453 | 109345504 | MAP2 | 53 | 433 | 2 | 210596571 | 210596951 | |
| AY170823 | RPLP1 | 38 | 533 | 15 | 69745176 | 69747885 | RANBP2 | 530 | 2270 | 2 | 109389349 | 109400561 | |
| Top |
| Mutation type/ Tissue ID | brca | cns | cerv | endome | haematopo | kidn | Lintest | liver | lung | ns | ovary | pancre | prost | skin | stoma | thyro | urina | |||
| Total # sample | 1 | |||||||||||||||||||
| GAIN (# sample) | 1 | |||||||||||||||||||
| LOSS (# sample) |
| cf) Tissue ID; Tissue type (1; Breast, 2; Central_nervous_system, 3; Cervix, 4; Endometrium, 5; Haematopoietic_and_lymphoid_tissue, 6; Kidney, 7; Large_intestine, 8; Liver, 9; Lung, 10; NS, 11; Ovary, 12; Pancreas, 13; Prostate, 14; Skin, 15; Stomach, 16; Thyroid, 17; Urinary_tract) |
| Top |
|
 |
| Top |
| Stat. for Non-Synonymous SNVs (# total SNVs=217) | (# total SNVs=43) |
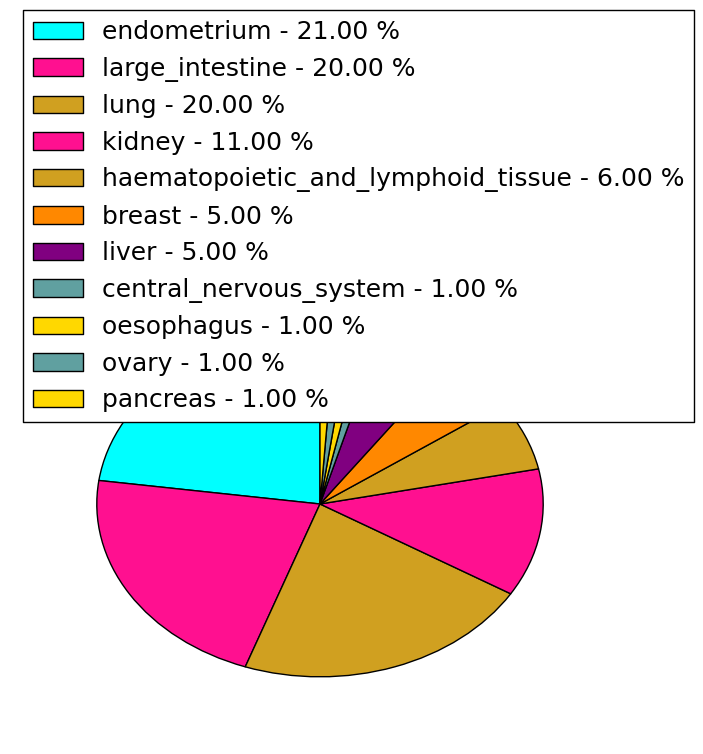 | 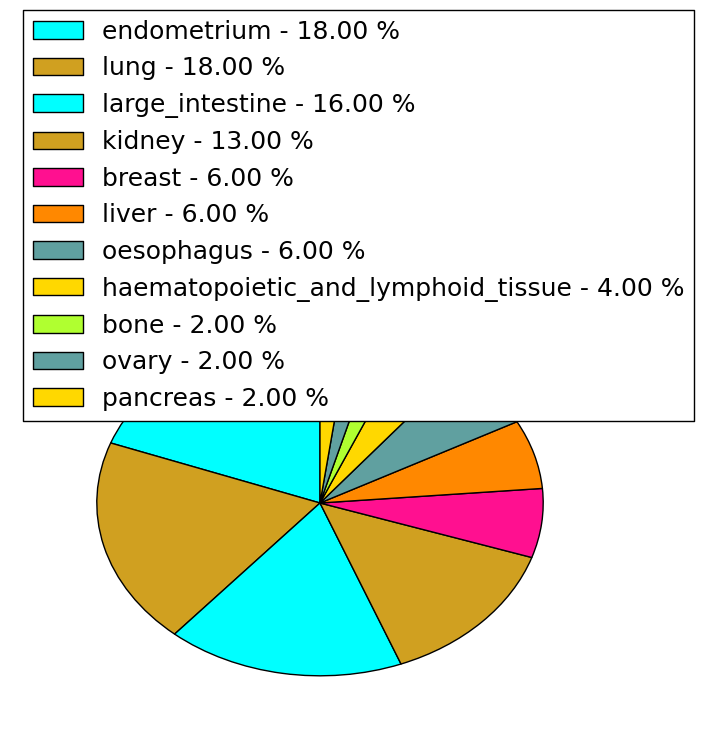 |
(# total SNVs=4) | (# total SNVs=5) |
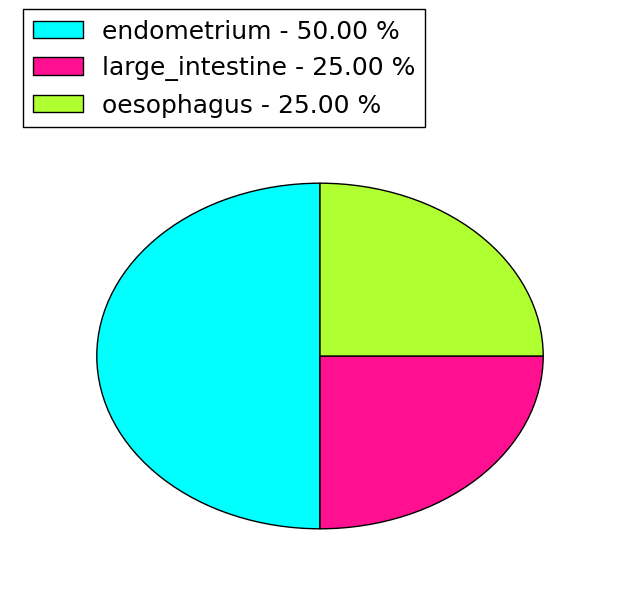 | 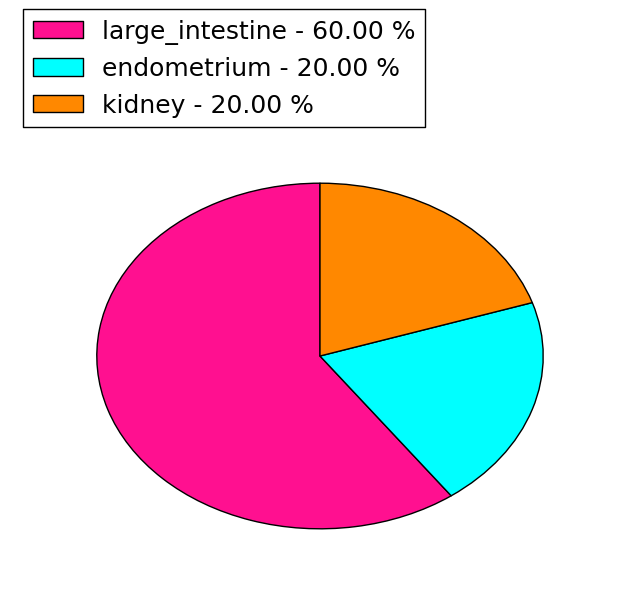 |
| Top |
| * When you move the cursor on each content, you can see more deailed mutation information on the Tooltip. Those are primary_site,primary_histology,mutation(aa),pubmedID. |
| GRCh37 position | Mutation(aa) | Unique sampleID count |
| chr2:109367844-109367844 | p.H466Q | 3 |
| chr2:109383357-109383357 | p.Q2121R | 3 |
| chr2:109367729-109367729 | p.R428Q | 3 |
| chr2:109380602-109380602 | p.R1203C | 3 |
| chr2:109382170-109382170 | p.E1725E | 3 |
| chr2:109371498-109371498 | p.P780P | 3 |
| chr2:109380715-109380715 | p.L1240L | 2 |
| chr2:109382585-109382585 | p.V1864M | 2 |
| chr2:109384259-109384259 | p.R2422C | 2 |
| chr2:109388981-109388981 | p.G2686V | 2 |
| Top |
|
 |
| Point Mutation/ Tissue ID | 1 | 2 | 3 | 4 | 5 | 6 | 7 | 8 | 9 | 10 | 11 | 12 | 13 | 14 | 15 | 16 | 17 | 18 | 19 | 20 |
| # sample | 9 | 5 | 1 | 22 | 7 | 19 | 4 | 21 | 14 | 2 | 4 | 27 | 33 | 2 | 25 | |||||
| # mutation | 10 | 5 | 1 | 29 | 7 | 22 | 4 | 30 | 16 | 2 | 3 | 29 | 41 | 2 | 45 | |||||
| nonsynonymous SNV | 7 | 5 | 1 | 24 | 5 | 18 | 2 | 22 | 13 | 2 | 21 | 28 | 1 | 37 | ||||||
| synonymous SNV | 3 | 5 | 2 | 4 | 2 | 8 | 3 | 3 | 8 | 13 | 1 | 8 |
| cf) Tissue ID; Tissue type (1; BLCA[Bladder Urothelial Carcinoma], 2; BRCA[Breast invasive carcinoma], 3; CESC[Cervical squamous cell carcinoma and endocervical adenocarcinoma], 4; COAD[Colon adenocarcinoma], 5; GBM[Glioblastoma multiforme], 6; Glioma Low Grade, 7; HNSC[Head and Neck squamous cell carcinoma], 8; KICH[Kidney Chromophobe], 9; KIRC[Kidney renal clear cell carcinoma], 10; KIRP[Kidney renal papillary cell carcinoma], 11; LAML[Acute Myeloid Leukemia], 12; LUAD[Lung adenocarcinoma], 13; LUSC[Lung squamous cell carcinoma], 14; OV[Ovarian serous cystadenocarcinoma ], 15; PAAD[Pancreatic adenocarcinoma], 16; PRAD[Prostate adenocarcinoma], 17; SKCM[Skin Cutaneous Melanoma], 18:STAD[Stomach adenocarcinoma], 19:THCA[Thyroid carcinoma], 20:UCEC[Uterine Corpus Endometrial Carcinoma]) |
| Top |
| * We represented just top 10 SNVs. When you move the cursor on each content, you can see more deailed mutation information on the Tooltip. Those are primary_site, primary_histology, mutation(aa), pubmedID. |
| Genomic Position | Mutation(aa) | Unique sampleID count |
| chr2:109371498 | p.P780P | 6 |
| chr2:109371681 | p.L811R | 5 |
| chr2:109371692 | p.C815R | 5 |
| chr2:109367729 | p.R1231C | 3 |
| chr2:109380686 | p.R428Q | 3 |
| chr2:109384143 | p.T2092M | 2 |
| chr2:109383270 | p.R2374S | 2 |
| chr2:109382975 | p.N2383S | 2 |
| chr2:109365442 | p.G1994S | 2 |
| chr2:109384259 | p.P2220S | 2 |
| * Copy number data were extracted from TCGA using R package TCGA-Assembler. The URLs of all public data files on TCGA DCC data server were gathered on Jan-05-2015. Function ProcessCNAData in TCGA-Assembler package was used to obtain gene-level copy number value which is calculated as the average copy number of the genomic region of a gene. |
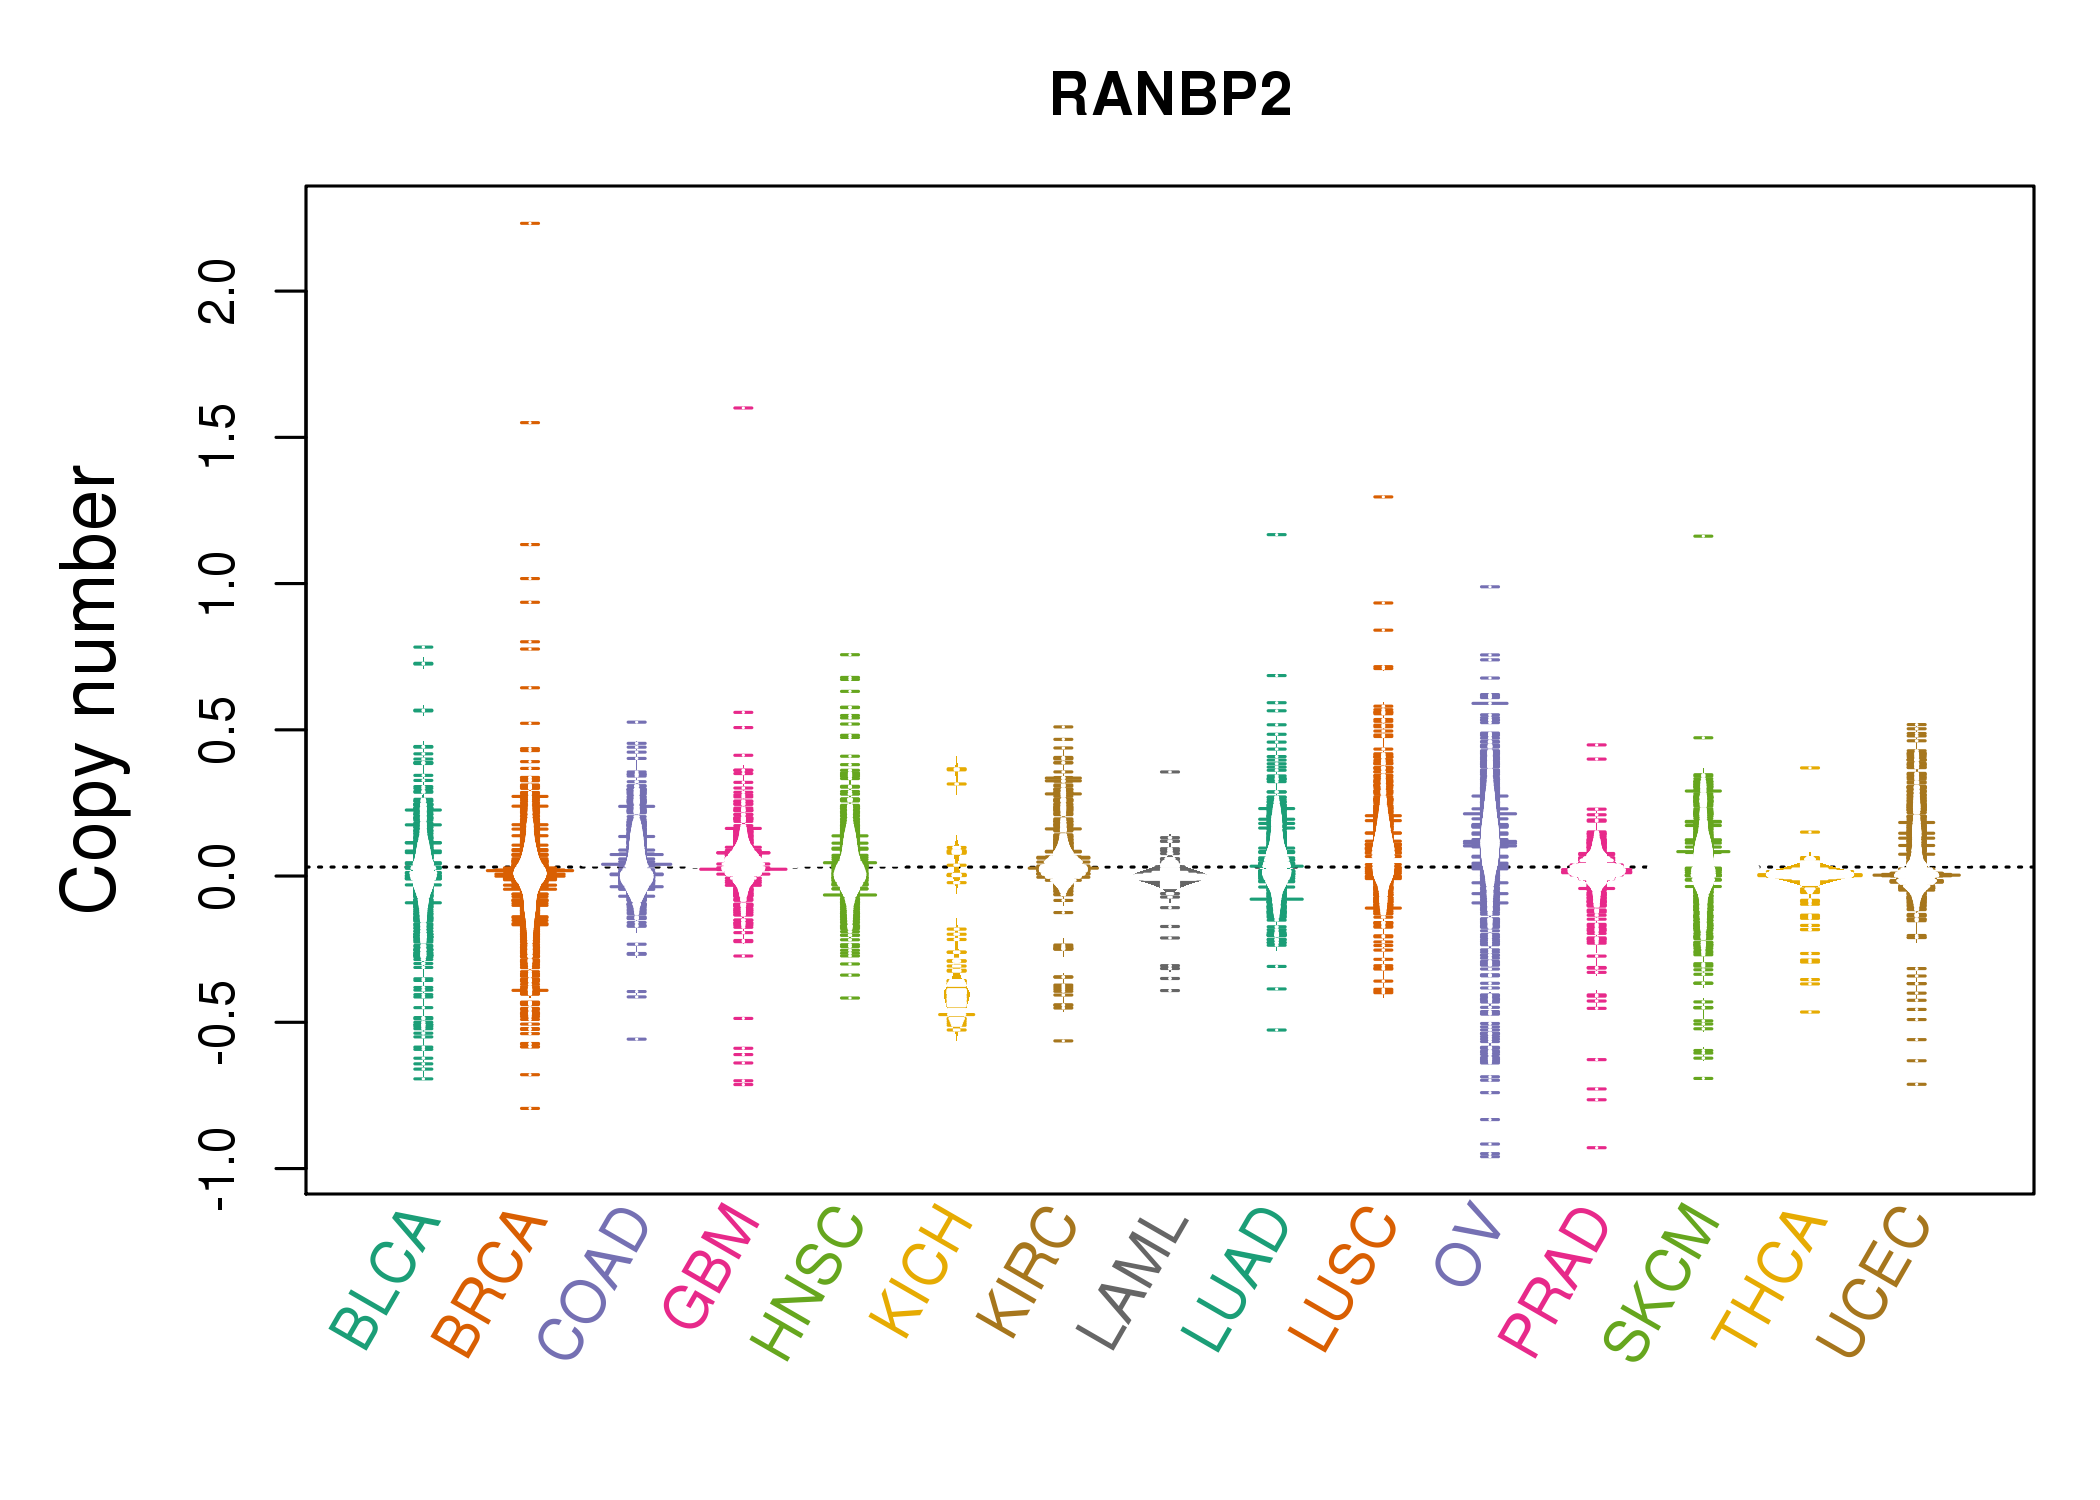 |
| cf) Tissue ID[Tissue type]: BLCA[Bladder Urothelial Carcinoma], BRCA[Breast invasive carcinoma], CESC[Cervical squamous cell carcinoma and endocervical adenocarcinoma], COAD[Colon adenocarcinoma], GBM[Glioblastoma multiforme], Glioma Low Grade, HNSC[Head and Neck squamous cell carcinoma], KICH[Kidney Chromophobe], KIRC[Kidney renal clear cell carcinoma], KIRP[Kidney renal papillary cell carcinoma], LAML[Acute Myeloid Leukemia], LUAD[Lung adenocarcinoma], LUSC[Lung squamous cell carcinoma], OV[Ovarian serous cystadenocarcinoma ], PAAD[Pancreatic adenocarcinoma], PRAD[Prostate adenocarcinoma], SKCM[Skin Cutaneous Melanoma], STAD[Stomach adenocarcinoma], THCA[Thyroid carcinoma], UCEC[Uterine Corpus Endometrial Carcinoma] |
| Top |
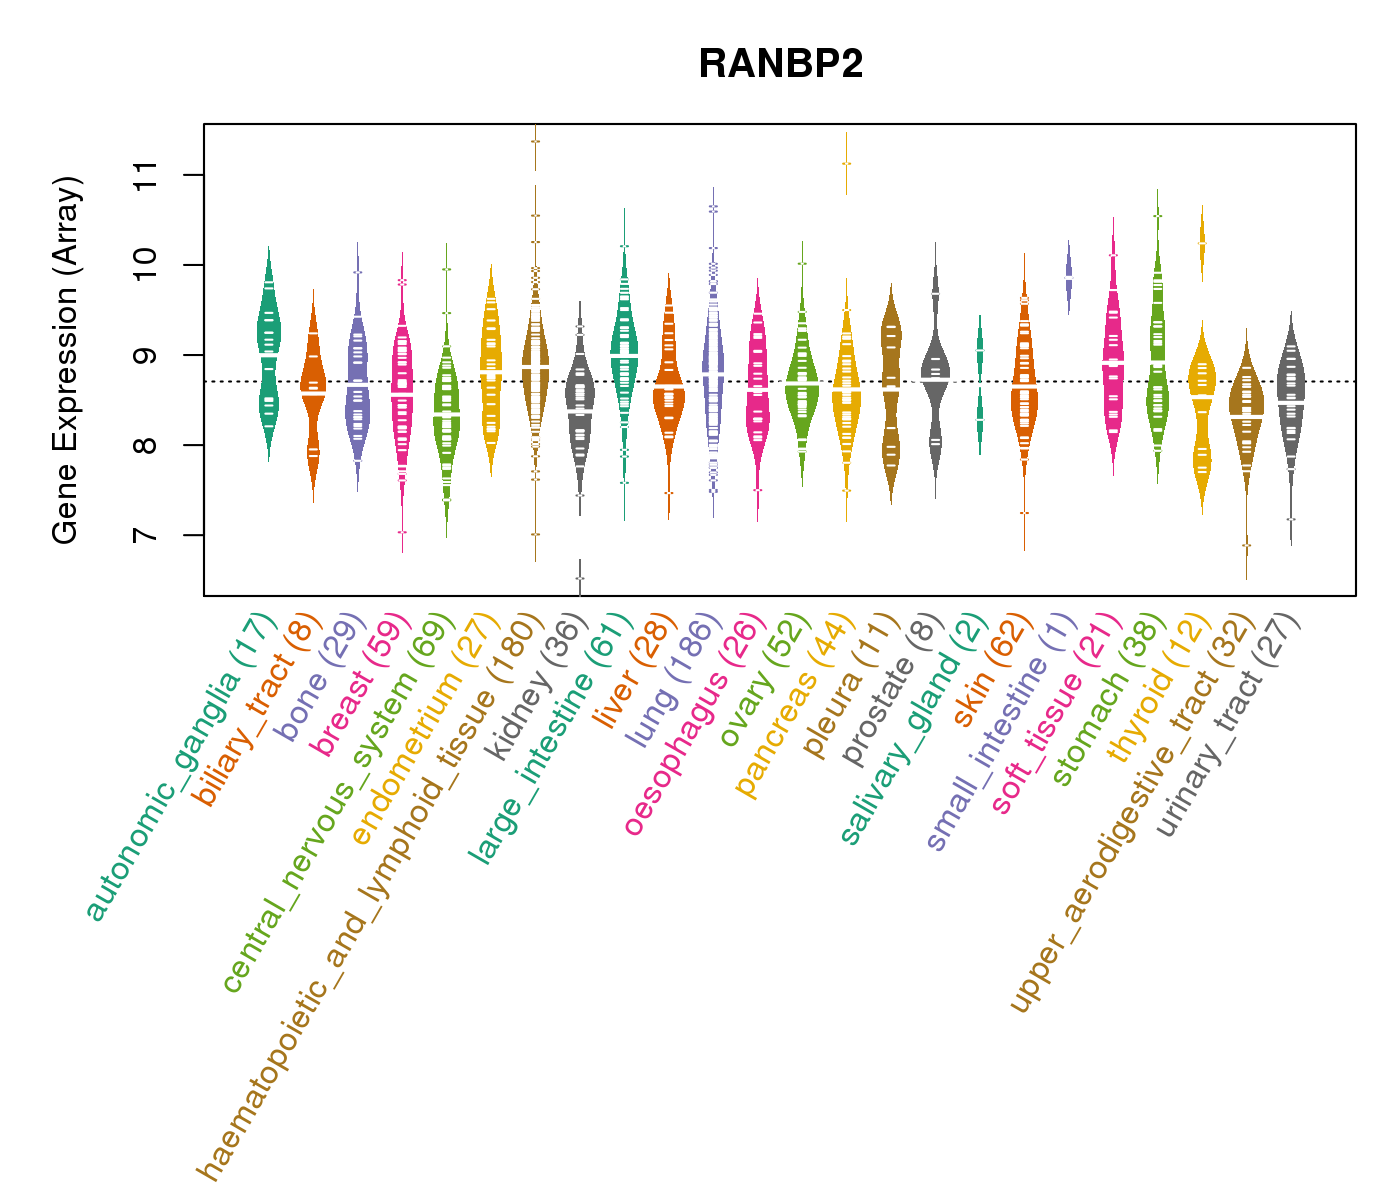
| Gene Expression for RANBP2 |
| * CCLE gene expression data were extracted from CCLE_Expression_Entrez_2012-10-18.res: Gene-centric RMA-normalized mRNA expression data. |
 |
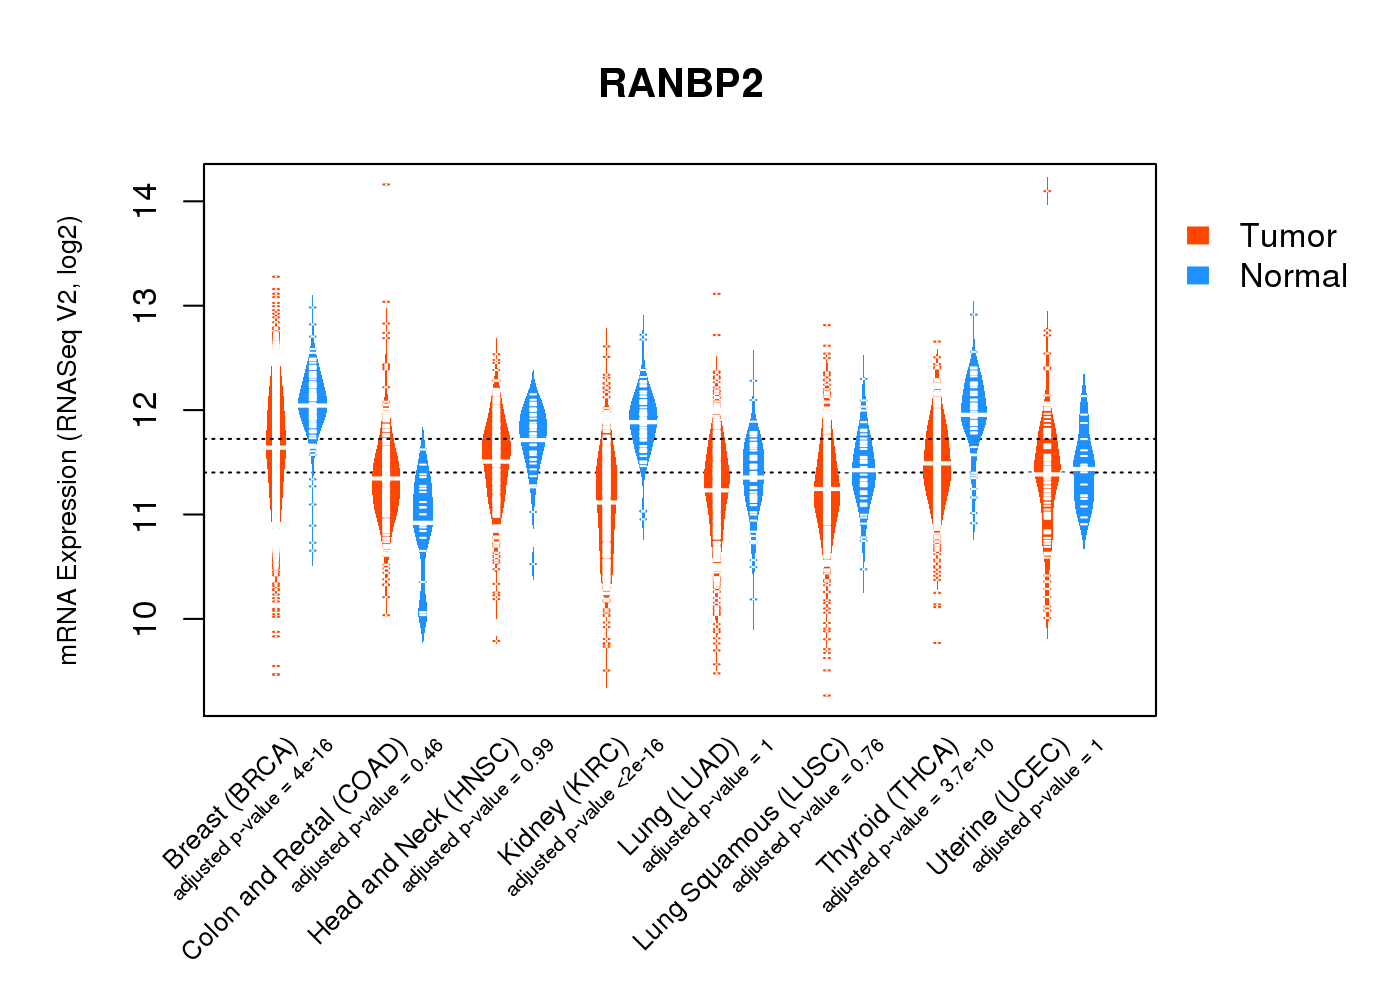
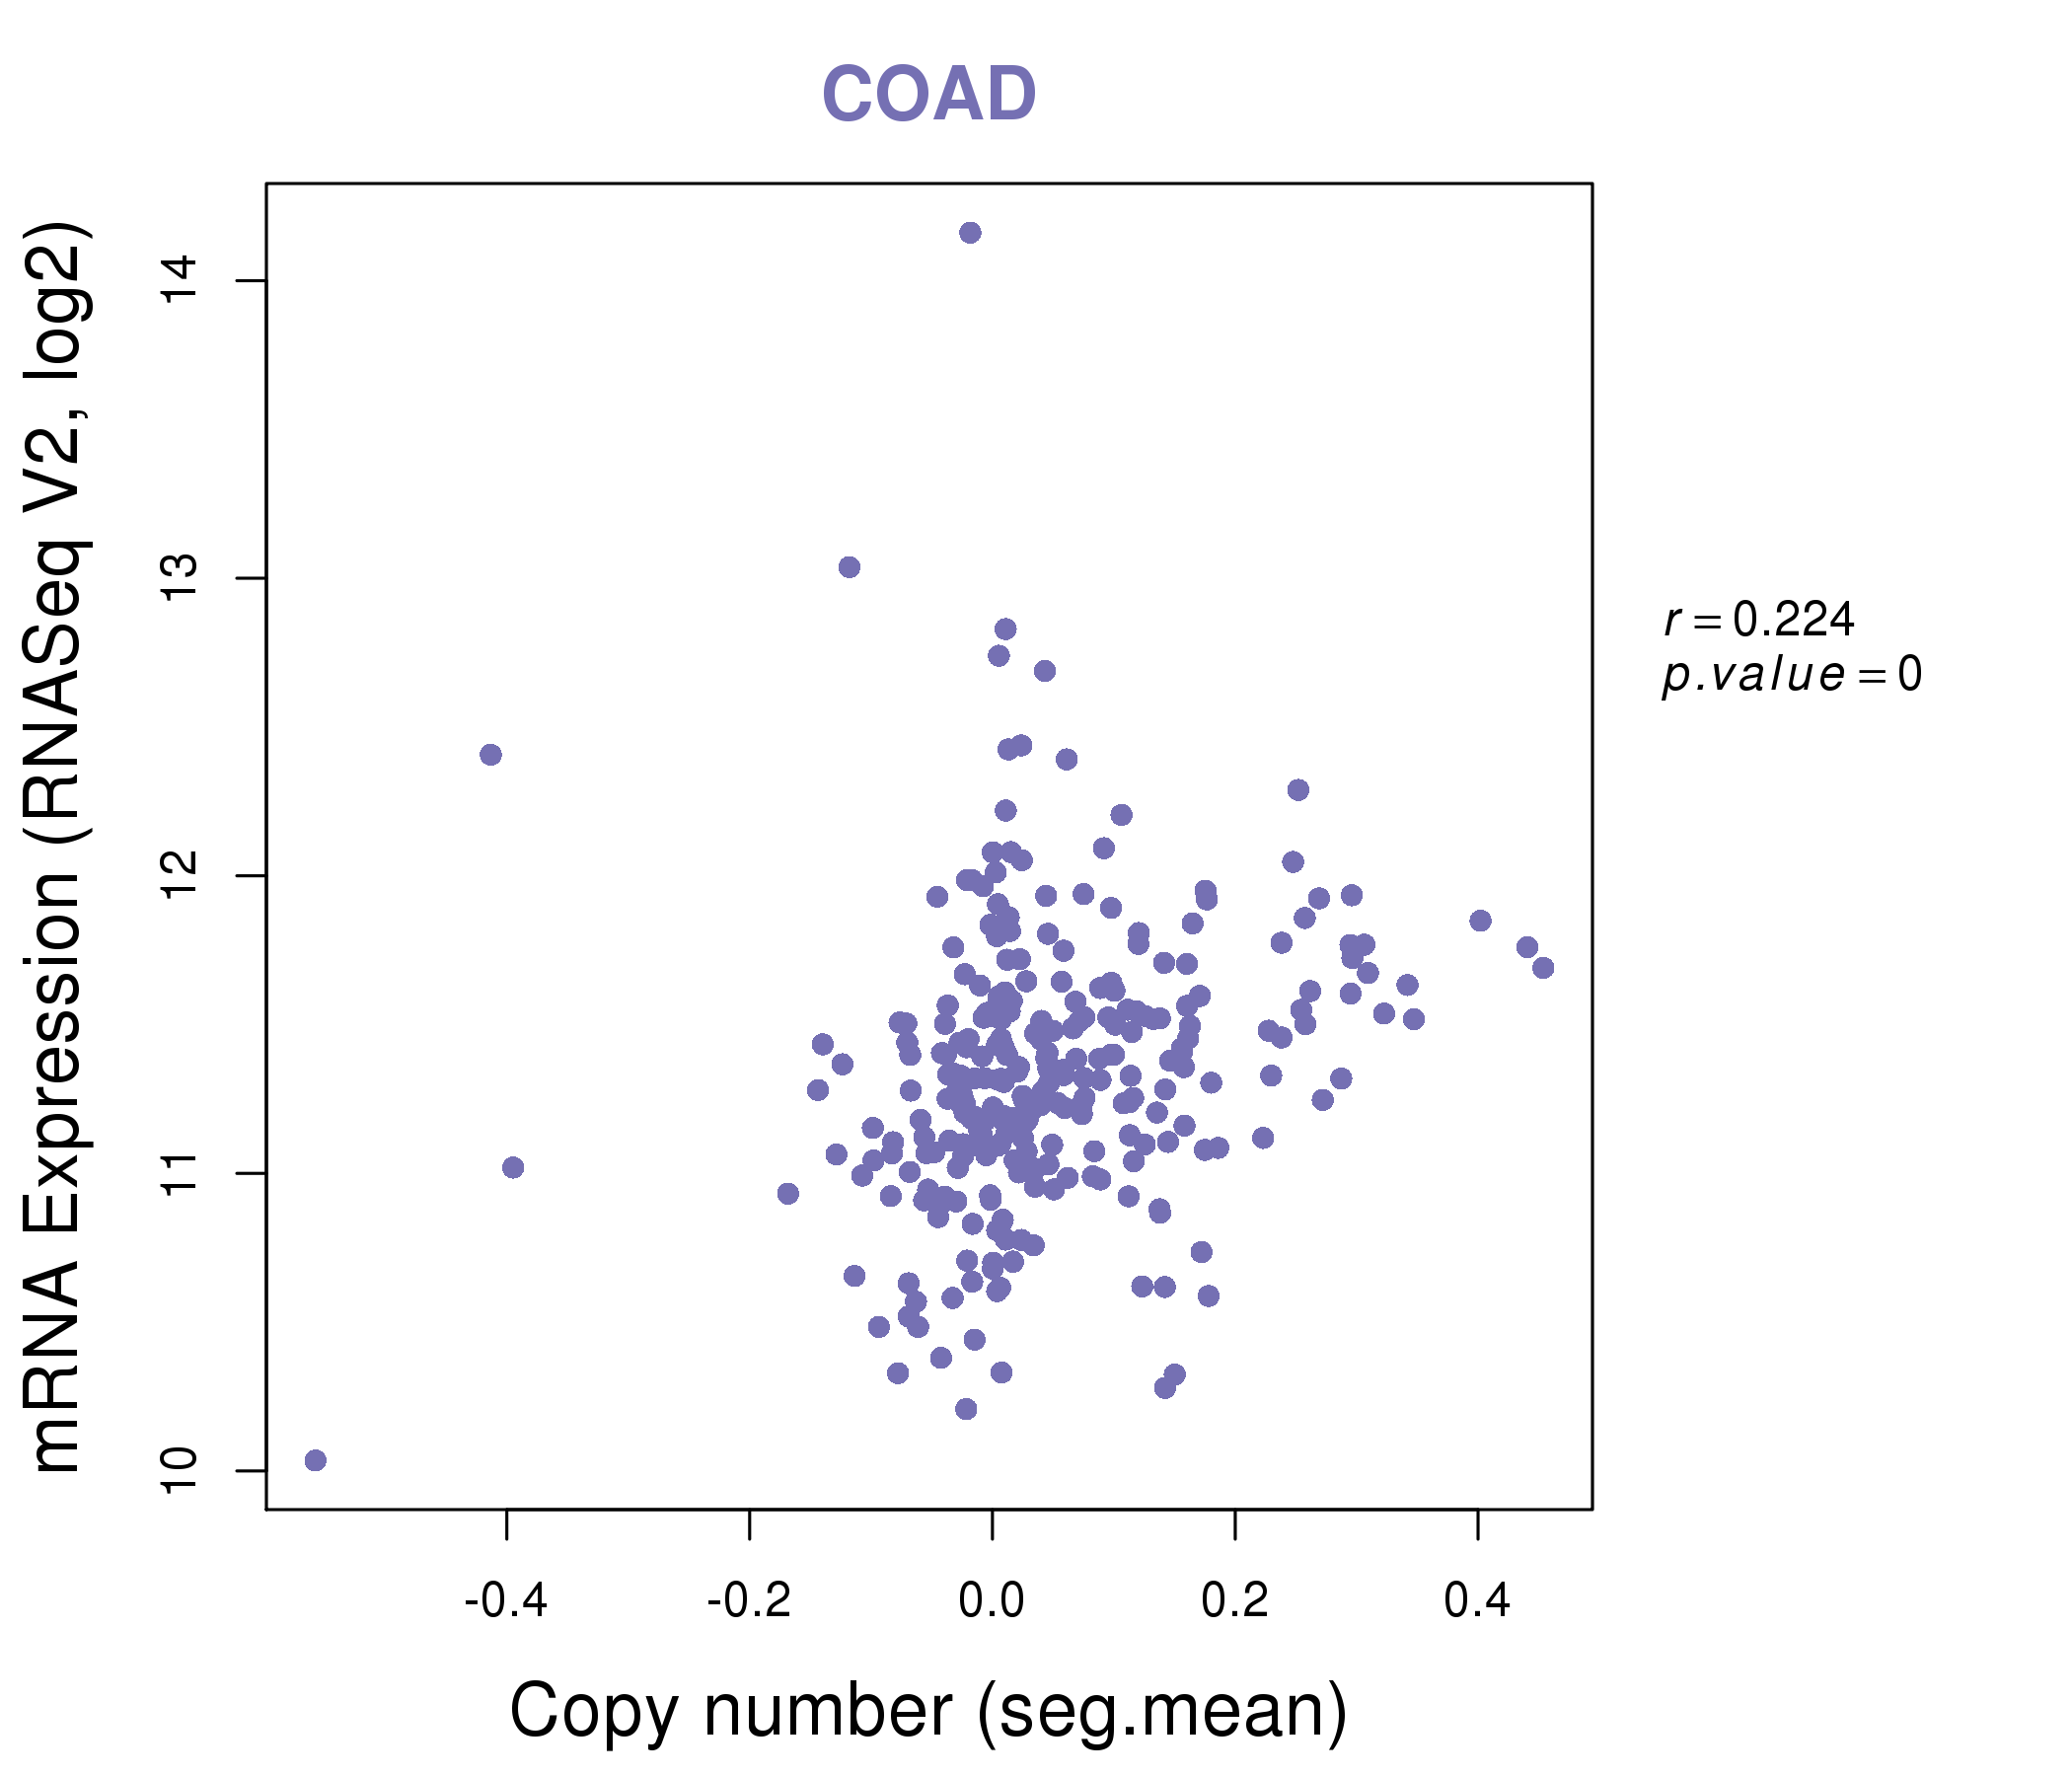
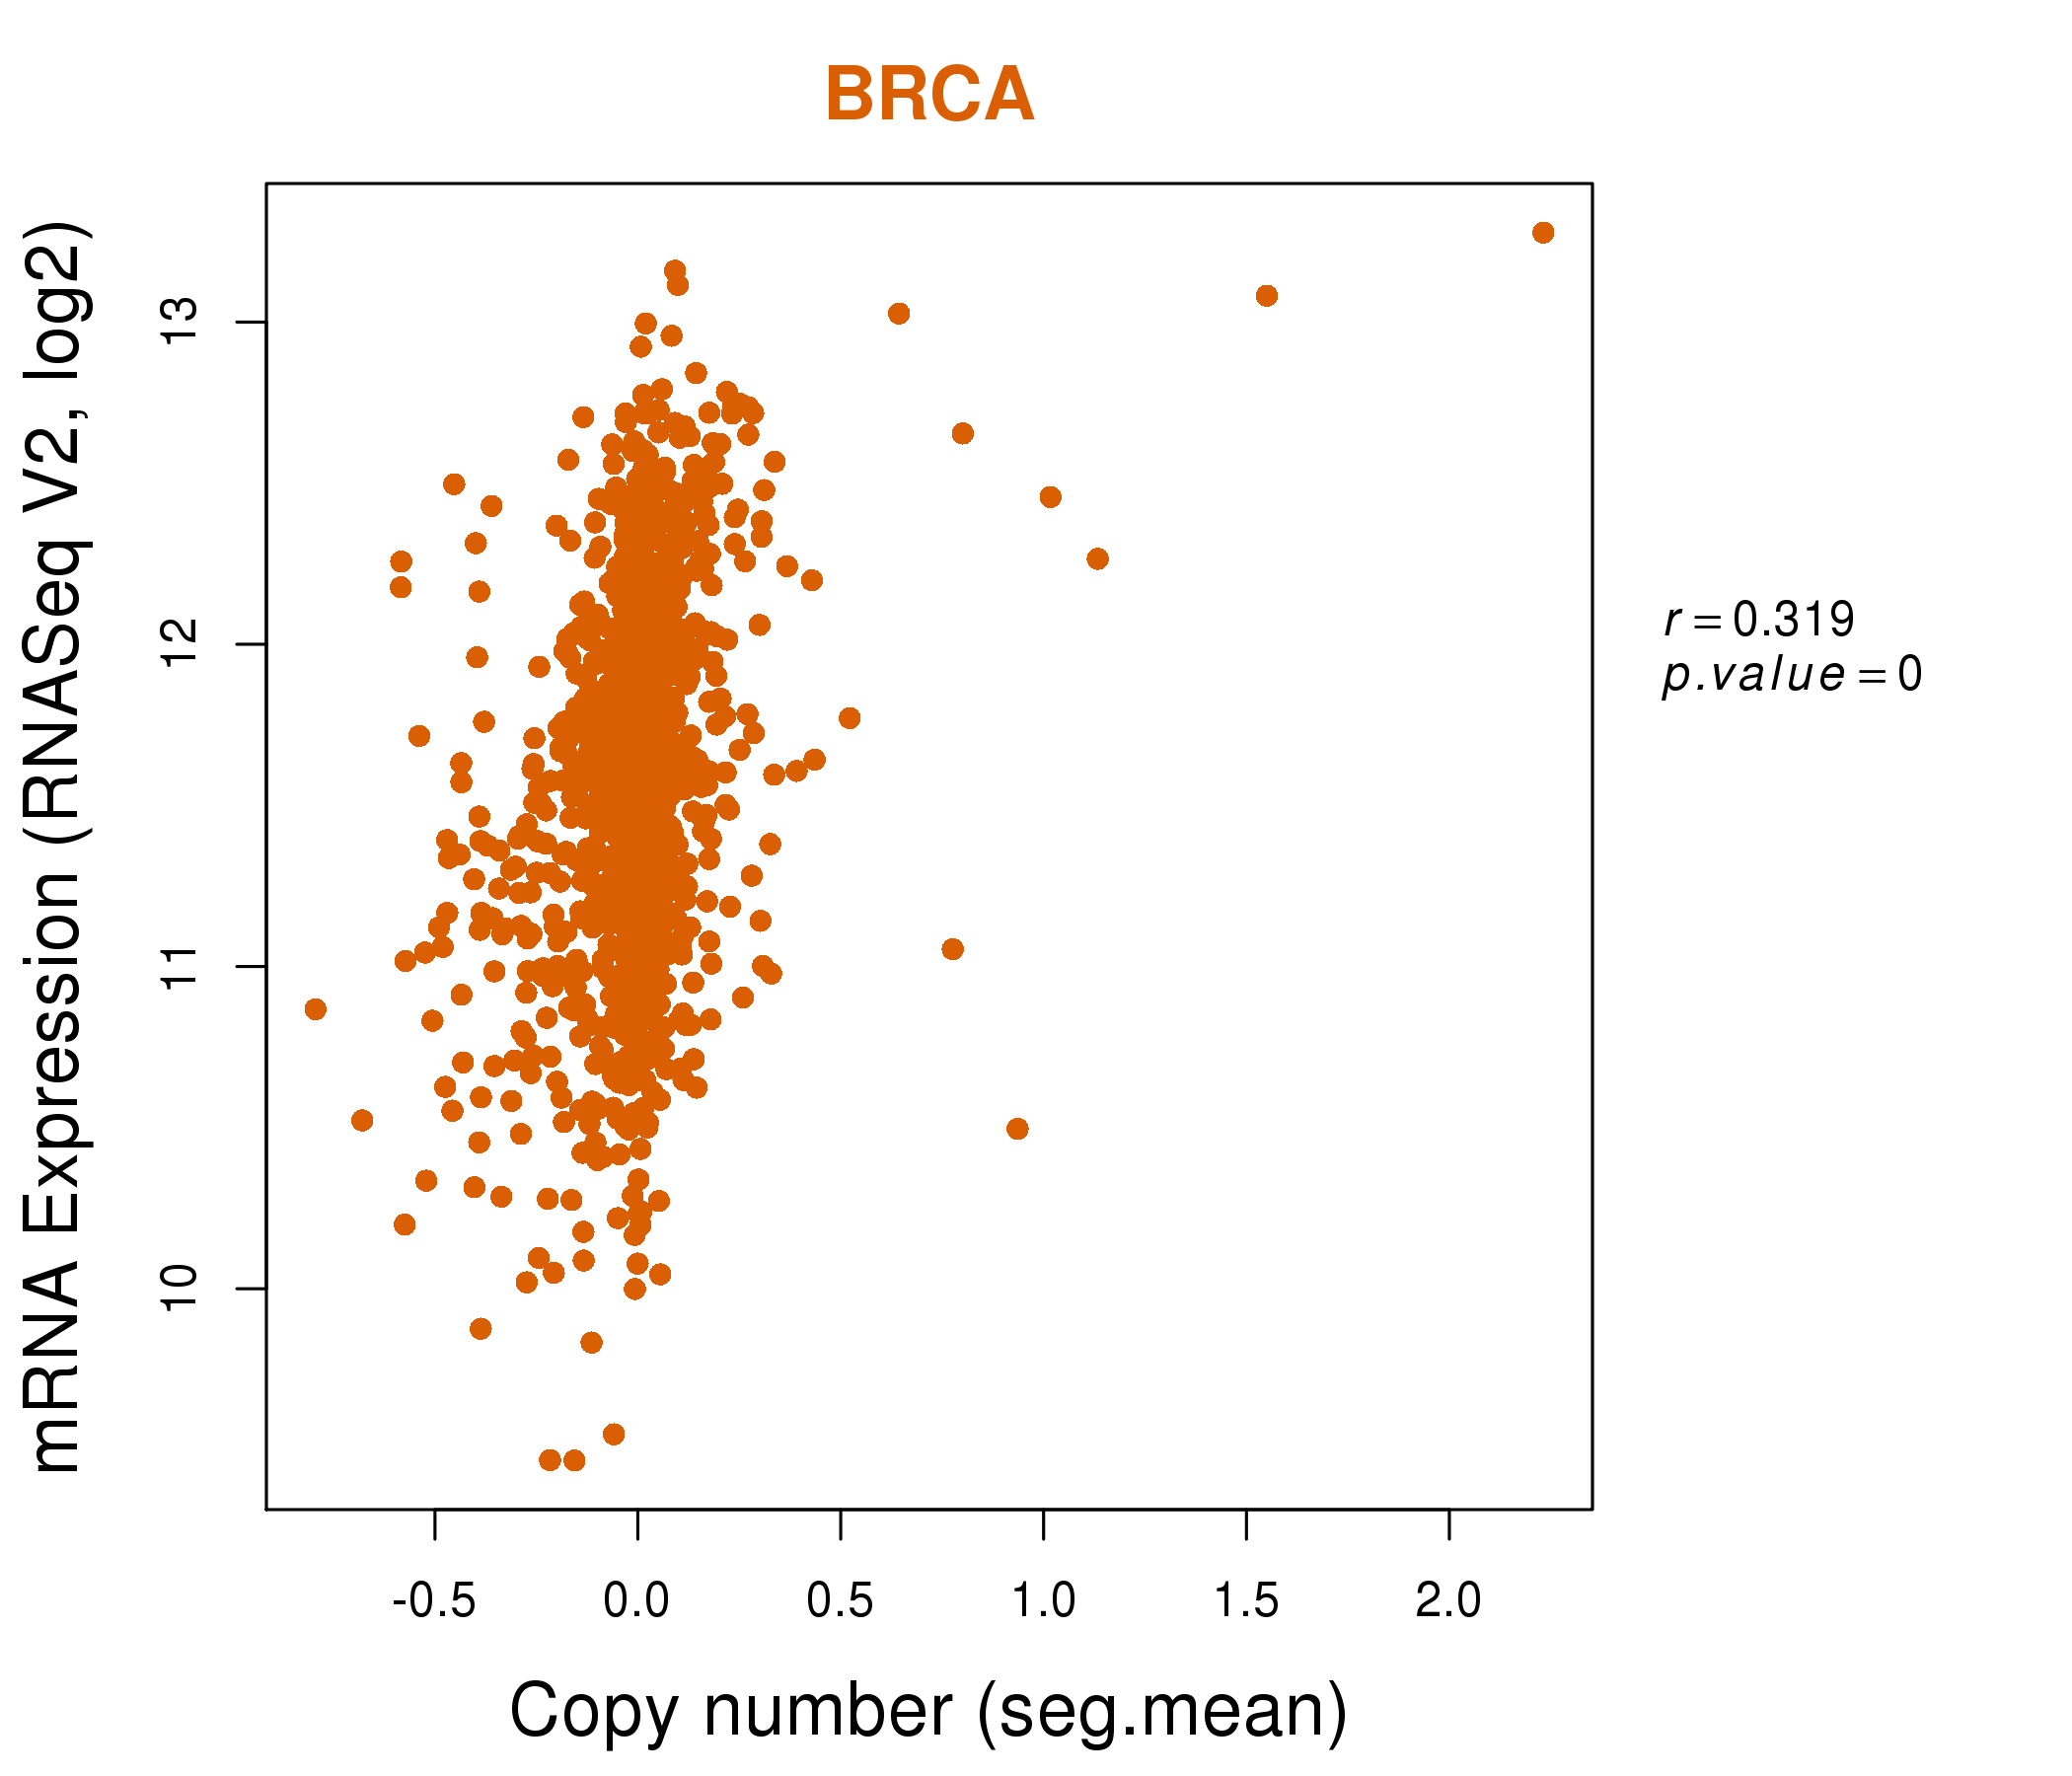
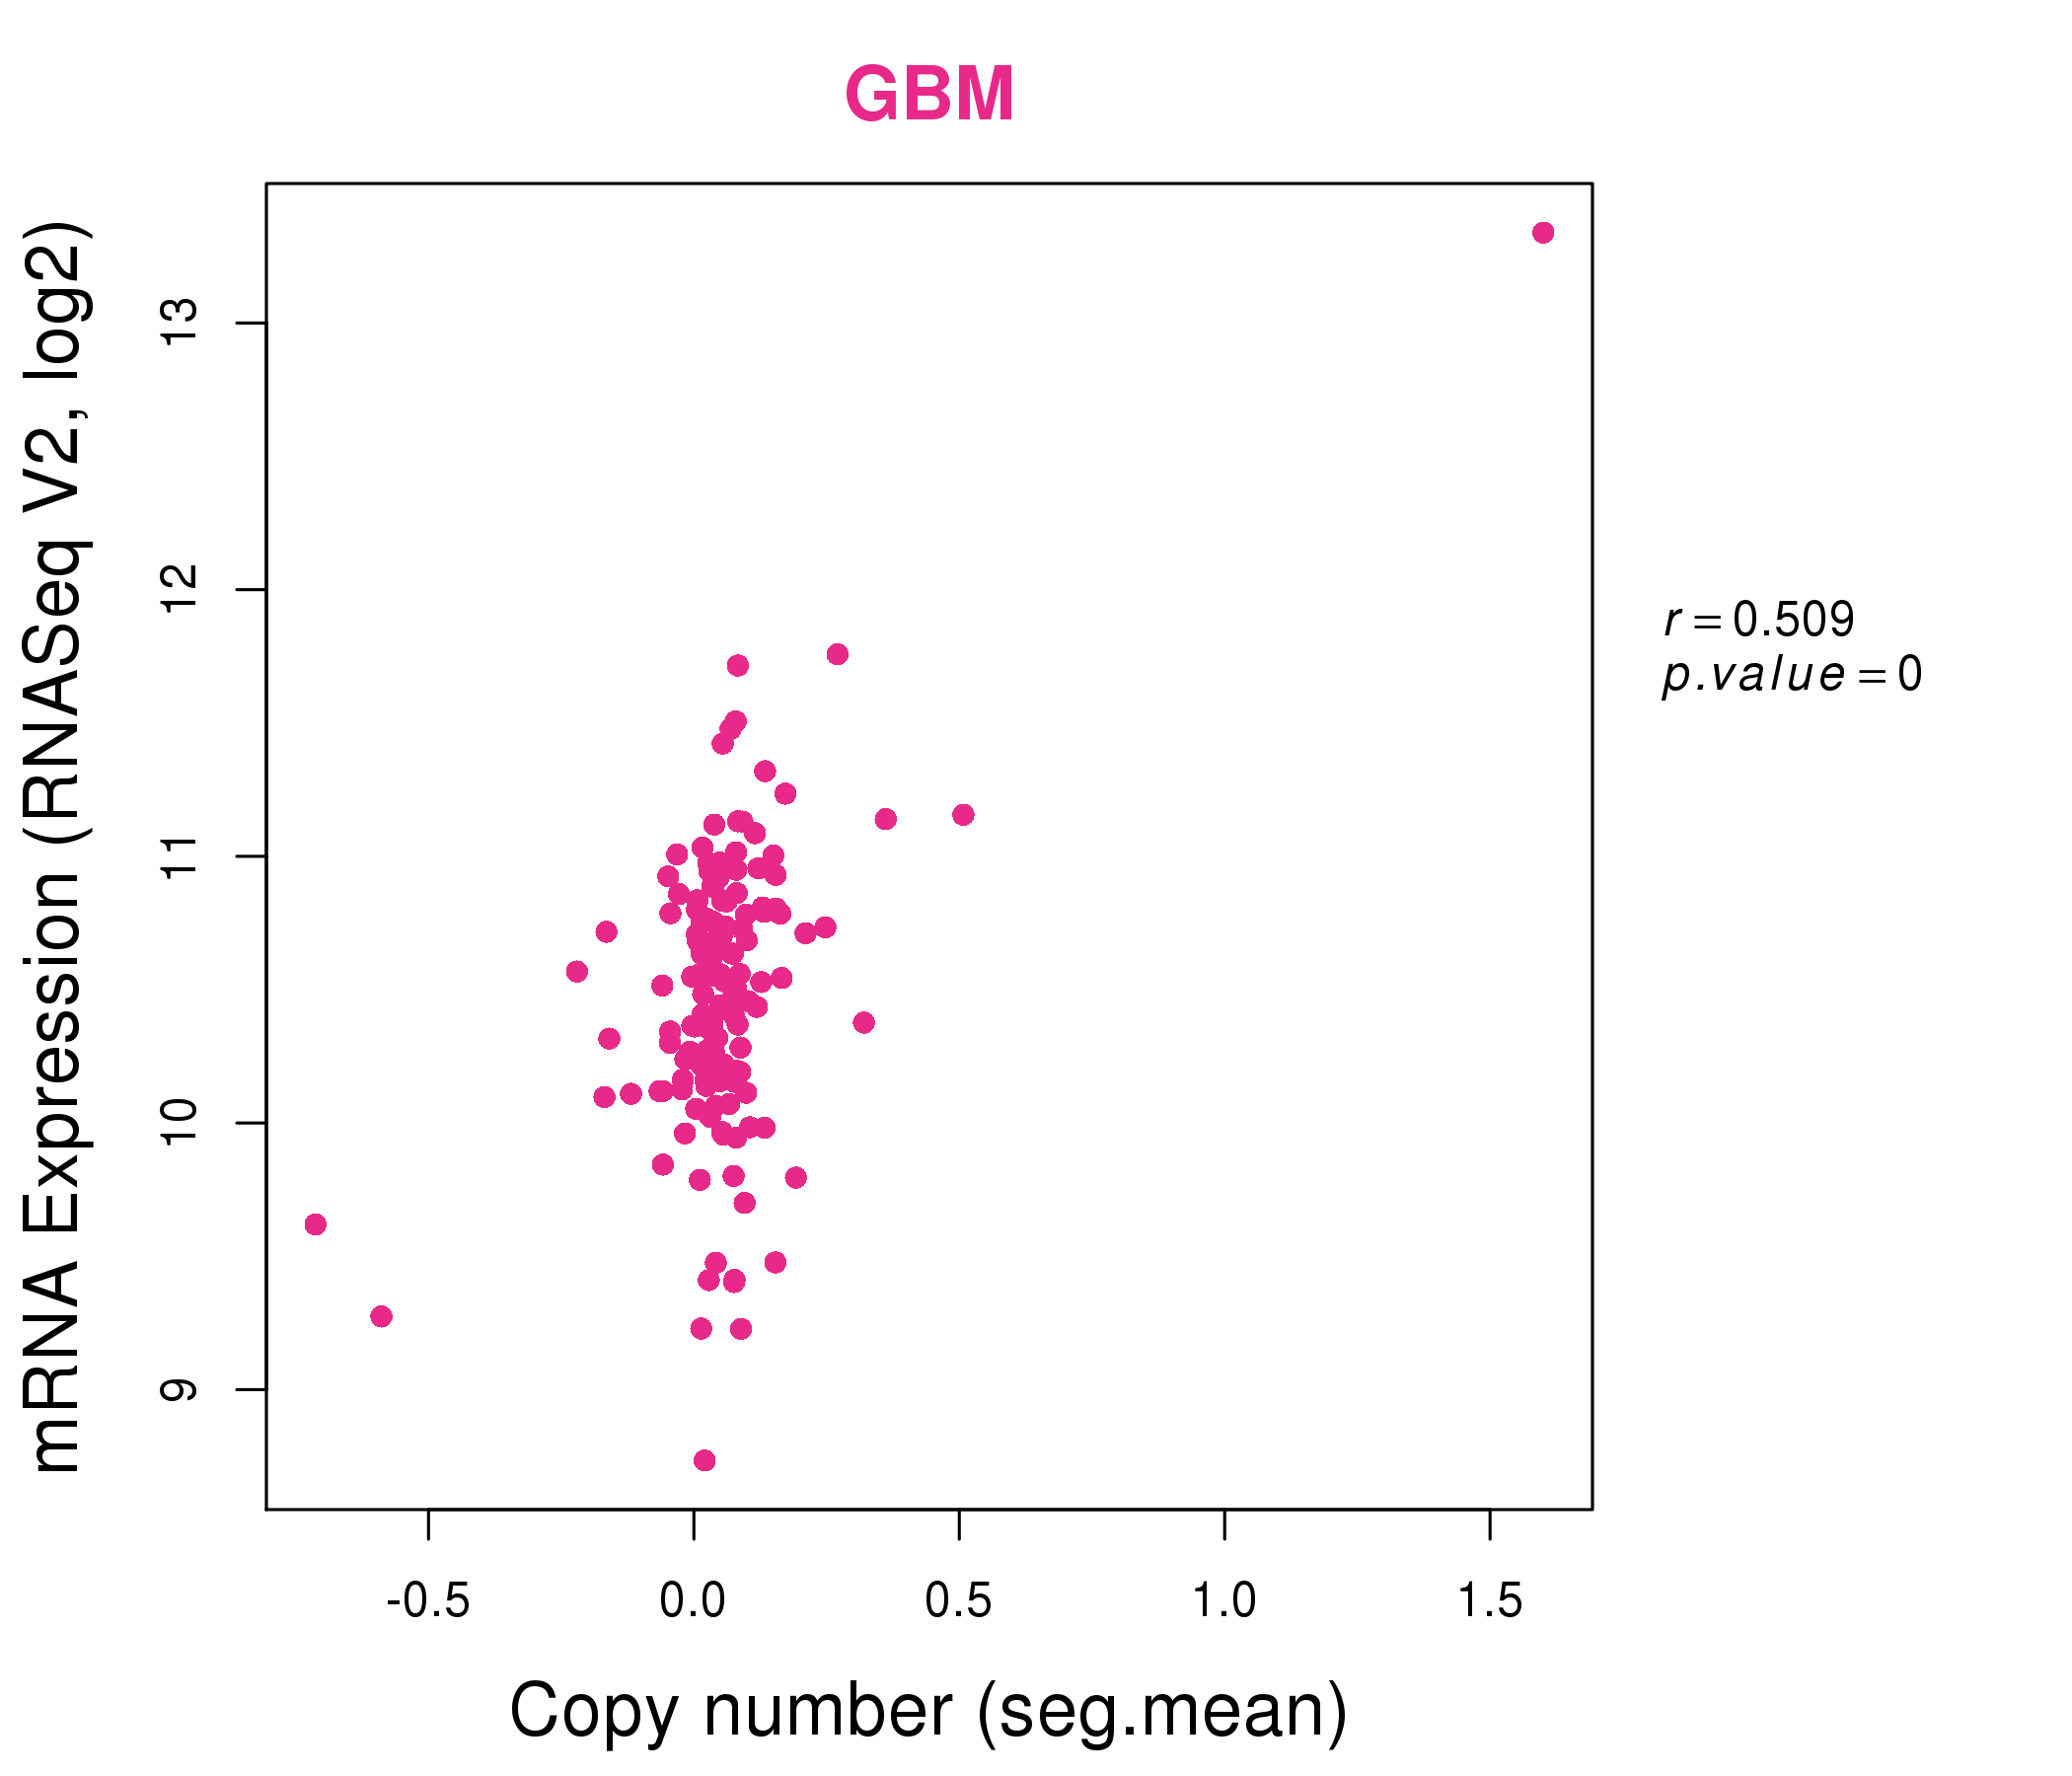
| * Normalized gene expression data of RNASeqV2 was extracted from TCGA using R package TCGA-Assembler. The URLs of all public data files on TCGA DCC data server were gathered at Jan-05-2015. Only eight cancer types have enough normal control samples for differential expression analysis. (t test, adjusted p<0.05 (using Benjamini-Hochberg FDR)) |
 |
| Top |
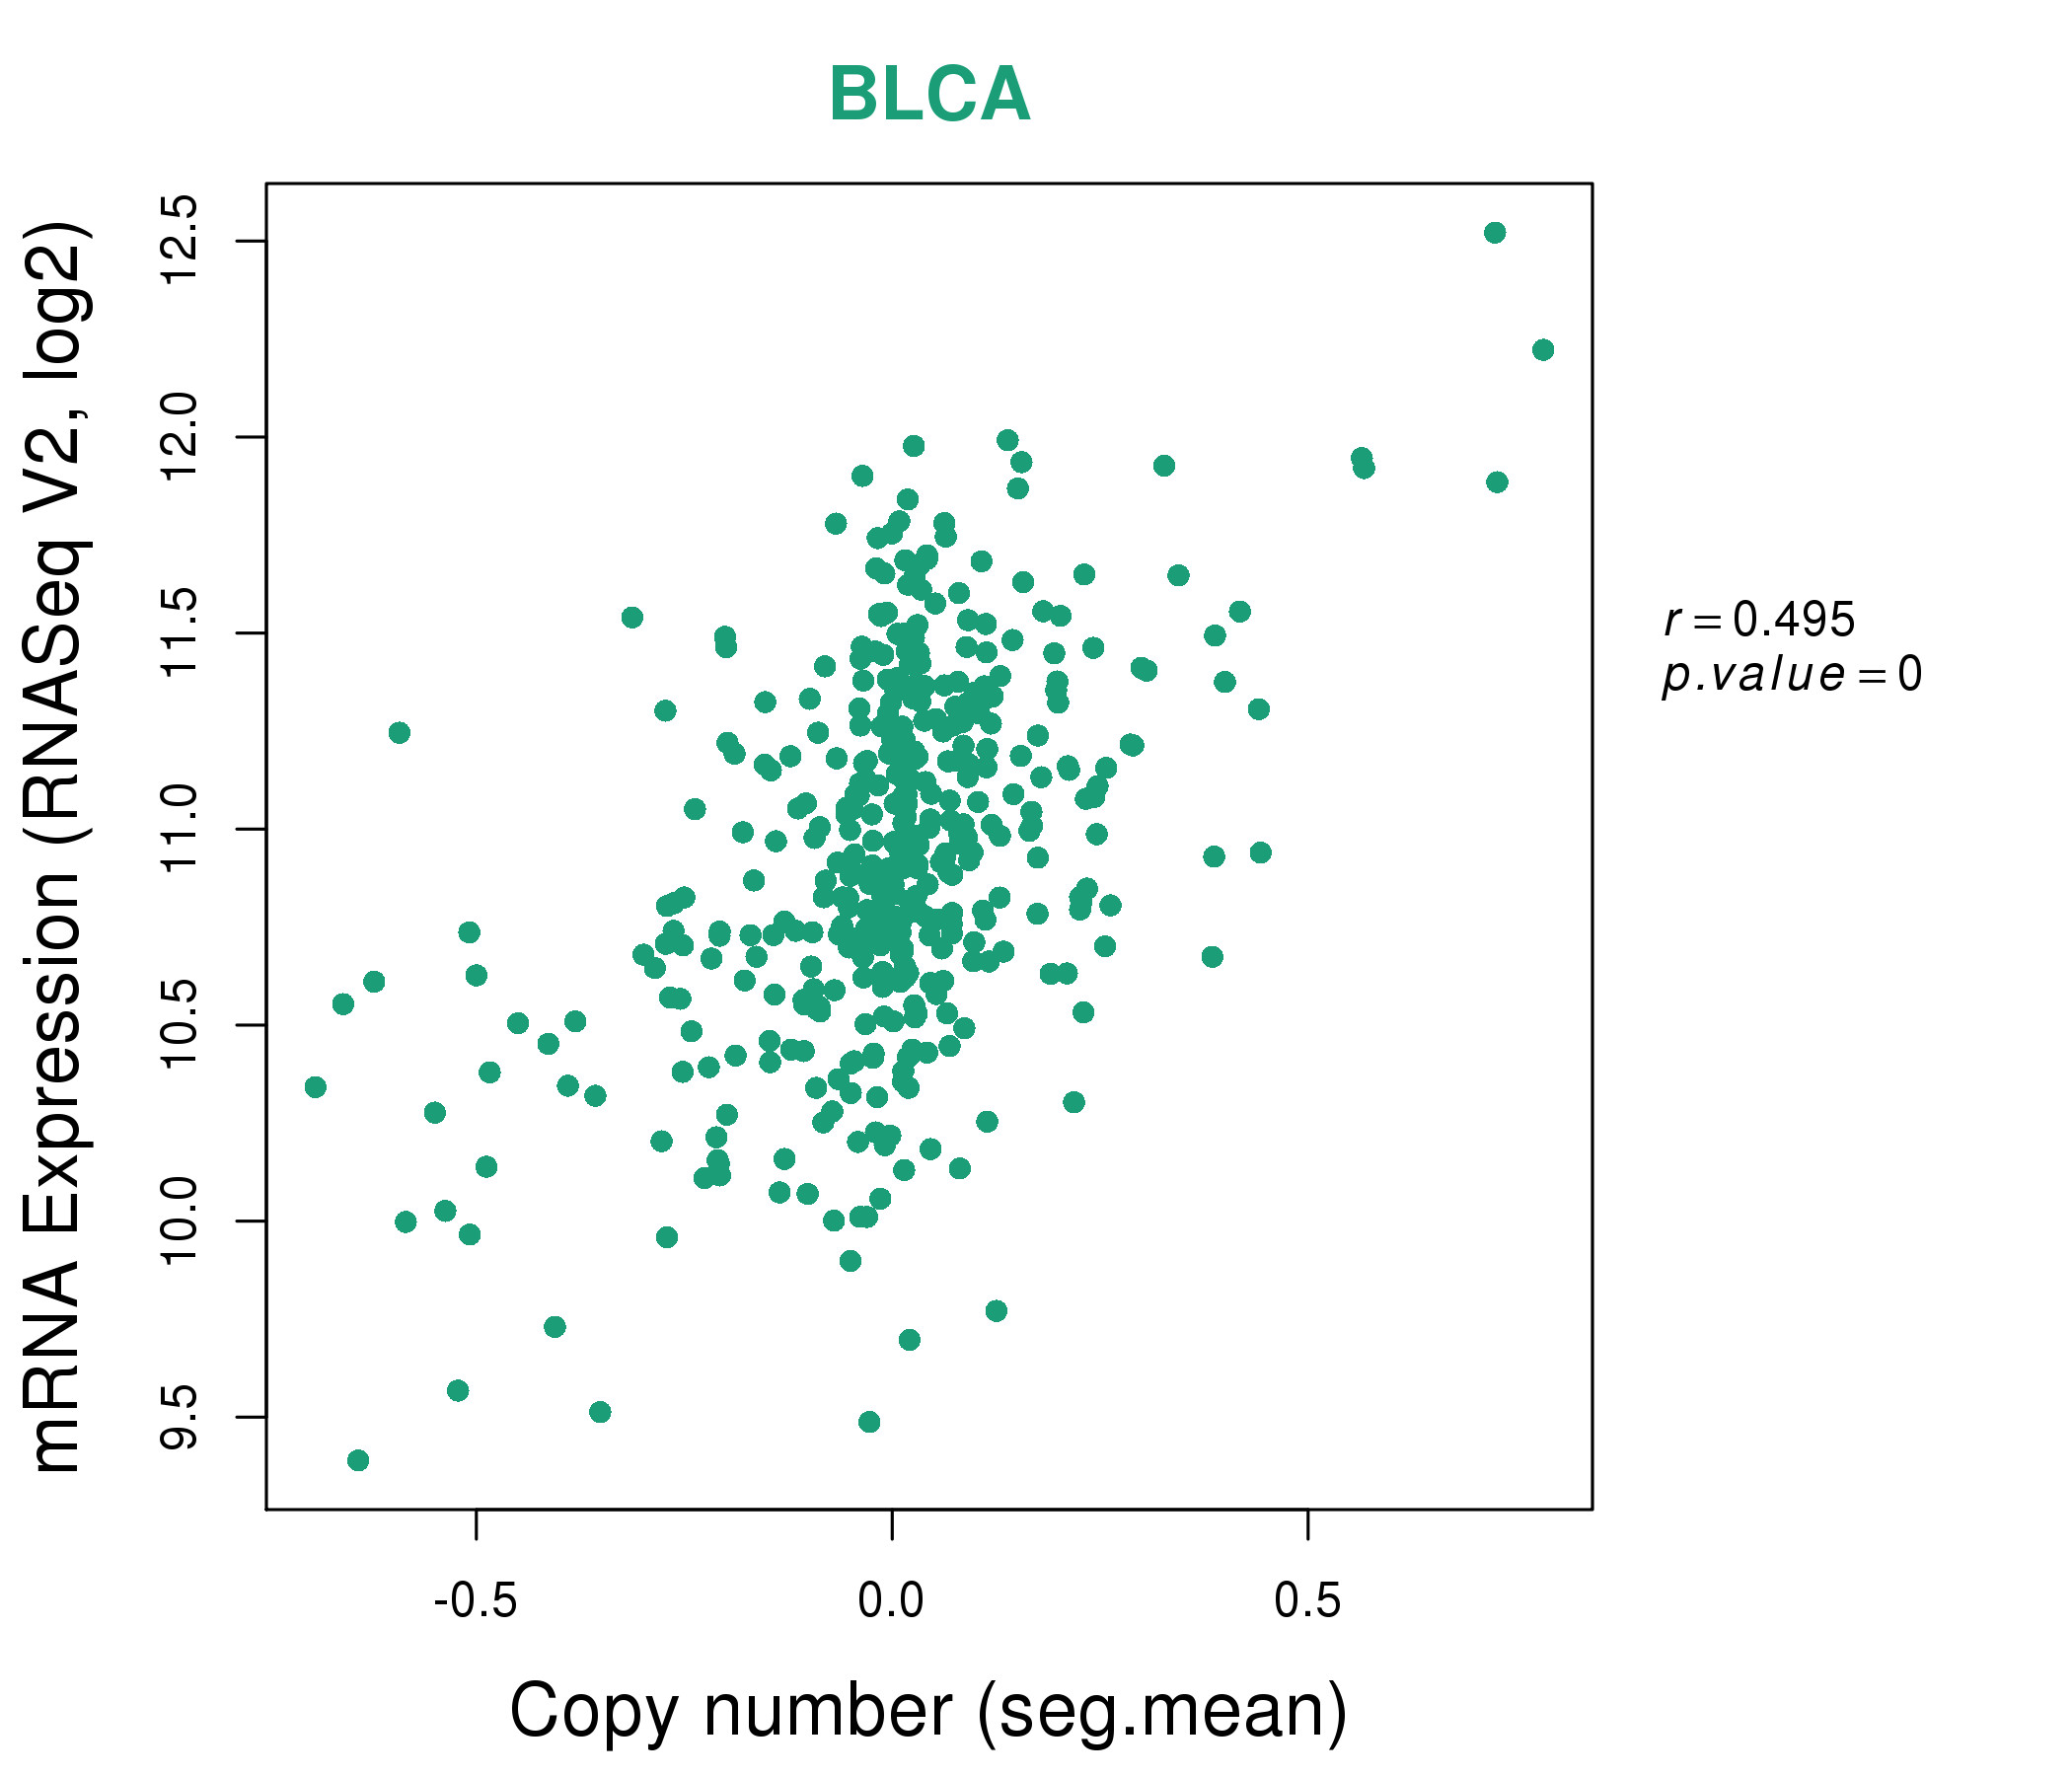
| * This plots show the correlation between CNV and gene expression. |
: Open all plots for all cancer types
 |
|
 |
|
| Top |
| Gene-Gene Network Information |
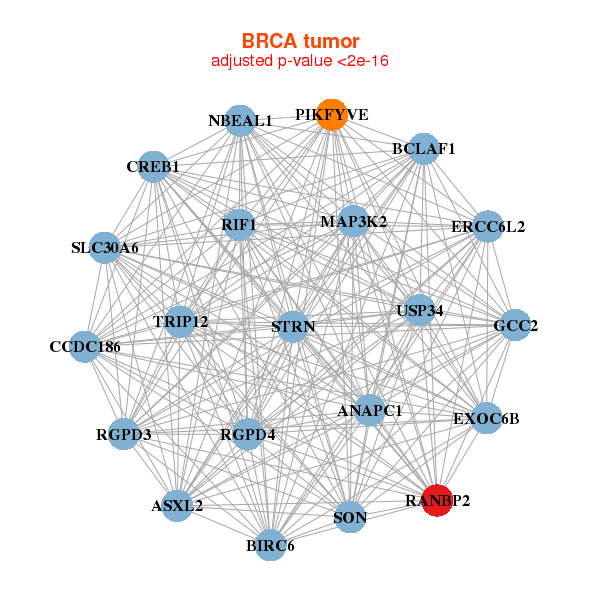
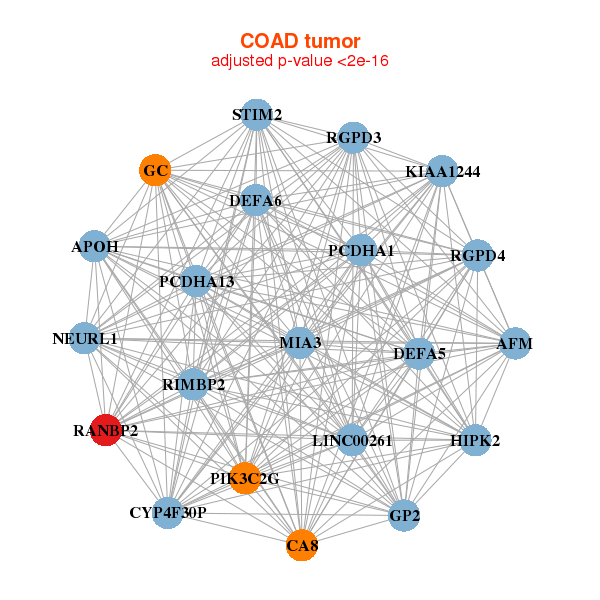
| * Co-Expression network figures were drawn using R package igraph. Only the top 20 genes with the highest correlations were shown. Red circle: input gene, orange circle: cell metabolism gene, sky circle: other gene |
: Open all plots for all cancer types
 |
|
| ANAPC1,ASXL2,BCLAF1,BIRC6,CCDC186,ERCC6L2,CREB1, EXOC6B,GCC2,MAP3K2,NBEAL1,PIKFYVE,RANBP2,RGPD3, RGPD4,RIF1,SLC30A6,SON,STRN,TRIP12,USP34 | AFF4,ATG2B,ATRX,BIRC6,DENND4A,KIAA0586,ICE1, KIAA2026,LATS1,NUP153,NUP155,PIK3C3,RAB3GAP2,RANBP2, RGPD3,RIF1,LTN1,SBNO1,SMCHD1,SON,ZFX |
 |
|
| AFM,APOH,LINC00261,CYP4F30P,CA8,DEFA5,DEFA6, GC,GP2,HIPK2,KIAA1244,MIA3,NEURL1,PCDHA13, PCDHA1,PIK3C2G,RANBP2,RGPD3,RGPD4,RIMBP2,STIM2 | ALMS1,BPTF,CDK12,CHD4,DDX42,DICER1,DYNC1H1, EIF3A,EP400,GIGYF2,HECTD1,HUWE1,MDN1,MED1, PBRM1,RANBP2,RIF1,SON,TPR,USP34,YLPM1 |

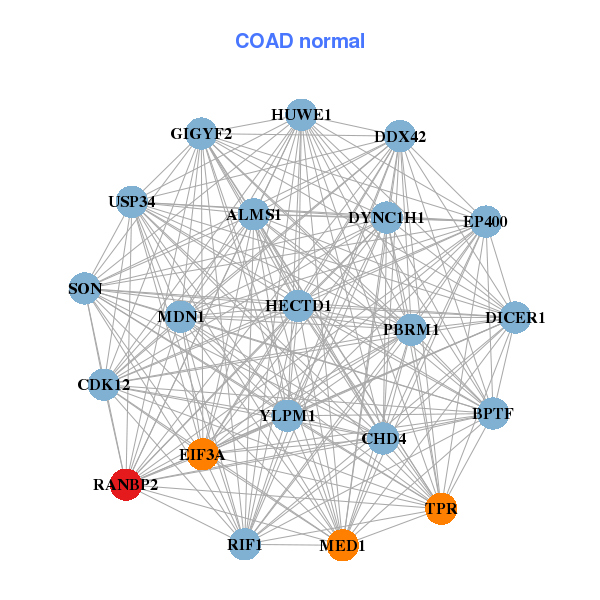
| * Co-Expression network figures were drawn using R package igraph. Only the top 20 genes with the highest correlations were shown. Red circle: input gene, orange circle: cell metabolism gene, sky circle: other gene |
: Open all plots for all cancer types
| Top |
: Open all interacting genes' information including KEGG pathway for all interacting genes from DAVID
| Top |
| Pharmacological Information for RANBP2 |
| There's no related Drug. |
| Top |
| Cross referenced IDs for RANBP2 |
| * We obtained these cross-references from Uniprot database. It covers 150 different DBs, 18 categories. http://www.uniprot.org/help/cross_references_section |
: Open all cross reference information
|
Copyright © 2016-Present - The Univsersity of Texas Health Science Center at Houston @ |