|
||||||||||||||||||||||||||||||||||||||||||||||||||||||||||||||||||||||||||||||||||||||||||||||||||||||||||||||||||||||||||||||||||||||||||||||||||||||||||||||||||||||||||||||||||||||||||||||||||||||||||||||||||||||||||||||||||||||||||||||||||||||||||||||||||||||||||||||||||||||||||||||||||||||||||||||||||||||||||
| |
| Phenotypic Information (metabolism pathway, cancer, disease, phenome) |
| |
| |
| Gene-Gene Network Information: Co-Expression Network, Interacting Genes & KEGG |
| |
|


| Gene Summary for RAP1A |
| Top |
| Phenotypic Information for RAP1A(metabolism pathway, cancer, disease, phenome) |
| Cancer | CGAP: RAP1A |
| Familial Cancer Database: RAP1A | |
| * This gene is included in those cancer gene databases. |
|
|
|
|
|
| . | ||||||||||||||||||||||||||||||||||||||||||||||||||||||||||||||||||||||||||||||||||||||||||||||||||||||||||||||||||||||||||||||||||||||||||||||||||||||||||||||||||||||||||||||||||||||||||||||||||||||||||||||||||||||||||||||||||||||||||||||||||||||||||||||||||||||||||||||||||||||||||||||||||||||||||||||||||||
Oncogene 1 | Significant driver gene in | |||||||||||||||||||||||||||||||||||||||||||||||||||||||||||||||||||||||||||||||||||||||||||||||||||||||||||||||||||||||||||||||||||||||||||||||||||||||||||||||||||||||||||||||||||||||||||||||||||||||||||||||||||||||||||||||||||||||||||||||||||||||||||||||||||||||||||||||||||||||||||||||||||||||||||||||||||||||||
| cf) number; DB name 1 Oncogene; http://nar.oxfordjournals.org/content/35/suppl_1/D721.long, 2 Tumor Suppressor gene; https://bioinfo.uth.edu/TSGene/, 3 Cancer Gene Census; http://www.nature.com/nrc/journal/v4/n3/abs/nrc1299.html, 4 CancerGenes; http://nar.oxfordjournals.org/content/35/suppl_1/D721.long, 5 Network of Cancer Gene; http://ncg.kcl.ac.uk/index.php, 1Therapeutic Vulnerabilities in Cancer; http://cbio.mskcc.org/cancergenomics/statius/ |
| REACTOME_INTEGRATION_OF_ENERGY_METABOLISM | |
| OMIM | 179520; gene. |
| Orphanet | |
| Disease | KEGG Disease: RAP1A |
| MedGen: RAP1A (Human Medical Genetics with Condition) | |
| ClinVar: RAP1A | |
| Phenotype | MGI: RAP1A (International Mouse Phenotyping Consortium) |
| PhenomicDB: RAP1A | |
| Mutations for RAP1A |
| * Under tables are showing count per each tissue to give us broad intuition about tissue specific mutation patterns.You can go to the detailed page for each mutation database's web site. |
| There's no structural variation information in COSMIC data for this gene. |
| * From mRNA Sanger sequences, Chitars2.0 arranged chimeric transcripts. This table shows RAP1A related fusion information. |
| ID | Head Gene | Tail Gene | Accession | Gene_a | qStart_a | qEnd_a | Chromosome_a | tStart_a | tEnd_a | Gene_a | qStart_a | qEnd_a | Chromosome_a | tStart_a | tEnd_a |
| CR997446 | RAP1A | 1 | 72 | 1 | 112162464 | 112162535 | EIF4A3 | 71 | 607 | 17 | 78113865 | 78120850 | |
| AA525220 | RAP1A | 40 | 124 | 1 | 112255650 | 112255734 | RAP1A | 112 | 193 | 1 | 112255573 | 112255654 | |
| AI207431 | TRAM1 | 1 | 216 | 8 | 71516081 | 71516296 | RAP1A | 209 | 673 | 1 | 112255277 | 112255741 | |
| AA525882 | RAP1A | 8 | 92 | 1 | 112255650 | 112255734 | RAP1A | 80 | 161 | 1 | 112255573 | 112255654 | |
| BF948052 | PCDH7 | 9 | 264 | 4 | 31144315 | 31144576 | RAP1A | 255 | 596 | 1 | 112237972 | 112247049 | |
| BF329177 | RAP1A | 10 | 128 | 1 | 112203562 | 112203680 | SEL1L | 114 | 360 | 14 | 81964757 | 81969115 | |
| BP418289 | RAP1A | 1 | 28 | 1 | 112196355 | 112196382 | RAP1A | 22 | 178 | 1 | 112196374 | 112196530 | |
| AK098133 | RAP1A | 1 | 519 | 1 | 112193133 | 112193650 | EIF4G1 | 518 | 2322 | 3 | 184045905 | 184052842 | |
| Top |
| Mutation type/ Tissue ID | brca | cns | cerv | endome | haematopo | kidn | Lintest | liver | lung | ns | ovary | pancre | prost | skin | stoma | thyro | urina | |||
| Total # sample | 1 | 1 | ||||||||||||||||||
| GAIN (# sample) | 1 | |||||||||||||||||||
| LOSS (# sample) | 1 |
| cf) Tissue ID; Tissue type (1; Breast, 2; Central_nervous_system, 3; Cervix, 4; Endometrium, 5; Haematopoietic_and_lymphoid_tissue, 6; Kidney, 7; Large_intestine, 8; Liver, 9; Lung, 10; NS, 11; Ovary, 12; Pancreas, 13; Prostate, 14; Skin, 15; Stomach, 16; Thyroid, 17; Urinary_tract) |
| Top |
|
 |
| Top |
| Stat. for Non-Synonymous SNVs (# total SNVs=16) | (# total SNVs=0) |
 | |
(# total SNVs=0) | (# total SNVs=0) |
| Top |
| * When you move the cursor on each content, you can see more deailed mutation information on the Tooltip. Those are primary_site,primary_histology,mutation(aa),pubmedID. |
| GRCh37 position | Mutation(aa) | Unique sampleID count |
| chr1:112251778-112251778 | p.Y159C | 2 |
| chr1:112246984-112246984 | p.G115D | 2 |
| chr1:112240096-112240096 | p.E54K | 2 |
| chr1:112234037-112234037 | p.L19V | 1 |
| chr1:112246021-112246021 | p.S83A | 1 |
| chr1:112234040-112234040 | p.? | 1 |
| chr1:112246033-112246033 | p.Q87K | 1 |
| chr1:112237962-112237962 | p.? | 1 |
| chr1:112246035-112246035 | p.Q87H | 1 |
| chr1:112237999-112237999 | p.Y32N | 1 |
| Top |
|
 |
| Point Mutation/ Tissue ID | 1 | 2 | 3 | 4 | 5 | 6 | 7 | 8 | 9 | 10 | 11 | 12 | 13 | 14 | 15 | 16 | 17 | 18 | 19 | 20 |
| # sample | 1 | 2 | 2 | 1 | 3 | 2 | 2 | |||||||||||||
| # mutation | 1 | 2 | 2 | 1 | 3 | 2 | 2 | |||||||||||||
| nonsynonymous SNV | 1 | 2 | 2 | 1 | 2 | 2 | 2 | |||||||||||||
| synonymous SNV | 1 |
| cf) Tissue ID; Tissue type (1; BLCA[Bladder Urothelial Carcinoma], 2; BRCA[Breast invasive carcinoma], 3; CESC[Cervical squamous cell carcinoma and endocervical adenocarcinoma], 4; COAD[Colon adenocarcinoma], 5; GBM[Glioblastoma multiforme], 6; Glioma Low Grade, 7; HNSC[Head and Neck squamous cell carcinoma], 8; KICH[Kidney Chromophobe], 9; KIRC[Kidney renal clear cell carcinoma], 10; KIRP[Kidney renal papillary cell carcinoma], 11; LAML[Acute Myeloid Leukemia], 12; LUAD[Lung adenocarcinoma], 13; LUSC[Lung squamous cell carcinoma], 14; OV[Ovarian serous cystadenocarcinoma ], 15; PAAD[Pancreatic adenocarcinoma], 16; PRAD[Prostate adenocarcinoma], 17; SKCM[Skin Cutaneous Melanoma], 18:STAD[Stomach adenocarcinoma], 19:THCA[Thyroid carcinoma], 20:UCEC[Uterine Corpus Endometrial Carcinoma]) |
| Top |
| * We represented just top 10 SNVs. When you move the cursor on each content, you can see more deailed mutation information on the Tooltip. Those are primary_site, primary_histology, mutation(aa), pubmedID. |
| Genomic Position | Mutation(aa) | Unique sampleID count |
| chr1:112246984 | p.G115D,RAP1A | 2 |
| chr1:112238006 | p.S11L,RAP1A | 1 |
| chr1:112238020 | p.P34Q,RAP1A | 1 |
| chr1:112238021 | p.S39P,RAP1A | 1 |
| chr1:112240080 | p.S39F,RAP1A | 1 |
| chr1:112240096 | p.C48C,RAP1A | 1 |
| chr1:112246033 | p.E54K,RAP1A | 1 |
| chr1:112246040 | p.Q87K,RAP1A | 1 |
| chr1:112246968 | p.T89M,RAP1A | 1 |
| chr1:112246973 | p.P110S,RAP1A | 1 |
| * Copy number data were extracted from TCGA using R package TCGA-Assembler. The URLs of all public data files on TCGA DCC data server were gathered on Jan-05-2015. Function ProcessCNAData in TCGA-Assembler package was used to obtain gene-level copy number value which is calculated as the average copy number of the genomic region of a gene. |
 |
| cf) Tissue ID[Tissue type]: BLCA[Bladder Urothelial Carcinoma], BRCA[Breast invasive carcinoma], CESC[Cervical squamous cell carcinoma and endocervical adenocarcinoma], COAD[Colon adenocarcinoma], GBM[Glioblastoma multiforme], Glioma Low Grade, HNSC[Head and Neck squamous cell carcinoma], KICH[Kidney Chromophobe], KIRC[Kidney renal clear cell carcinoma], KIRP[Kidney renal papillary cell carcinoma], LAML[Acute Myeloid Leukemia], LUAD[Lung adenocarcinoma], LUSC[Lung squamous cell carcinoma], OV[Ovarian serous cystadenocarcinoma ], PAAD[Pancreatic adenocarcinoma], PRAD[Prostate adenocarcinoma], SKCM[Skin Cutaneous Melanoma], STAD[Stomach adenocarcinoma], THCA[Thyroid carcinoma], UCEC[Uterine Corpus Endometrial Carcinoma] |
| Top |
| Gene Expression for RAP1A |
| * CCLE gene expression data were extracted from CCLE_Expression_Entrez_2012-10-18.res: Gene-centric RMA-normalized mRNA expression data. |
 |
| * Normalized gene expression data of RNASeqV2 was extracted from TCGA using R package TCGA-Assembler. The URLs of all public data files on TCGA DCC data server were gathered at Jan-05-2015. Only eight cancer types have enough normal control samples for differential expression analysis. (t test, adjusted p<0.05 (using Benjamini-Hochberg FDR)) |
 |
| Top |
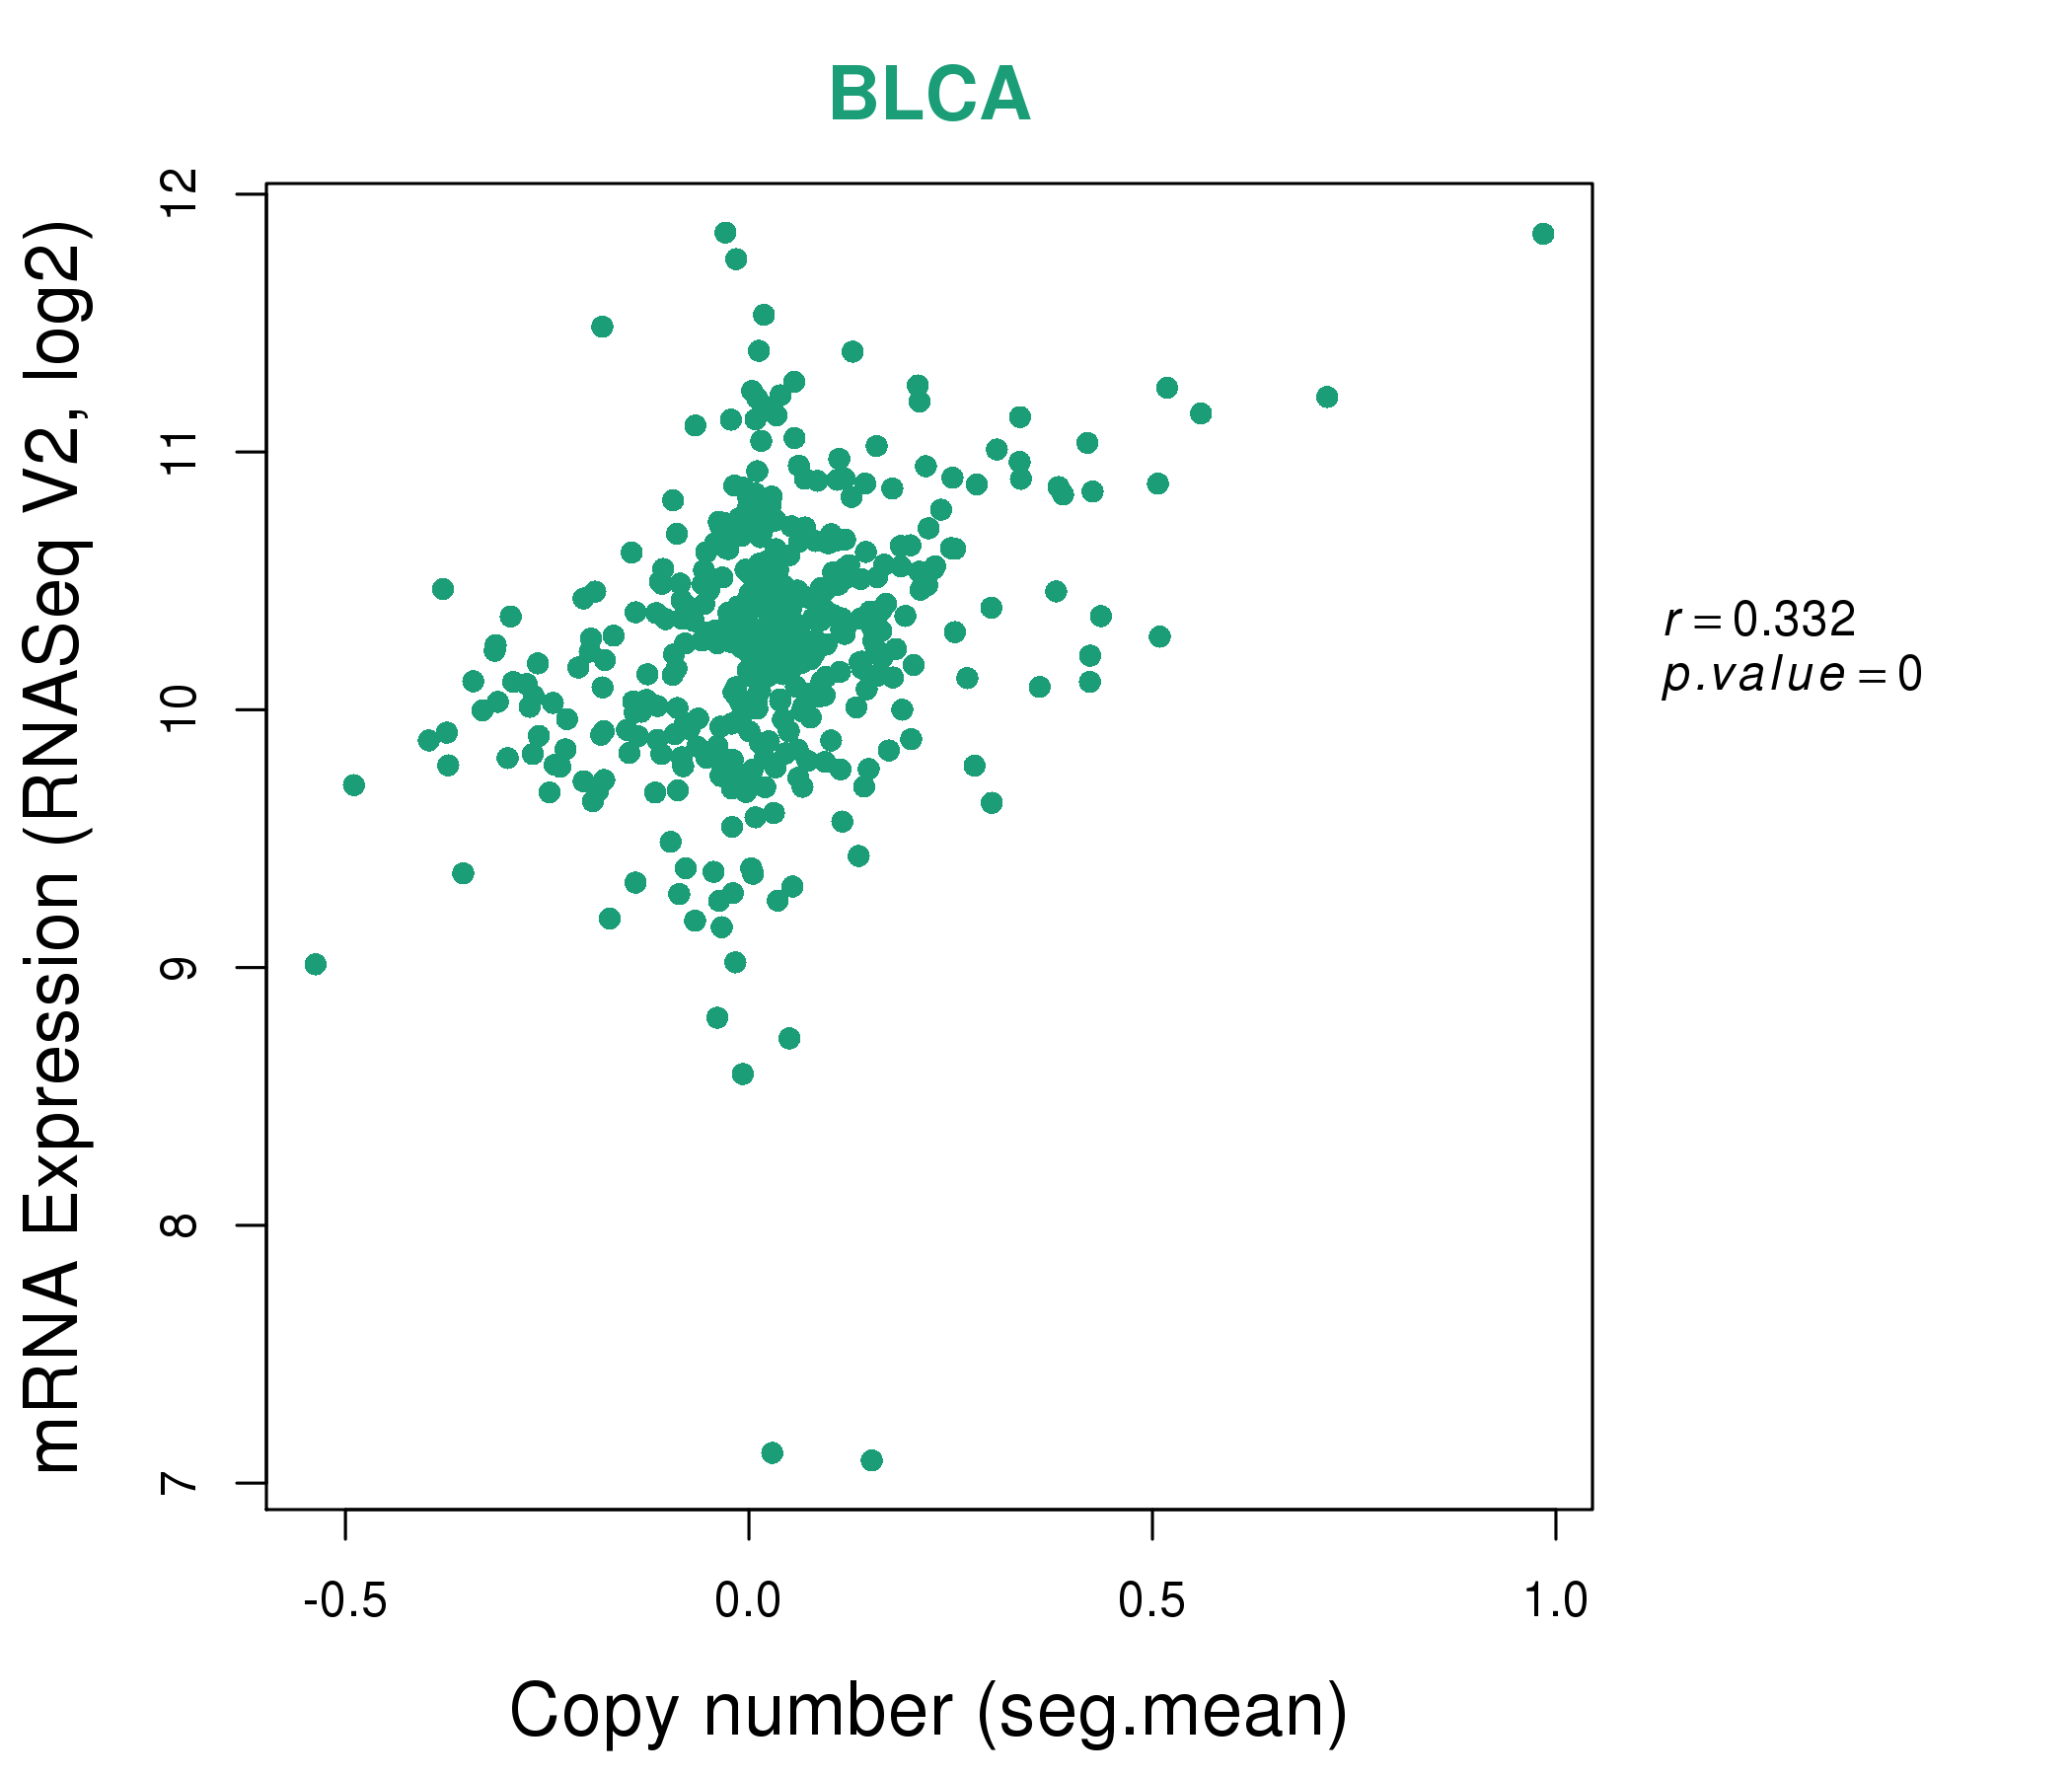
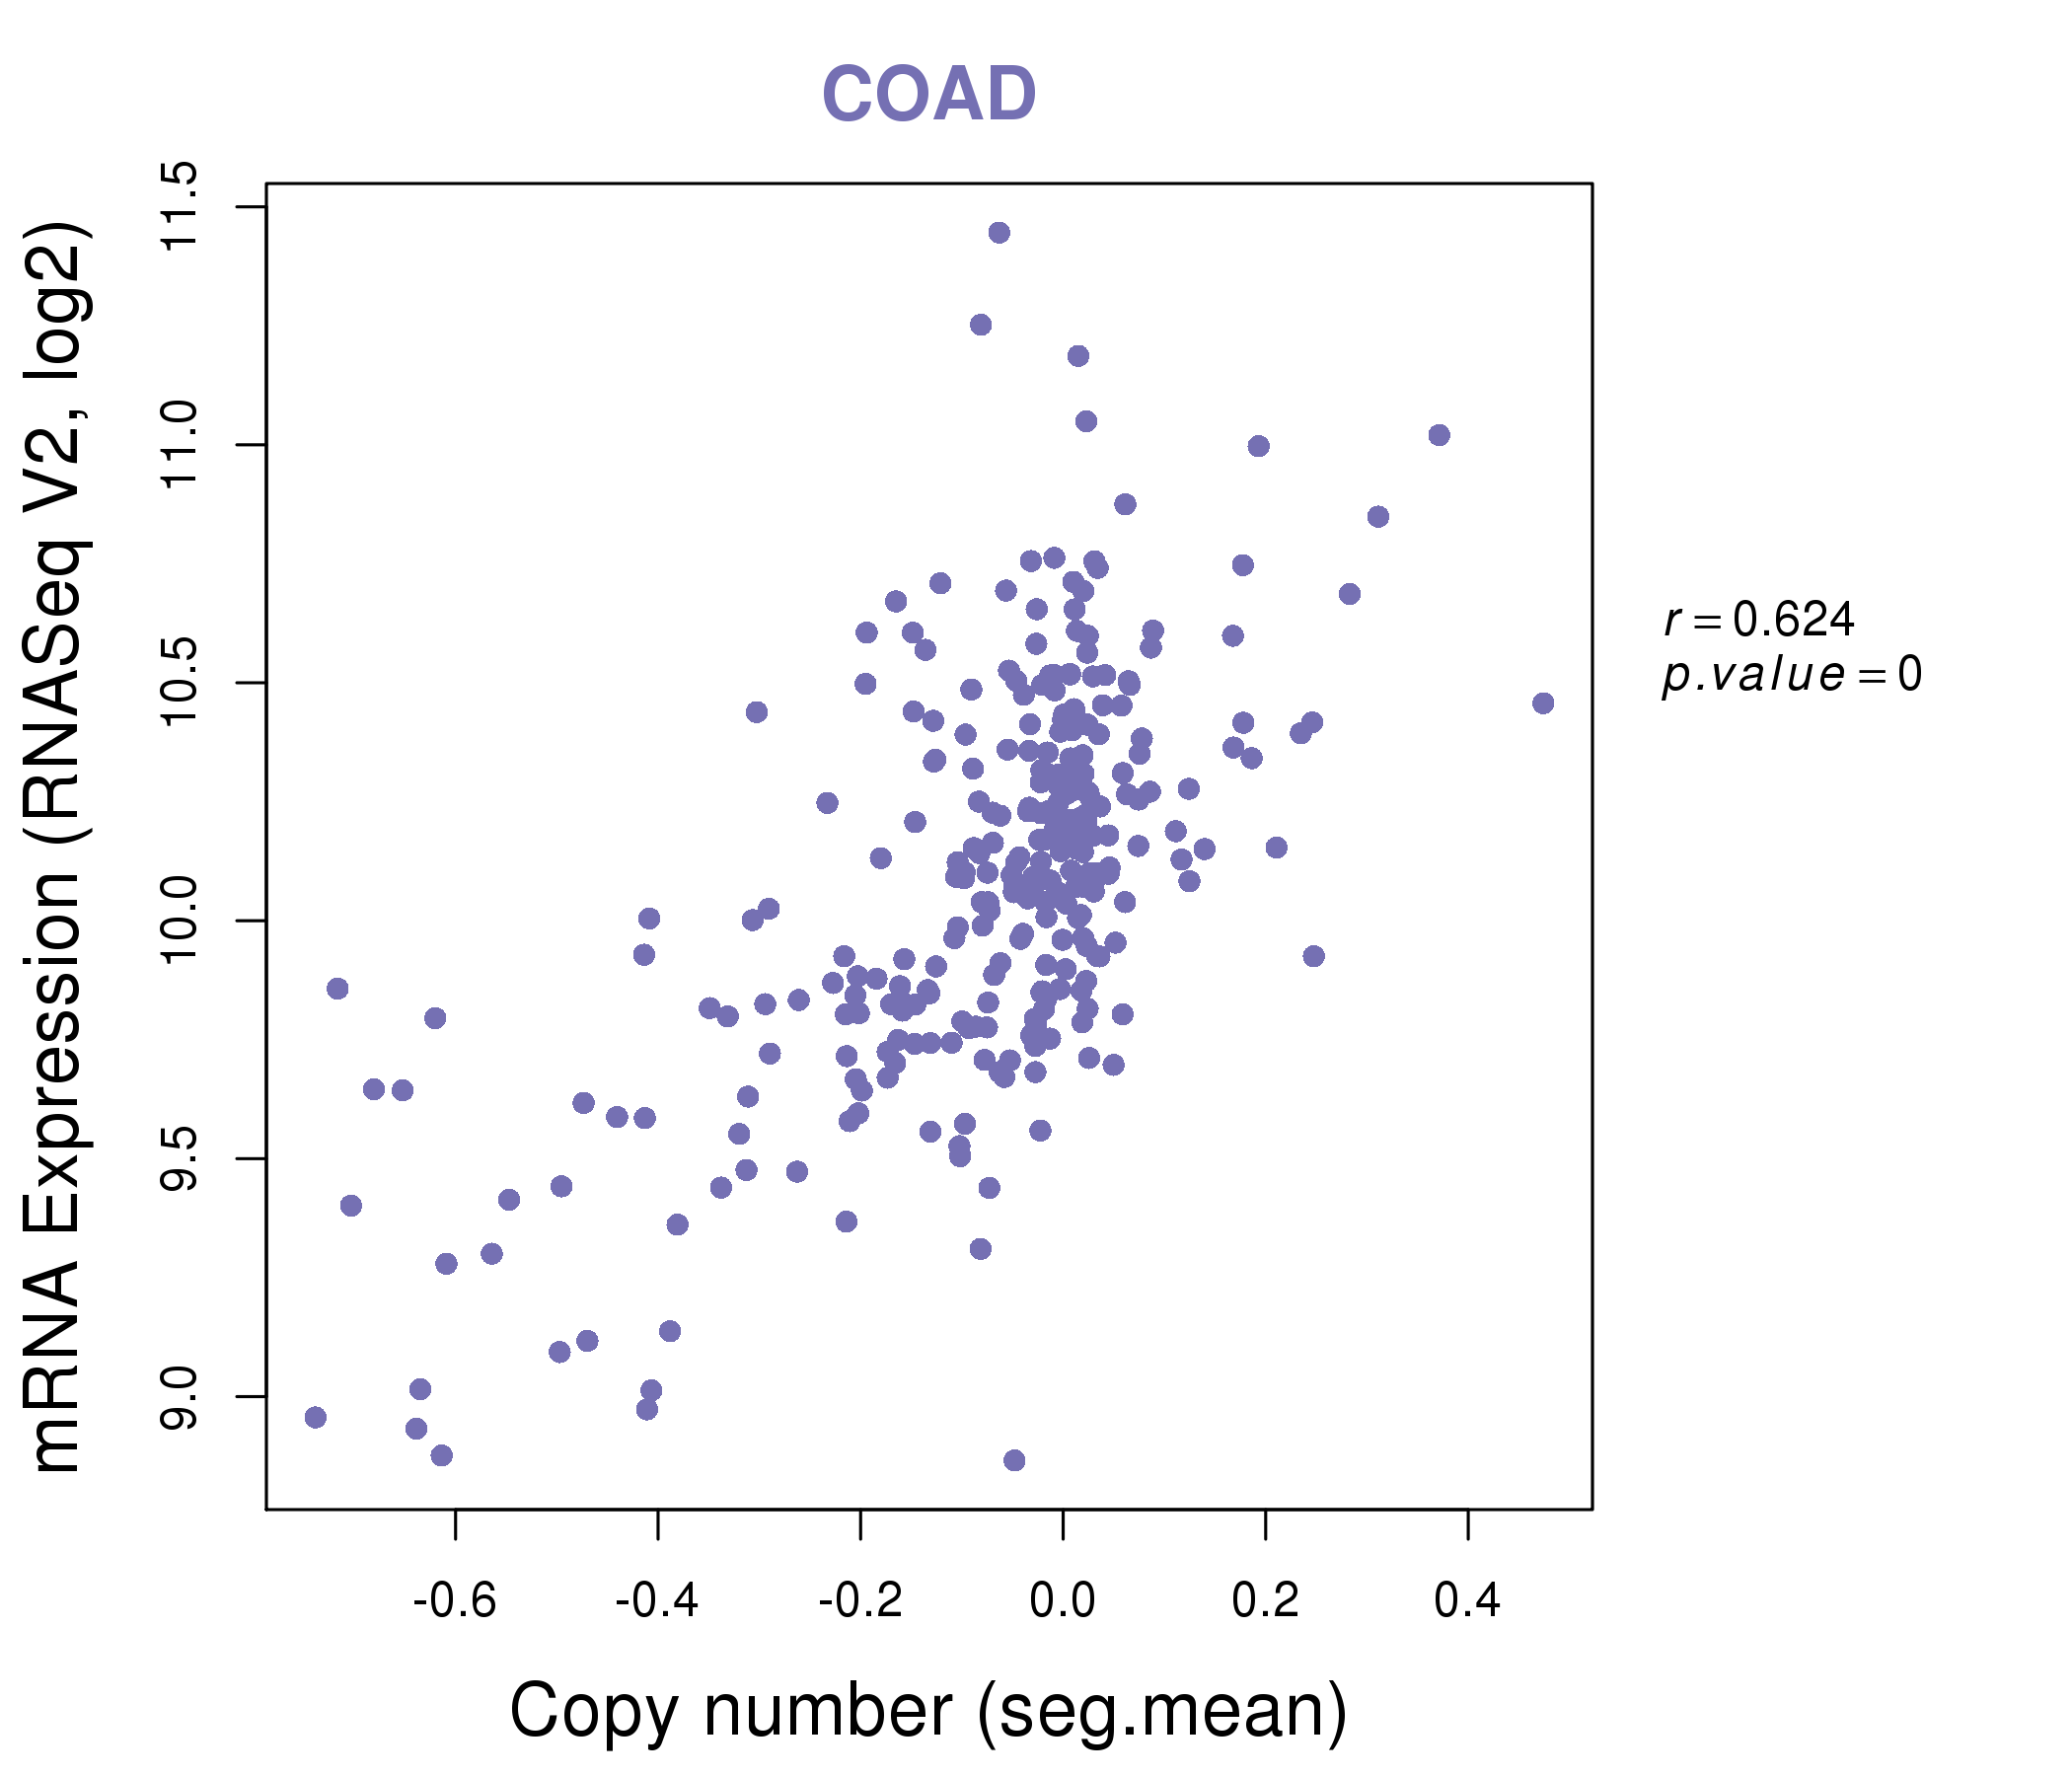
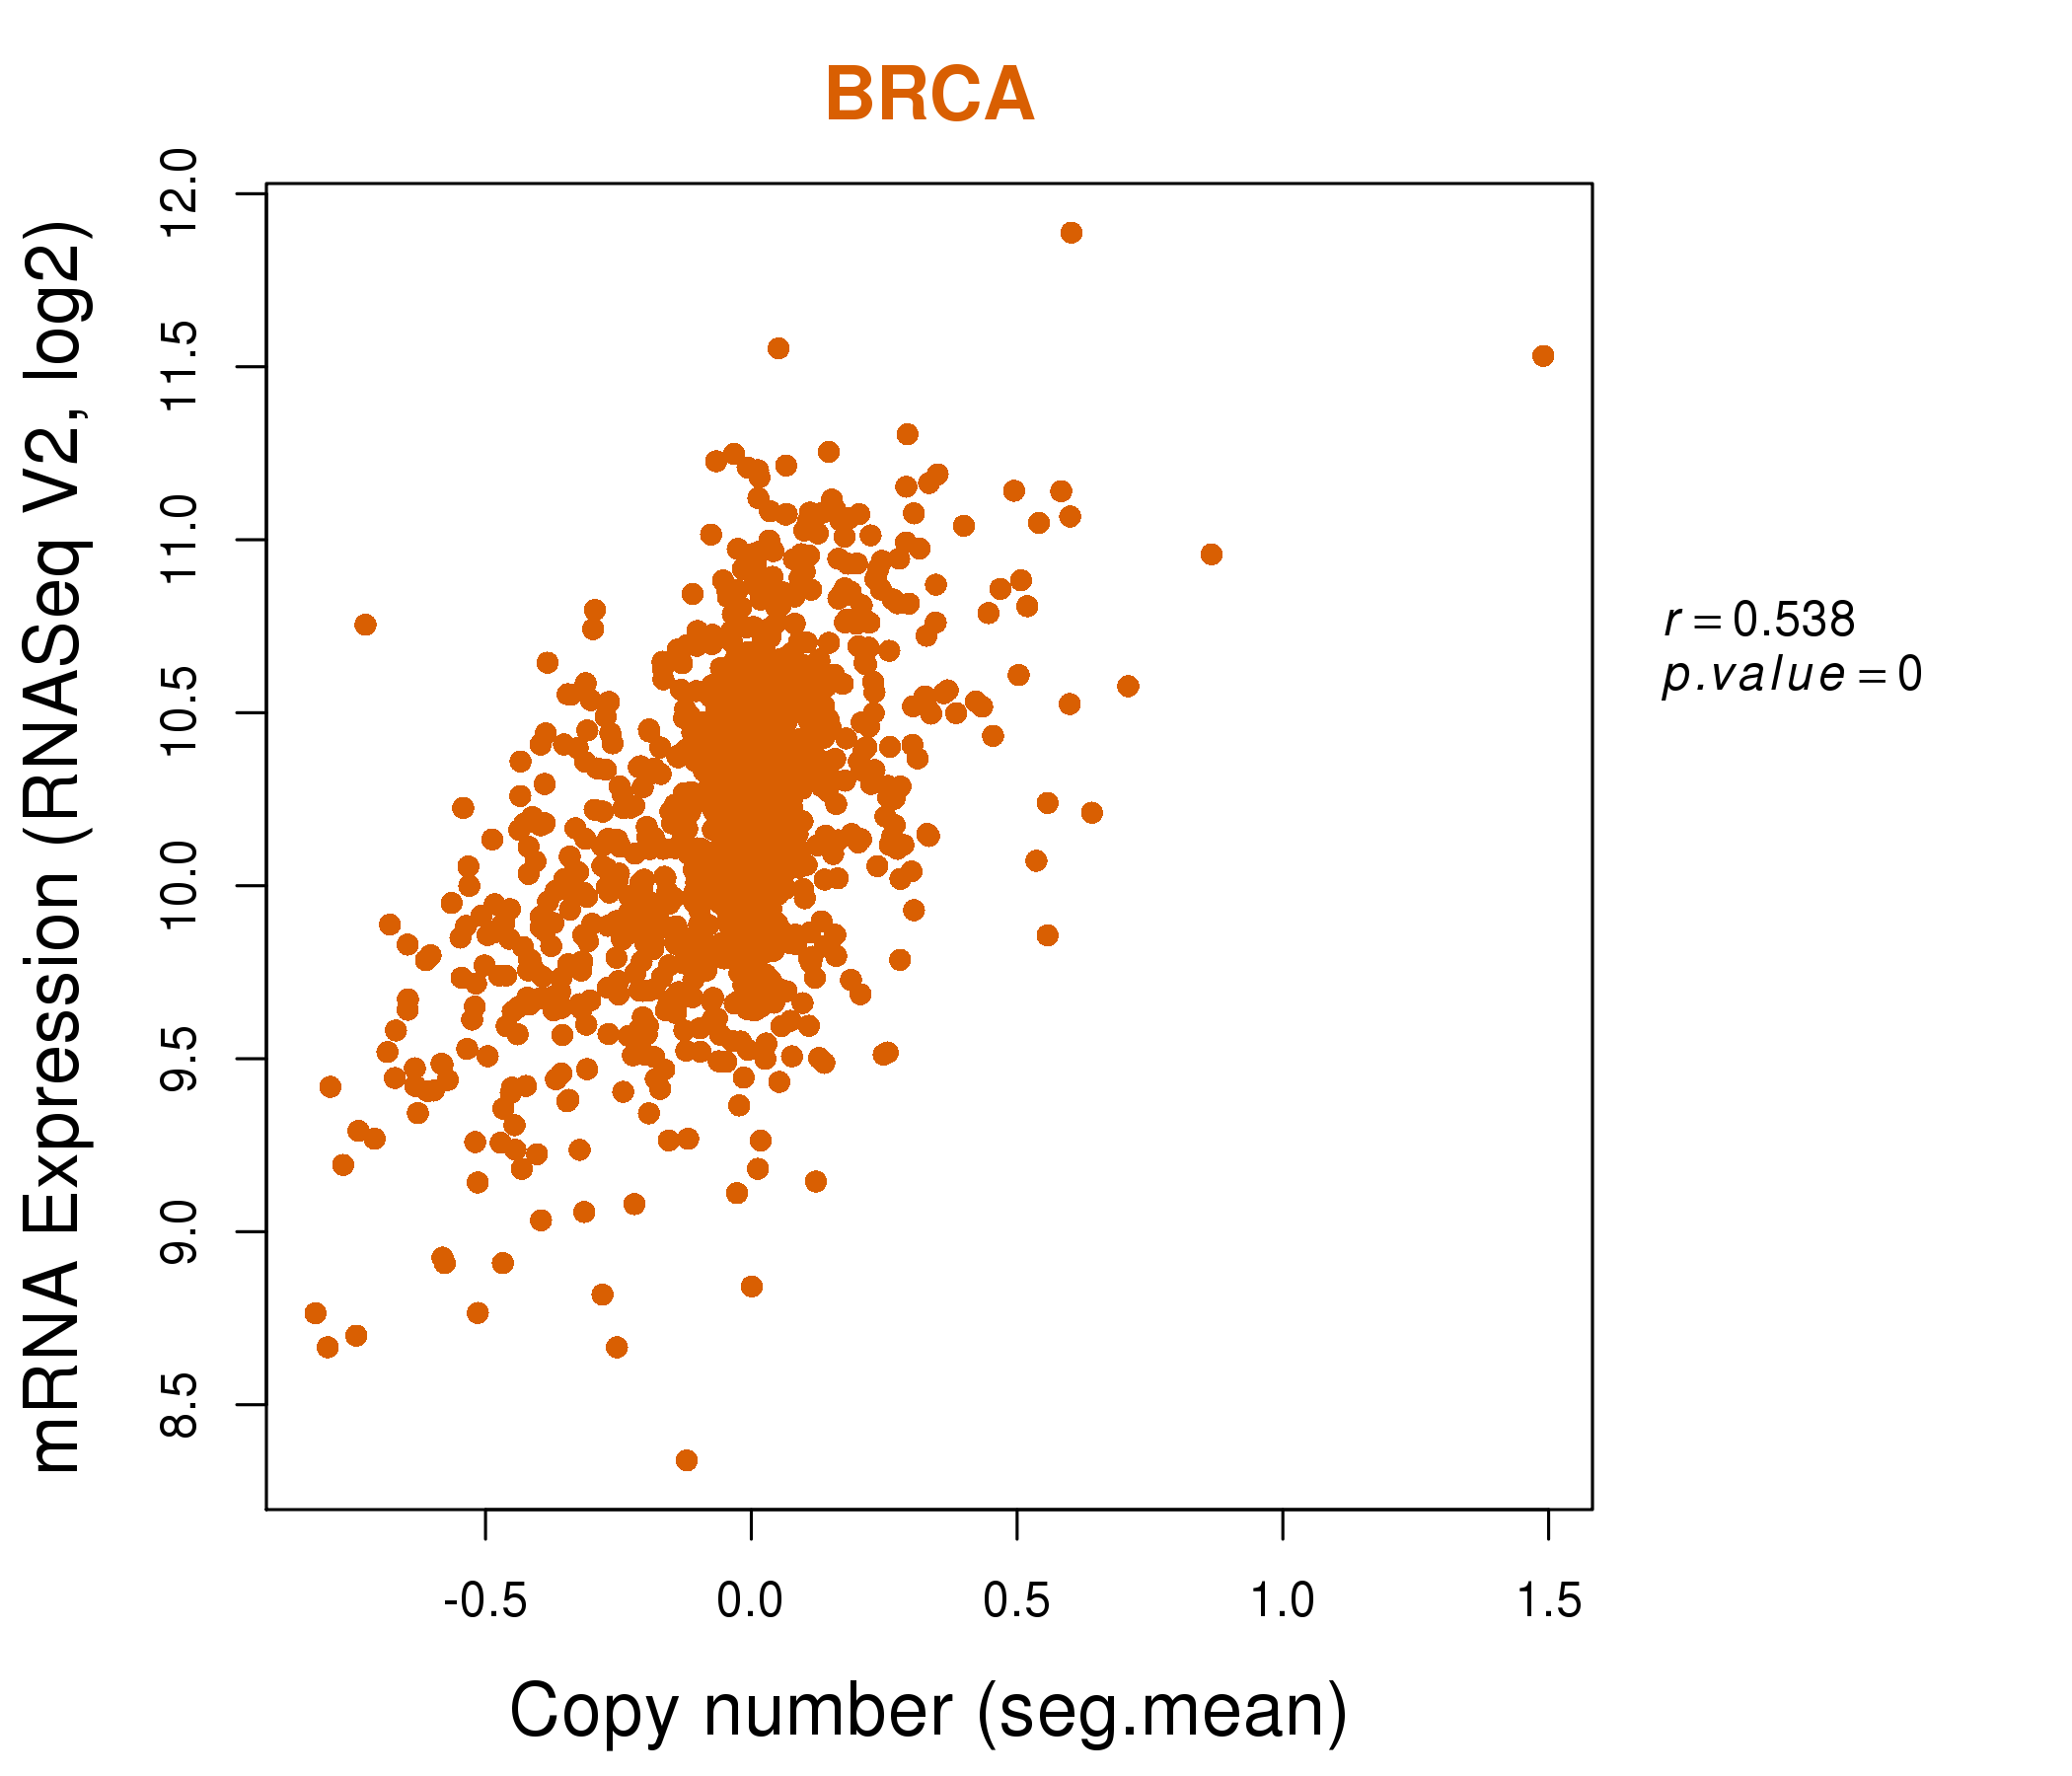
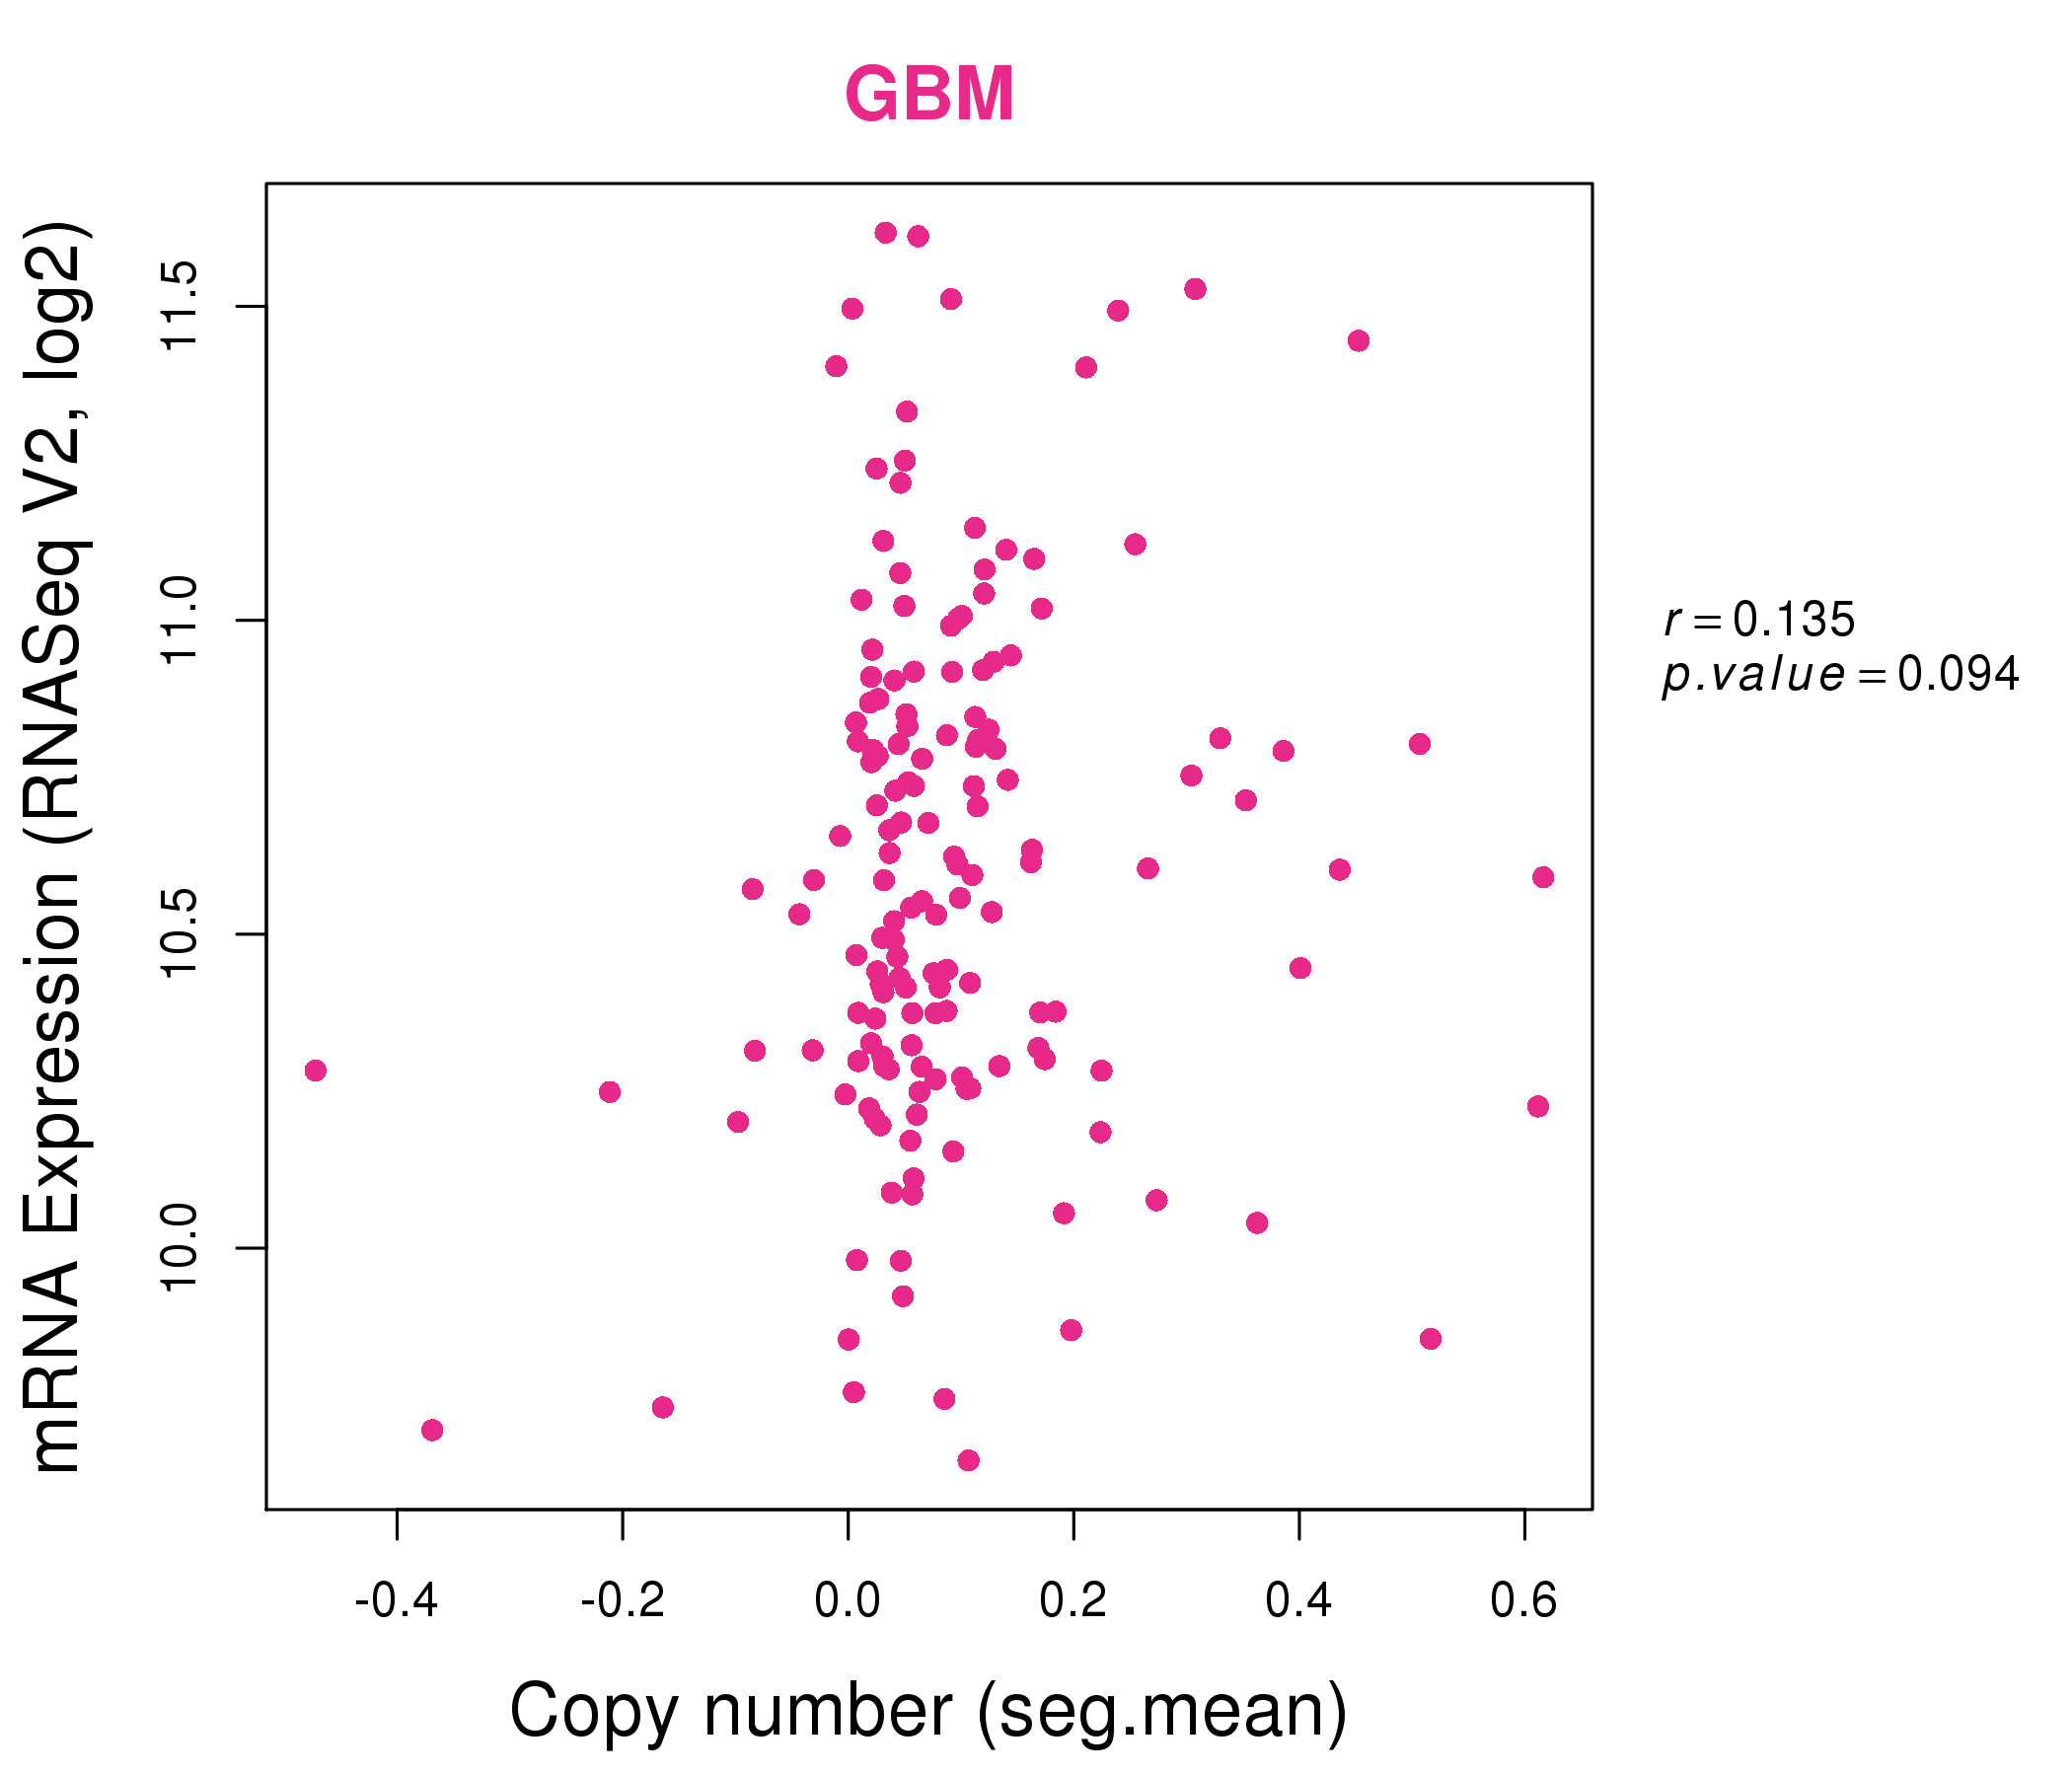
| * This plots show the correlation between CNV and gene expression. |
: Open all plots for all cancer types
 |
|
 |
|
| Top |
| Gene-Gene Network Information |
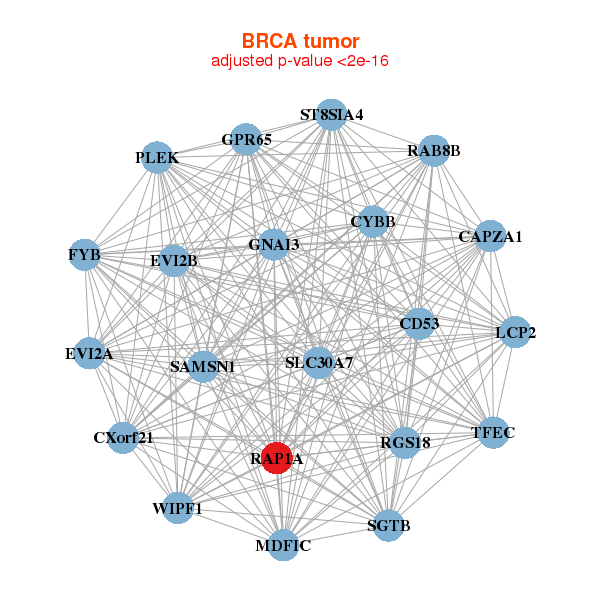
| * Co-Expression network figures were drawn using R package igraph. Only the top 20 genes with the highest correlations were shown. Red circle: input gene, orange circle: cell metabolism gene, sky circle: other gene |
: Open all plots for all cancer types
 |
|
| CAPZA1,CD53,CXorf21,CYBB,EVI2A,EVI2B,FYB, GNAI3,GPR65,LCP2,MDFIC,PLEK,RAB8B,RAP1A, RGS18,SAMSN1,SGTB,SLC30A7,ST8SIA4,TFEC,WIPF1 | AIDA,AP3S1,ARL2BP,CCNY,CD58,COMMD8,EID1, GNG10,HSD17B11,ITM2B,JAZF1,MORF4L1,PPP2R3C,RAP1A, RAP1B,RRAS2,SDCBP,SEPT7,SNX3,TMEM126B,VPS29 |
 |
|
| CFL2,DR1,MICU3,FBXL5,GNAI3,LRCH2,MBNL1, NEGR1,P2RY14,PALLD,PDE5A,PIGK,PLN,PPAP2A, RAP1A,RNF11,SH3GLB1,SLC8A1,STX12,STXBP3,TMEM167B | AP1S2,ARPP19,C11orf74,AARD,CCDC91,CETN2,CFL2, DPT,DSTN,EID1,GYG1,LAPTM4A,MORF4L1,MYL6, PAIP2,PKIG,RAP1A,SEPT10,SEPT7,SH3BGRL,TCEAL7 |

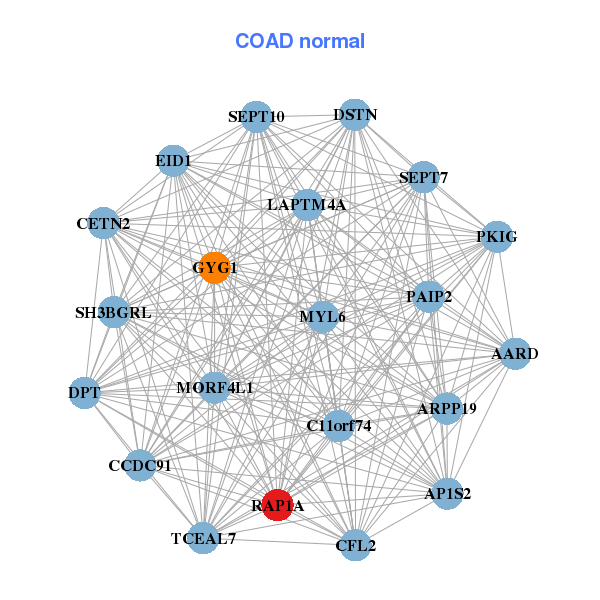
| * Co-Expression network figures were drawn using R package igraph. Only the top 20 genes with the highest correlations were shown. Red circle: input gene, orange circle: cell metabolism gene, sky circle: other gene |
: Open all plots for all cancer types
| Top |
: Open all interacting genes' information including KEGG pathway for all interacting genes from DAVID
| Top |
| Pharmacological Information for RAP1A |
| There's no related Drug. |
| Top |
| Cross referenced IDs for RAP1A |
| * We obtained these cross-references from Uniprot database. It covers 150 different DBs, 18 categories. http://www.uniprot.org/help/cross_references_section |
: Open all cross reference information
|
Copyright © 2016-Present - The Univsersity of Texas Health Science Center at Houston @ |