|
||||||||||||||||||||||||||||||||||||||||||||||||||||||||||||||||||||||||||||||||||||||||||||||||||||||||||||||||||||||||||||||||||||||||||||||||||||||||||||||||||||||||||||||||||||||||||||||||||||||||||||||||||||||||||||||||||||||||||||||||||||||||||||||||||||||||||||||||||||||||||||||||||||||||||||||||||||||||||
| |
| Phenotypic Information (metabolism pathway, cancer, disease, phenome) |
| |
| |
| Gene-Gene Network Information: Co-Expression Network, Interacting Genes & KEGG |
| |
|


| Gene Summary for BCKDHB |
| Basic gene info. | Gene symbol | BCKDHB |
| Gene name | branched chain keto acid dehydrogenase E1, beta polypeptide | |
| Synonyms | E1B|dJ279A18.1 | |
| Cytomap | UCSC genome browser: 6q14.1 | |
| Genomic location | chr6 :80816343-81055987 | |
| Type of gene | protein-coding | |
| RefGenes | NM_000056.3, NM_183050.2, | |
| Ensembl id | ENSG00000083123 | |
| Description | 2-oxoisovalerate dehydrogenase beta subunit2-oxoisovalerate dehydrogenase subunit beta, mitochondrialBCKDE1BBCKDH E1-betaE1b-beta subunit of the branched-chain complexbranched chain alpha-ketoacid dehydrogenase E1-beta subunitbranched-chain alpha-ke | |
| Modification date | 20141219 | |
| dbXrefs | MIM : 248611 | |
| HGNC : HGNC | ||
| Ensembl : ENSG00000083123 | ||
| HPRD : 02011 | ||
| Vega : OTTHUMG00000016430 | ||
| Protein | UniProt: go to UniProt's Cross Reference DB Table | |
| Expression | CleanEX: HS_BCKDHB | |
| BioGPS: 594 | ||
| Gene Expression Atlas: ENSG00000083123 | ||
| The Human Protein Atlas: ENSG00000083123 | ||
| Pathway | NCI Pathway Interaction Database: BCKDHB | |
| KEGG: BCKDHB | ||
| REACTOME: BCKDHB | ||
| ConsensusPathDB | ||
| Pathway Commons: BCKDHB | ||
| Metabolism | MetaCyc: BCKDHB | |
| HUMANCyc: BCKDHB | ||
| Regulation | Ensembl's Regulation: ENSG00000083123 | |
| miRBase: chr6 :80,816,343-81,055,987 | ||
| TargetScan: NM_000056 | ||
| cisRED: ENSG00000083123 | ||
| Context | iHOP: BCKDHB | |
| cancer metabolism search in PubMed: BCKDHB | ||
| UCL Cancer Institute: BCKDHB | ||
| Assigned class in ccmGDB | C | |
| Top |
| Phenotypic Information for BCKDHB(metabolism pathway, cancer, disease, phenome) |
| Cancer | CGAP: BCKDHB |
| Familial Cancer Database: BCKDHB | |
| * This gene is included in those cancer gene databases. |
|
|
|
|
|
|
| ||||||||||||||||||||||||||||||||||||||||||||||||||||||||||||||||||||||||||||||||||||||||||||||||||||||||||||||||||||||||||||||||||||||||||||||||||||||||||||||||||||||||||||||||||||||||||||||||||||||||||||||||||||||||||||||||||||||||||||||||||||||||||||||||||||||||||||||||||||||||||||||||||||||||||||||||||||
Oncogene 1 | Significant driver gene in | |||||||||||||||||||||||||||||||||||||||||||||||||||||||||||||||||||||||||||||||||||||||||||||||||||||||||||||||||||||||||||||||||||||||||||||||||||||||||||||||||||||||||||||||||||||||||||||||||||||||||||||||||||||||||||||||||||||||||||||||||||||||||||||||||||||||||||||||||||||||||||||||||||||||||||||||||||||||||
| cf) number; DB name 1 Oncogene; http://nar.oxfordjournals.org/content/35/suppl_1/D721.long, 2 Tumor Suppressor gene; https://bioinfo.uth.edu/TSGene/, 3 Cancer Gene Census; http://www.nature.com/nrc/journal/v4/n3/abs/nrc1299.html, 4 CancerGenes; http://nar.oxfordjournals.org/content/35/suppl_1/D721.long, 5 Network of Cancer Gene; http://ncg.kcl.ac.uk/index.php, 1Therapeutic Vulnerabilities in Cancer; http://cbio.mskcc.org/cancergenomics/statius/ |
| REACTOME_METABOLISM_OF_AMINO_ACIDS_AND_DERIVATIVES | |
| OMIM | |
| Orphanet | |
| Disease | KEGG Disease: BCKDHB |
| MedGen: BCKDHB (Human Medical Genetics with Condition) | |
| ClinVar: BCKDHB | |
| Phenotype | MGI: BCKDHB (International Mouse Phenotyping Consortium) |
| PhenomicDB: BCKDHB | |
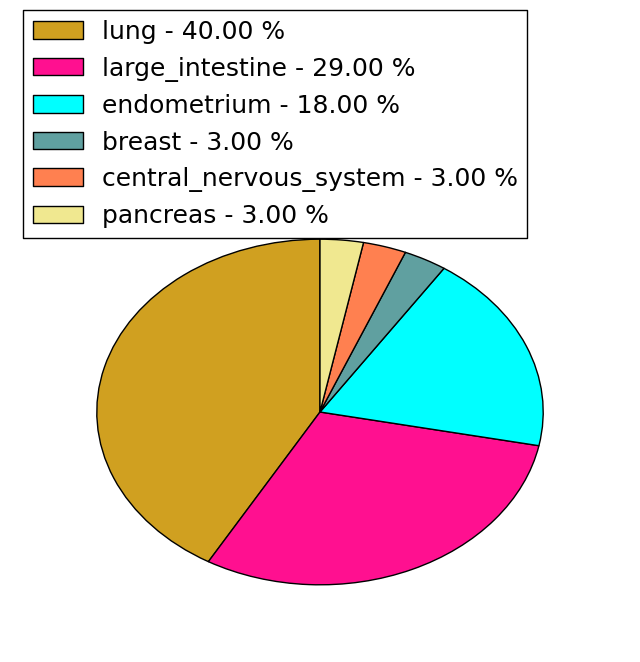
| Mutations for BCKDHB |
| * Under tables are showing count per each tissue to give us broad intuition about tissue specific mutation patterns.You can go to the detailed page for each mutation database's web site. |
| - Statistics for Tissue and Mutation type | Top |
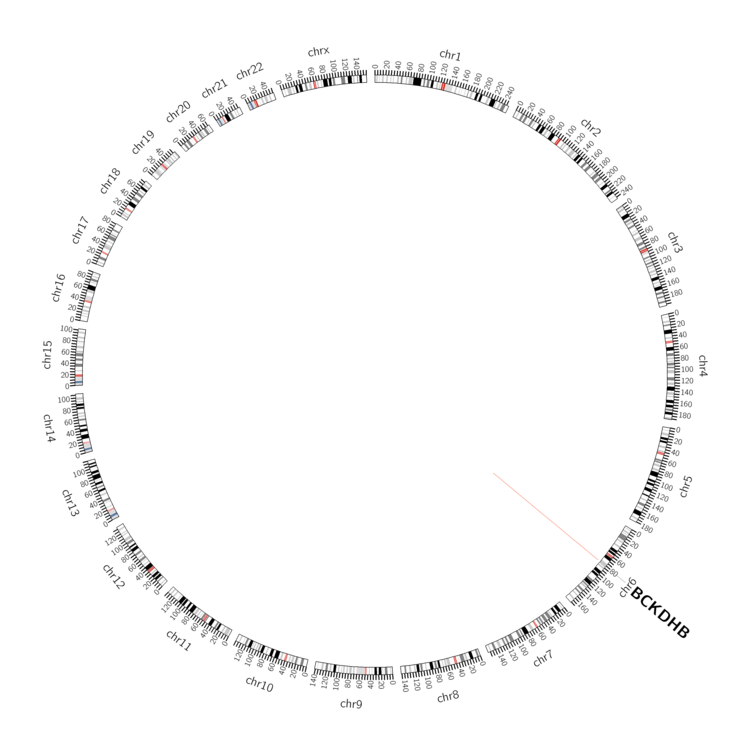 |
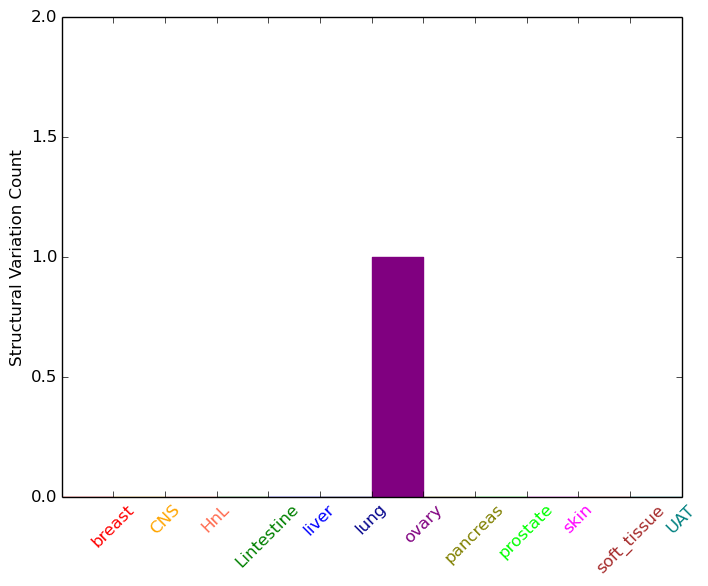
| - For Inter-chromosomal Variations |
| There's no inter-chromosomal structural variation. |
| - For Intra-chromosomal Variations |
| * Intra-chromosomal variantions includes 'intrachromosomal amplicon to amplicon', 'intrachromosomal amplicon to non-amplified dna', 'intrachromosomal deletion', 'intrachromosomal fold-back inversion', 'intrachromosomal inversion', 'intrachromosomal tandem duplication', 'Intrachromosomal unknown type', 'intrachromosomal with inverted orientation', 'intrachromosomal with non-inverted orientation'. |
 |
| Sample | Symbol_a | Chr_a | Start_a | End_a | Symbol_b | Chr_b | Start_b | End_b |
| ovary | BCKDHB | chr6 | 81049371 | 81049391 | BCKDHB | chr6 | 81043689 | 81043709 |
| cf) Tissue number; Tissue name (1;Breast, 2;Central_nervous_system, 3;Haematopoietic_and_lymphoid_tissue, 4;Large_intestine, 5;Liver, 6;Lung, 7;Ovary, 8;Pancreas, 9;Prostate, 10;Skin, 11;Soft_tissue, 12;Upper_aerodigestive_tract) |
| * From mRNA Sanger sequences, Chitars2.0 arranged chimeric transcripts. This table shows BCKDHB related fusion information. |
| ID | Head Gene | Tail Gene | Accession | Gene_a | qStart_a | qEnd_a | Chromosome_a | tStart_a | tEnd_a | Gene_a | qStart_a | qEnd_a | Chromosome_a | tStart_a | tEnd_a |
| BP391782 | DBI | 1 | 108 | 2 | 120124584 | 120125818 | BCKDHB | 109 | 502 | 6 | 81053432 | 81055987 | |
| AF161393 | SEC31A | 1 | 1562 | 4 | 83739814 | 83765613 | BCKDHB | 1559 | 1578 | 6 | 80865557 | 80865576 | |
| CR933696 | SEC31A | 1 | 3687 | 4 | 83739814 | 83812306 | BCKDHB | 3684 | 3703 | 6 | 80865557 | 80865576 | |
| AF161452 | SEC31A | 1 | 1382 | 4 | 83739814 | 83763567 | BCKDHB | 1379 | 1398 | 6 | 80865557 | 80865576 | |
| Top |
| Mutation type/ Tissue ID | brca | cns | cerv | endome | haematopo | kidn | Lintest | liver | lung | ns | ovary | pancre | prost | skin | stoma | thyro | urina | |||
| Total # sample | 1 | 1 | 2 | 1 | 1 | 1 | ||||||||||||||
| GAIN (# sample) | 1 | 1 | 1 | 1 | ||||||||||||||||
| LOSS (# sample) | 1 | 1 | 1 |
| cf) Tissue ID; Tissue type (1; Breast, 2; Central_nervous_system, 3; Cervix, 4; Endometrium, 5; Haematopoietic_and_lymphoid_tissue, 6; Kidney, 7; Large_intestine, 8; Liver, 9; Lung, 10; NS, 11; Ovary, 12; Pancreas, 13; Prostate, 14; Skin, 15; Stomach, 16; Thyroid, 17; Urinary_tract) |
| Top |
|
 |
| Top |
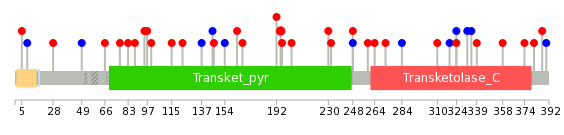
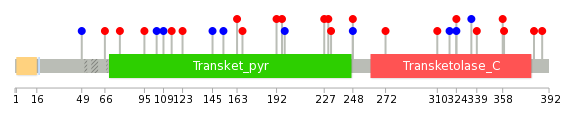
| Stat. for Non-Synonymous SNVs (# total SNVs=27) | (# total SNVs=10) |
 |  |
(# total SNVs=0) | (# total SNVs=1) |
 |
| Top |
| * When you move the cursor on each content, you can see more deailed mutation information on the Tooltip. Those are primary_site,primary_histology,mutation(aa),pubmedID. |
| GRCh37 position | Mutation(aa) | Unique sampleID count |
| chr6:80912938-80912938 | p.? | 2 |
| chr6:80982870-80982870 | p.R324R | 2 |
| chr6:80878698-80878698 | p.Y195C | 2 |
| chr6:80877418-80877418 | p.P123S | 1 |
| chr6:81053483-81053483 | p.K381Q | 1 |
| chr6:80878701-80878701 | p.H196P | 1 |
| chr6:80837272-80837272 | p.Q69* | 1 |
| chr6:80912907-80912907 | p.W310S | 1 |
| chr6:80877462-80877462 | p.A137A | 1 |
| chr6:81053502-81053502 | p.R387Q | 1 |
| Top |
|
 |
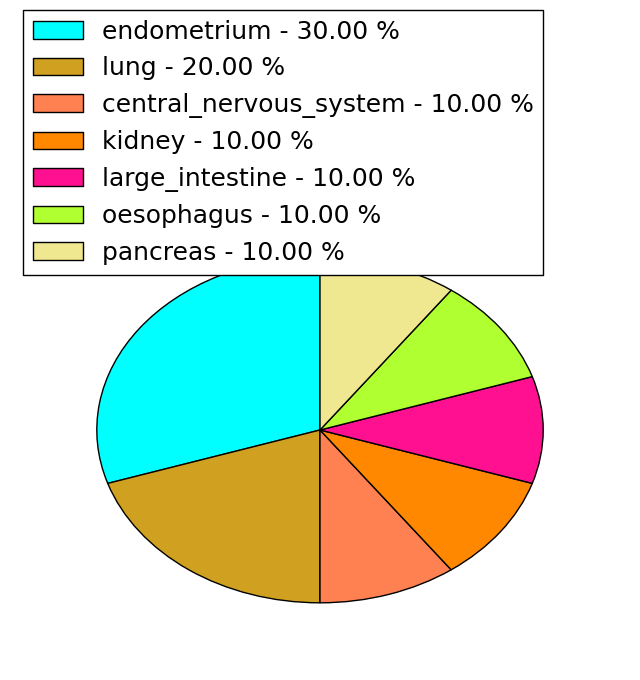
| Point Mutation/ Tissue ID | 1 | 2 | 3 | 4 | 5 | 6 | 7 | 8 | 9 | 10 | 11 | 12 | 13 | 14 | 15 | 16 | 17 | 18 | 19 | 20 |
| # sample | 4 | 2 | 2 | 9 | 1 | 3 | 2 | 7 | ||||||||||||
| # mutation | 4 | 2 | 2 | 9 | 1 | 3 | 2 | 8 | ||||||||||||
| nonsynonymous SNV | 3 | 1 | 1 | 8 | 1 | 2 | 5 | |||||||||||||
| synonymous SNV | 1 | 1 | 1 | 1 | 1 | 2 | 3 |
| cf) Tissue ID; Tissue type (1; BLCA[Bladder Urothelial Carcinoma], 2; BRCA[Breast invasive carcinoma], 3; CESC[Cervical squamous cell carcinoma and endocervical adenocarcinoma], 4; COAD[Colon adenocarcinoma], 5; GBM[Glioblastoma multiforme], 6; Glioma Low Grade, 7; HNSC[Head and Neck squamous cell carcinoma], 8; KICH[Kidney Chromophobe], 9; KIRC[Kidney renal clear cell carcinoma], 10; KIRP[Kidney renal papillary cell carcinoma], 11; LAML[Acute Myeloid Leukemia], 12; LUAD[Lung adenocarcinoma], 13; LUSC[Lung squamous cell carcinoma], 14; OV[Ovarian serous cystadenocarcinoma ], 15; PAAD[Pancreatic adenocarcinoma], 16; PRAD[Prostate adenocarcinoma], 17; SKCM[Skin Cutaneous Melanoma], 18:STAD[Stomach adenocarcinoma], 19:THCA[Thyroid carcinoma], 20:UCEC[Uterine Corpus Endometrial Carcinoma]) |
| Top |
| * We represented just top 10 SNVs. When you move the cursor on each content, you can see more deailed mutation information on the Tooltip. Those are primary_site, primary_histology, mutation(aa), pubmedID. |
| Genomic Position | Mutation(aa) | Unique sampleID count |
| chr6:80881055 | p.I153I,BCKDHB | 1 |
| chr6:81053415 | p.G335G,BCKDHB | 1 |
| chr6:80877395 | p.E163K,BCKDHB | 1 |
| chr6:80881059 | p.S339L,BCKDHB | 1 |
| chr6:81053418 | p.Y167C,BCKDHB | 1 |
| chr6:80877418 | p.S358L,BCKDHB | 1 |
| chr6:80881107 | p.G192V,BCKDHB | 1 |
| chr6:81053483 | p.R359T,BCKDHB | 1 |
| chr6:80877486 | p.H196P,BCKDHB | 1 |
| chr6:80910652 | p.K381Q,BCKDHB | 1 |
| * Copy number data were extracted from TCGA using R package TCGA-Assembler. The URLs of all public data files on TCGA DCC data server were gathered on Jan-05-2015. Function ProcessCNAData in TCGA-Assembler package was used to obtain gene-level copy number value which is calculated as the average copy number of the genomic region of a gene. |
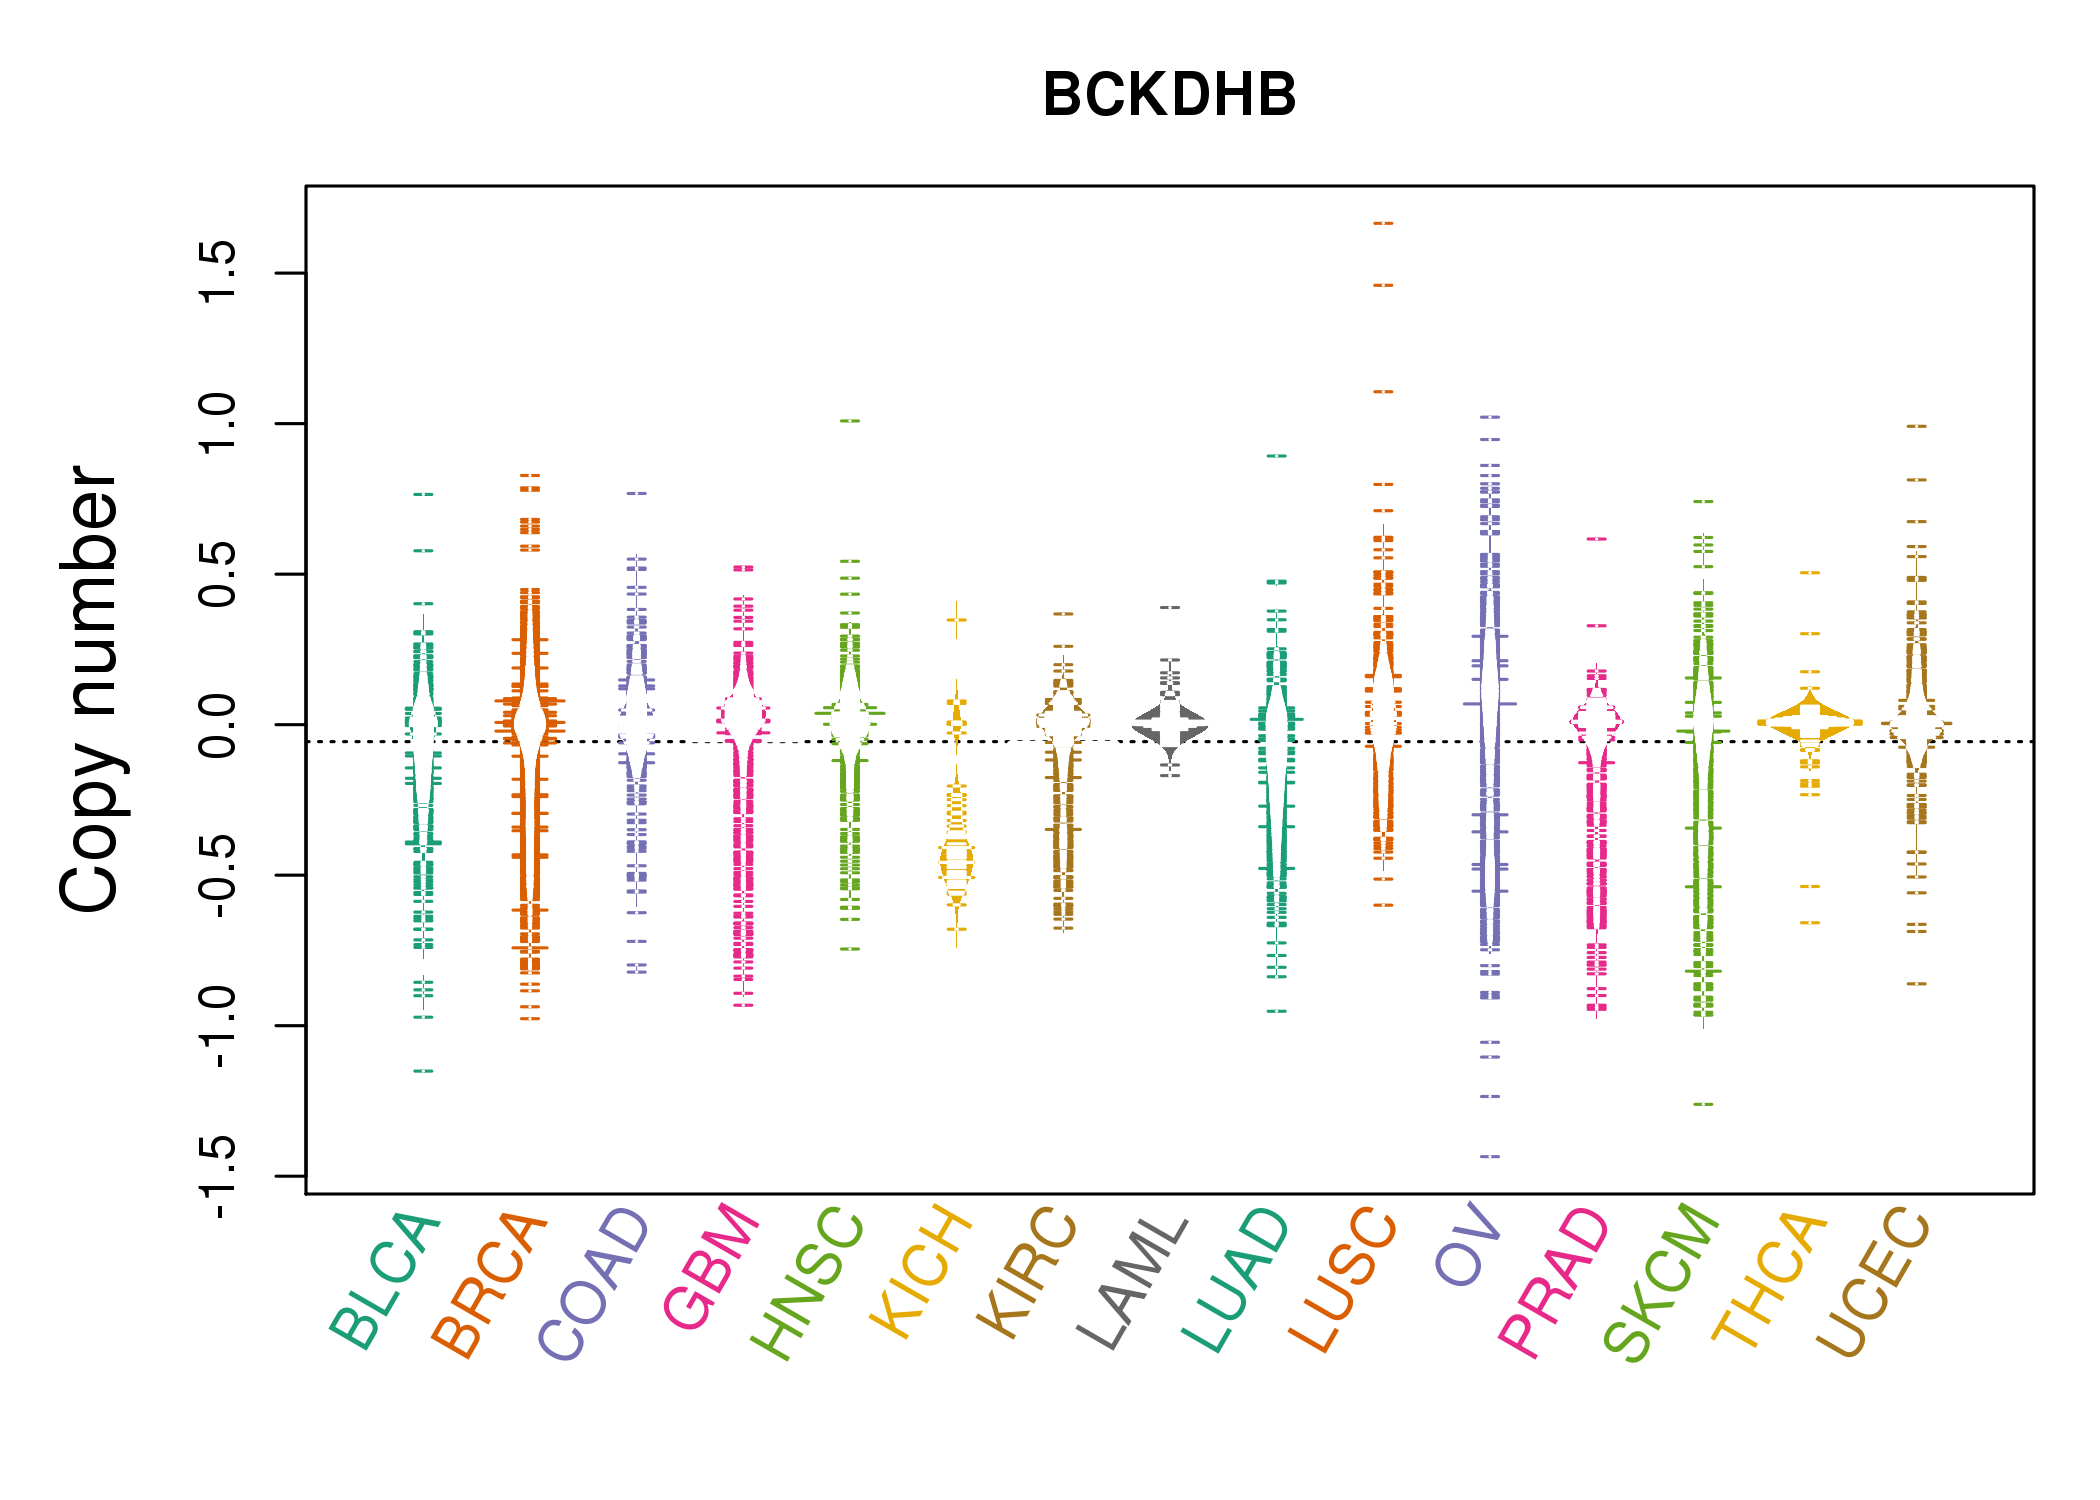 |
| cf) Tissue ID[Tissue type]: BLCA[Bladder Urothelial Carcinoma], BRCA[Breast invasive carcinoma], CESC[Cervical squamous cell carcinoma and endocervical adenocarcinoma], COAD[Colon adenocarcinoma], GBM[Glioblastoma multiforme], Glioma Low Grade, HNSC[Head and Neck squamous cell carcinoma], KICH[Kidney Chromophobe], KIRC[Kidney renal clear cell carcinoma], KIRP[Kidney renal papillary cell carcinoma], LAML[Acute Myeloid Leukemia], LUAD[Lung adenocarcinoma], LUSC[Lung squamous cell carcinoma], OV[Ovarian serous cystadenocarcinoma ], PAAD[Pancreatic adenocarcinoma], PRAD[Prostate adenocarcinoma], SKCM[Skin Cutaneous Melanoma], STAD[Stomach adenocarcinoma], THCA[Thyroid carcinoma], UCEC[Uterine Corpus Endometrial Carcinoma] |
| Top |
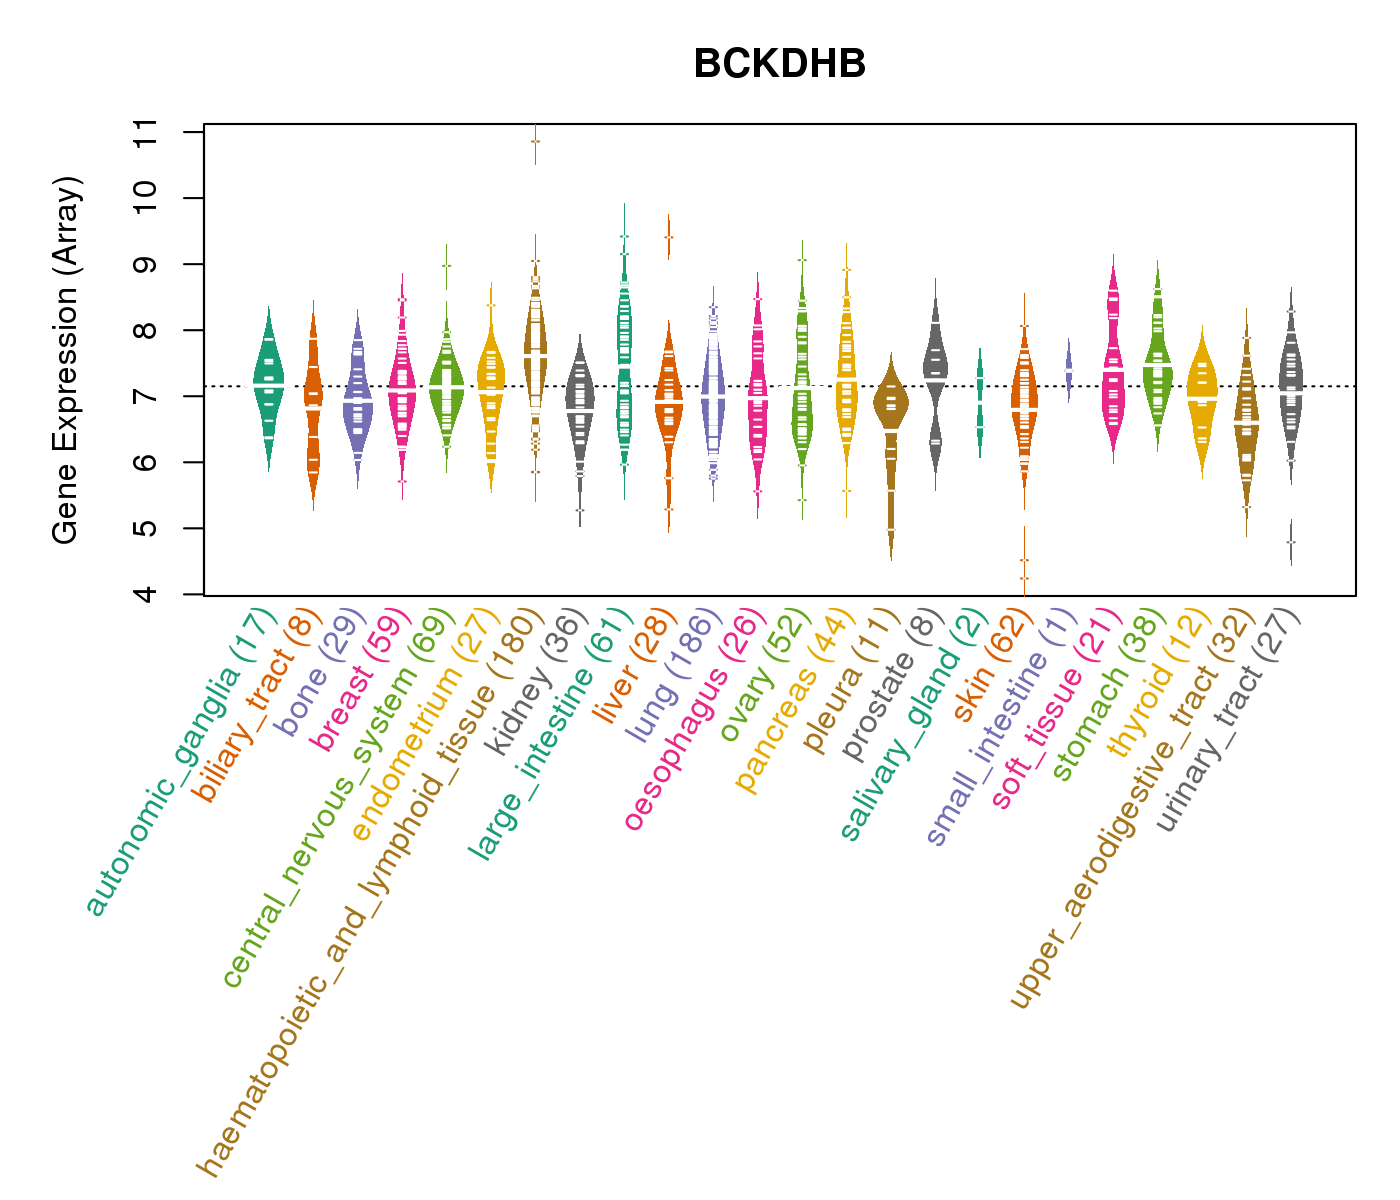
| Gene Expression for BCKDHB |
| * CCLE gene expression data were extracted from CCLE_Expression_Entrez_2012-10-18.res: Gene-centric RMA-normalized mRNA expression data. |
 |
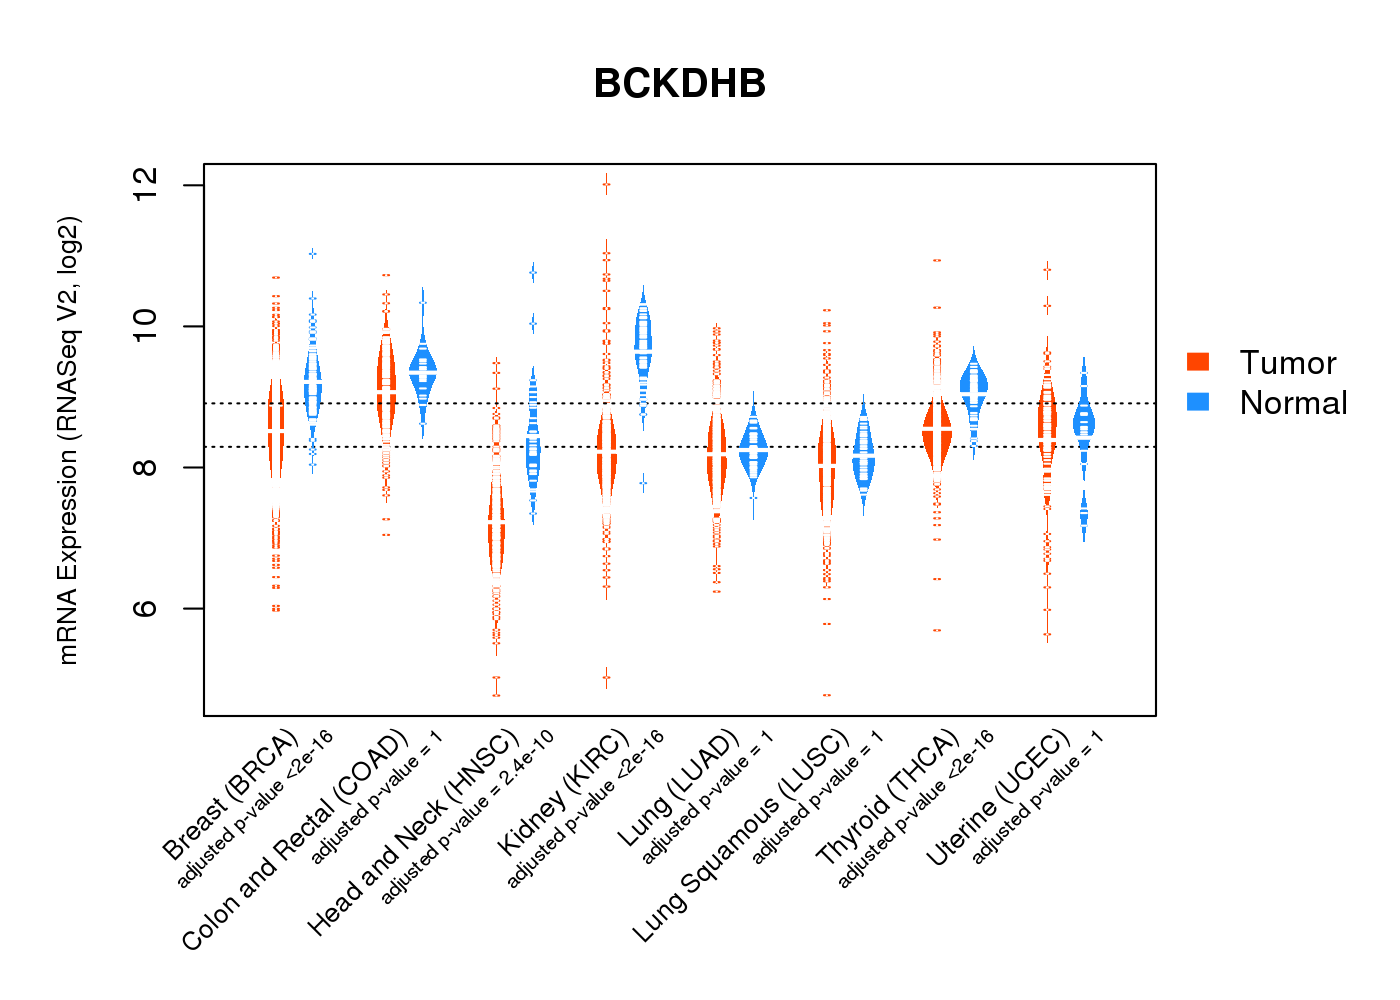
| * Normalized gene expression data of RNASeqV2 was extracted from TCGA using R package TCGA-Assembler. The URLs of all public data files on TCGA DCC data server were gathered at Jan-05-2015. Only eight cancer types have enough normal control samples for differential expression analysis. (t test, adjusted p<0.05 (using Benjamini-Hochberg FDR)) |
 |
| Top |
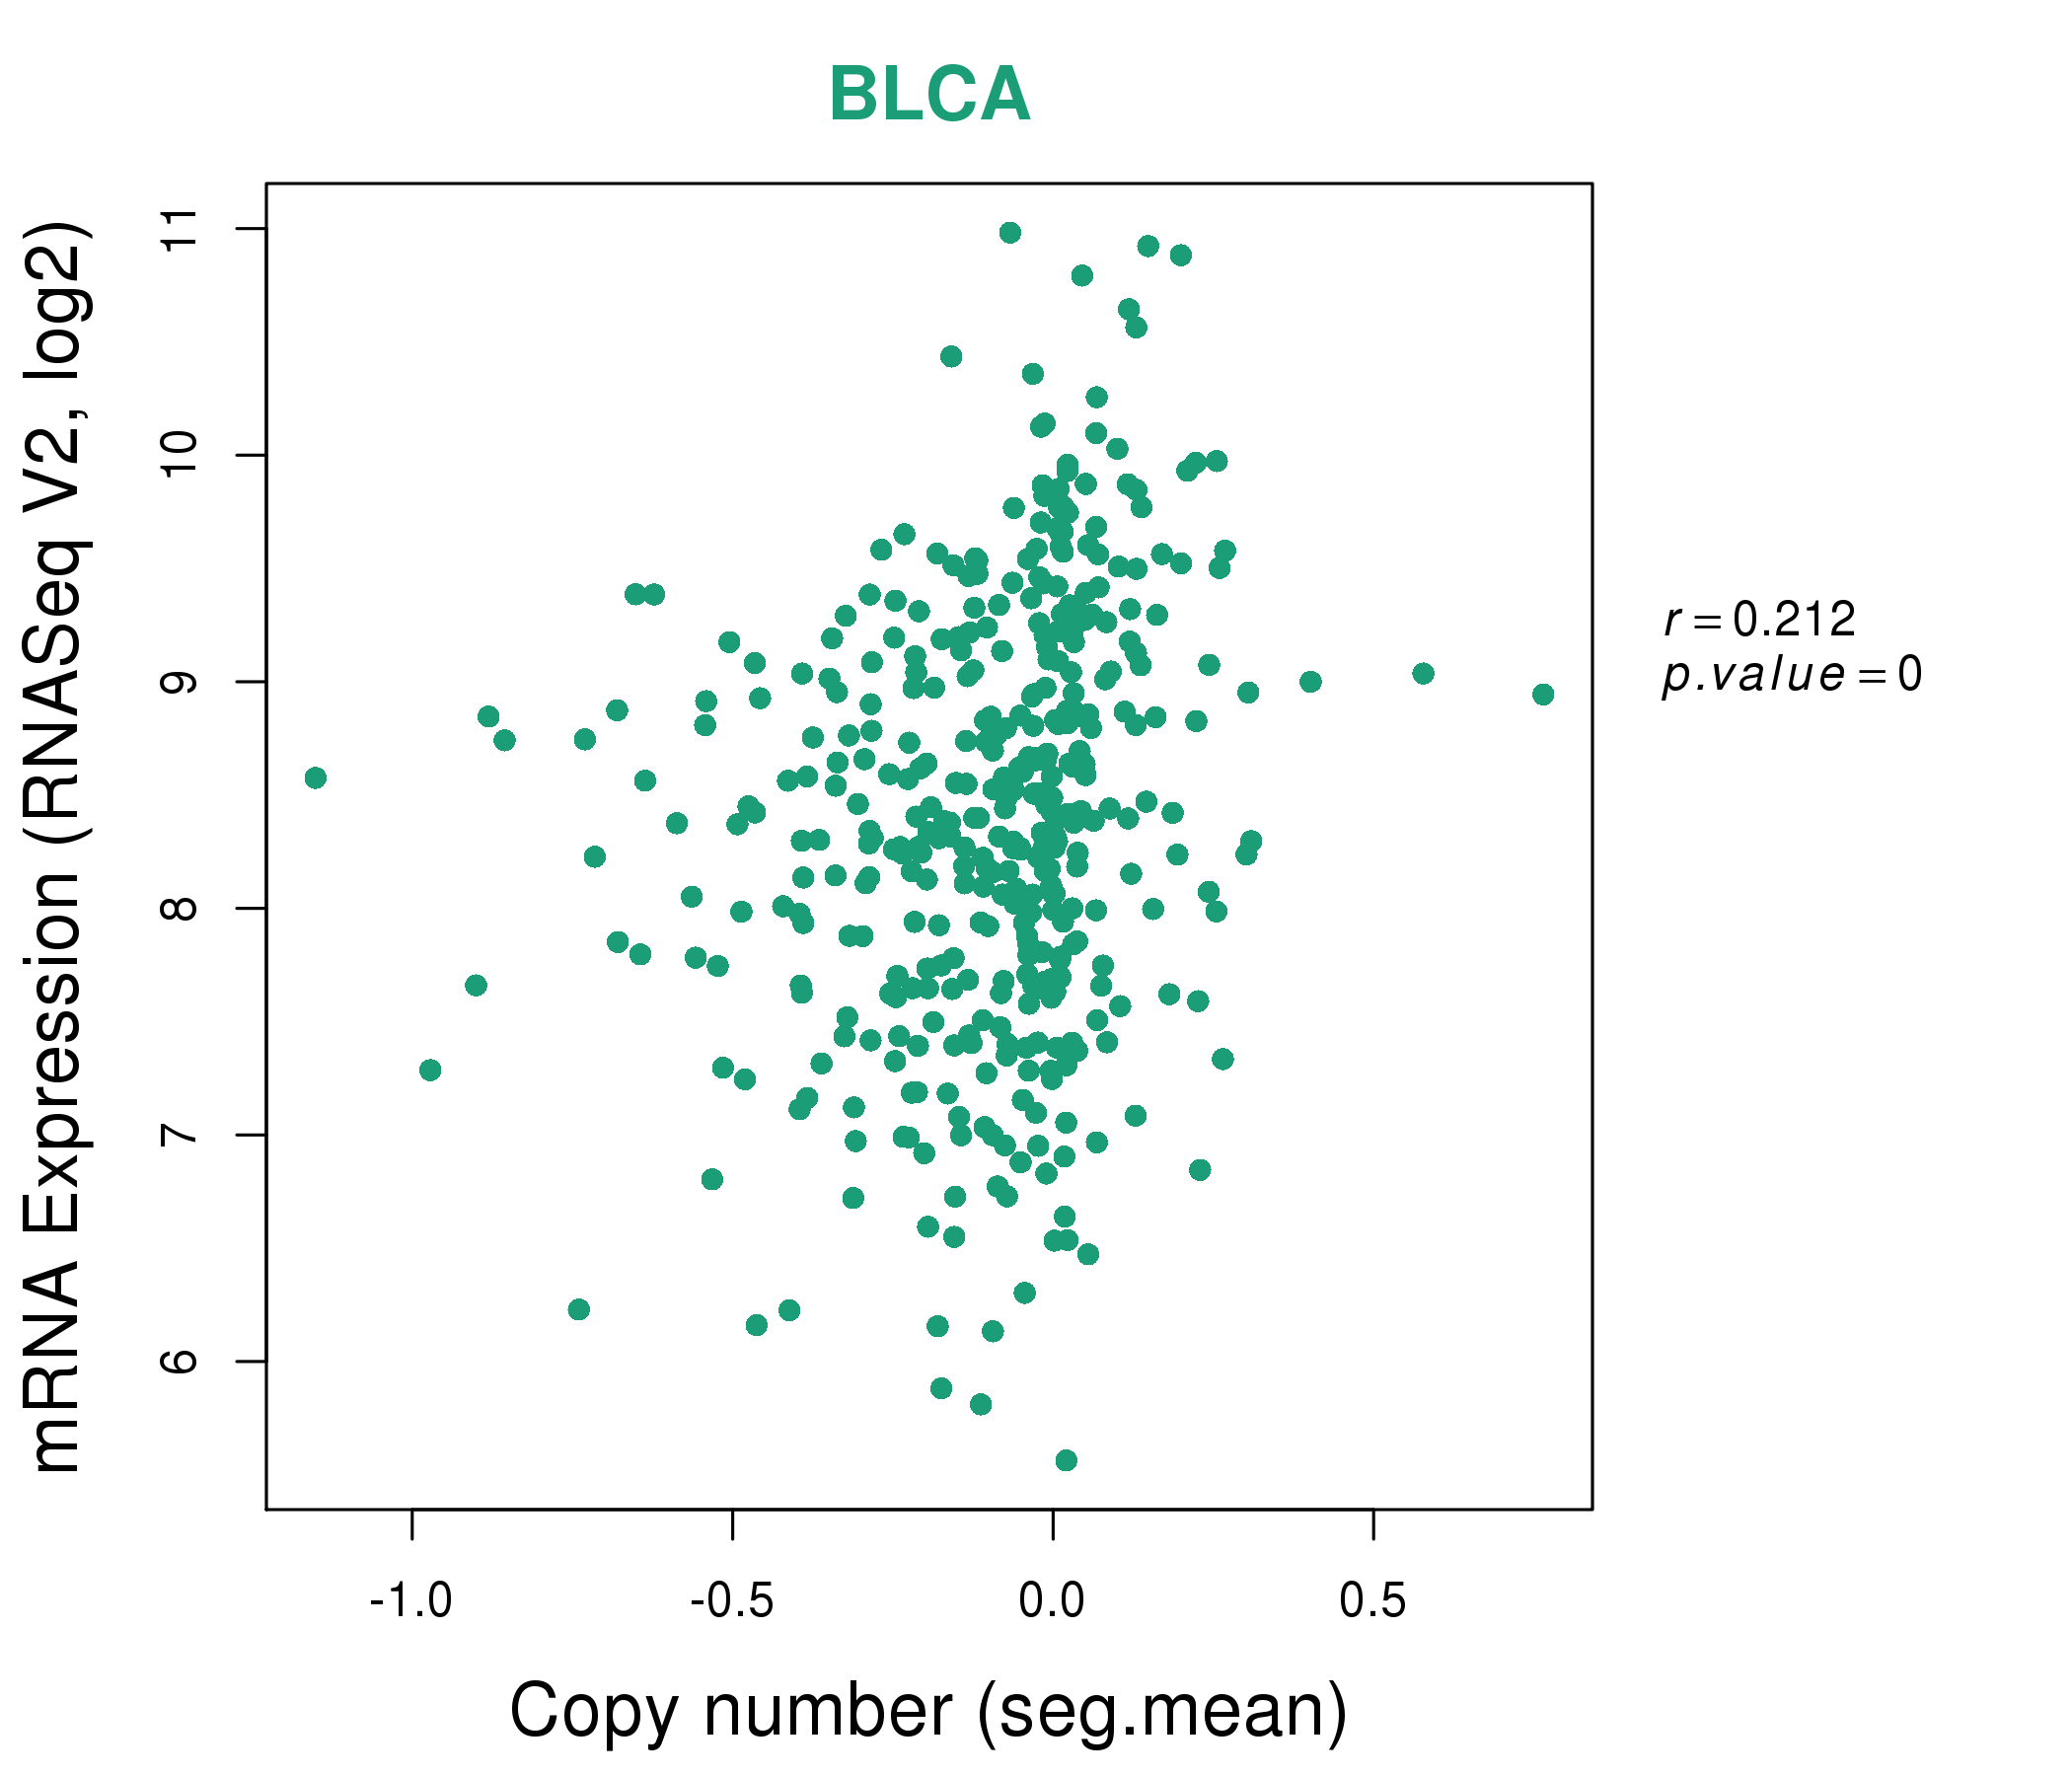
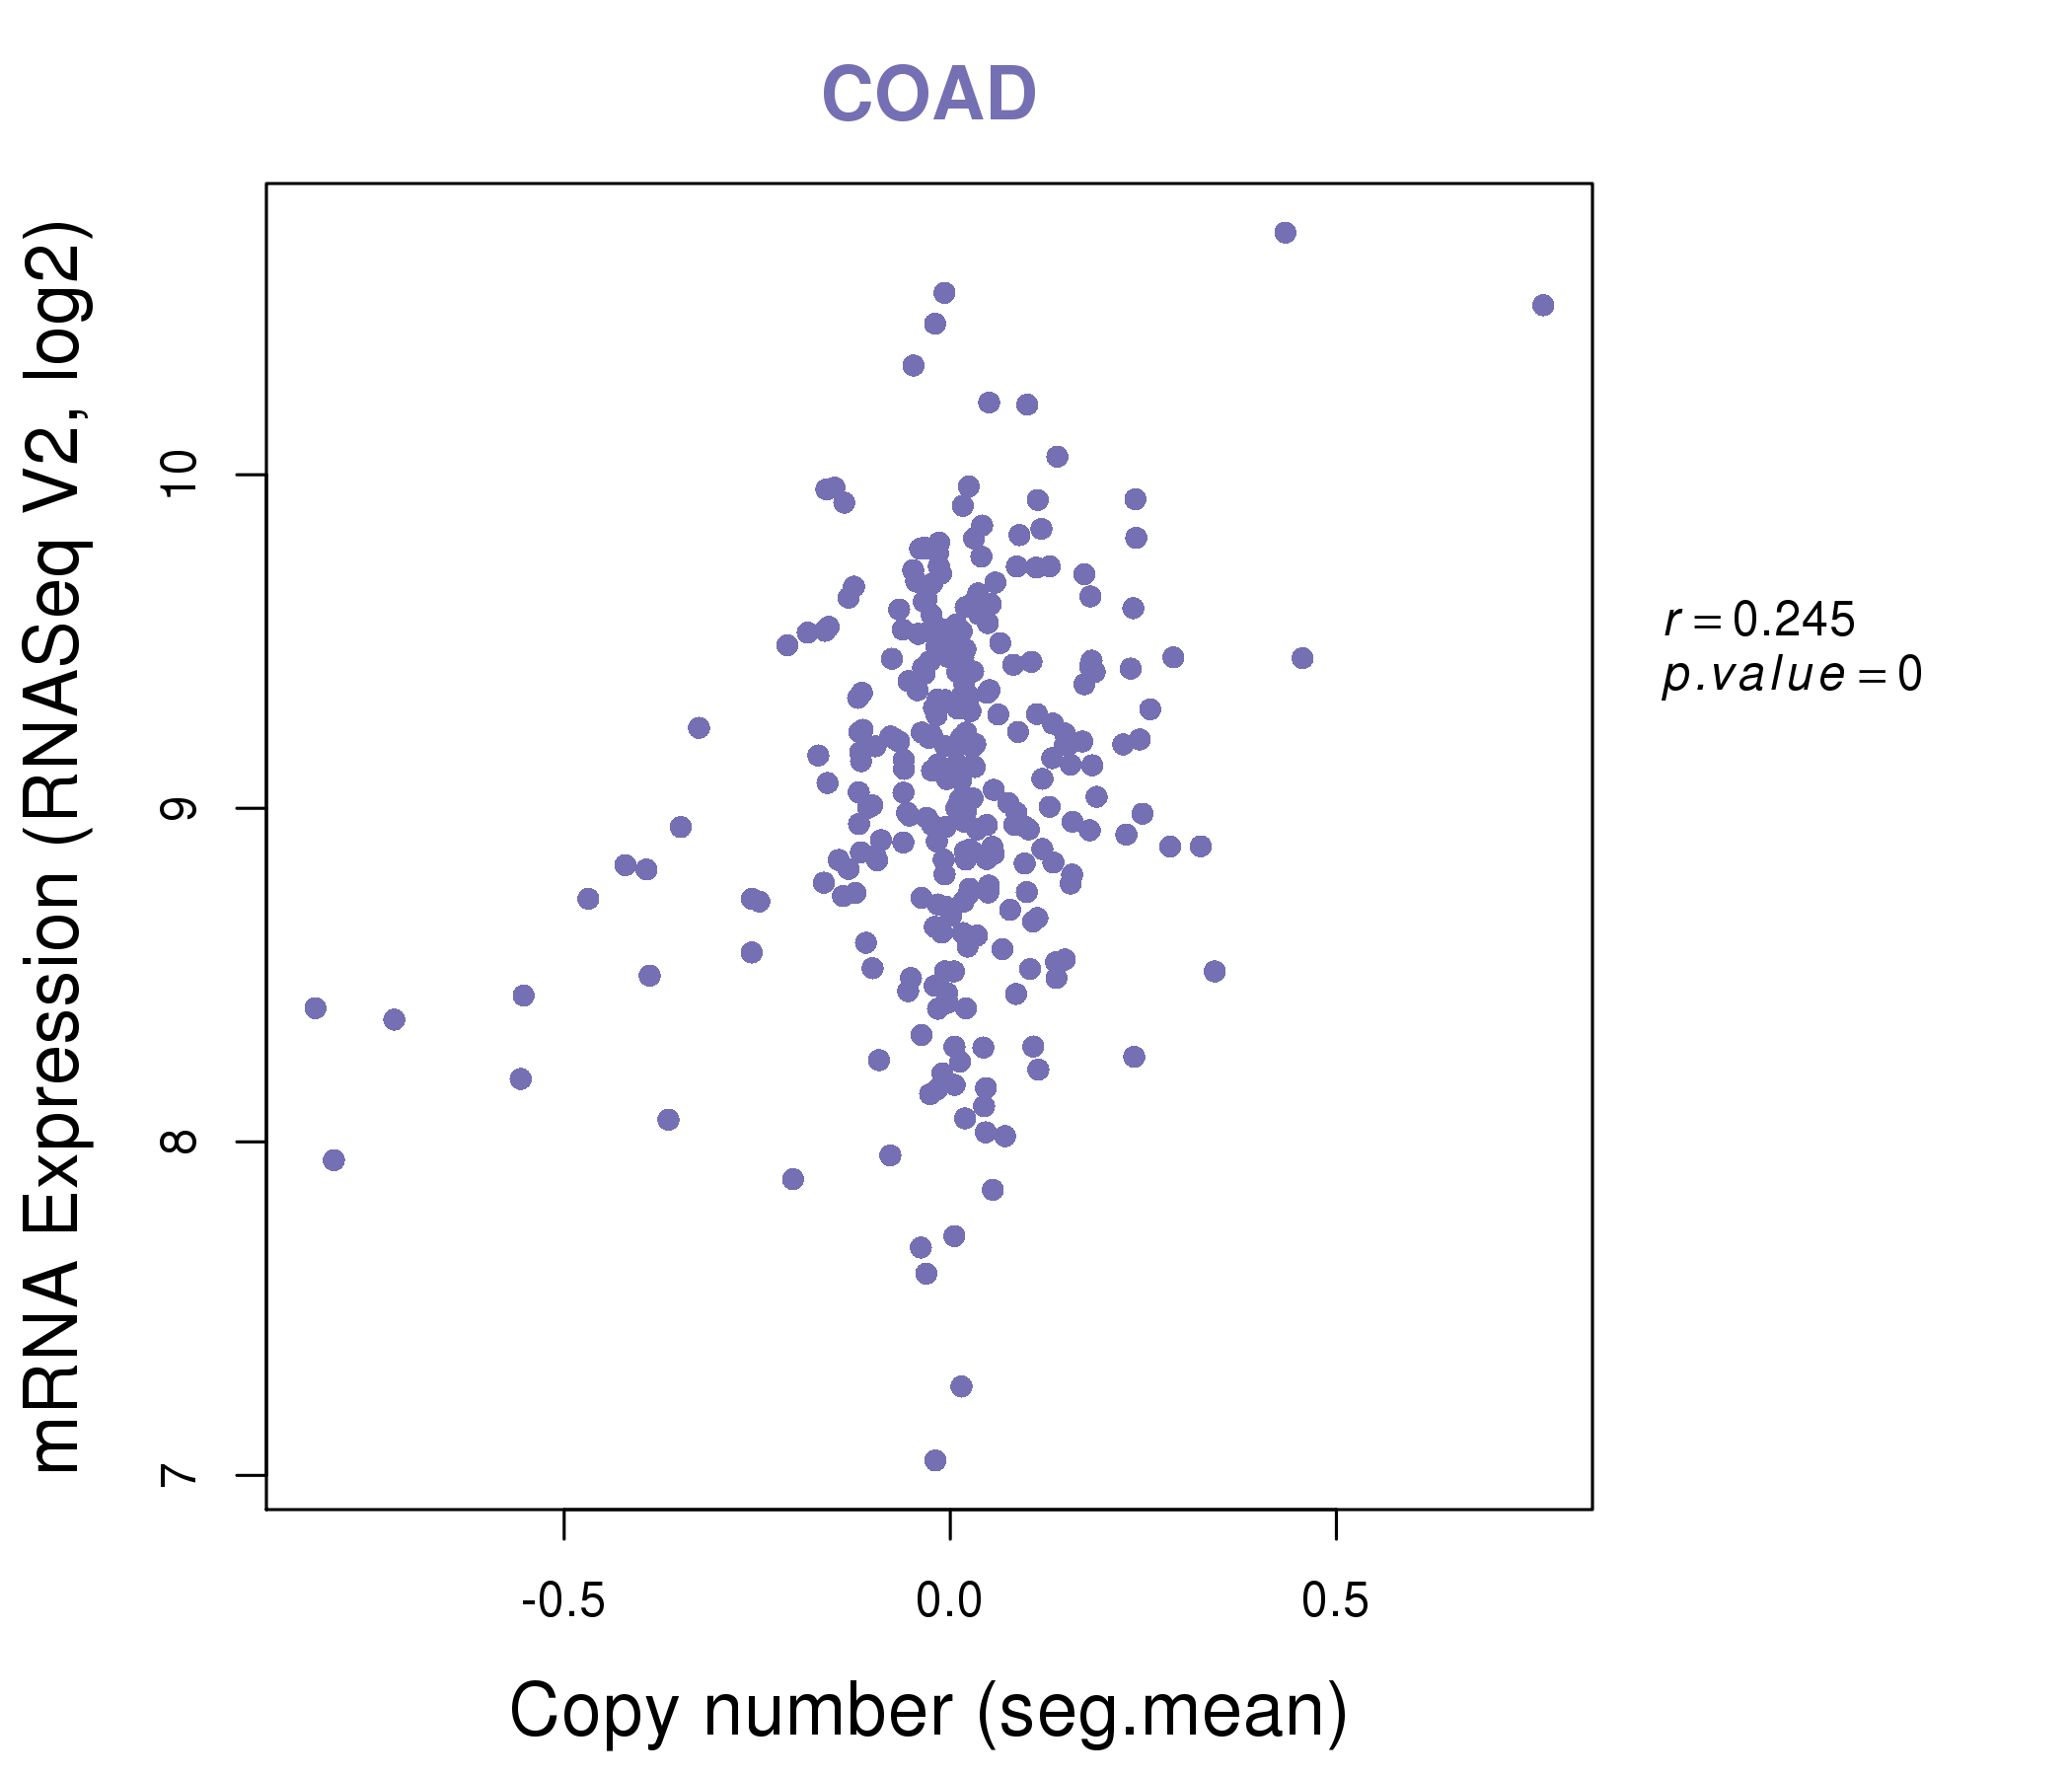
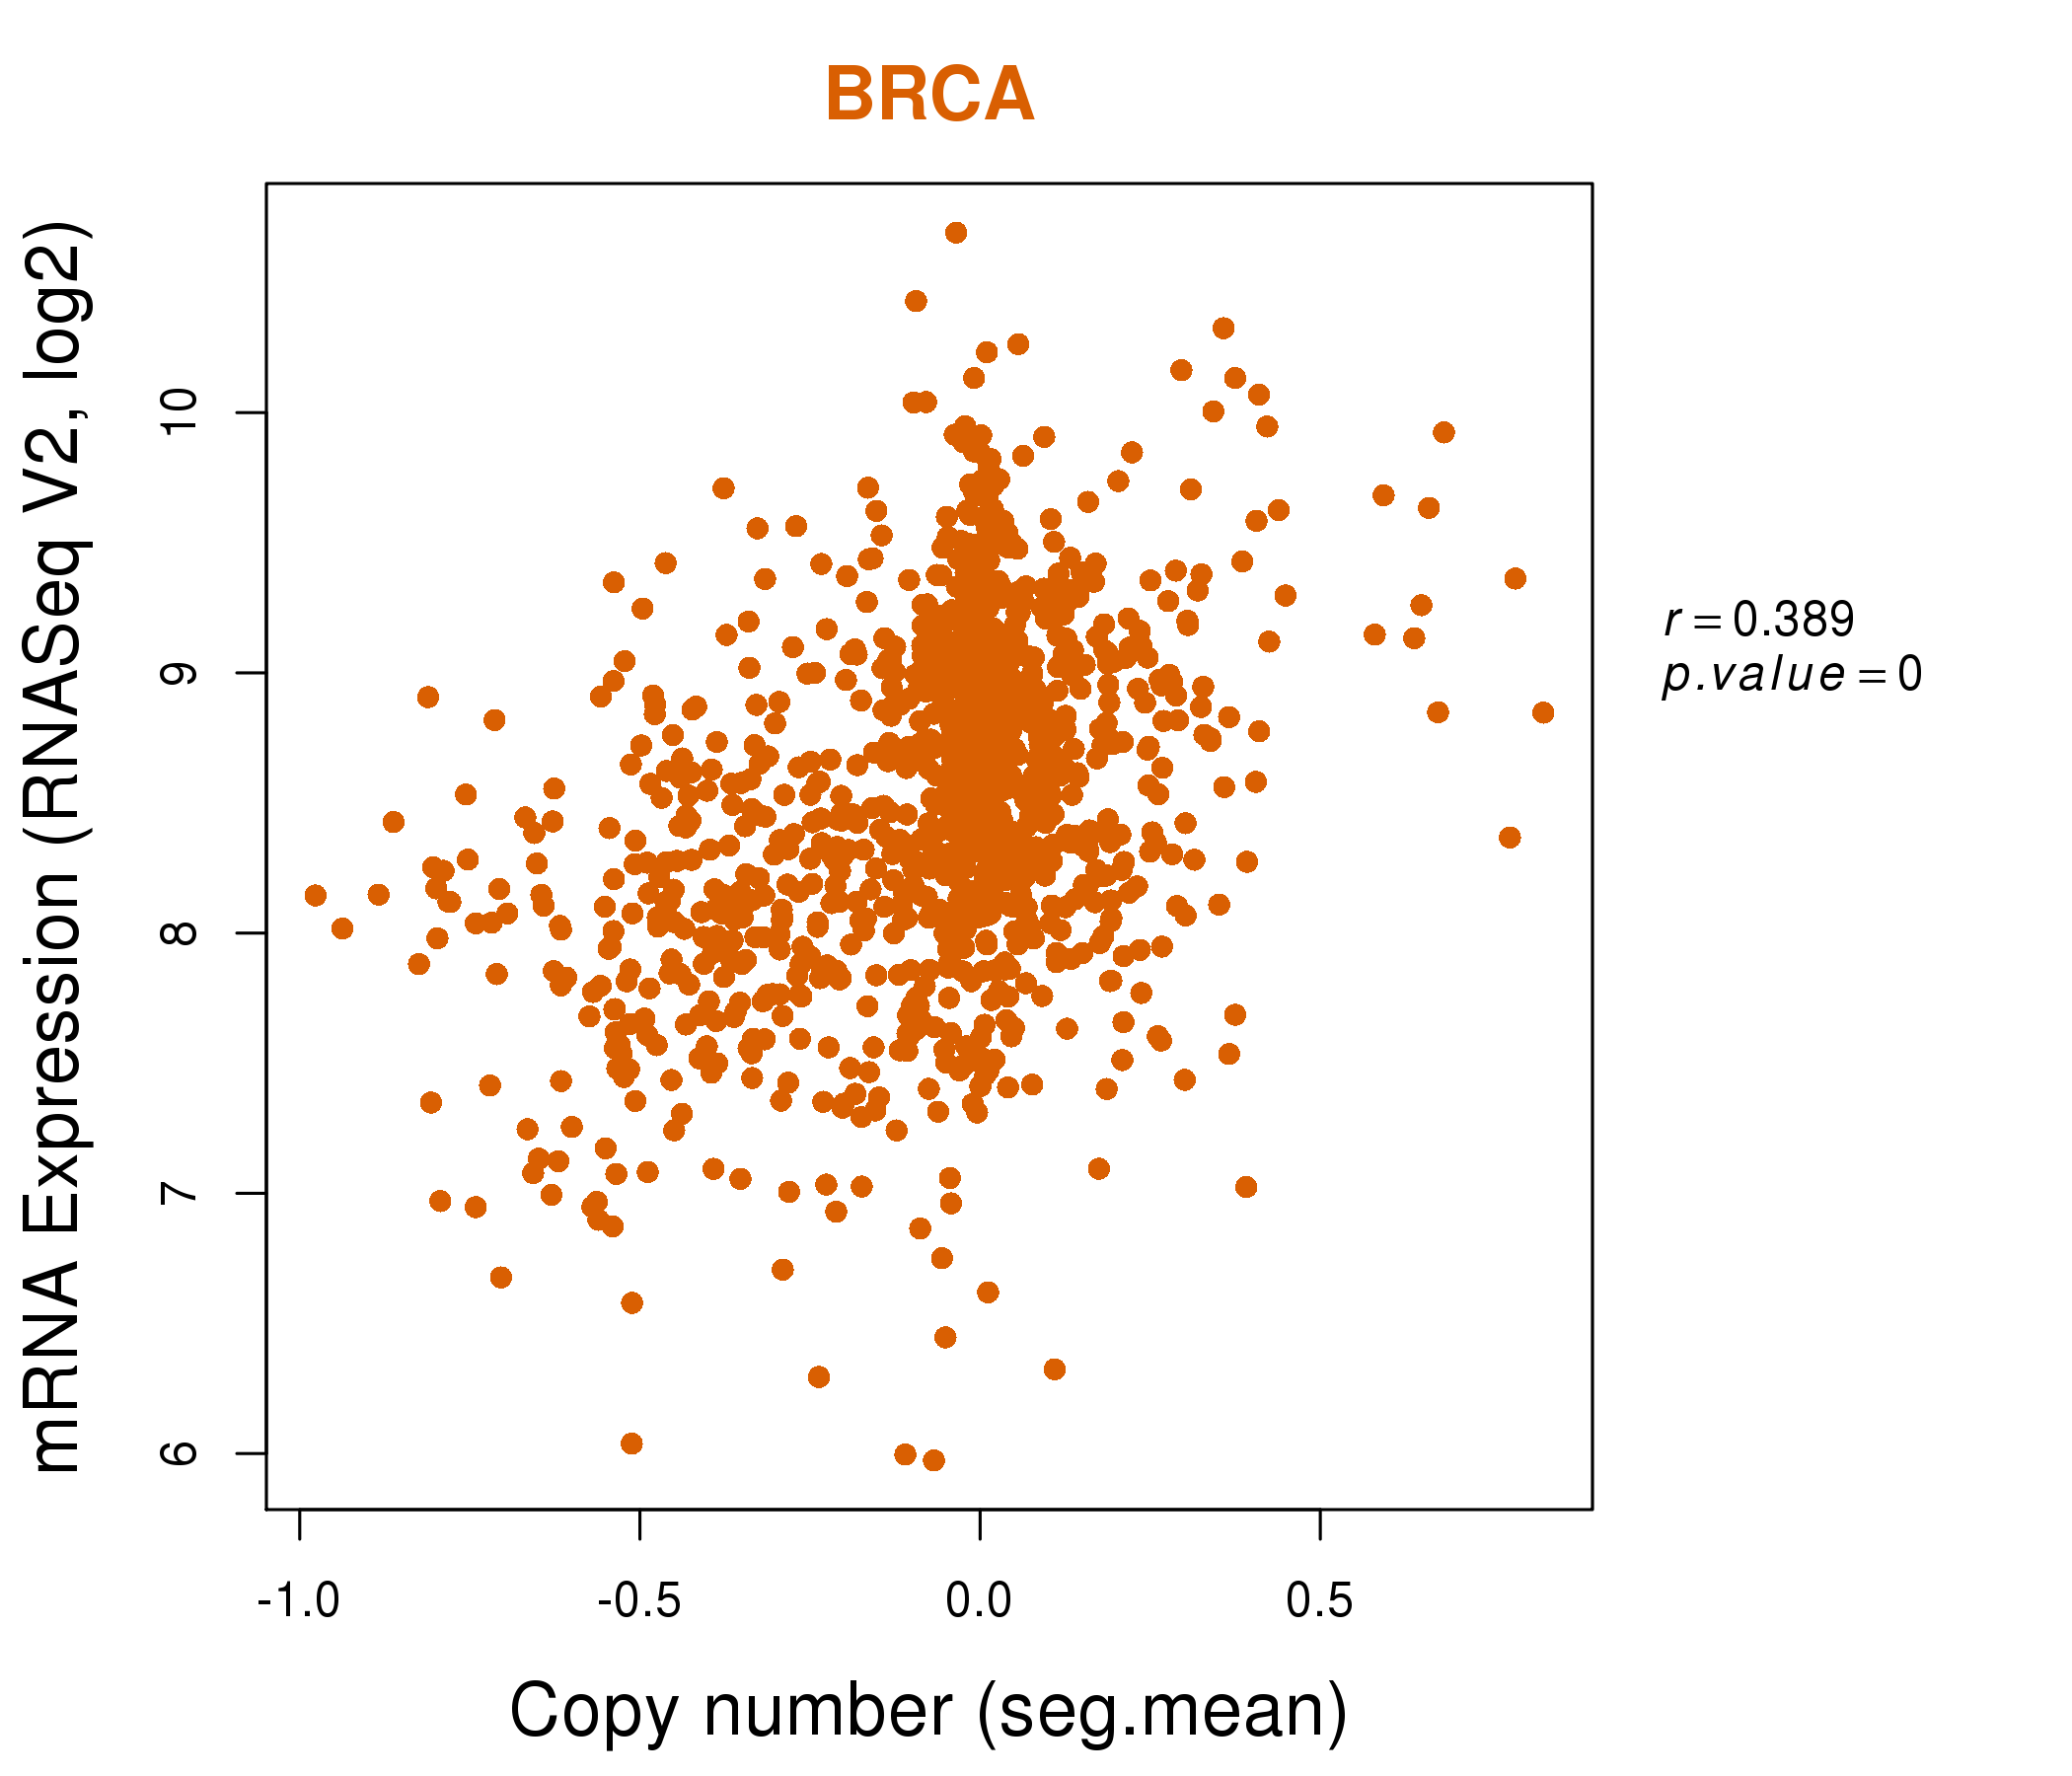
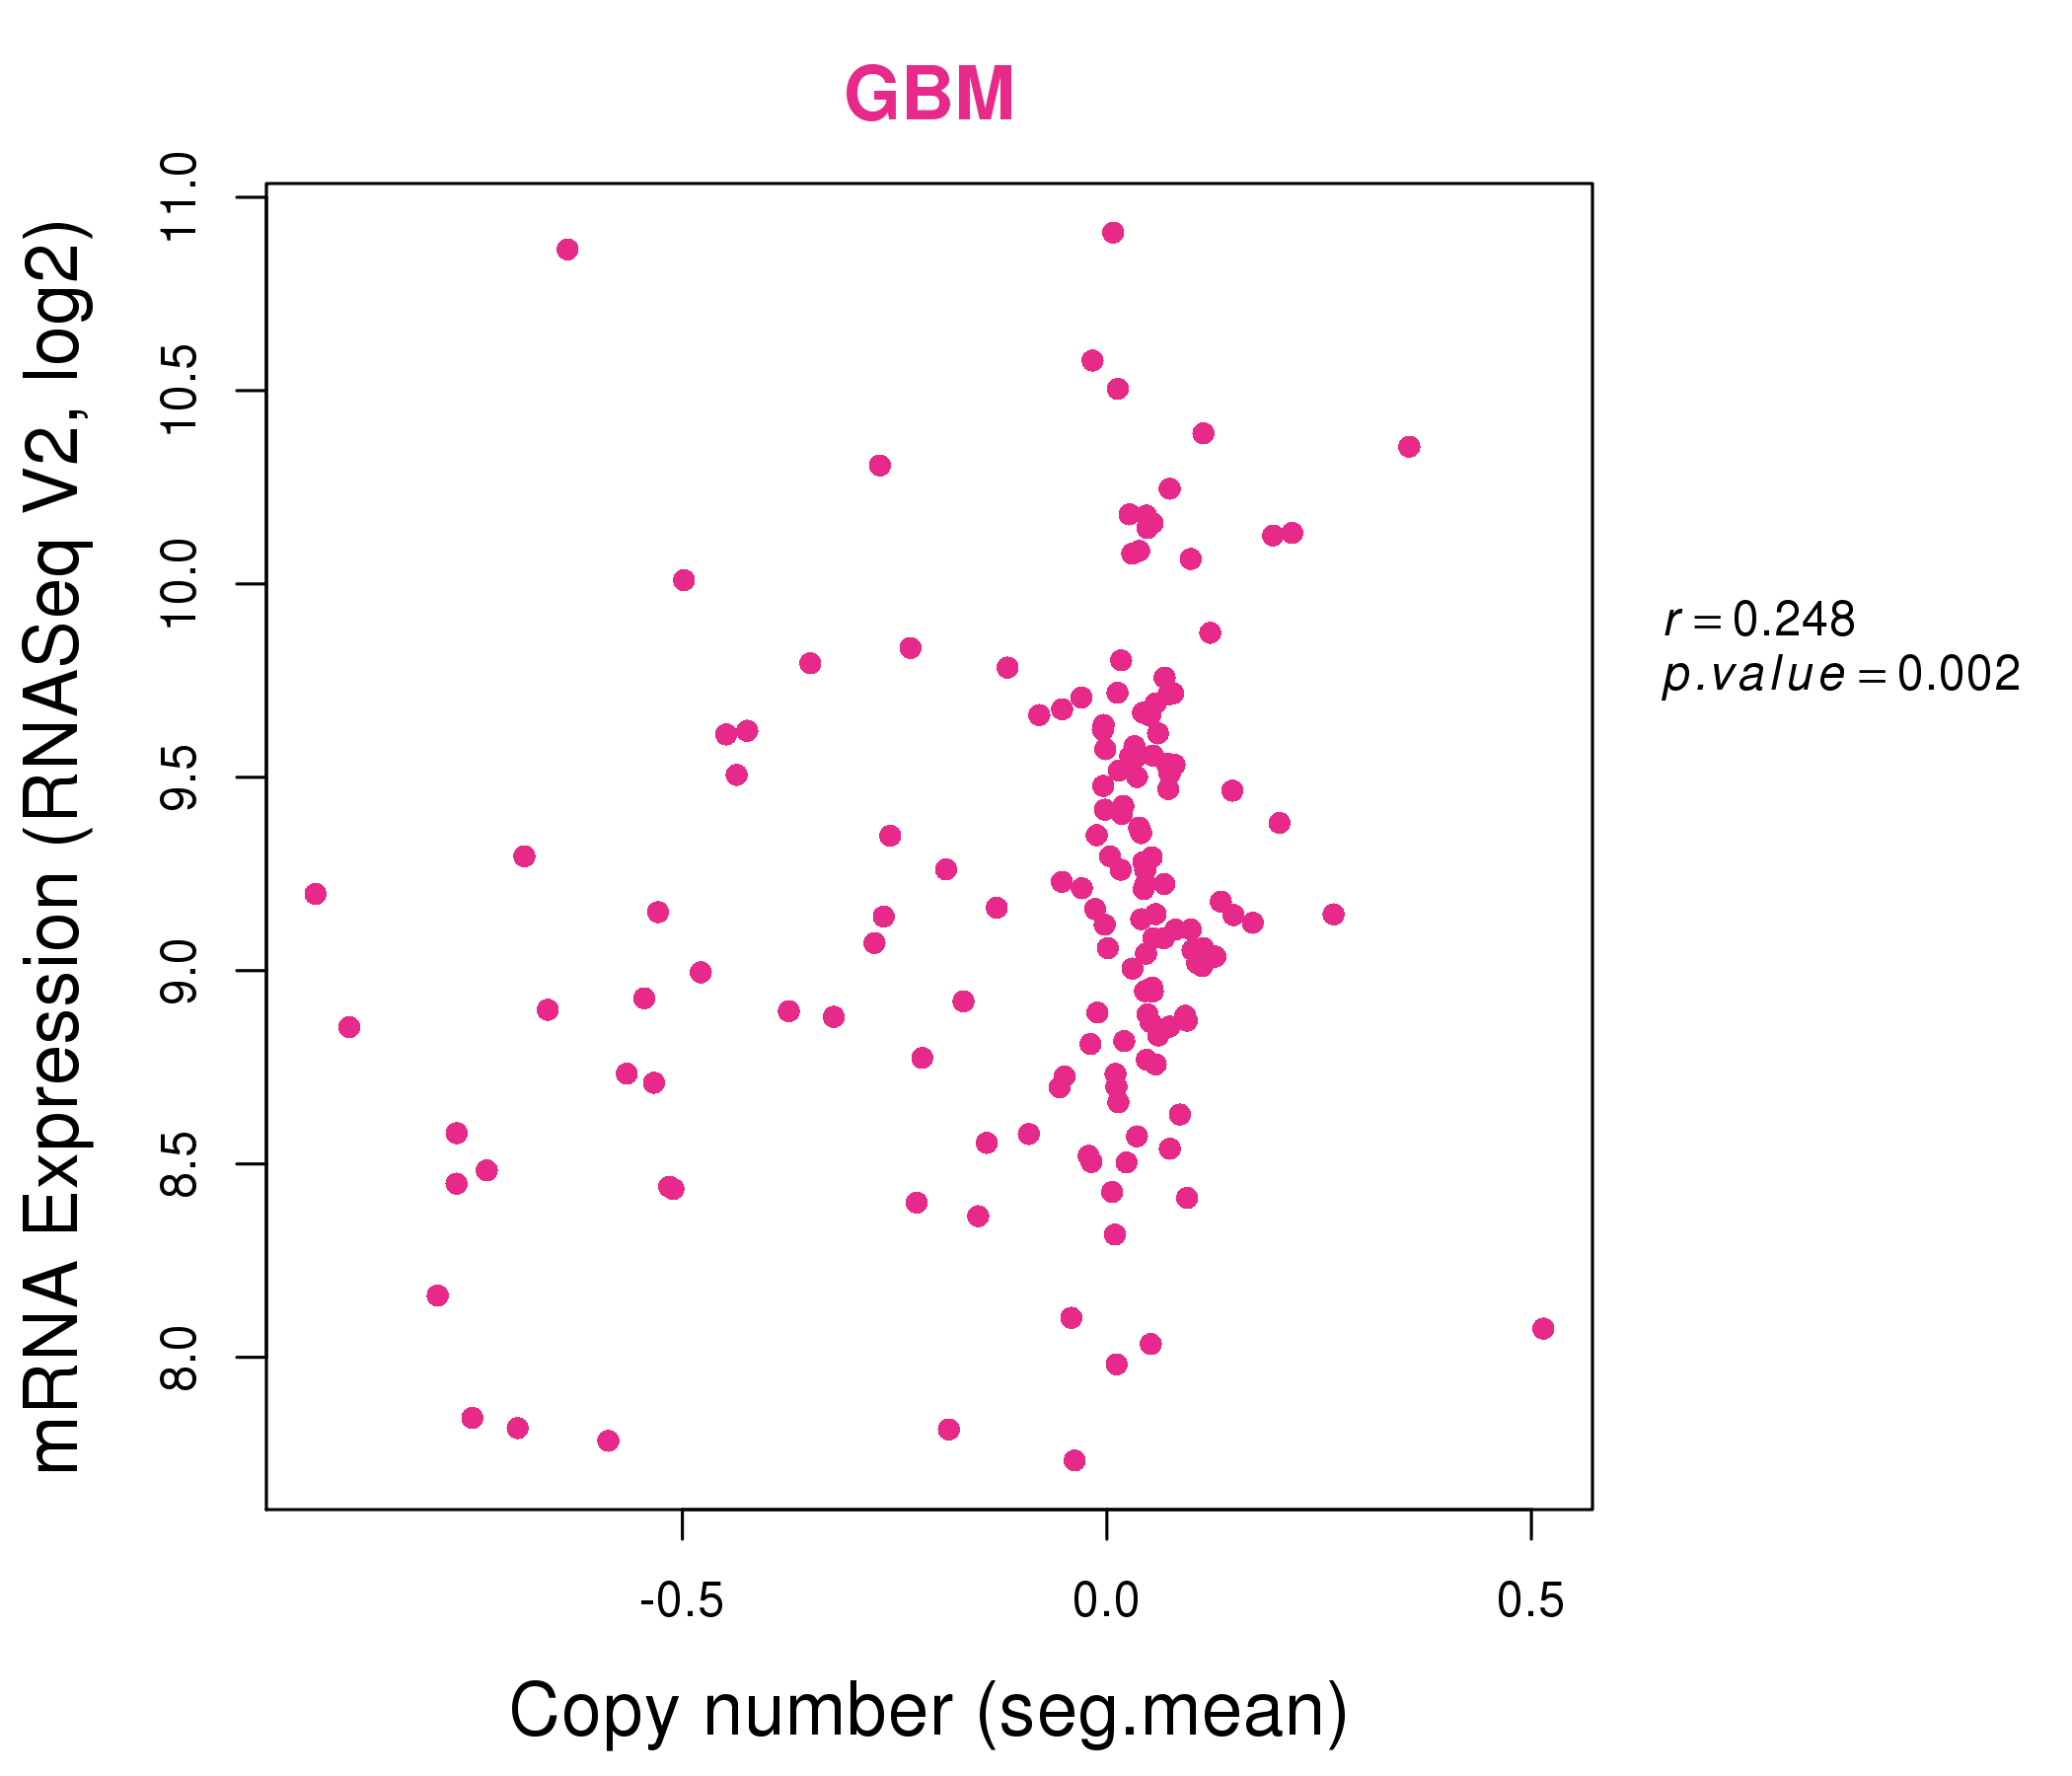
| * This plots show the correlation between CNV and gene expression. |
: Open all plots for all cancer types
 |
|
 |
|
| Top |
| Gene-Gene Network Information |
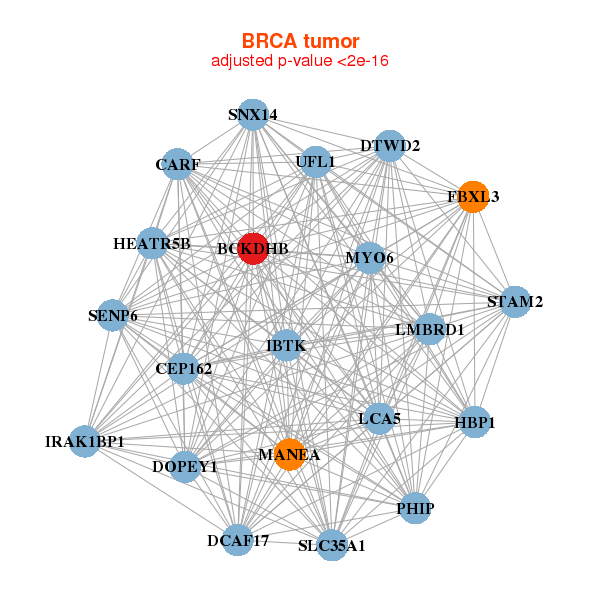
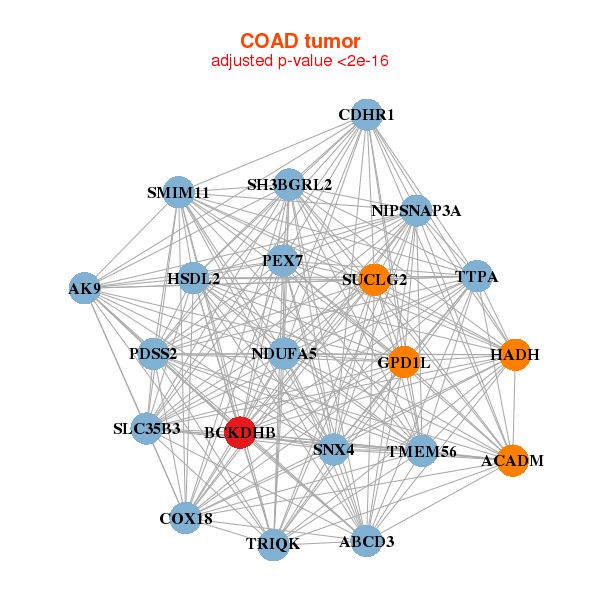
| * Co-Expression network figures were drawn using R package igraph. Only the top 20 genes with the highest correlations were shown. Red circle: input gene, orange circle: cell metabolism gene, sky circle: other gene |
: Open all plots for all cancer types
 |
|
| CARF,BCKDHB,DCAF17,DOPEY1,DTWD2,FBXL3,HBP1, HEATR5B,IBTK,IRAK1BP1,UFL1,CEP162,LCA5,LMBRD1, MANEA,MYO6,PHIP,SENP6,SLC35A1,SNX14,STAM2 | AASS,ACSS3,ACVR1C,ALDH6A1,BCKDHB,CALCRL,RHOV___CHP1, CSPG5,DNAH9,EYS,GYS2,LPIN1,MAP3K5,MCCC1, MOGAT1,PDK1,PLCXD1,RNF125,ST3GAL6,STOX1,USP30 |
 |
|
| ABCD3,ACADM,AK9,BCKDHB,TRIQK,CDHR1,COX18, SMIM11,GPD1L,HADH,HSDL2,NDUFA5,NIPSNAP3A,PDSS2, PEX7,SH3BGRL2,SLC35B3,SNX4,SUCLG2,TMEM56,TTPA | ATP5F1,BCKDHB,BZW2,TMEM251,KATNBL1,CAAP1,CD9, DRD5,DTWD2,MICU2,MGC87042,MRPL35,MRPS33,NIPSNAP3A, OXSM,PDHX,SLC37A2,STEAP1,TMED5,TMEM38B,TMEM68 |
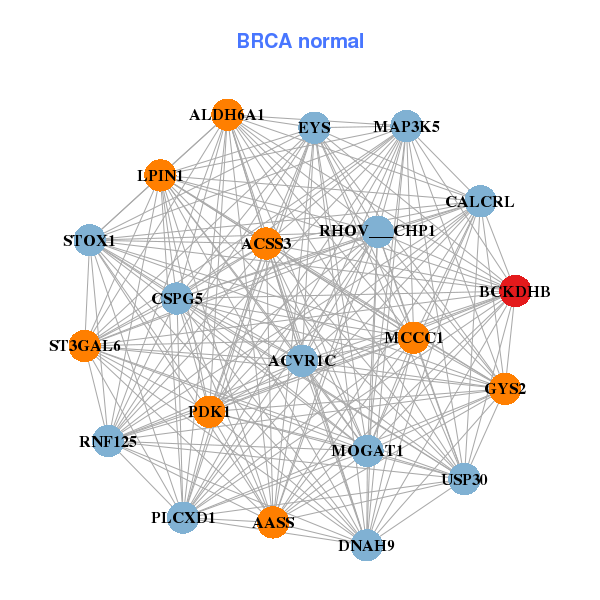
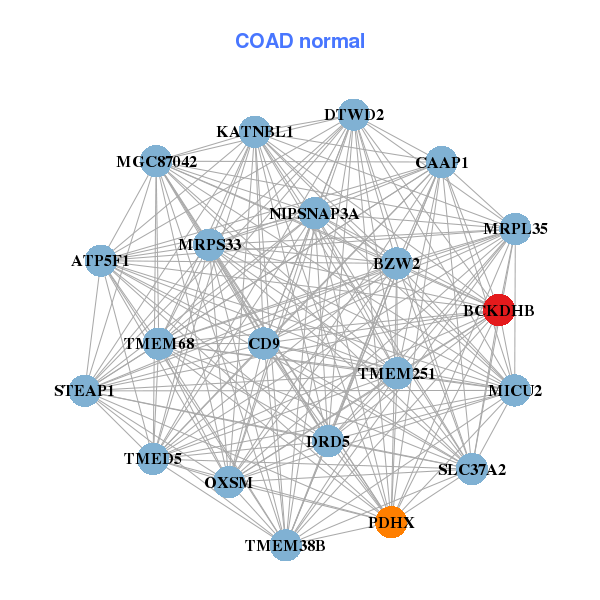
| * Co-Expression network figures were drawn using R package igraph. Only the top 20 genes with the highest correlations were shown. Red circle: input gene, orange circle: cell metabolism gene, sky circle: other gene |
: Open all plots for all cancer types
| Top |
: Open all interacting genes' information including KEGG pathway for all interacting genes from DAVID
| Top |
| Pharmacological Information for BCKDHB |
| There's no related Drug. |
| Top |
| Cross referenced IDs for BCKDHB |
| * We obtained these cross-references from Uniprot database. It covers 150 different DBs, 18 categories. http://www.uniprot.org/help/cross_references_section |
: Open all cross reference information
|
Copyright © 2016-Present - The Univsersity of Texas Health Science Center at Houston @ |