|
||||||||||||||||||||
| |
| Phenotypic Information (metabolism pathway, cancer, disease, phenome) |
| |
| |
| Gene-Gene Network Information: Co-Expression Network, Interacting Genes & KEGG |
| |
|


| Gene Summary for ACTB |
| Basic gene info. | Gene symbol | ACTB |
| Gene name | actin, beta | |
| Synonyms | BRWS1|PS1TP5BP1 | |
| Cytomap | UCSC genome browser: 7p22 | |
| Genomic location | chr7 :5566778-5570232 | |
| Type of gene | protein-coding | |
| RefGenes | NM_001101.3, | |
| Ensembl id | ENSG00000075624 | |
| Description | PS1TP5-binding protein 1actin, cytoplasmic 1beta cytoskeletal actin | |
| Modification date | 20141207 | |
| dbXrefs | MIM : 102630 | |
| HGNC : HGNC | ||
| Ensembl : ENSG00000075624 | ||
| HPRD : 00032 | ||
| Vega : OTTHUMG00000023268 | ||
| Protein | UniProt: P60709 go to UniProt's Cross Reference DB Table | |
| Expression | CleanEX: HS_ACTB | |
| BioGPS: 60 | ||
| Gene Expression Atlas: ENSG00000075624 | ||
| The Human Protein Atlas: ENSG00000075624 | ||
| Pathway | NCI Pathway Interaction Database: ACTB | |
| KEGG: ACTB | ||
| REACTOME: ACTB | ||
| ConsensusPathDB | ||
| Pathway Commons: ACTB | ||
| Metabolism | MetaCyc: ACTB | |
| HUMANCyc: ACTB | ||
| Regulation | Ensembl's Regulation: ENSG00000075624 | |
| miRBase: chr7 :5,566,778-5,570,232 | ||
| TargetScan: NM_001101 | ||
| cisRED: ENSG00000075624 | ||
| Context | iHOP: ACTB | |
| cancer metabolism search in PubMed: ACTB | ||
| UCL Cancer Institute: ACTB | ||
| Assigned class in ccmGDB | A - This gene has a literature evidence and it belongs to cancer gene. | |
| References showing role of ACTB in cancer cell metabolism | 1. Carrascoso I, Sanchez-Jimenez C, Izquierdo JM (2014) Long-term reduction of T-cell intracellular antigens leads to increased beta-actin expression. Mol Cancer 13: 90. doi: 10.1186/1476-4598-13-90. pmid: 4113145. go to article 2. Mandelbaum J, Rollins N, Shah P, Bowman D, Lee JY, et al. (2015) Identification of a lung cancer cell line deficient in atg7-dependent autophagy. Autophagy: 0. doi: 10.1080/15548627.2015.1056966. go to article | |
| Top |
| Phenotypic Information for ACTB(metabolism pathway, cancer, disease, phenome) |
| Cancer | CGAP: ACTB |
| Familial Cancer Database: ACTB | |
| * This gene is included in those cancer gene databases. |
|
|
|
|
|
| . | ||||||||||||||
Oncogene 1 | Significant driver gene in | |||||||||||||||||||
| cf) number; DB name 1 Oncogene; http://nar.oxfordjournals.org/content/35/suppl_1/D721.long, 2 Tumor Suppressor gene; https://bioinfo.uth.edu/TSGene/, 3 Cancer Gene Census; http://www.nature.com/nrc/journal/v4/n3/abs/nrc1299.html, 4 CancerGenes; http://nar.oxfordjournals.org/content/35/suppl_1/D721.long, 5 Network of Cancer Gene; http://ncg.kcl.ac.uk/index.php, 1Therapeutic Vulnerabilities in Cancer; http://cbio.mskcc.org/cancergenomics/statius/ |
| REACTOME_METABOLISM_OF_PROTEINS | |
| OMIM | 102630; gene. 102630; gene. 243310; phenotype. 243310; phenotype. 607371; phenotype. 607371; phenotype. |
| Orphanet | 2995; Baraitser-Winter syndrome. 2995; Baraitser-Winter syndrome. 79107; Developmental malformations - deafness - dystonia. 79107; Developmental malformations - deafness - dystonia. |
| Disease | KEGG Disease: ACTB |
| MedGen: ACTB (Human Medical Genetics with Condition) | |
| ClinVar: ACTB | |
| Phenotype | MGI: ACTB (International Mouse Phenotyping Consortium) |
| PhenomicDB: ACTB | |
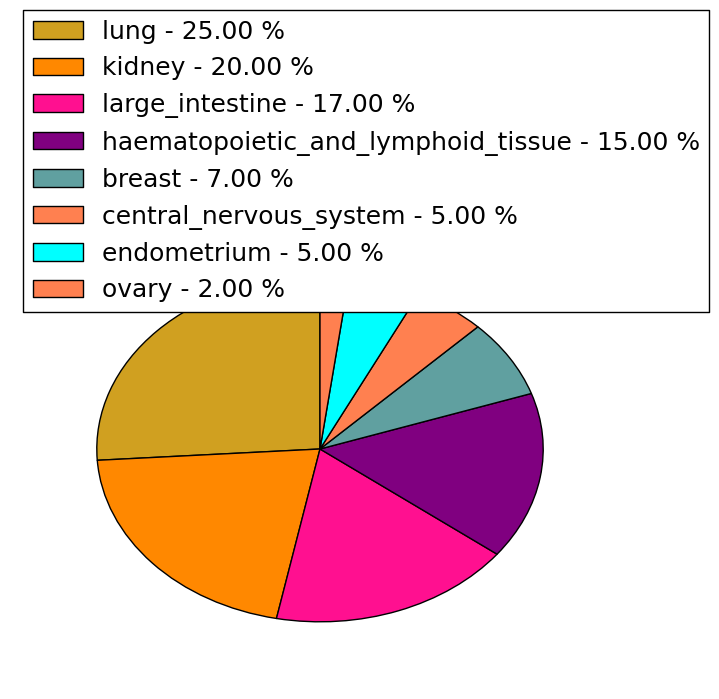
| Mutations for ACTB |
| * Under tables are showing count per each tissue to give us broad intuition about tissue specific mutation patterns.You can go to the detailed page for each mutation database's web site. |
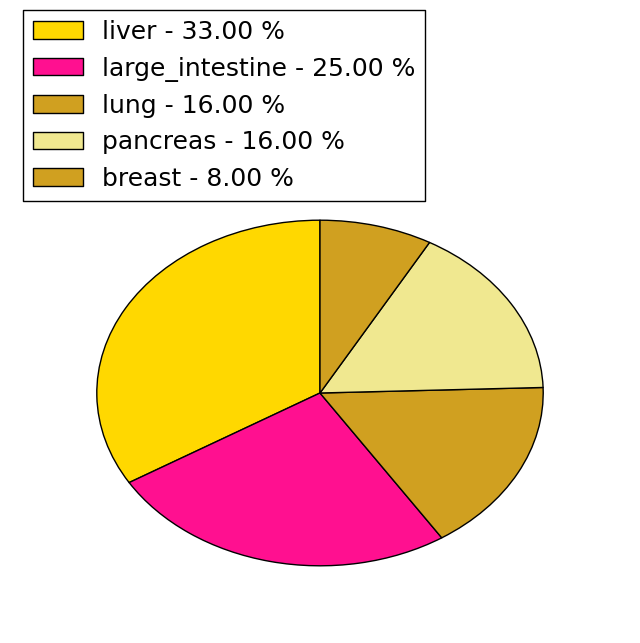
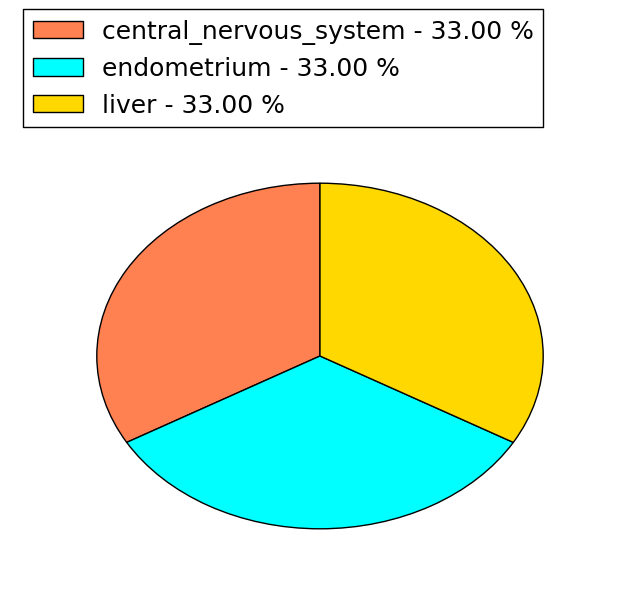
| - Statistics for Tissue and Mutation type | Top |
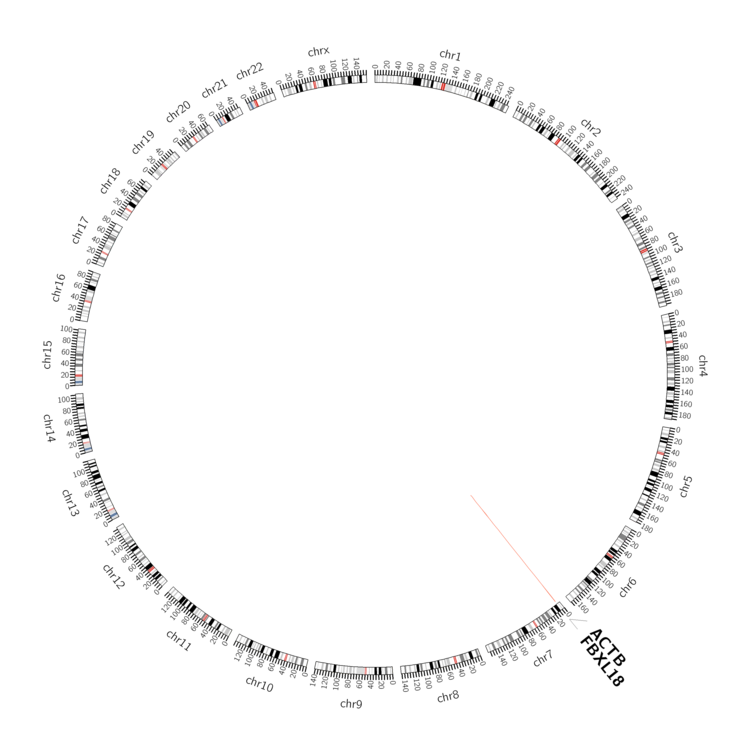 |
| - For Inter-chromosomal Variations |
| There's no inter-chromosomal structural variation. |
| - For Intra-chromosomal Variations |
| * Intra-chromosomal variantions includes 'intrachromosomal amplicon to amplicon', 'intrachromosomal amplicon to non-amplified dna', 'intrachromosomal deletion', 'intrachromosomal fold-back inversion', 'intrachromosomal inversion', 'intrachromosomal tandem duplication', 'Intrachromosomal unknown type', 'intrachromosomal with inverted orientation', 'intrachromosomal with non-inverted orientation'. |
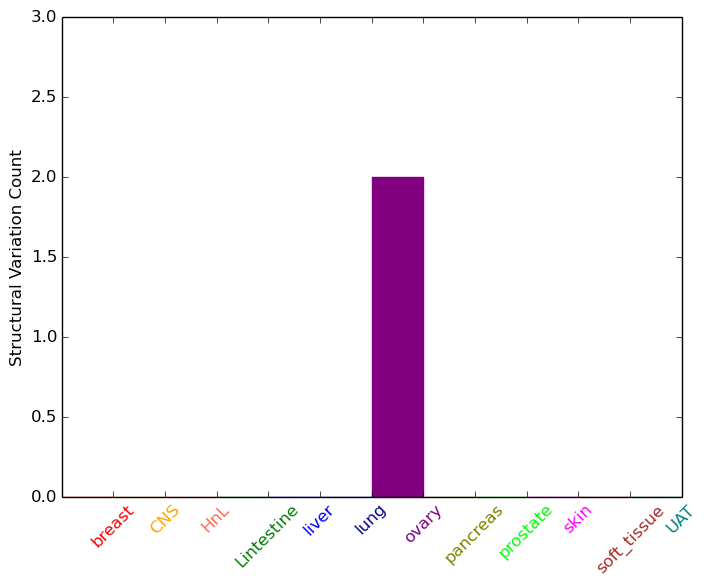 |
| Sample | Symbol_a | Chr_a | Start_a | End_a | Symbol_b | Chr_b | Start_b | End_b |
| ovary | ACTB | chr7 | 5566807 | 5566827 | FBXL18 | chr7 | 5529569 | 5529589 |
| ovary | ACTB | chr7 | 5568945 | 5568965 | chr7 | 5508454 | 5508474 |
| cf) Tissue number; Tissue name (1;Breast, 2;Central_nervous_system, 3;Haematopoietic_and_lymphoid_tissue, 4;Large_intestine, 5;Liver, 6;Lung, 7;Ovary, 8;Pancreas, 9;Prostate, 10;Skin, 11;Soft_tissue, 12;Upper_aerodigestive_tract) |
| * From mRNA Sanger sequences, Chitars2.0 arranged chimeric transcripts. This table shows ACTB related fusion information. |
| ID | Head Gene | Tail Gene | Accession | Gene_a | qStart_a | qEnd_a | Chromosome_a | tStart_a | tEnd_a | Gene_a | qStart_a | qEnd_a | Chromosome_a | tStart_a | tEnd_a |
| BG874502 | ACTB | 27 | 349 | 7 | 5567659 | 5568077 | ISY1-RAB43 | 349 | 399 | 3 | 128849393 | 128849443 | |
| BG773769 | ACTB | 2 | 272 | 7 | 5568957 | 5570222 | RPS16 | 272 | 538 | 19 | 39924323 | 39926573 | |
| DA891854 | ACTB | 1 | 332 | 7 | 5568907 | 5570232 | ACO2 | 331 | 486 | 22 | 41903933 | 41907914 | |
| BP379102 | ACTB | 1 | 419 | 7 | 5568820 | 5570232 | BSG | 419 | 568 | 19 | 580716 | 581397 | |
| DA501316 | ACTB | 1 | 144 | 7 | 5569229 | 5570232 | LOC100507412 | 138 | 569 | ? | 110001 | 110430 | |
| BP371810 | ACTB | 1 | 434 | 7 | 5568805 | 5570232 | LOC100507412 | 431 | 581 | ? | 110070 | 110220 | |
| BP286903 | ACTB | 1 | 341 | 7 | 5568898 | 5570232 | THBS3 | 341 | 578 | 1 | 155176037 | 155178773 | |
| BF213980 | LOC100507412 | 1 | 47 | ? | 110244 | 110290 | ACTB | 46 | 603 | 7 | 5567187 | 5567947 | |
| BP309743 | ACTB | 1 | 341 | 7 | 5568898 | 5570232 | LOC100507412 | 338 | 583 | ? | 117691 | 117936 | |
| BQ321009 | PITPNA | 5 | 79 | 17 | 1444890 | 1451611 | ACTB | 78 | 339 | 7 | 5567303 | 5567674 | |
| BM352323 | ACTB | 1 | 437 | 7 | 5568039 | 5568916 | HERPUD2 | 438 | 519 | 7 | 35672919 | 35673000 | |
| DB103450 | SNHG1 | 1 | 63 | 11 | 62621138 | 62621200 | ACTB | 64 | 559 | 7 | 5568300 | 5570230 | |
| BG473536 | ACTB | 2 | 273 | 7 | 5568957 | 5570222 | RPS16 | 273 | 685 | 19 | 39923982 | 39926573 | |
| BI019526 | VAMP2 | 33 | 111 | 17 | 8066213 | 8066292 | ACTB | 102 | 208 | 7 | 5566931 | 5567037 | |
| BE732178 | ACTB | 1 | 248 | 7 | 5568957 | 5570201 | RPS16 | 248 | 764 | 19 | 39923872 | 39926573 | |
| BI019850 | ACTB | 8 | 184 | 7 | 5567982 | 5568158 | ACTB | 167 | 360 | 7 | 5567767 | 5568066 | |
| AW949281 | ACTB | 1 | 151 | 7 | 5567263 | 5567413 | OSBPL3 | 140 | 209 | 7 | 24887256 | 24969581 | |
| BG258572 | ACTB | 16 | 159 | 7 | 5569193 | 5570198 | ACTB | 158 | 737 | 7 | 5568049 | 5569213 | |
| BE707882 | ACTB | 1 | 142 | 7 | 5568826 | 5568971 | AGAP1 | 132 | 156 | 2 | 237015903 | 237015931 | |
| BQ320988 | ACTB | 1 | 179 | 7 | 5568201 | 5568820 | FMN1 | 179 | 464 | 15 | 33261500 | 33357202 | |
| AW970008 | TSNARE1 | 79 | 221 | 8 | 143454297 | 143454439 | ACTB | 219 | 401 | 7 | 5567479 | 5567773 | |
| BF376499 | JPH3 | 54 | 401 | 16 | 87715487 | 87715835 | ACTB | 387 | 485 | 7 | 5567174 | 5567272 | |
| AW803684 | SPTLC2 | 14 | 107 | 14 | 77972428 | 77972521 | ACTB | 92 | 182 | 7 | 5567258 | 5567348 | |
| DA184434 | ACTB | 2 | 217 | 7 | 5568981 | 5570190 | CBX5 | 216 | 518 | 12 | 54624817 | 54625118 | |
| BI063294 | ACTB | 11 | 317 | 7 | 5567357 | 5567775 | SUPV3L1 | 309 | 385 | 10 | 70967584 | 70967660 | |
| BF803193 | MAOA | 15 | 235 | X | 43601227 | 43603397 | ACTB | 229 | 334 | 7 | 5567911 | 5568016 | |
| BE828383 | ACTB | 38 | 232 | 7 | 5567368 | 5567674 | HIPK2 | 227 | 249 | 7 | 139477503 | 139477526 | |
| DA571523 | LOC100507412 | 3 | 103 | ? | 117006 | 117106 | ACTB | 103 | 699 | 7 | 5568260 | 5570232 | |
| Top |
| There's no copy number variation information in COSMIC data for this gene. |
| Top |
|
 |
| Top |
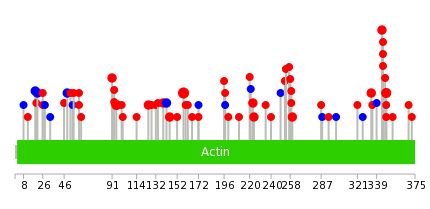
| Stat. for Non-Synonymous SNVs (# total SNVs=39) | (# total SNVs=12) |
 |  |
(# total SNVs=3) | (# total SNVs=0) |
 |
| Top |
| * When you move the cursor on each content, you can see more deailed mutation information on the Tooltip. Those are primary_site,primary_histology,mutation(aa),pubmedID. |
| GRCh37 position | Mutation(aa) | Unique sampleID count |
| chr7:5569032-5569032 | p.? | 12 |
| chr7:5568242-5568242 | p.G158R | 5 |
| chr7:5567464-5567464 | p.S348L | 4 |
| chr7:5568871-5568871 | p.R95H | 3 |
| chr7:5569232-5569232 | p.A19A | 2 |
| chr7:5567507-5567507 | p.E334K | 2 |
| chr7:5569008-5569008 | p.Q49Q | 2 |
| chr7:5568280-5568280 | p.S145F | 2 |
| chr7:5568290-5568290 | p.L142L | 2 |
| chr7:5568878-5568878 | p.E93Q | 2 |
| Top |
|
 |
| Point Mutation/ Tissue ID | 1 | 2 | 3 | 4 | 5 | 6 | 7 | 8 | 9 | 10 | 11 | 12 | 13 | 14 | 15 | 16 | 17 | 18 | 19 | 20 |
| # sample | 4 | 3 | 1 | 5 | 2 | 3 | 4 | 1 | 1 | 5 | 7 | 1 | 2 | |||||||
| # mutation | 3 | 3 | 1 | 5 | 2 | 3 | 4 | 1 | 1 | 5 | 8 | 1 | 2 | |||||||
| nonsynonymous SNV | 3 | 2 | 1 | 4 | 2 | 3 | 4 | 1 | 1 | 4 | 6 | 1 | 2 | |||||||
| synonymous SNV | 1 | 1 | 1 | 2 |
| cf) Tissue ID; Tissue type (1; BLCA[Bladder Urothelial Carcinoma], 2; BRCA[Breast invasive carcinoma], 3; CESC[Cervical squamous cell carcinoma and endocervical adenocarcinoma], 4; COAD[Colon adenocarcinoma], 5; GBM[Glioblastoma multiforme], 6; Glioma Low Grade, 7; HNSC[Head and Neck squamous cell carcinoma], 8; KICH[Kidney Chromophobe], 9; KIRC[Kidney renal clear cell carcinoma], 10; KIRP[Kidney renal papillary cell carcinoma], 11; LAML[Acute Myeloid Leukemia], 12; LUAD[Lung adenocarcinoma], 13; LUSC[Lung squamous cell carcinoma], 14; OV[Ovarian serous cystadenocarcinoma ], 15; PAAD[Pancreatic adenocarcinoma], 16; PRAD[Prostate adenocarcinoma], 17; SKCM[Skin Cutaneous Melanoma], 18:STAD[Stomach adenocarcinoma], 19:THCA[Thyroid carcinoma], 20:UCEC[Uterine Corpus Endometrial Carcinoma]) |
| Top |
| * We represented just top 10 SNVs. When you move the cursor on each content, you can see more deailed mutation information on the Tooltip. Those are primary_site, primary_histology, mutation(aa), pubmedID. |
| Genomic Position | Mutation(aa) | Unique sampleID count |
| chr7:5567464 | p.S348L | 2 |
| chr7:5567953 | p.S348P | 1 |
| chr7:5568218 | p.G197G | 1 |
| chr7:5568970 | p.S60G | 1 |
| chr7:5567995 | p.V339A | 1 |
| chr7:5568236 | p.G197D | 1 |
| chr7:5567465 | p.V54V | 1 |
| chr7:5568977 | p.R335P | 1 |
| chr7:5568044 | p.R196C | 1 |
| chr7:5568242 | p.G46D | 1 |
| * Copy number data were extracted from TCGA using R package TCGA-Assembler. The URLs of all public data files on TCGA DCC data server were gathered on Jan-05-2015. Function ProcessCNAData in TCGA-Assembler package was used to obtain gene-level copy number value which is calculated as the average copy number of the genomic region of a gene. |
 |
| cf) Tissue ID[Tissue type]: BLCA[Bladder Urothelial Carcinoma], BRCA[Breast invasive carcinoma], CESC[Cervical squamous cell carcinoma and endocervical adenocarcinoma], COAD[Colon adenocarcinoma], GBM[Glioblastoma multiforme], Glioma Low Grade, HNSC[Head and Neck squamous cell carcinoma], KICH[Kidney Chromophobe], KIRC[Kidney renal clear cell carcinoma], KIRP[Kidney renal papillary cell carcinoma], LAML[Acute Myeloid Leukemia], LUAD[Lung adenocarcinoma], LUSC[Lung squamous cell carcinoma], OV[Ovarian serous cystadenocarcinoma ], PAAD[Pancreatic adenocarcinoma], PRAD[Prostate adenocarcinoma], SKCM[Skin Cutaneous Melanoma], STAD[Stomach adenocarcinoma], THCA[Thyroid carcinoma], UCEC[Uterine Corpus Endometrial Carcinoma] |
| Top |
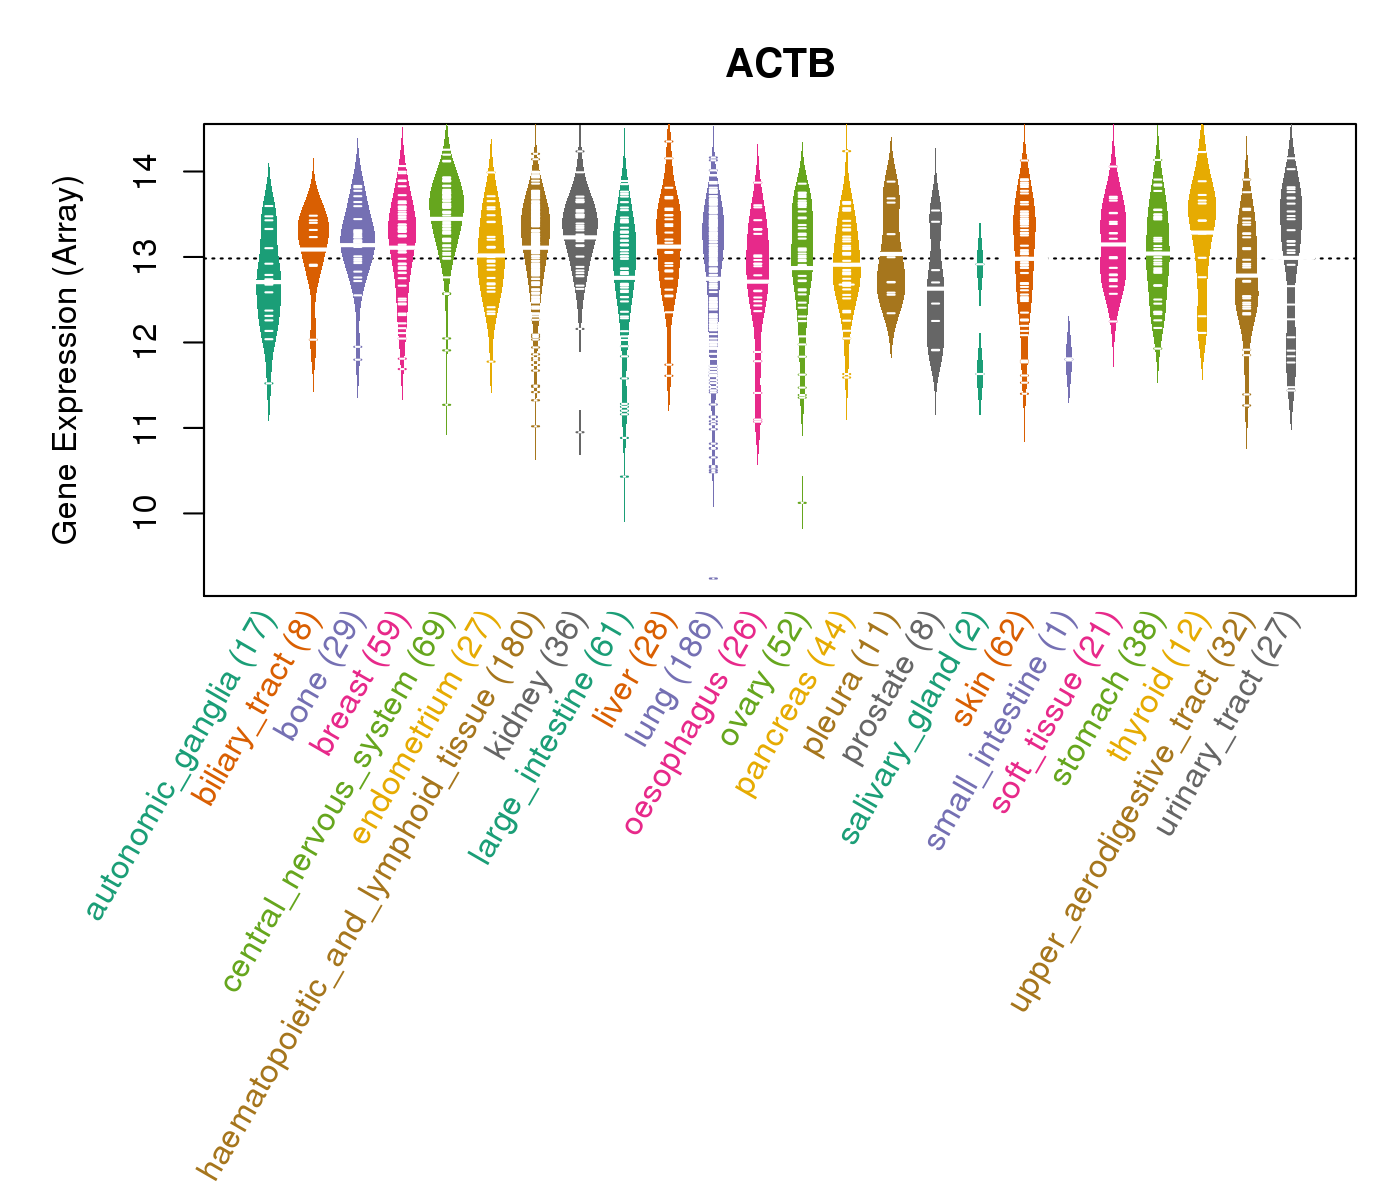
| Gene Expression for ACTB |
| * CCLE gene expression data were extracted from CCLE_Expression_Entrez_2012-10-18.res: Gene-centric RMA-normalized mRNA expression data. |
 |
| * Normalized gene expression data of RNASeqV2 was extracted from TCGA using R package TCGA-Assembler. The URLs of all public data files on TCGA DCC data server were gathered at Jan-05-2015. Only eight cancer types have enough normal control samples for differential expression analysis. (t test, adjusted p<0.05 (using Benjamini-Hochberg FDR)) |
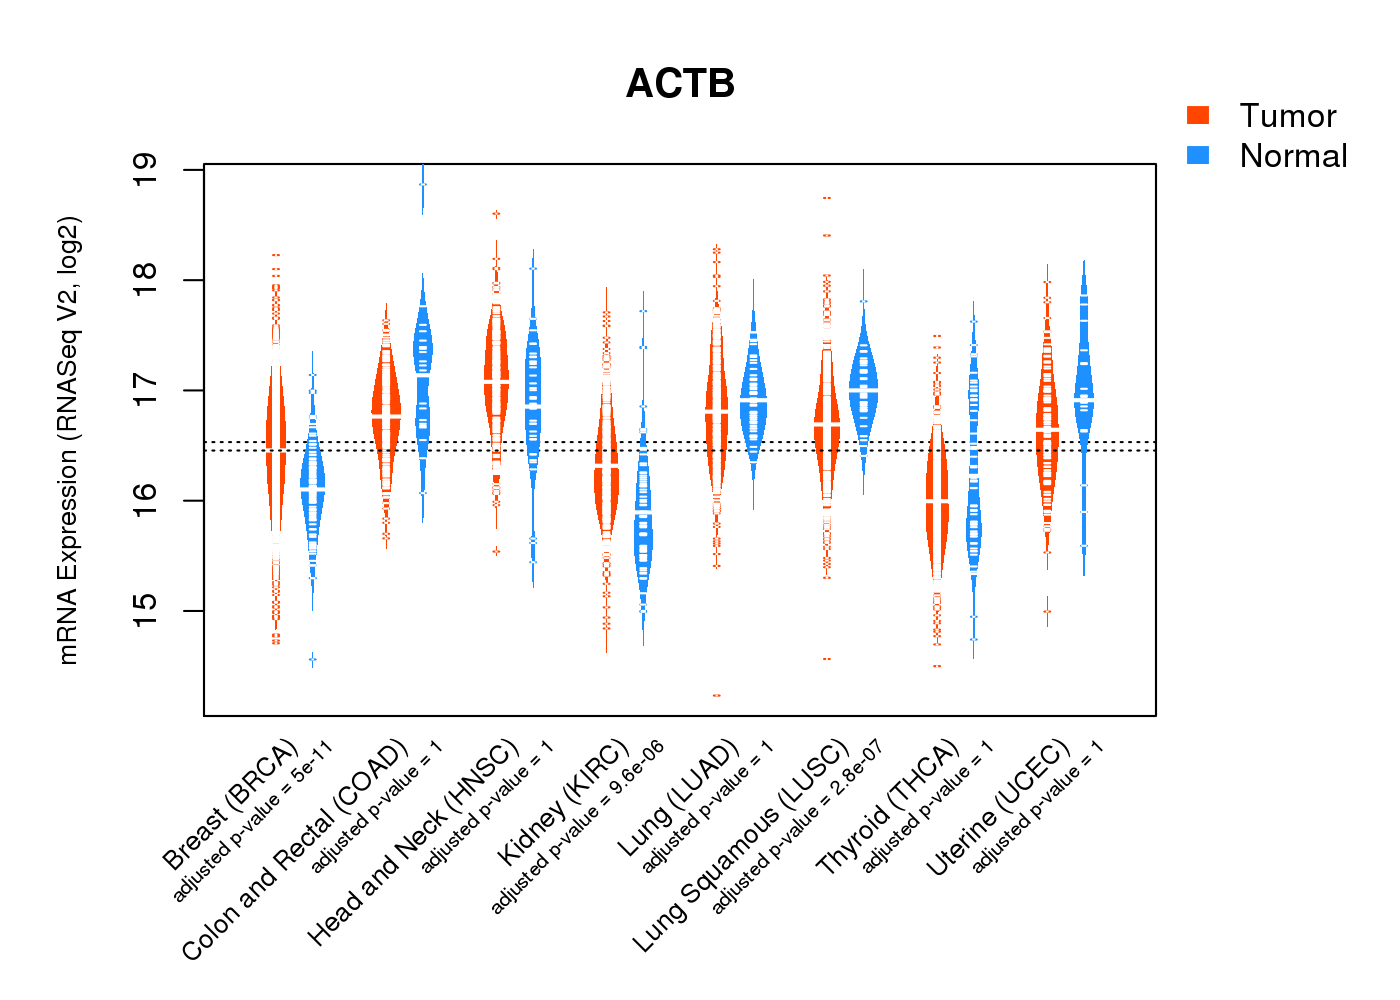 |
| Top |
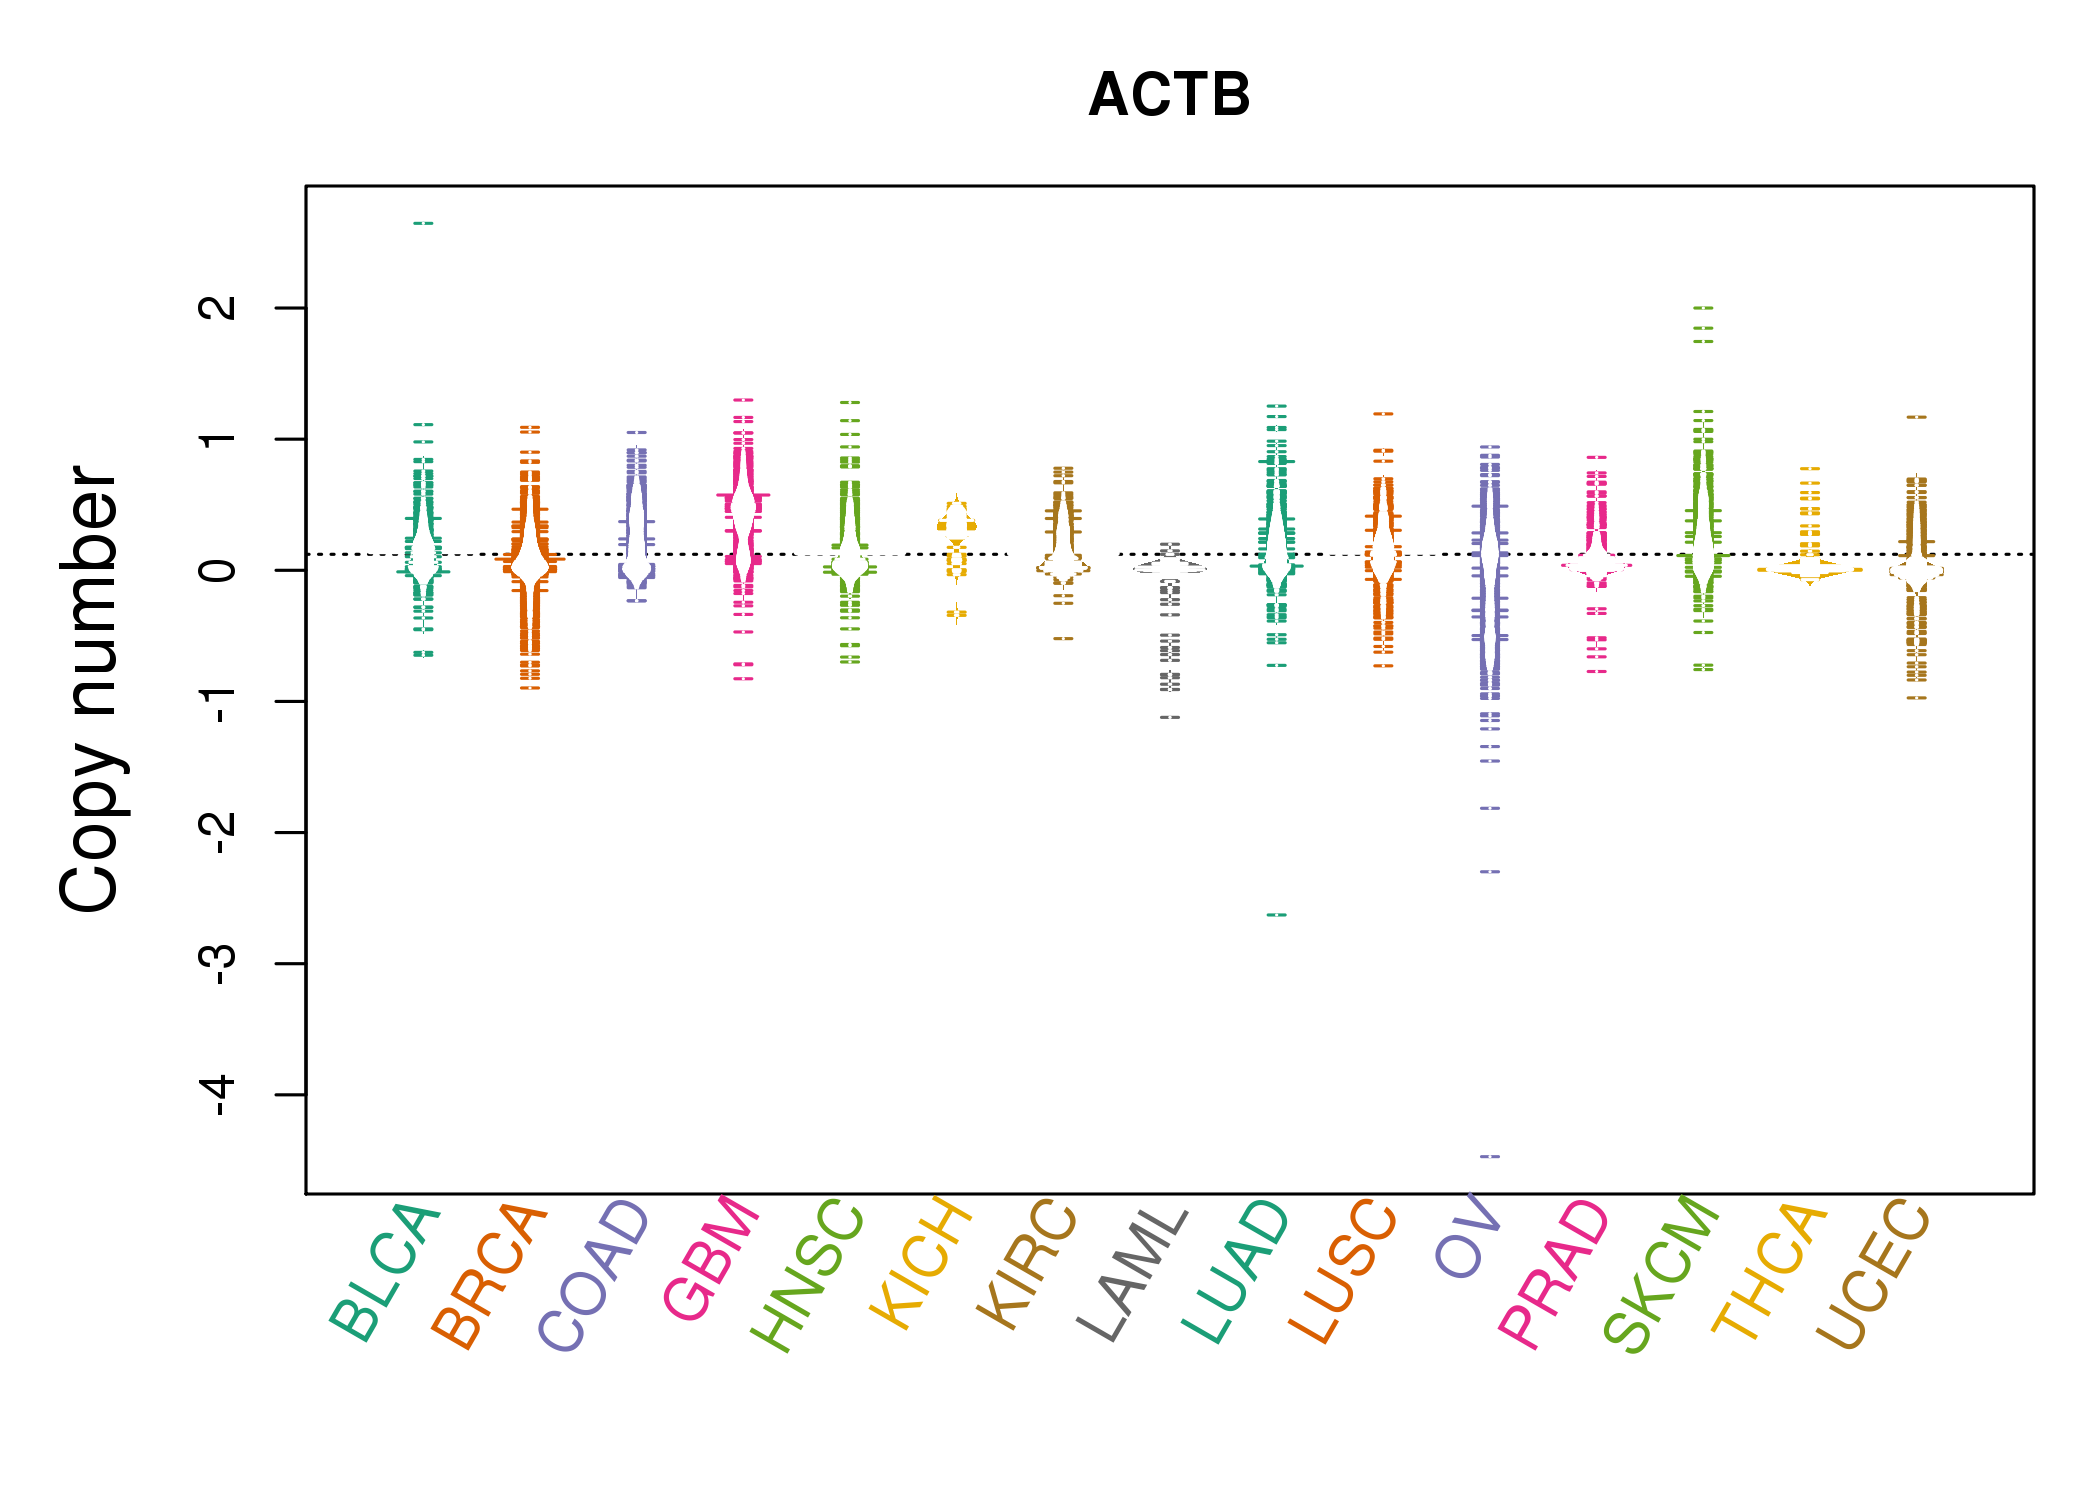
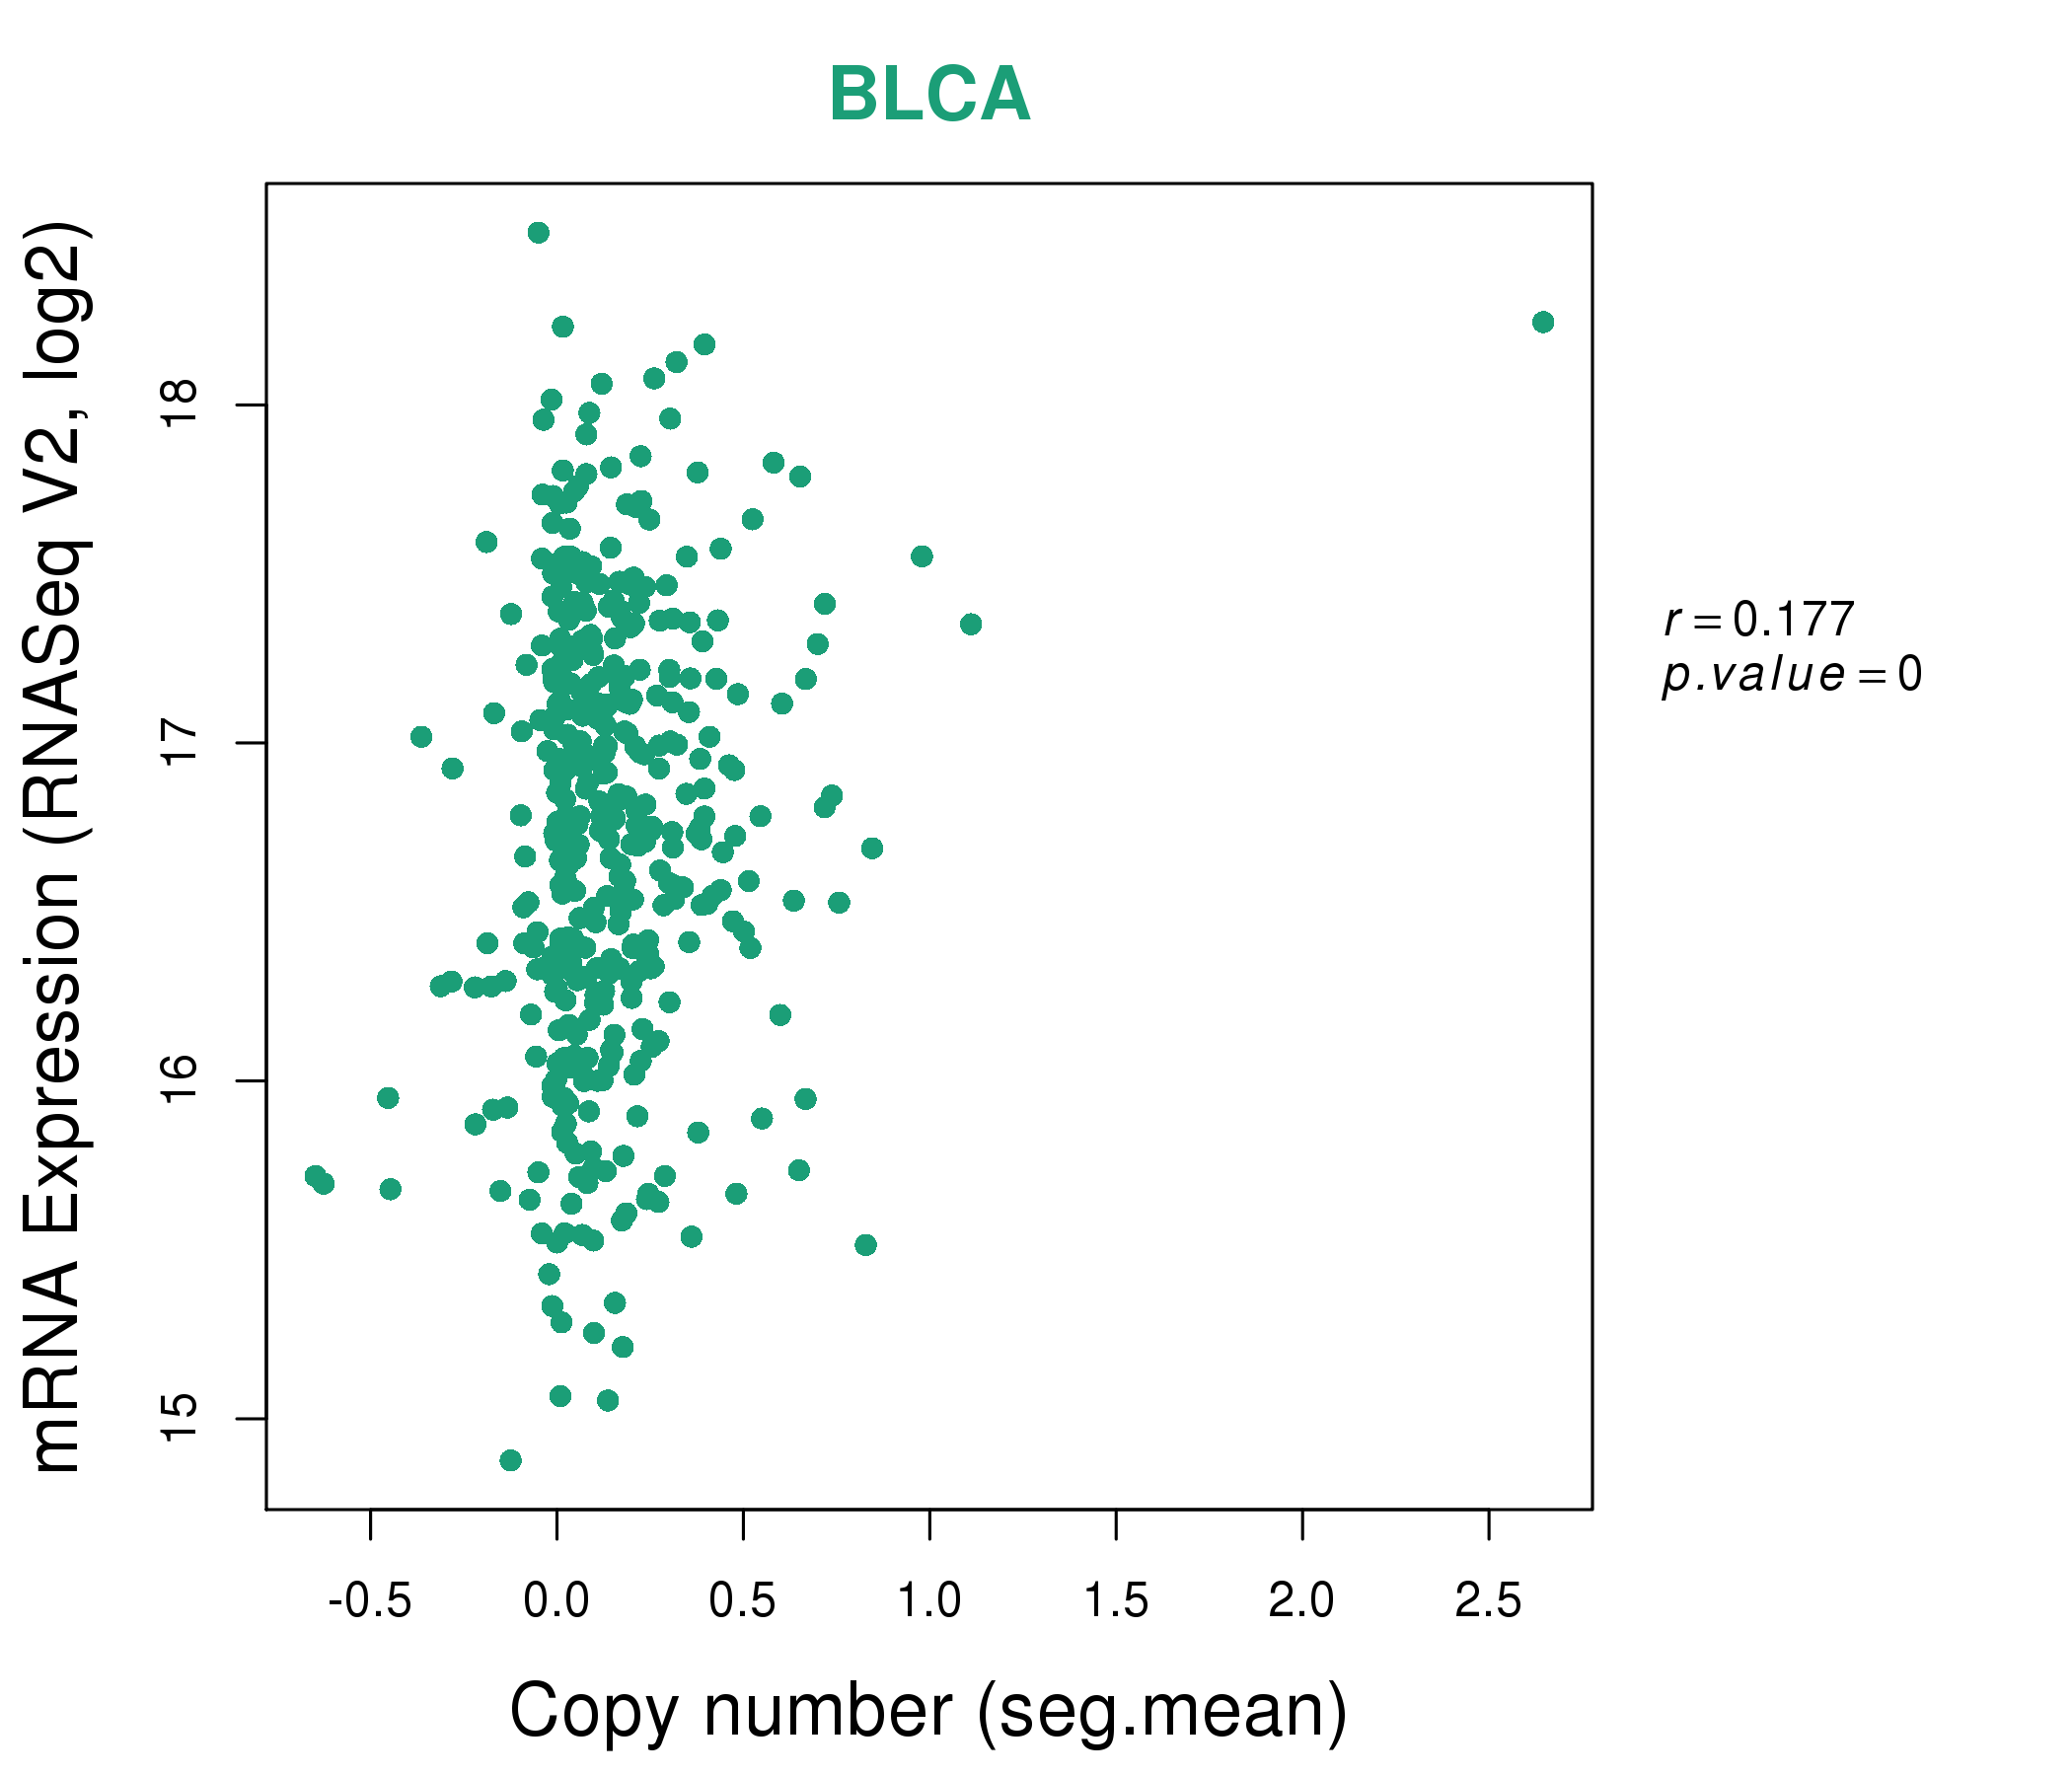
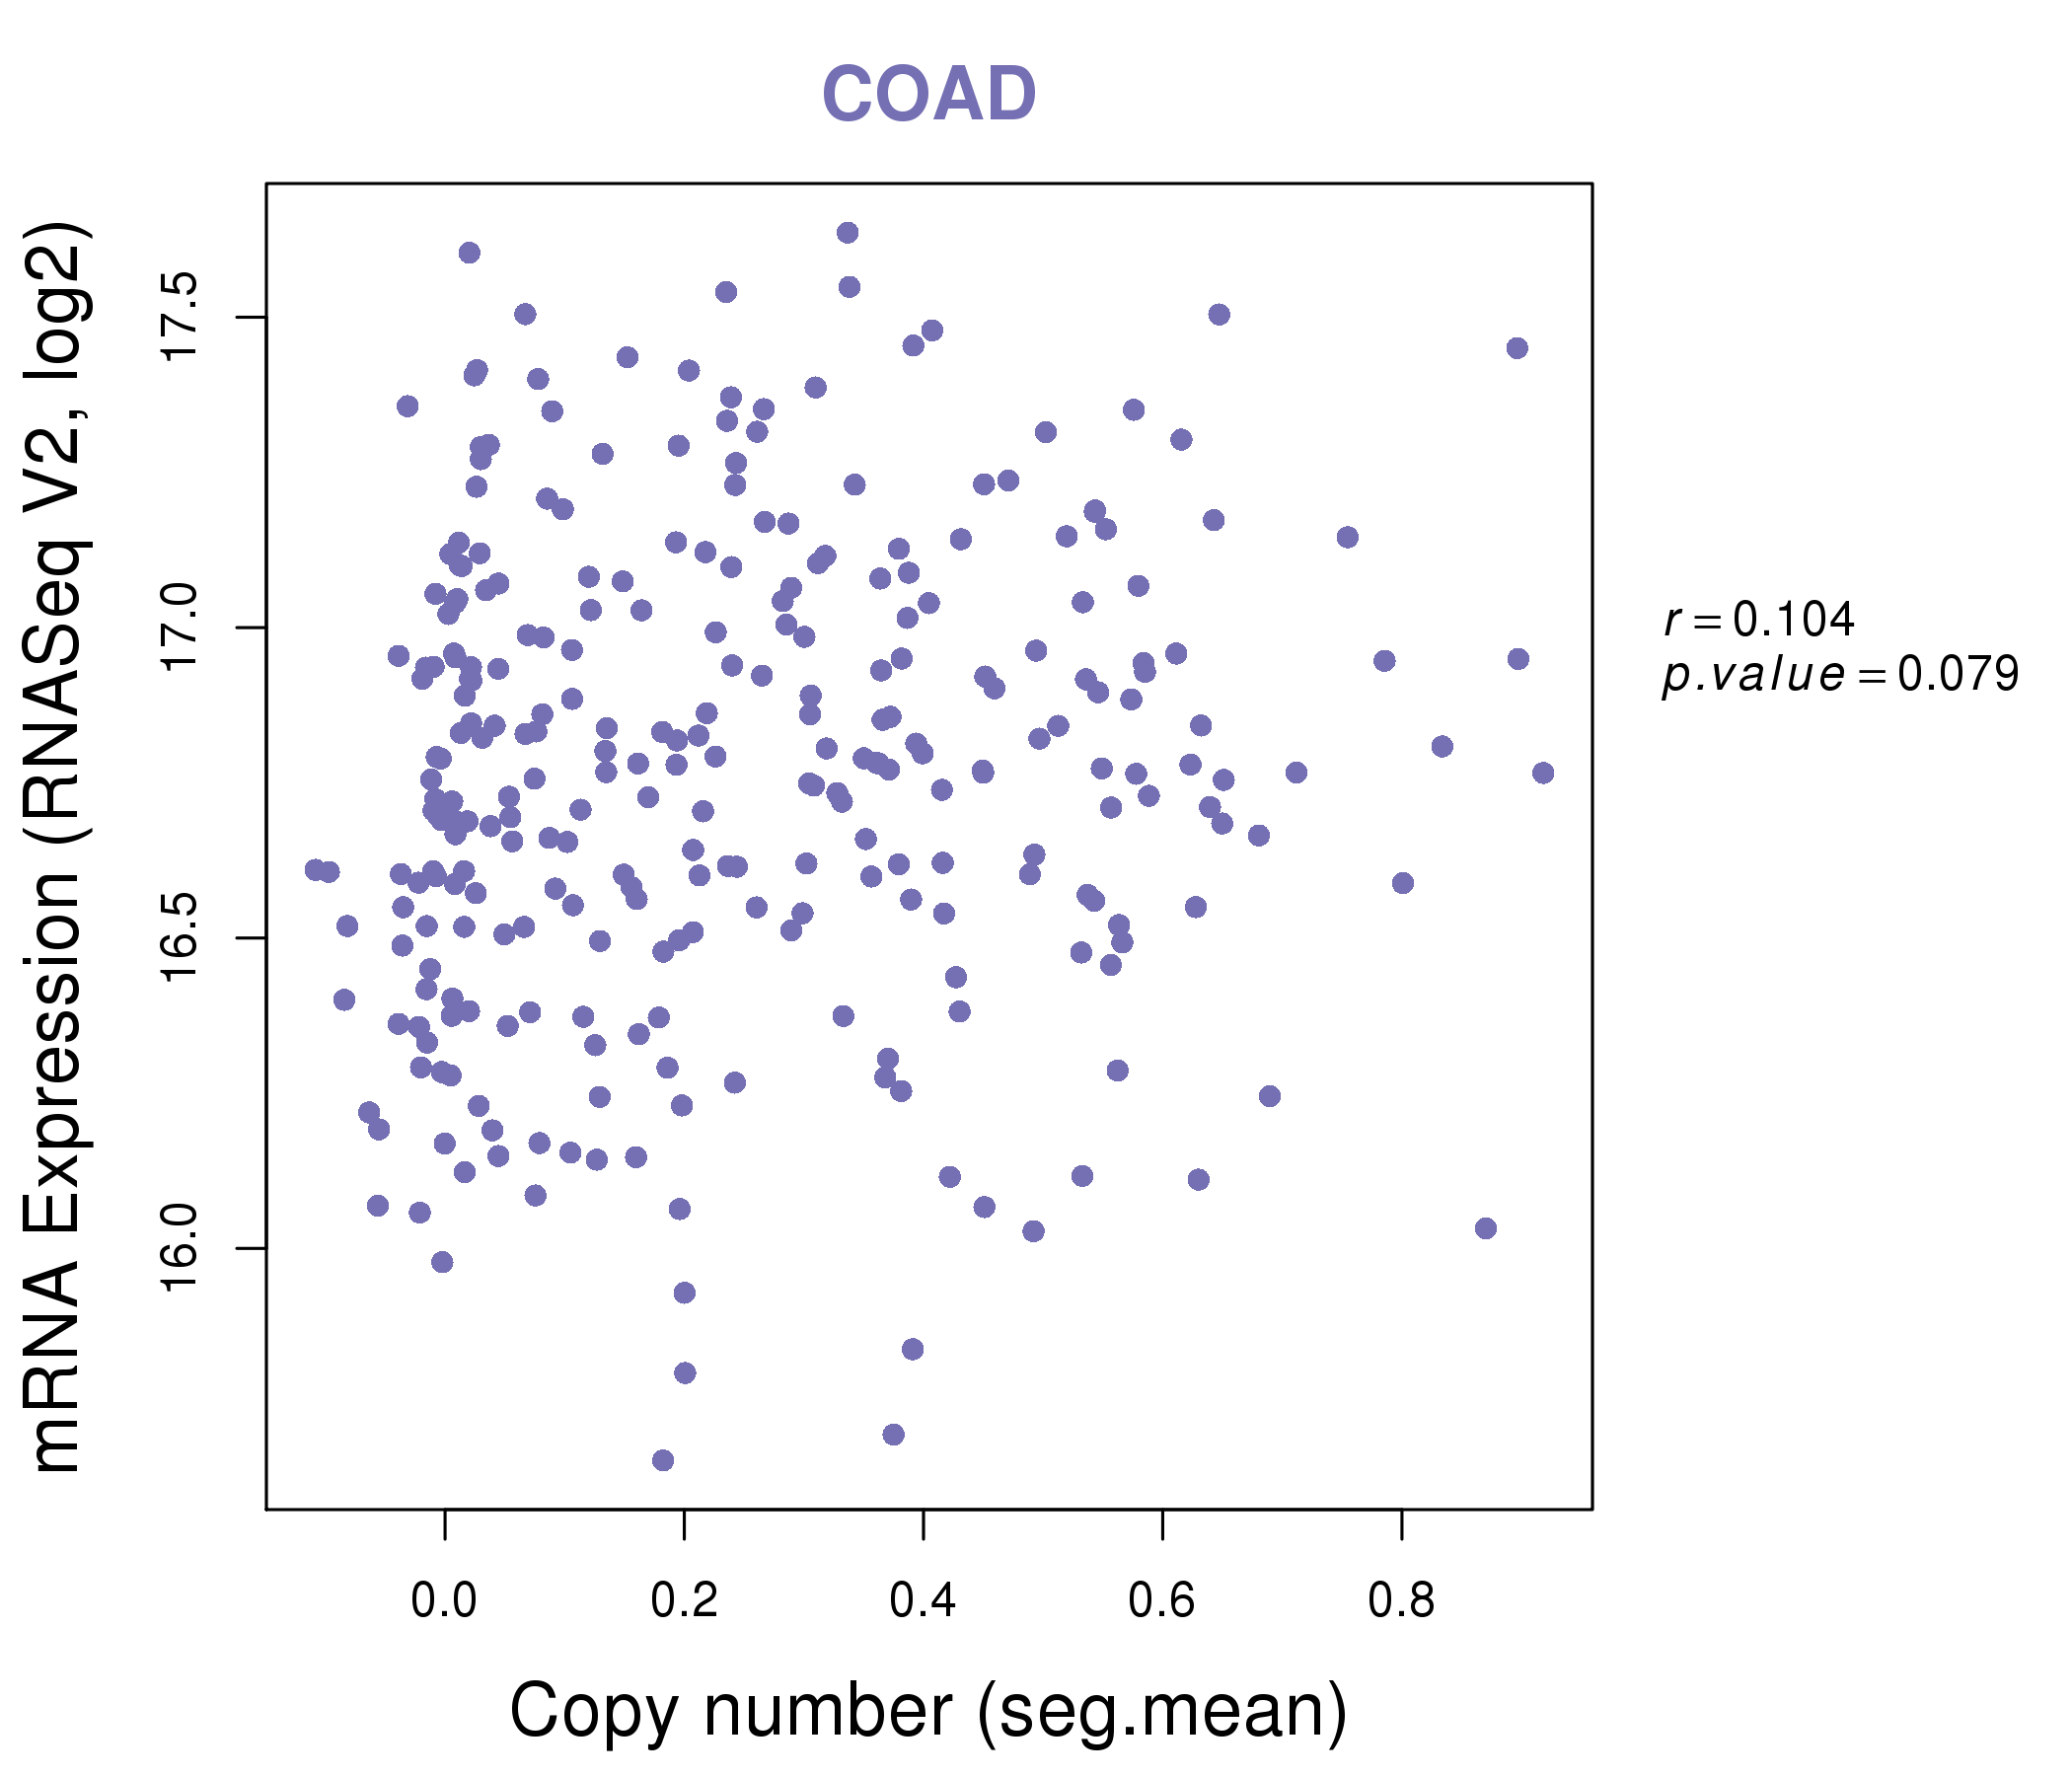
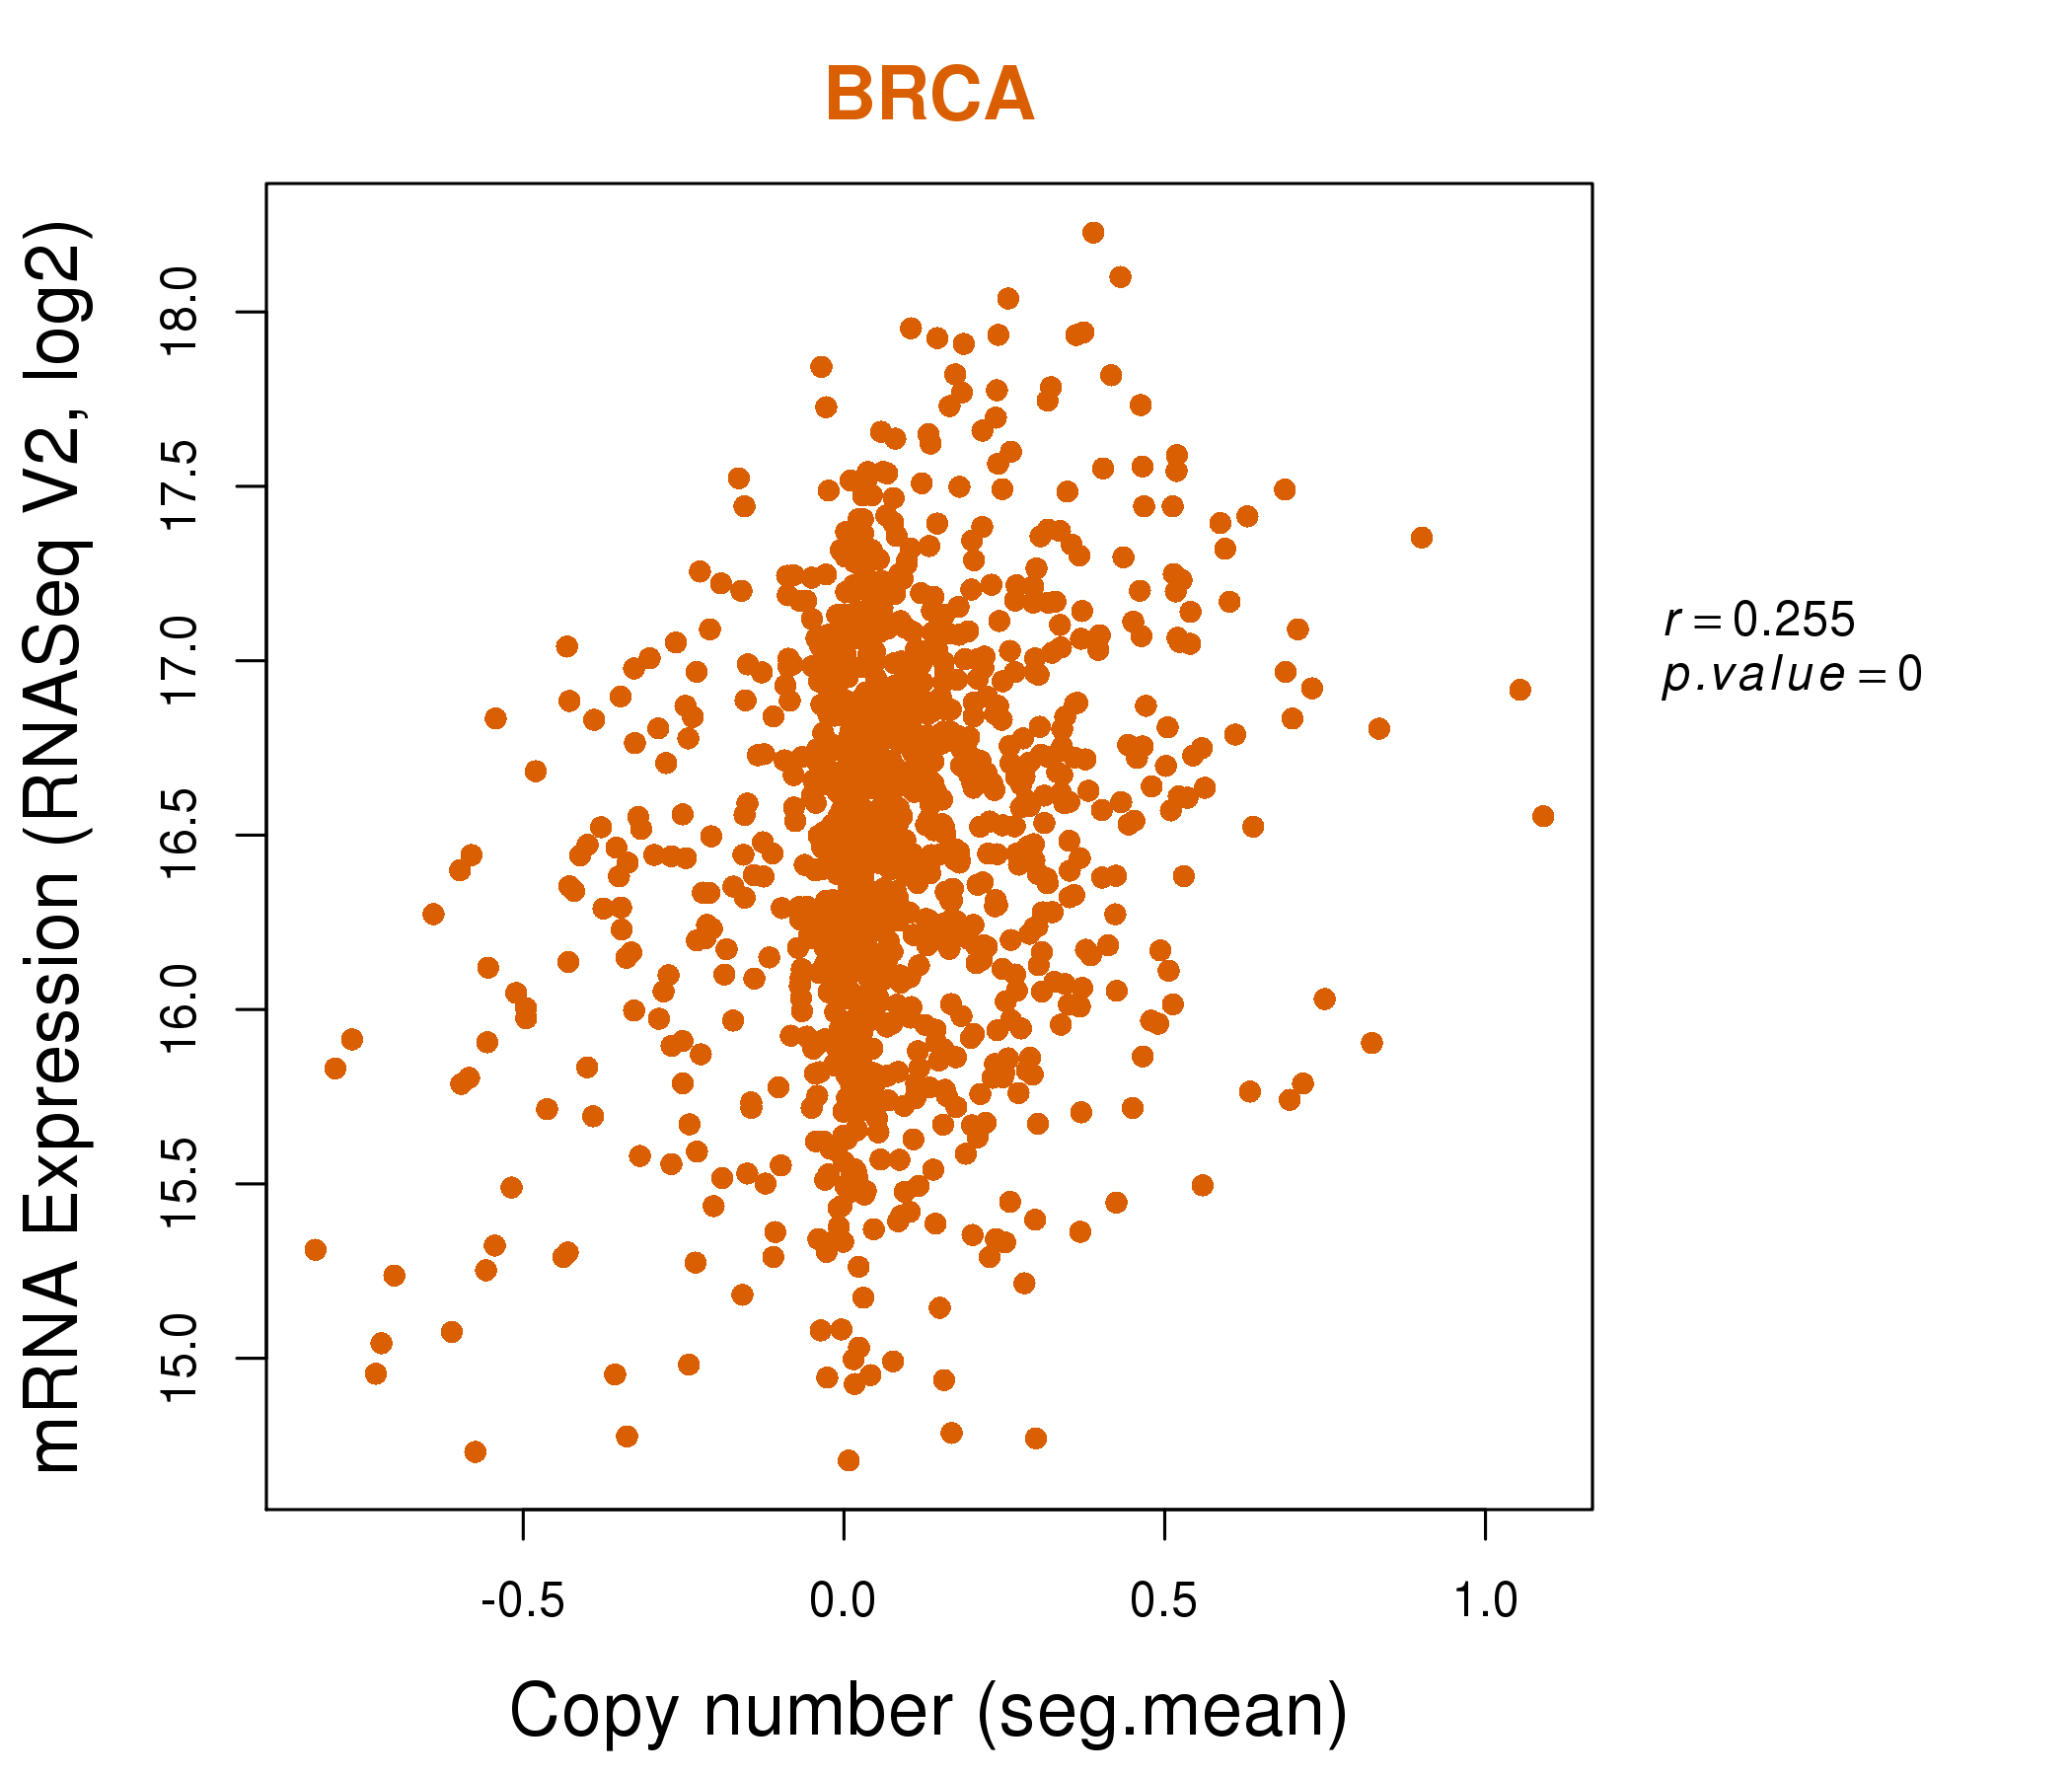
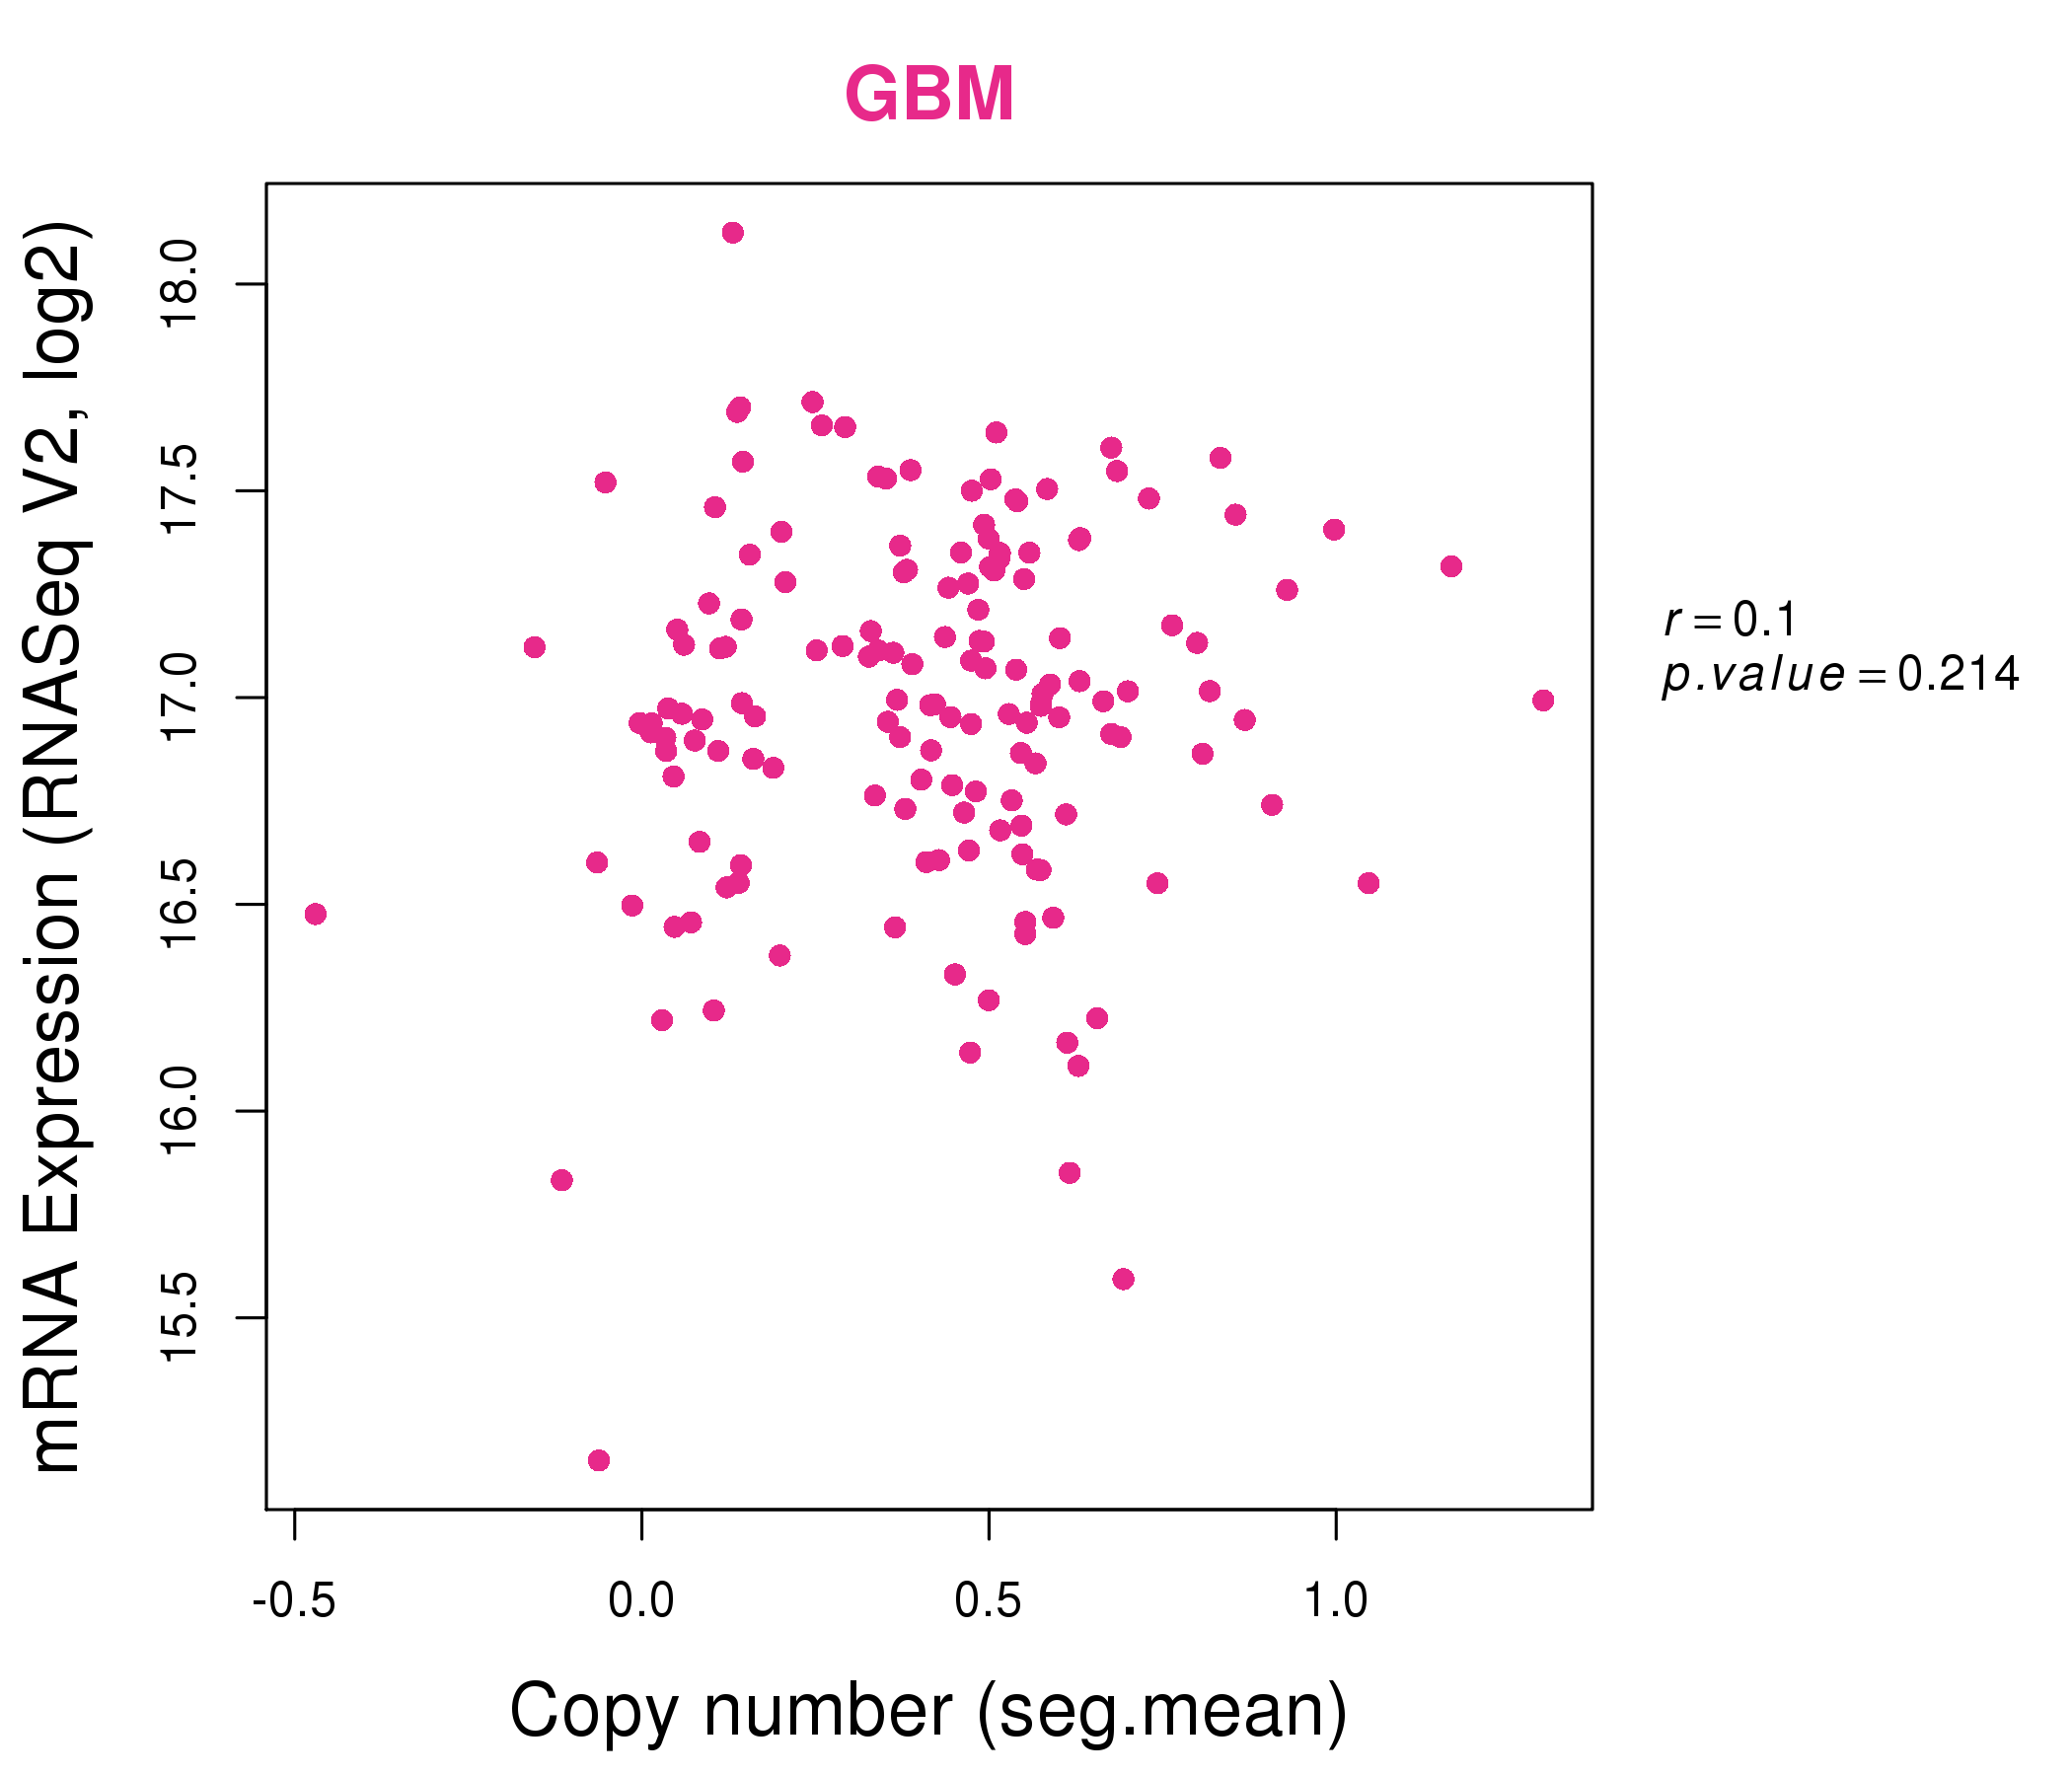
| * This plots show the correlation between CNV and gene expression. |
: Open all plots for all cancer types
 |
|
 |
|
| Top |
| Gene-Gene Network Information |
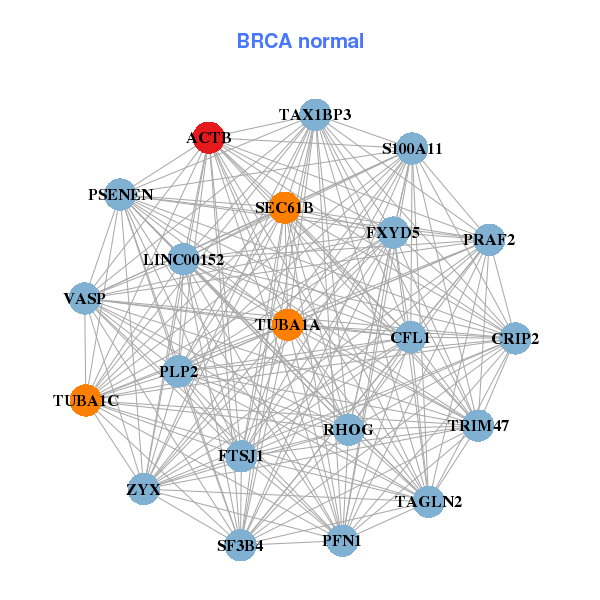
| * Co-Expression network figures were drawn using R package igraph. Only the top 20 genes with the highest correlations were shown. Red circle: input gene, orange circle: cell metabolism gene, sky circle: other gene |
: Open all plots for all cancer types
 |
| ||||
| ACOT9,ACTB,AVEN,CNN2,FAM127A,FHL3,LIMK1, LOC541471,LOC644936,PFN1,RAC1,RAP2B,RHOG,S100A10, S100A11,SH3BGRL3,TAX1BP3,TMSB10,TMSB4XP8,TNFRSF12A,ZYX | ACTB,CFL1,CRIP2,FTSJ1,FXYD5,LINC00152,PFN1, PLP2,PRAF2,PSENEN,RHOG,S100A11,SEC61B,SF3B4, TAGLN2,TAX1BP3,TRIM47,TUBA1A,TUBA1C,VASP,ZYX | ||||
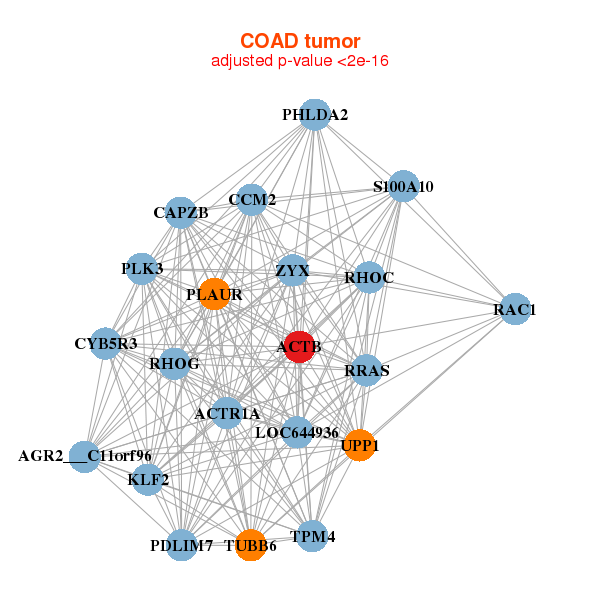 |
| ||||
| ACTB,ACTR1A,AGR2___C11orf96,CAPZB,CCM2,CYB5R3,KLF2, LOC644936,PDLIM7,PHLDA2,PLAUR,PLK3,RAC1,RHOC, RHOG,RRAS,S100A10,TPM4,TUBB6,UPP1,ZYX | ACTB,BVES,CACNA1C,CTXN1,ITGB1,JPH2,LOC401093, MAP7D1,MICALL1,MYLK,PDLIM7,PNMA1,REEP2,SLC2A4, SRF,TBC1D1,TES,TUBA1A,TUBB6,VCL,ZYX |

| * Co-Expression network figures were drawn using R package igraph. Only the top 20 genes with the highest correlations were shown. Red circle: input gene, orange circle: cell metabolism gene, sky circle: other gene |
: Open all plots for all cancer types
| Top |
: Open all interacting genes' information including KEGG pathway for all interacting genes from DAVID
| Top |
| Pharmacological Information for ACTB |
| DB Category | DB Name | DB's ID and Url link |
| Chemistry | ChEMBL | CHEMBL2062353; -. |
| Chemistry | ChEMBL | CHEMBL2062353; -. |
| Organism-specific databases | PharmGKB | PA24457; -. |
| Organism-specific databases | PharmGKB | PA24457; -. |
| Organism-specific databases | CTD | 60; -. |
| Organism-specific databases | CTD | 60; -. |
| * Gene Centered Interaction Network. |
 |
| * Drug Centered Interaction Network. |
| DrugBank ID | Target Name | Drug Groups | Generic Name | Drug Centered Network | Drug Structure |
| DB00394 | actin, beta | approved | Beclomethasone | 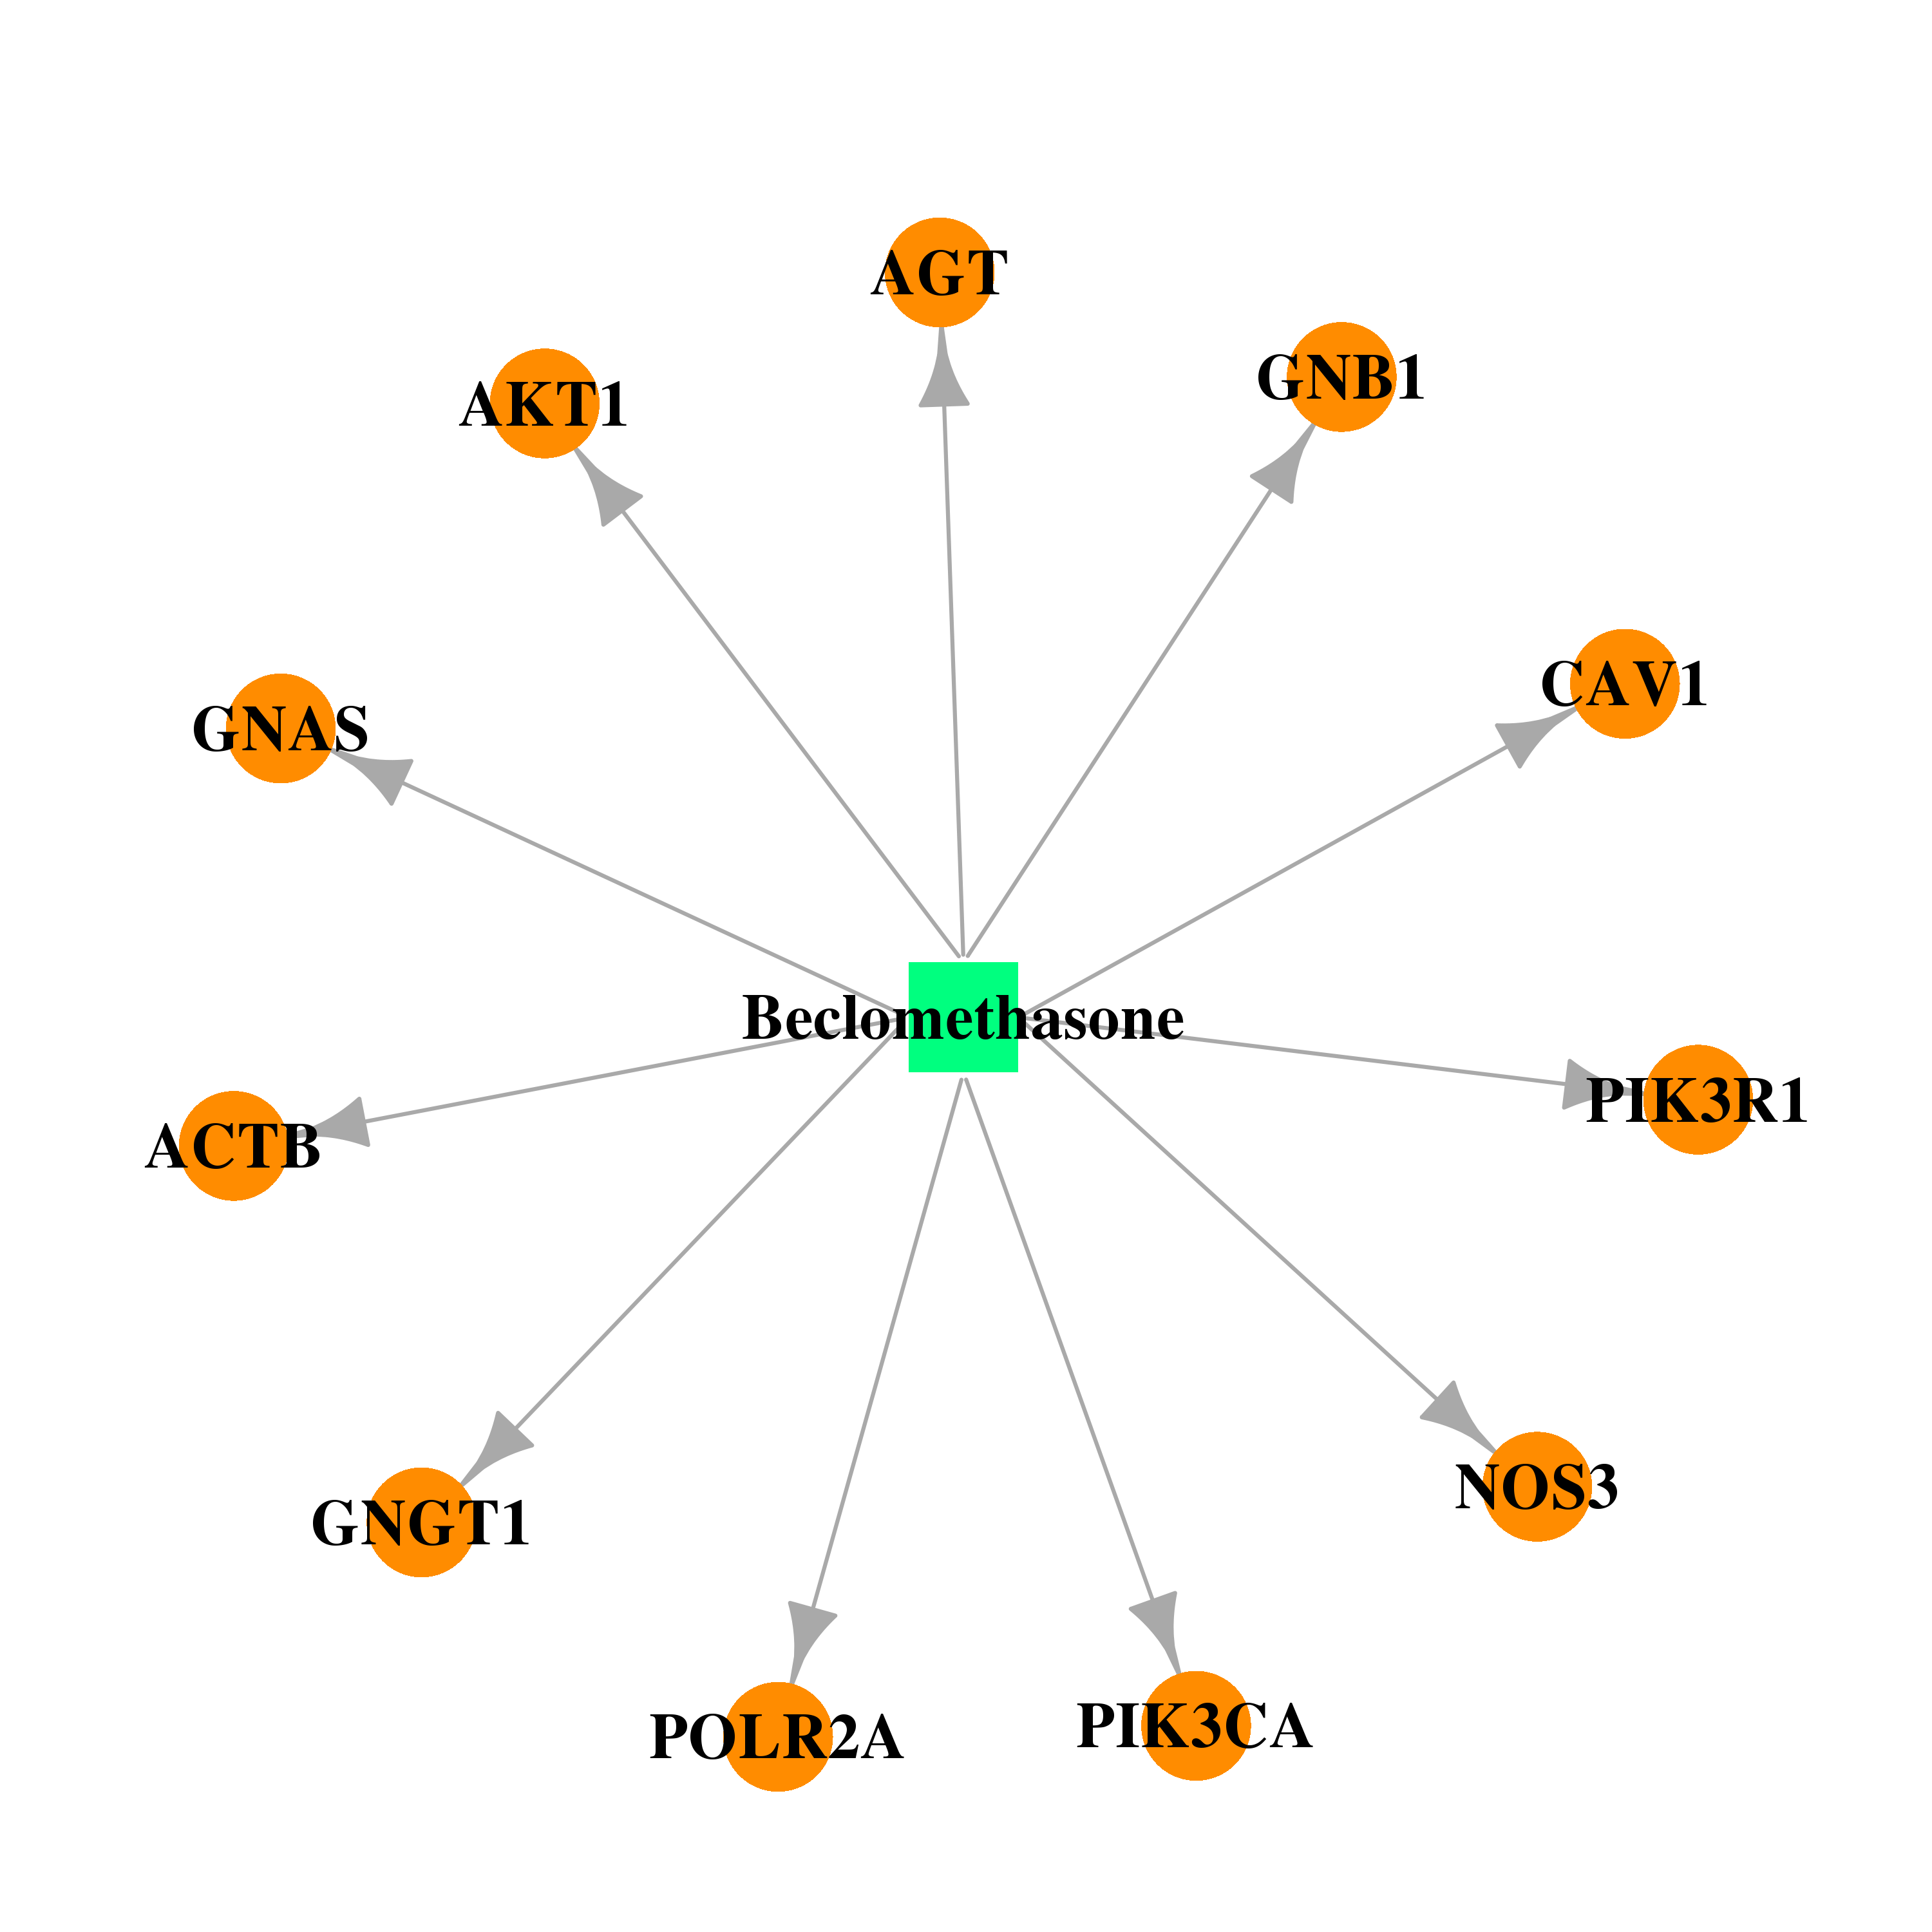 | 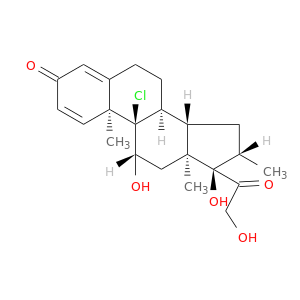 |
| DB00443 | actin, beta | approved | Betamethasone |  |  |
| DB01222 | actin, beta | approved; investigational | Budesonide |  |  |
| DB01410 | actin, beta | approved; investigational | Ciclesonide | 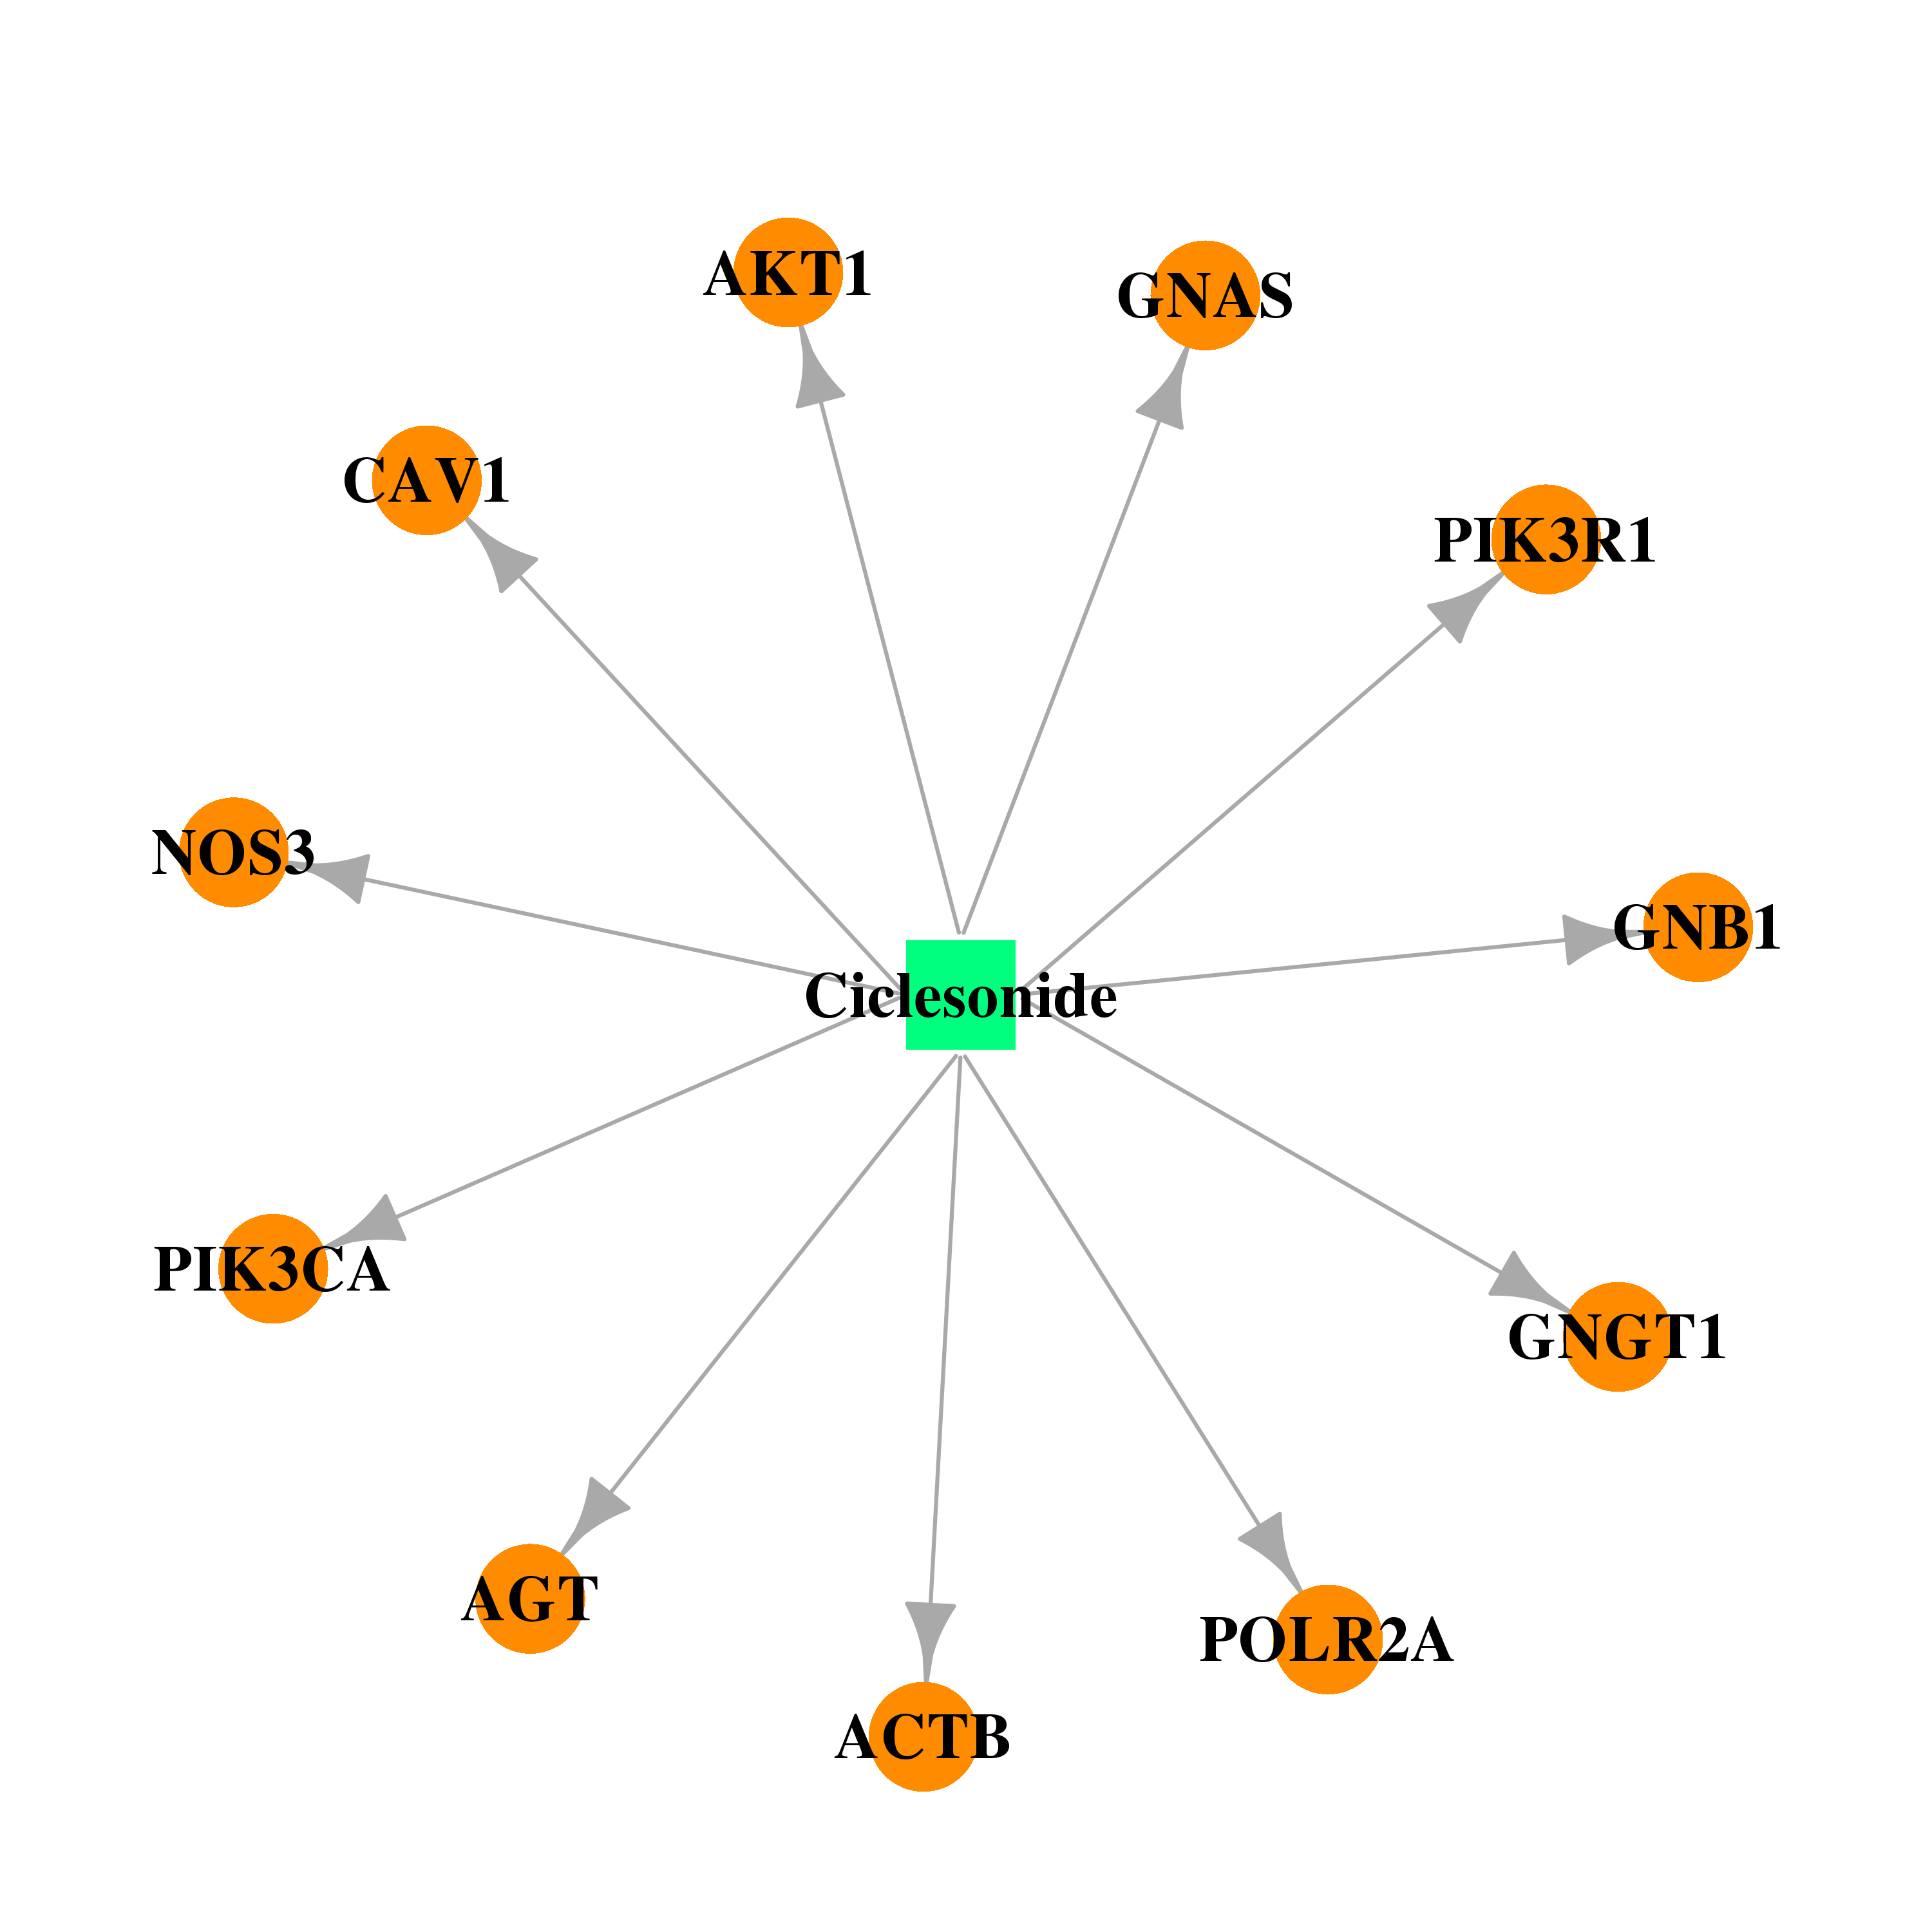 | 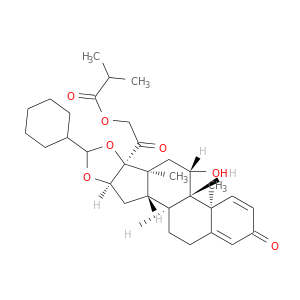 |
| DB01260 | actin, beta | approved; investigational | Desonide |  |  |
| DB01234 | actin, beta | approved; investigational | Dexamethasone | 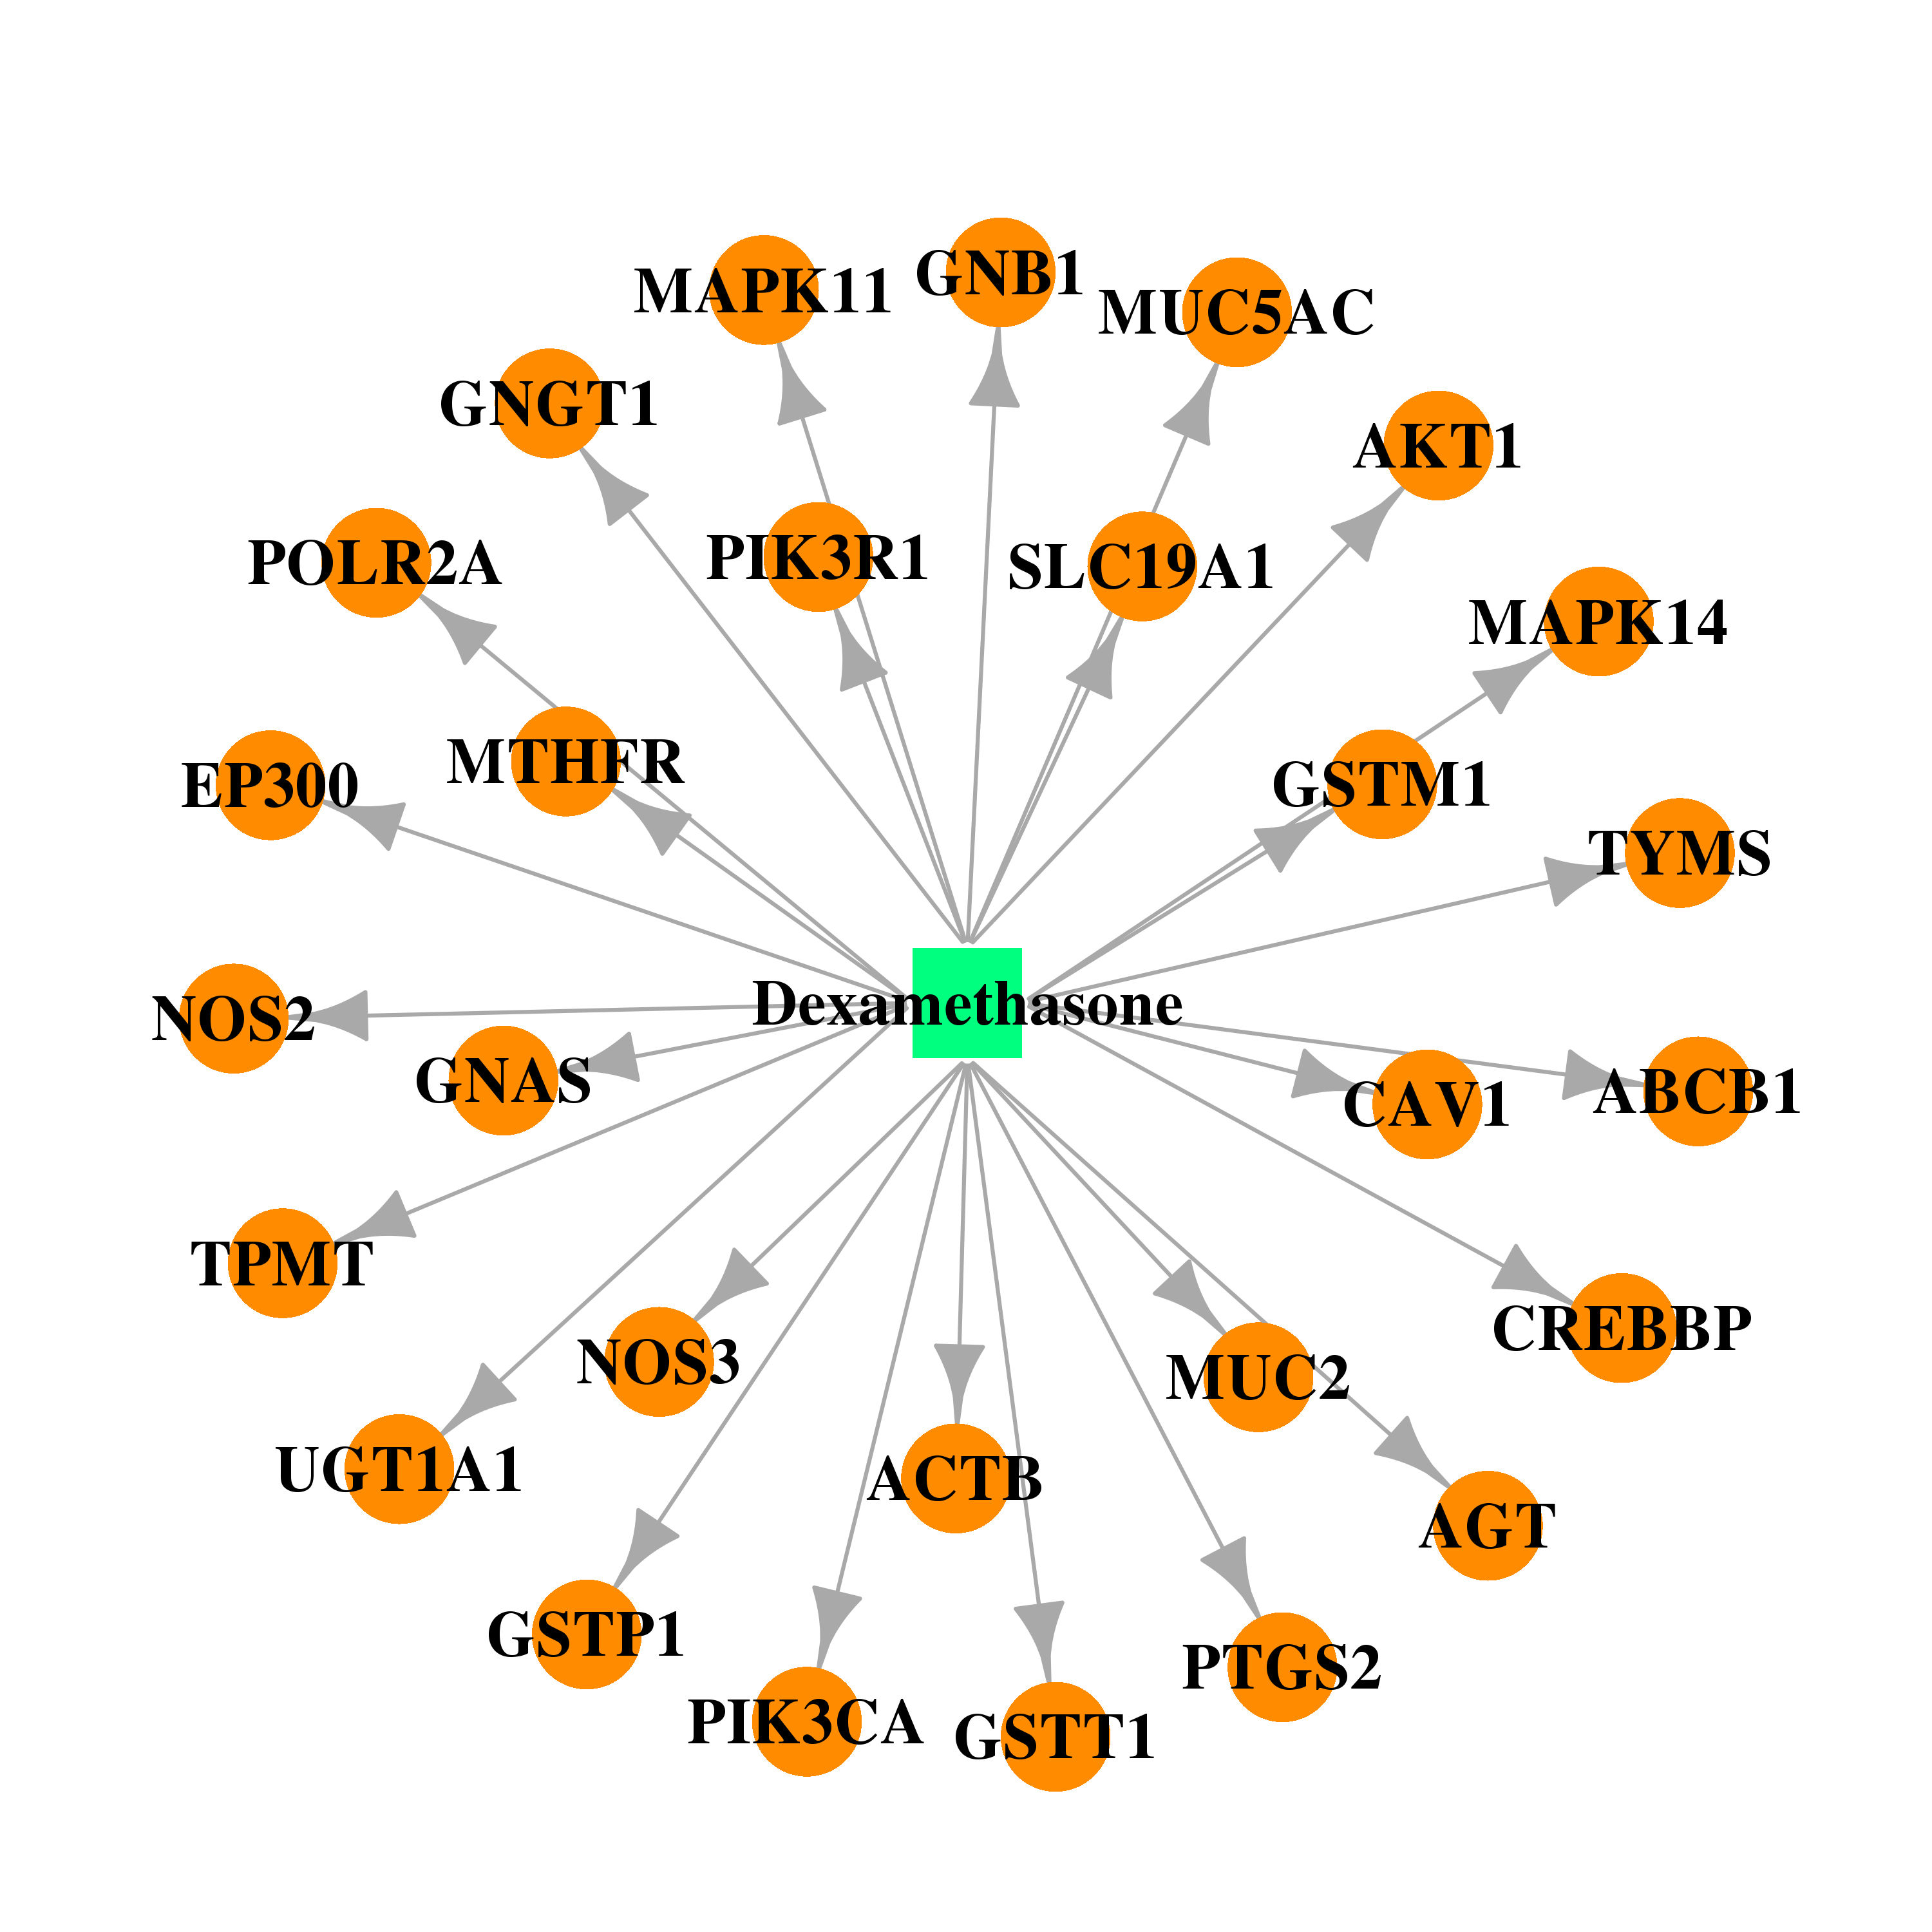 | 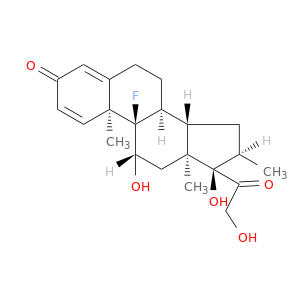 |
| DB00180 | actin, beta | approved; investigational | Flunisolide | 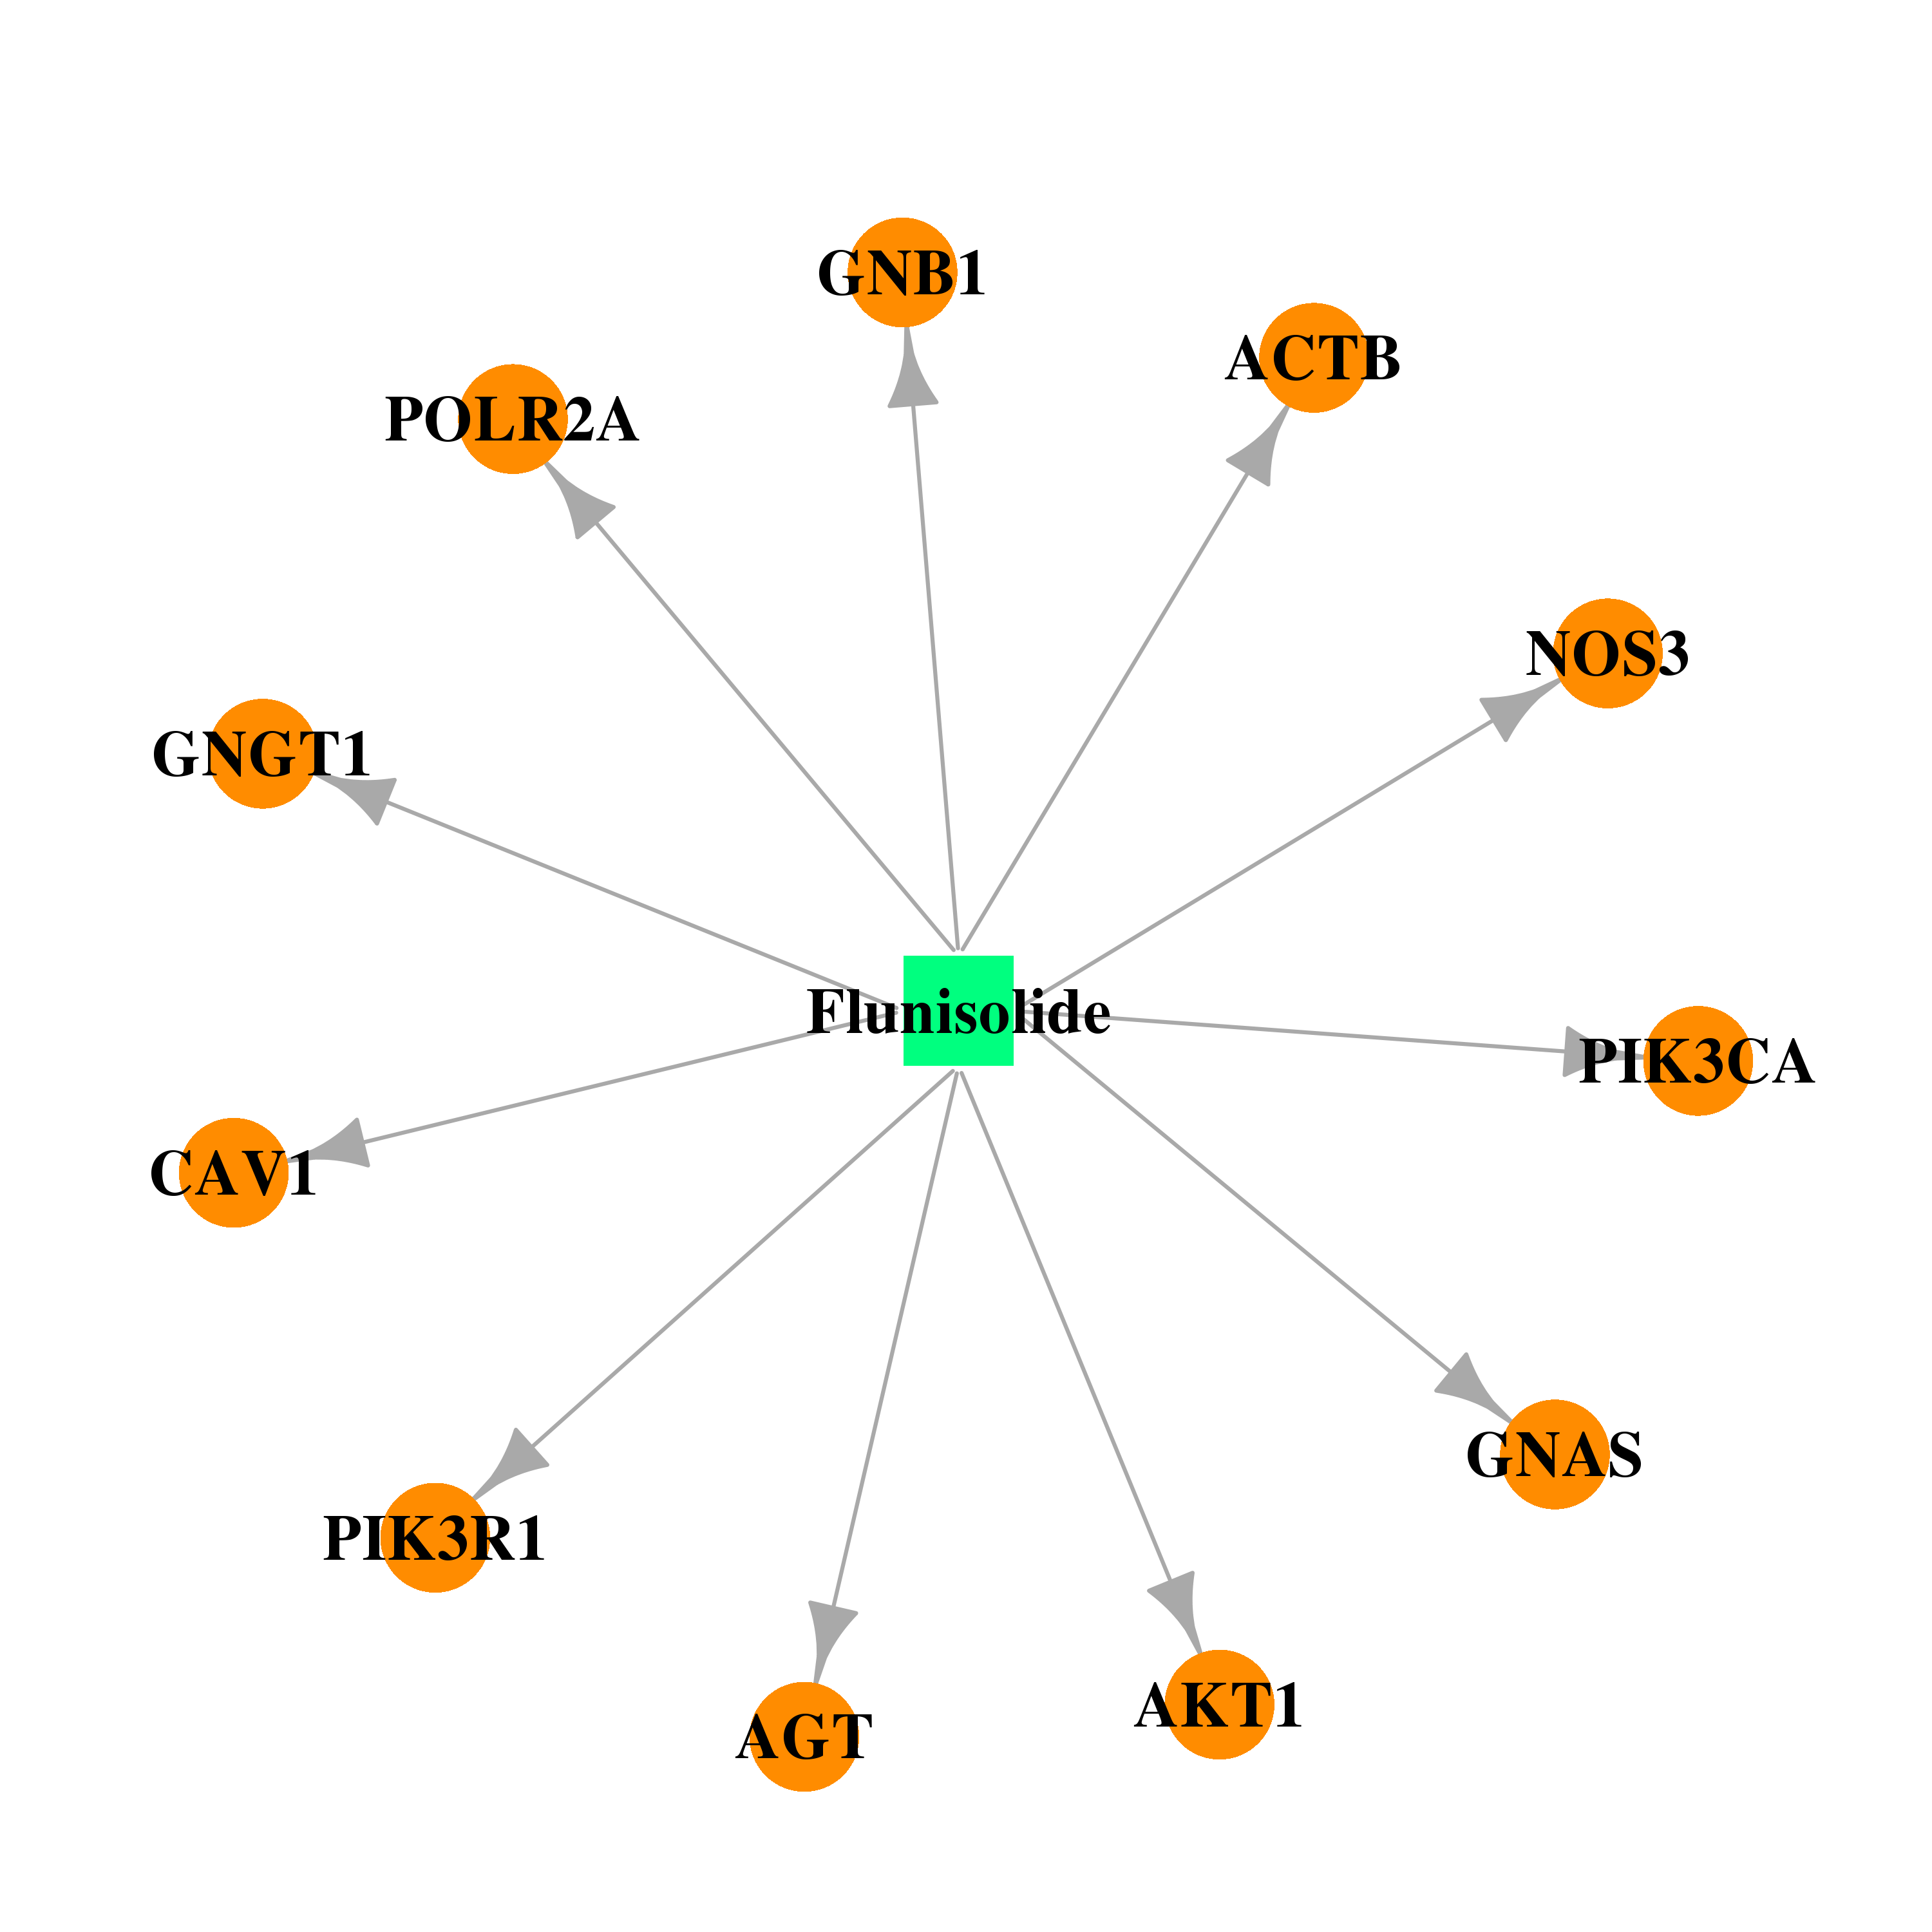 | 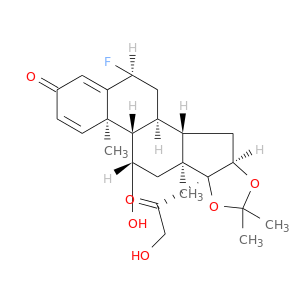 |
| DB00588 | actin, beta | approved; investigational | Fluticasone Propionate | 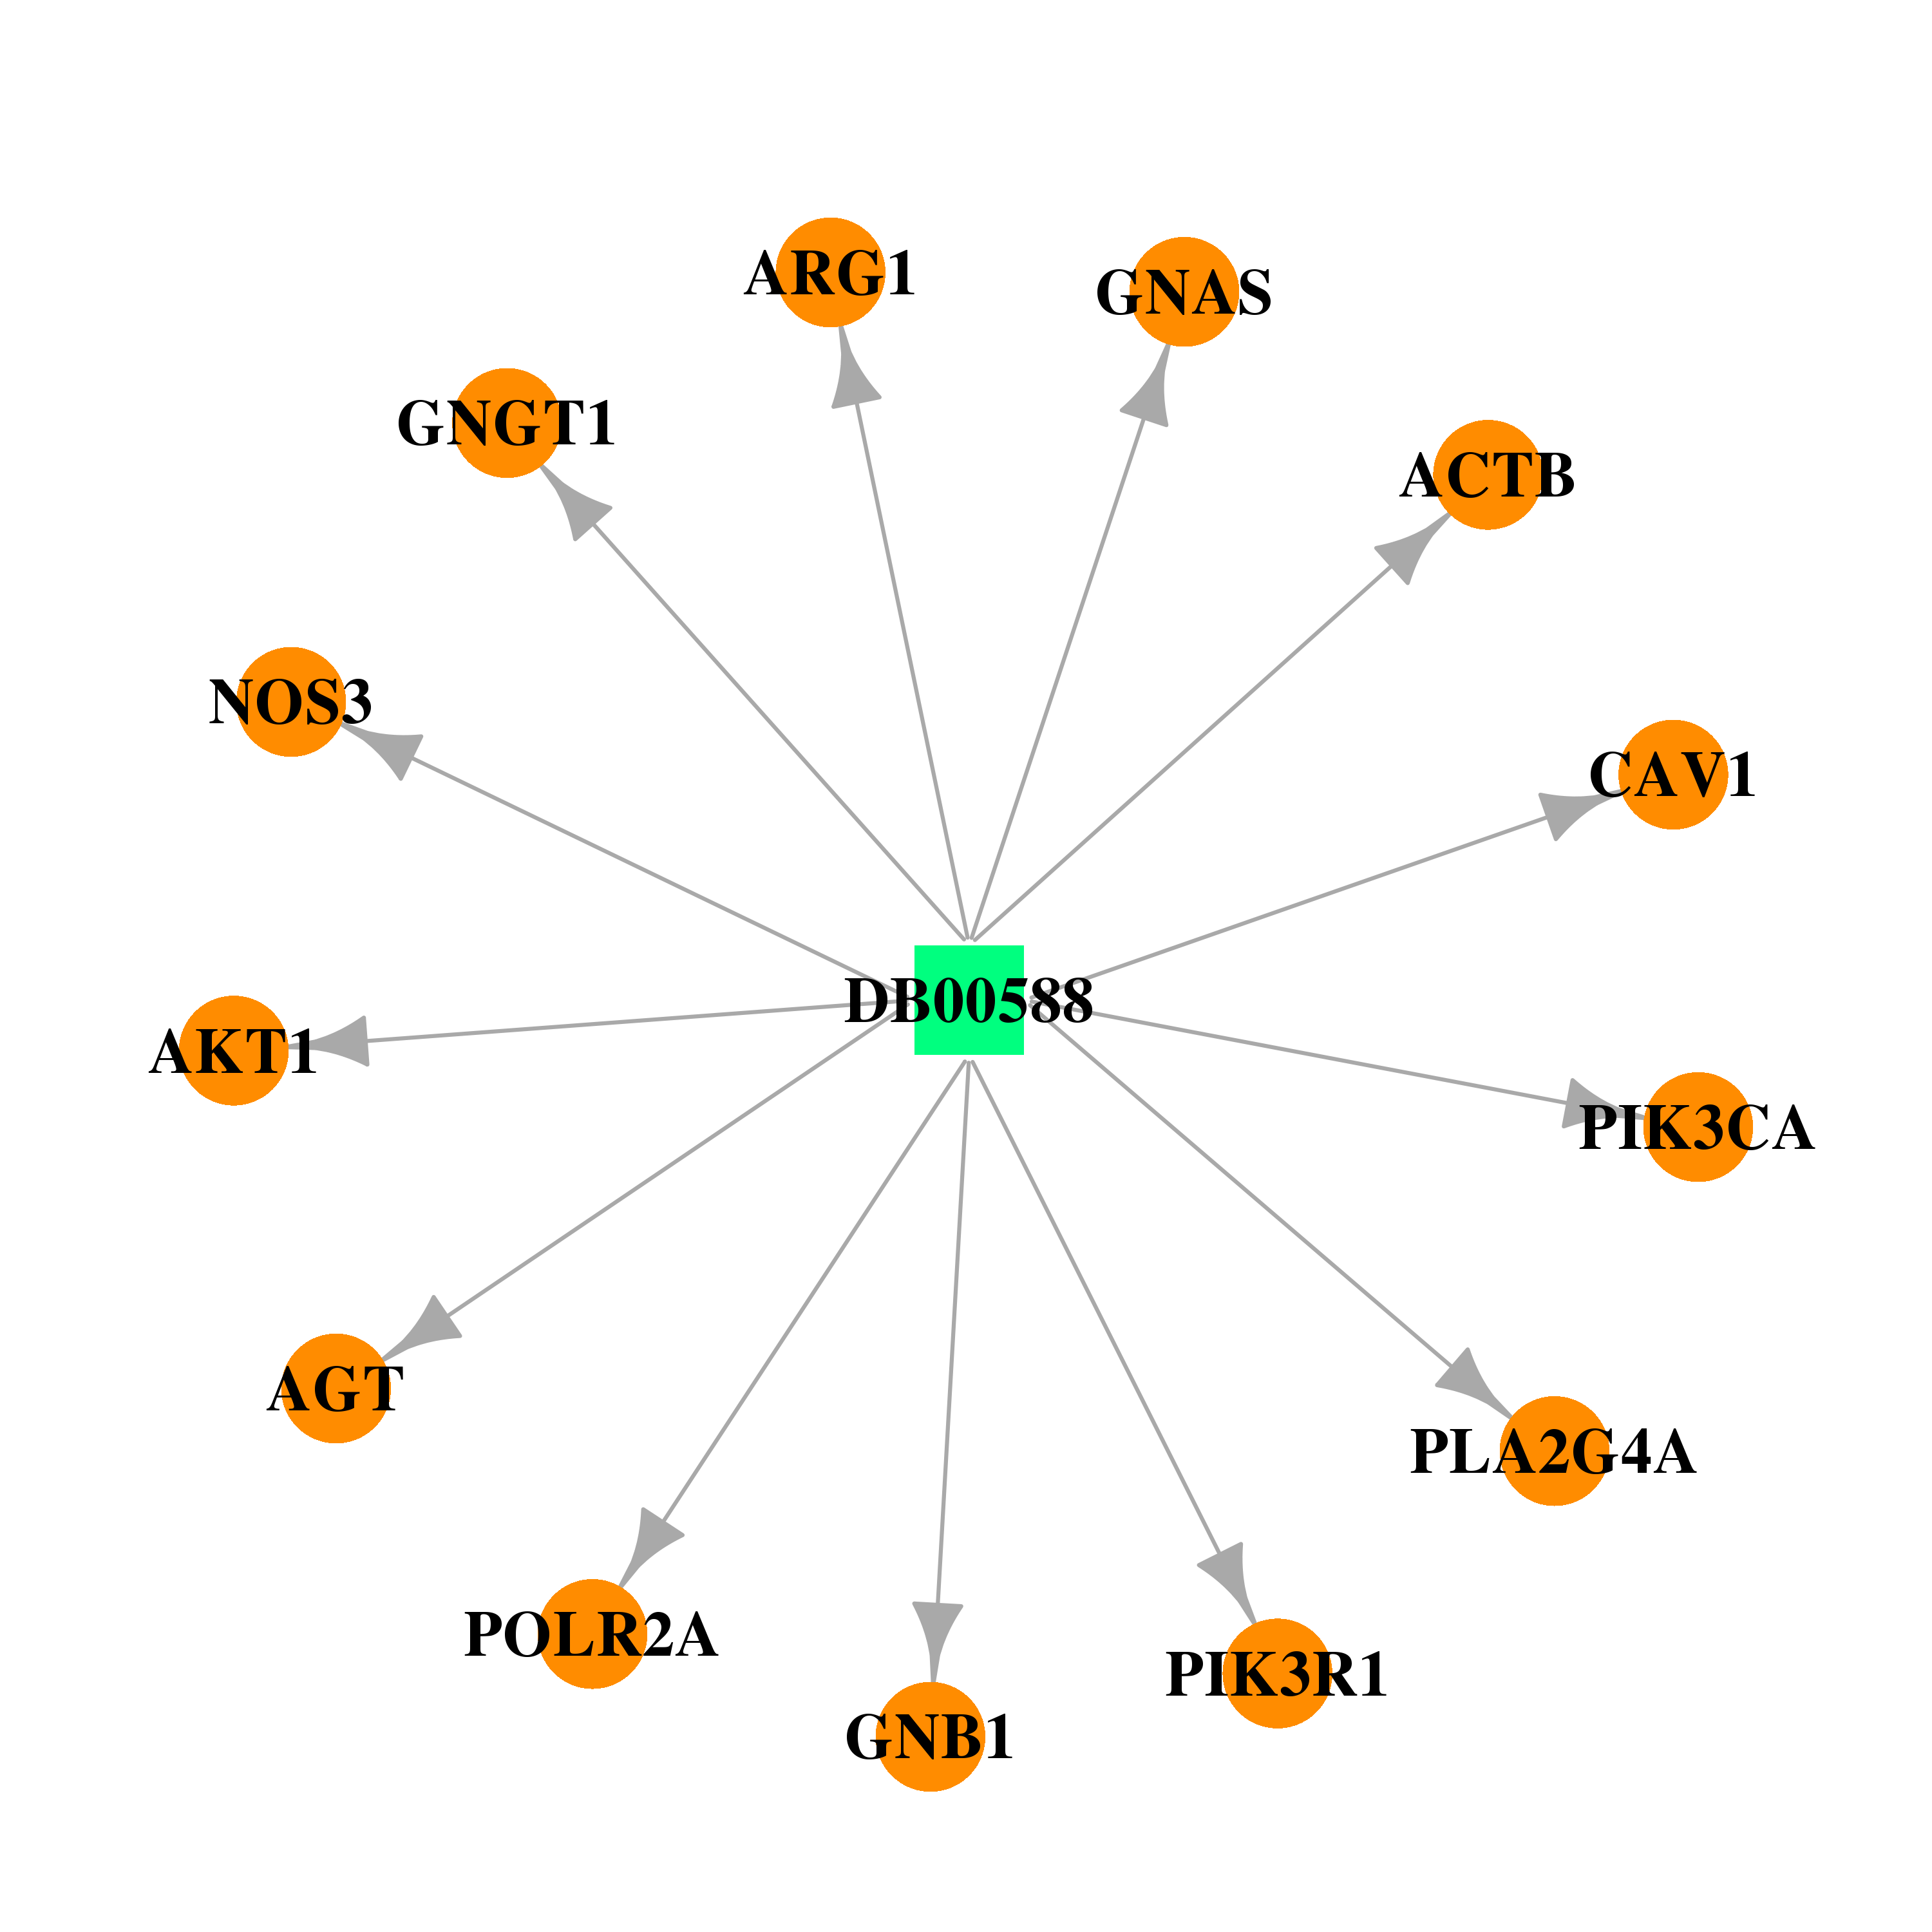 | 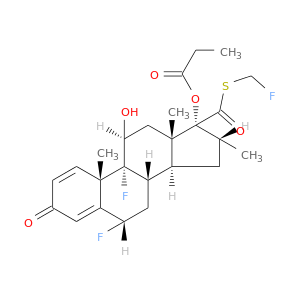 |
| DB00741 | actin, beta | approved | Hydrocortisone |  | 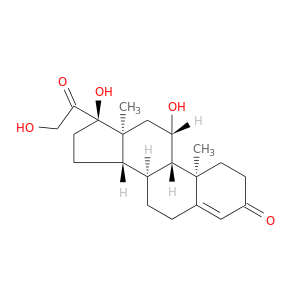 |
| DB00959 | actin, beta | approved | Methylprednisolone |  | 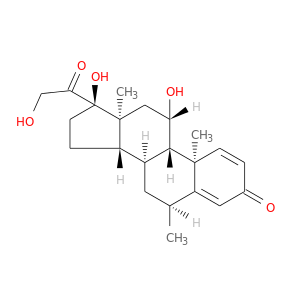 |
| DB00764 | actin, beta | approved | Mometasone | 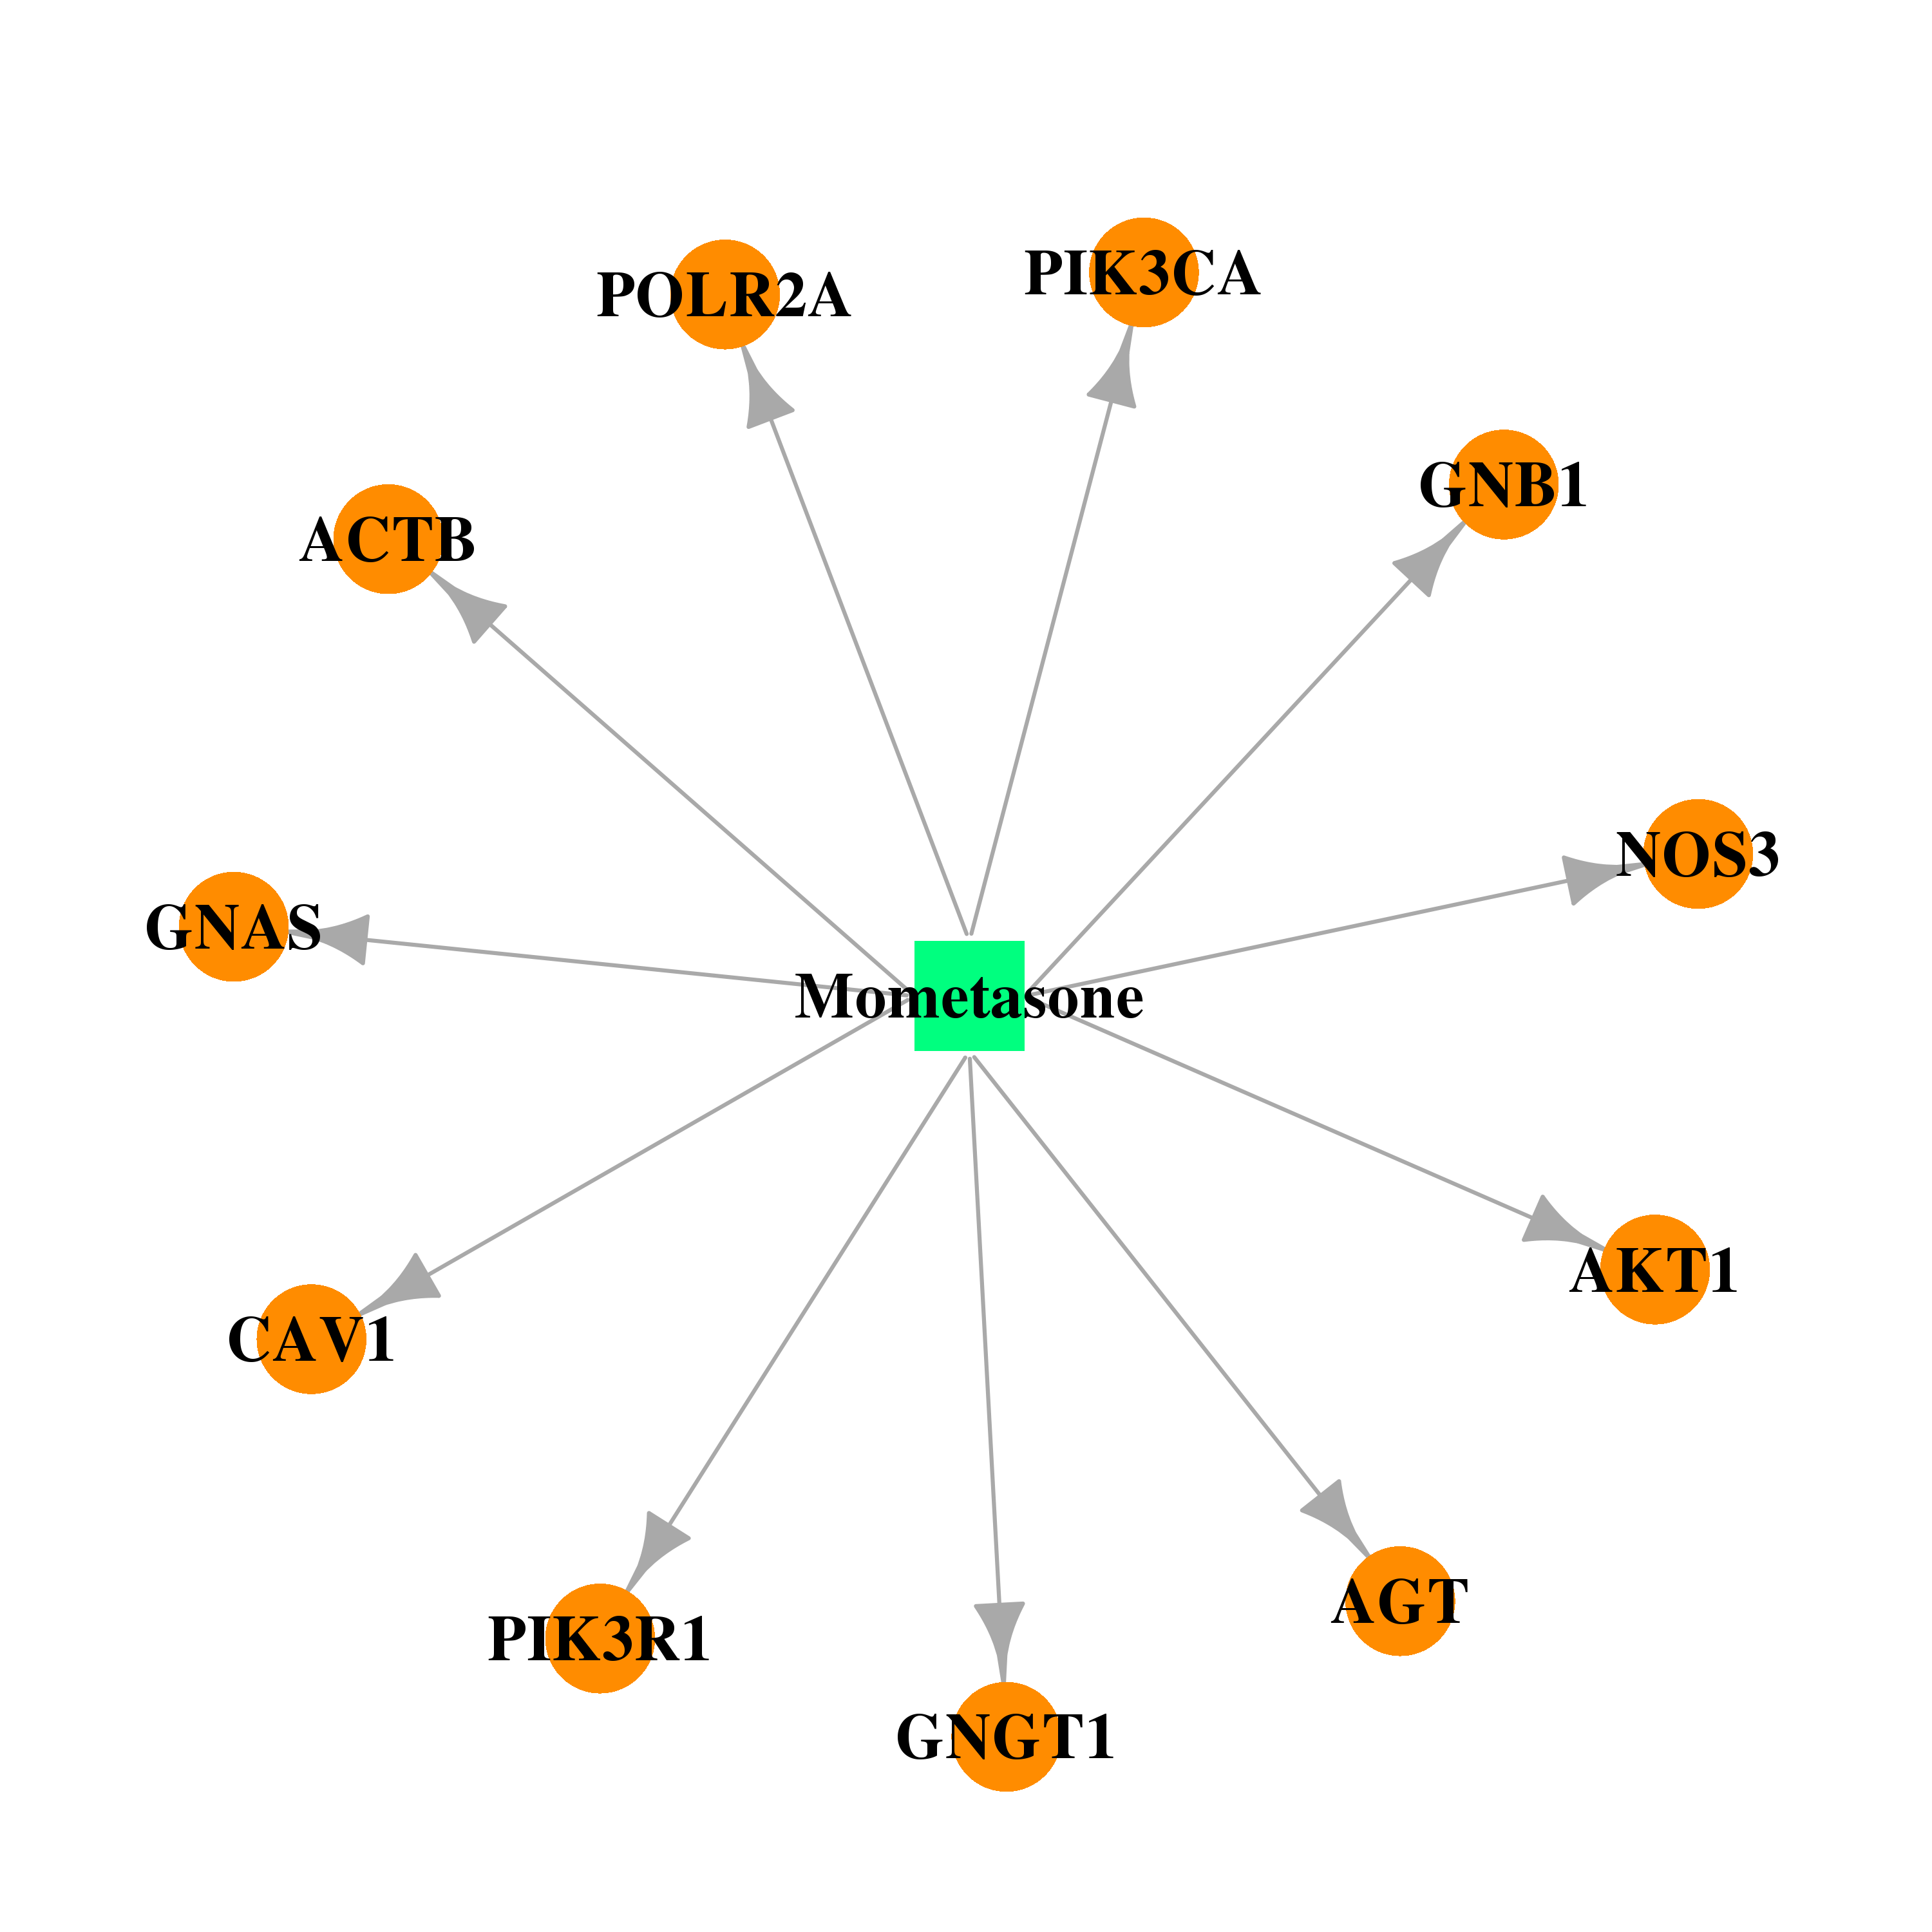 |  |
| DB01384 | actin, beta | approved | Paramethasone | 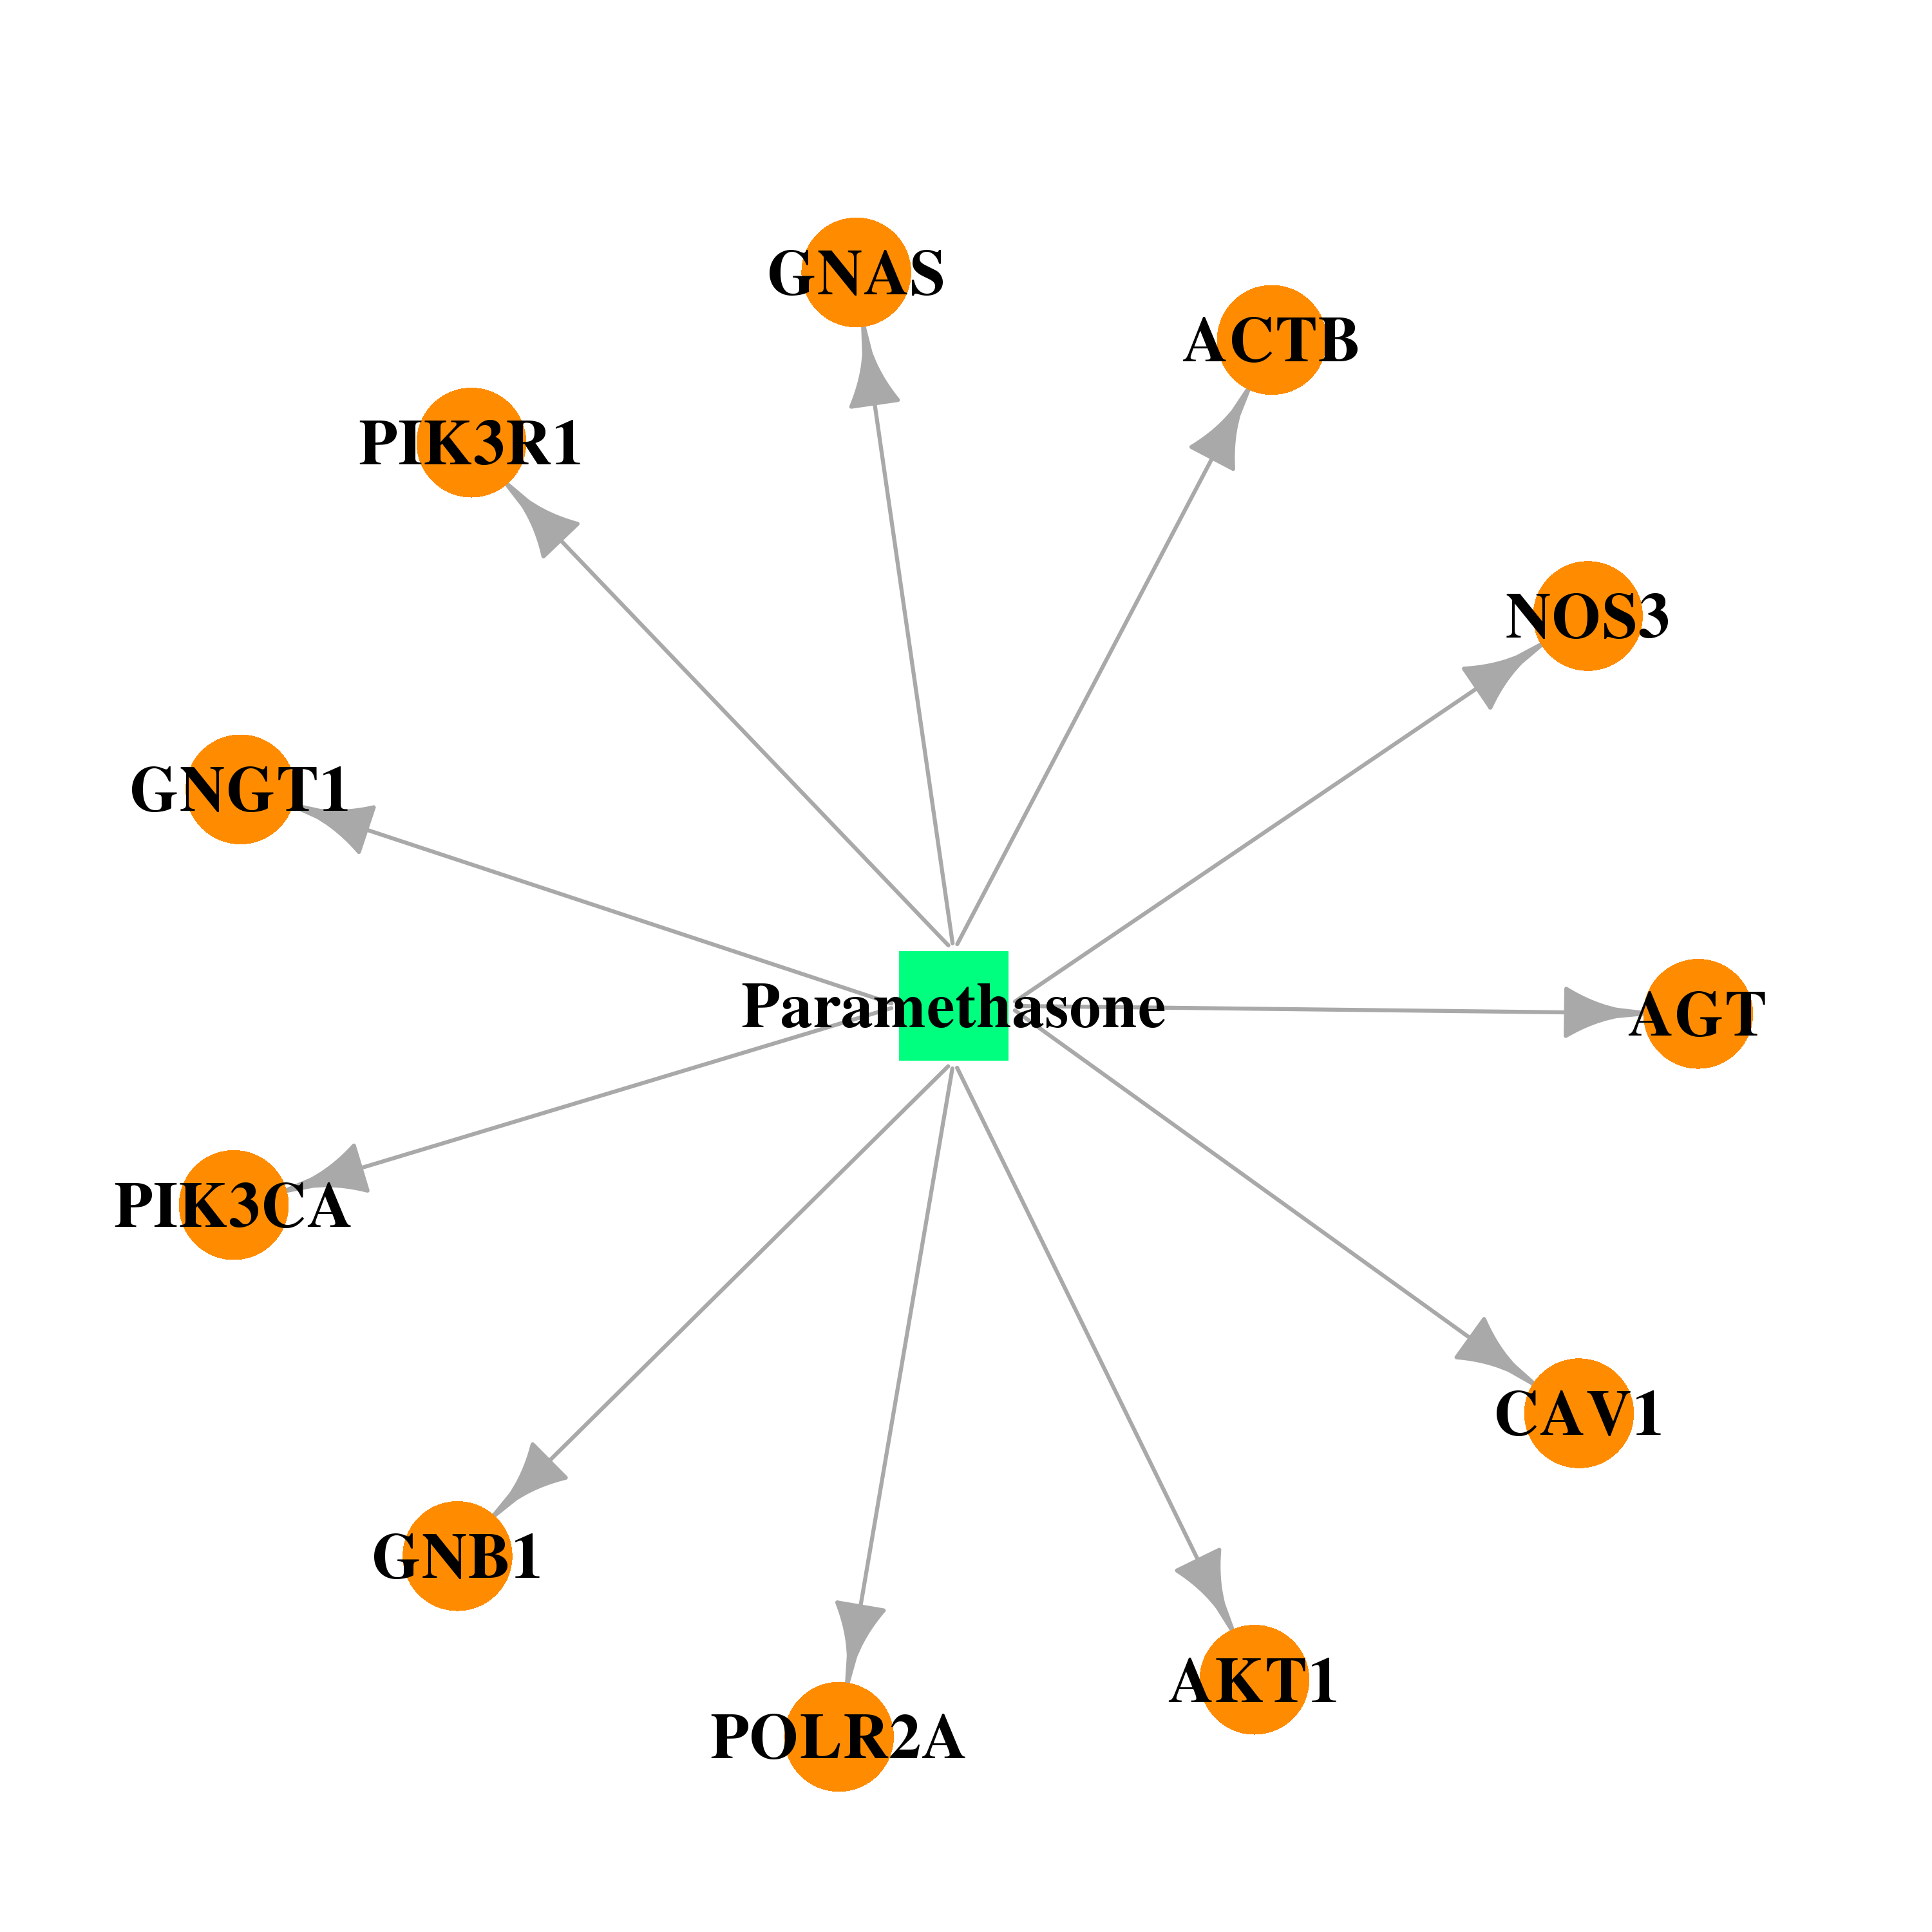 | 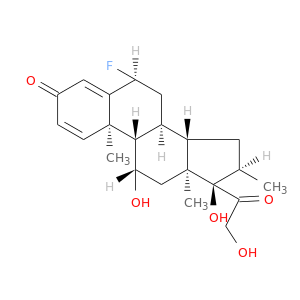 |
| DB00860 | actin, beta | approved | Prednisolone | 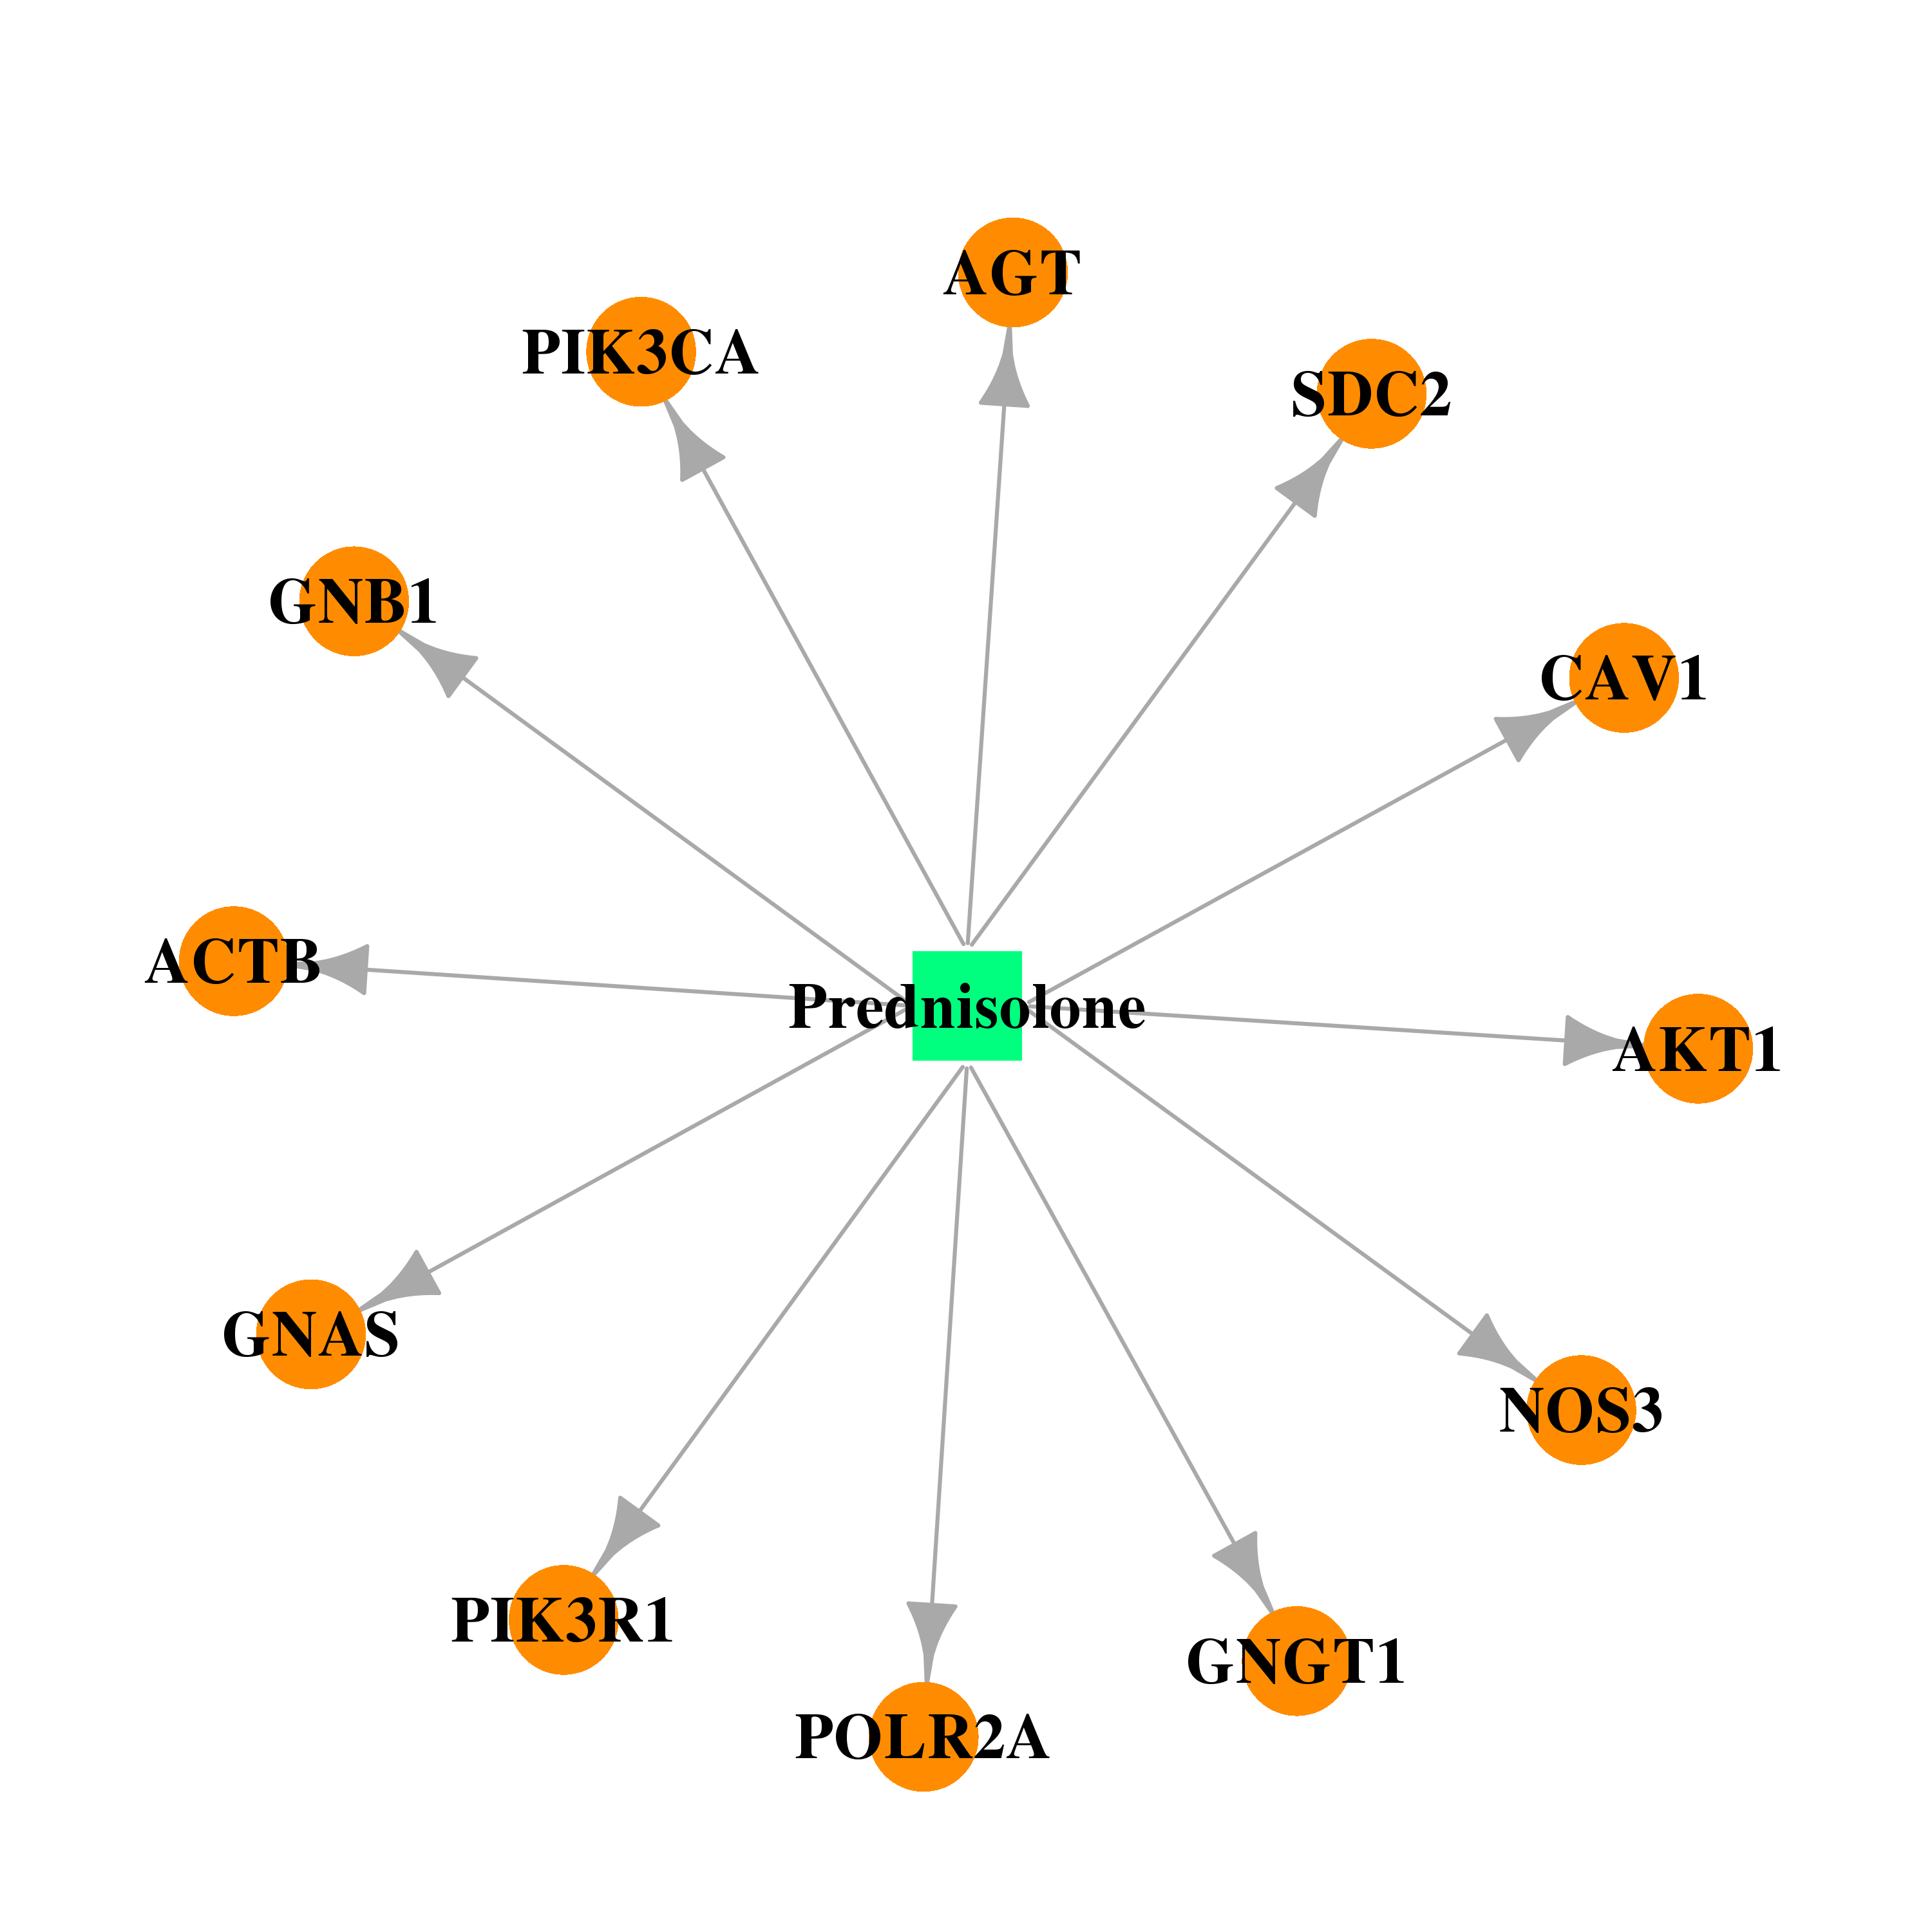 |  |
| DB00635 | actin, beta | approved | Prednisone | 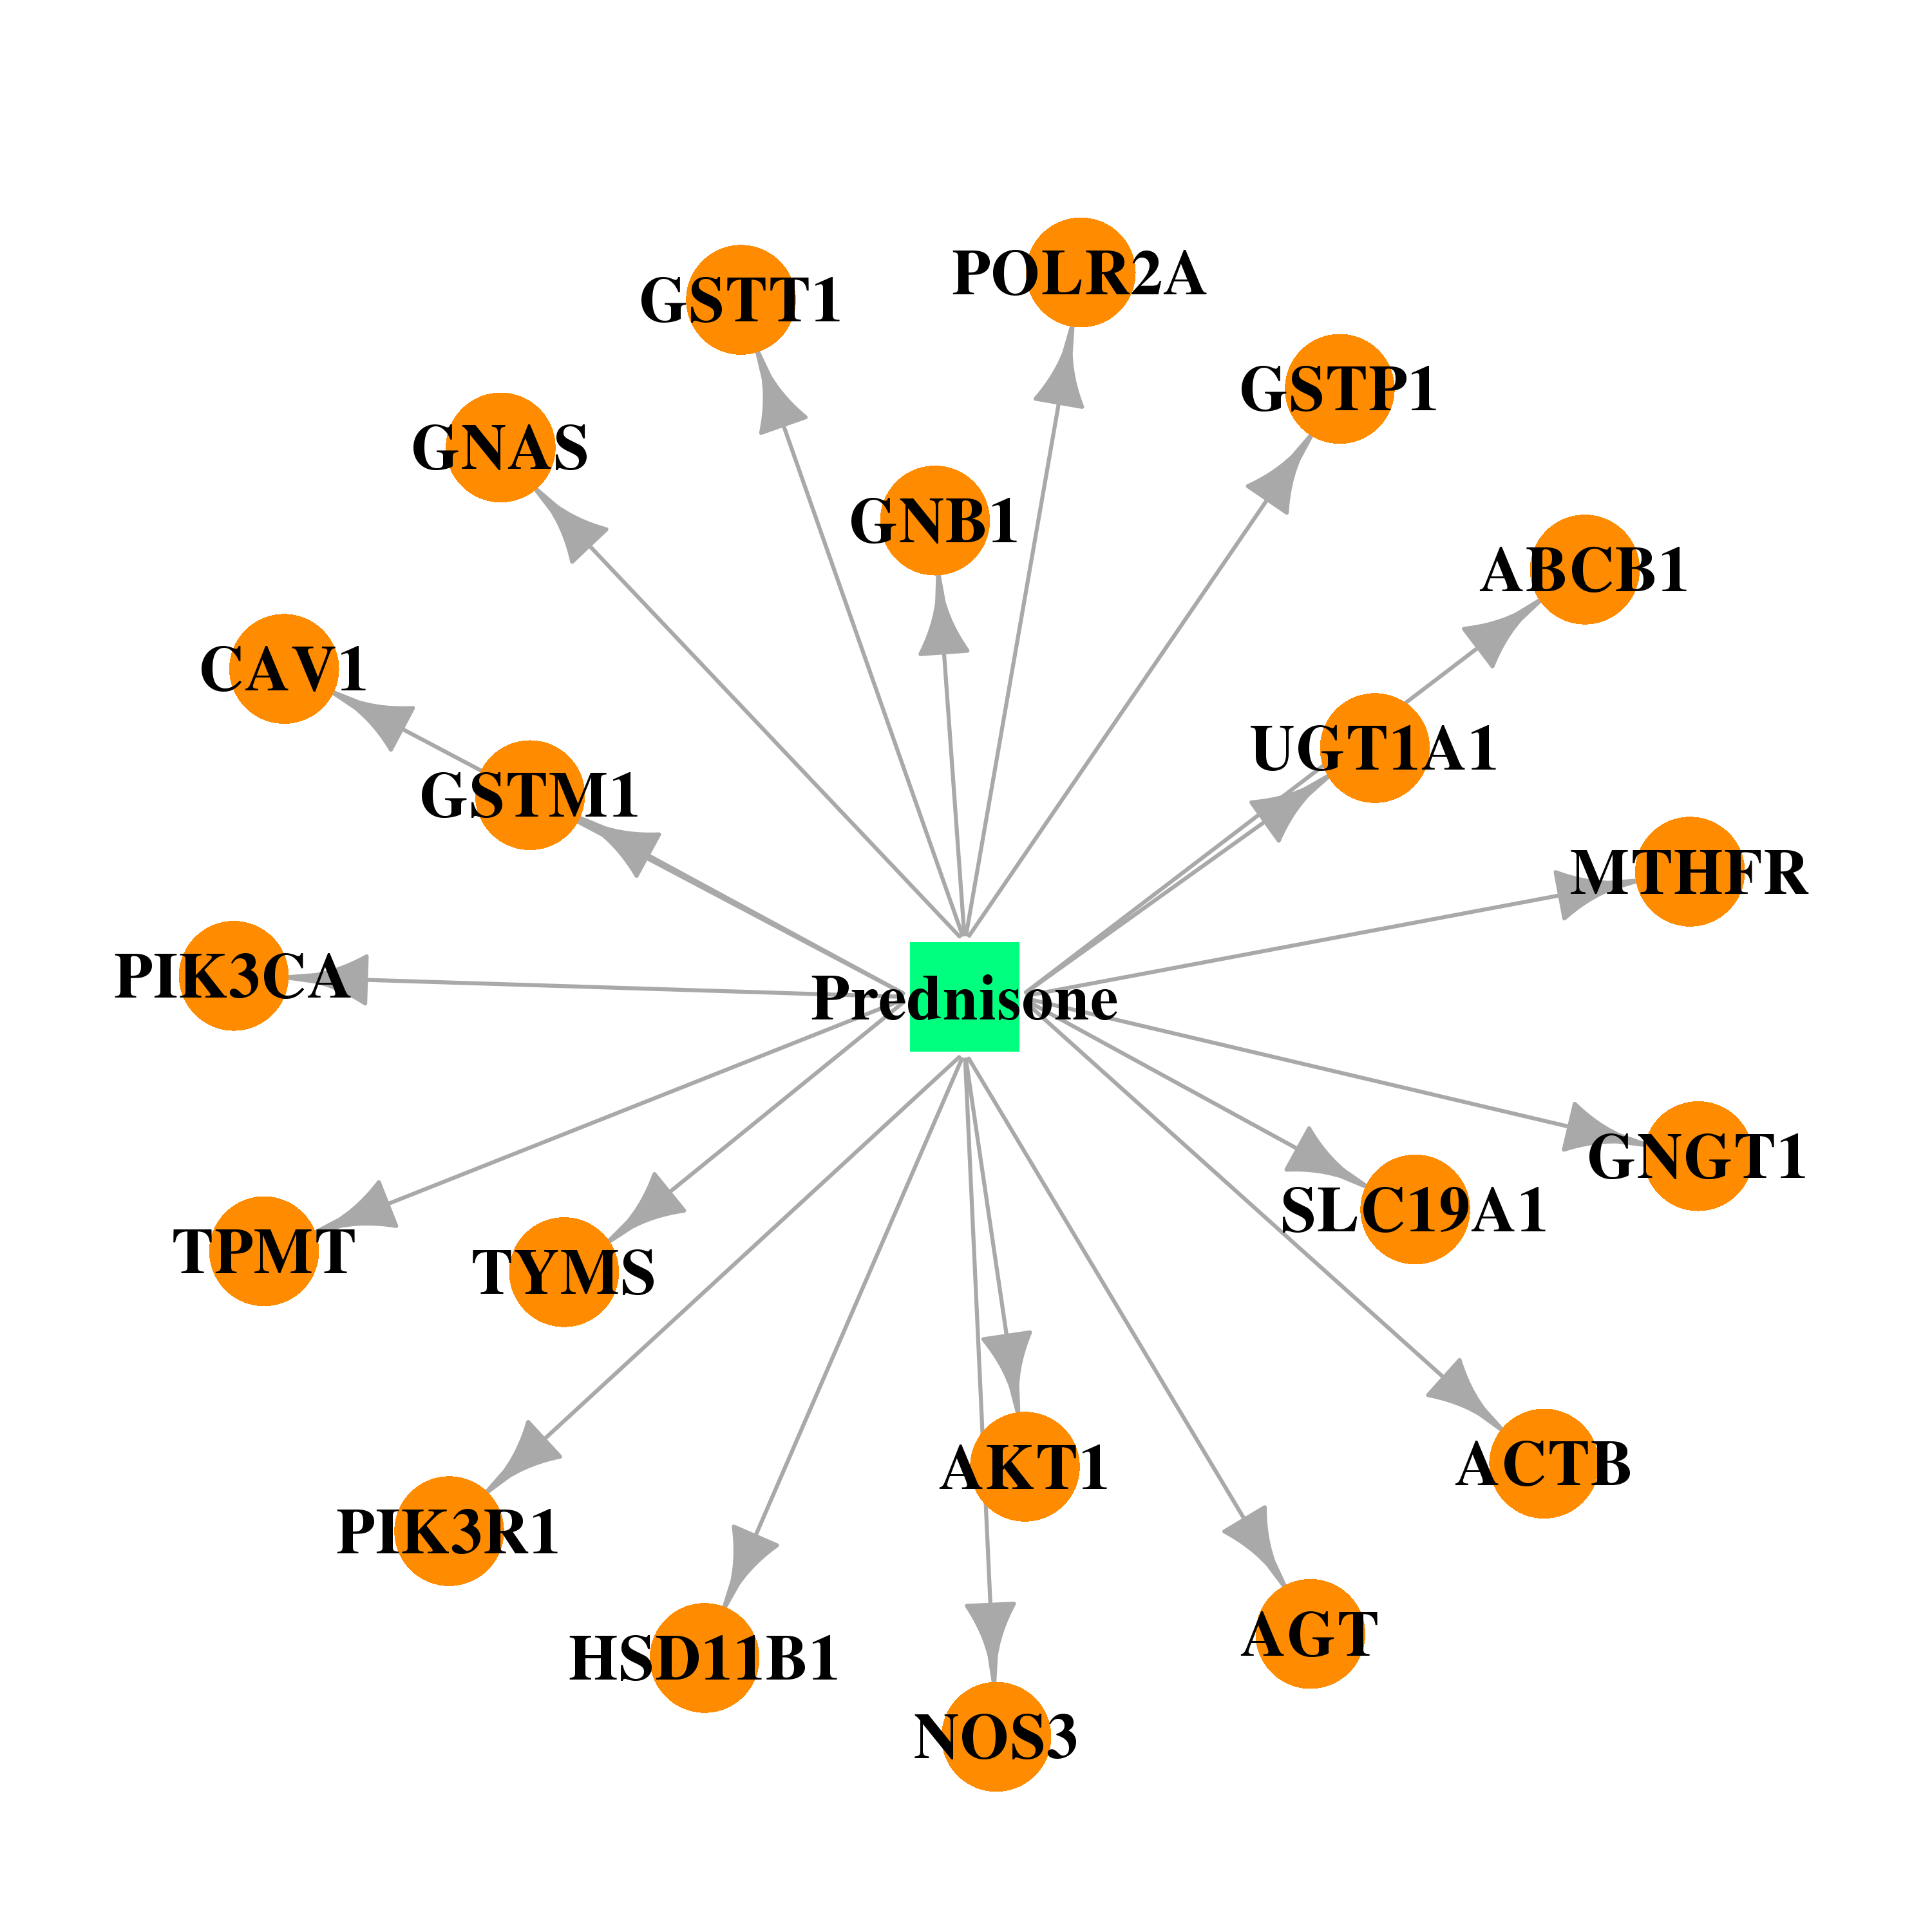 |  |
| DB00896 | actin, beta | approved | Rimexolone |  | 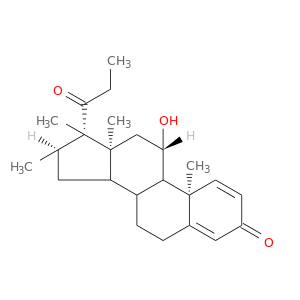 |
| DB00620 | actin, beta | approved | Triamcinolone |  |  |
| Top |
| Cross referenced IDs for ACTB |
| * We obtained these cross-references from Uniprot database. It covers 150 different DBs, 18 categories. http://www.uniprot.org/help/cross_references_section |
: Open all cross reference information
|
Copyright © 2016-Present - The Univsersity of Texas Health Science Center at Houston @ |