|
||||||||||||||||||||
| |
| Phenotypic Information (metabolism pathway, cancer, disease, phenome) |
| |
| |
| Gene-Gene Network Information: Co-Expression Network, Interacting Genes & KEGG |
| |
|


| Gene Summary for PPCDC |
| Top |
| Phenotypic Information for PPCDC(metabolism pathway, cancer, disease, phenome) |
| Cancer | CGAP: PPCDC |
| Familial Cancer Database: PPCDC | |
| * This gene is included in those cancer gene databases. |
|
|
|
|
|
| . | ||||||||||||||
Oncogene 1 | Significant driver gene in | |||||||||||||||||||
| cf) number; DB name 1 Oncogene; http://nar.oxfordjournals.org/content/35/suppl_1/D721.long, 2 Tumor Suppressor gene; https://bioinfo.uth.edu/TSGene/, 3 Cancer Gene Census; http://www.nature.com/nrc/journal/v4/n3/abs/nrc1299.html, 4 CancerGenes; http://nar.oxfordjournals.org/content/35/suppl_1/D721.long, 5 Network of Cancer Gene; http://ncg.kcl.ac.uk/index.php, 1Therapeutic Vulnerabilities in Cancer; http://cbio.mskcc.org/cancergenomics/statius/ |
| REACTOME_METABOLISM_OF_VITAMINS_AND_COFACTORS | |
| OMIM | |
| Orphanet | |
| Disease | KEGG Disease: PPCDC |
| MedGen: PPCDC (Human Medical Genetics with Condition) | |
| ClinVar: PPCDC | |
| Phenotype | MGI: PPCDC (International Mouse Phenotyping Consortium) |
| PhenomicDB: PPCDC | |
| Mutations for PPCDC |
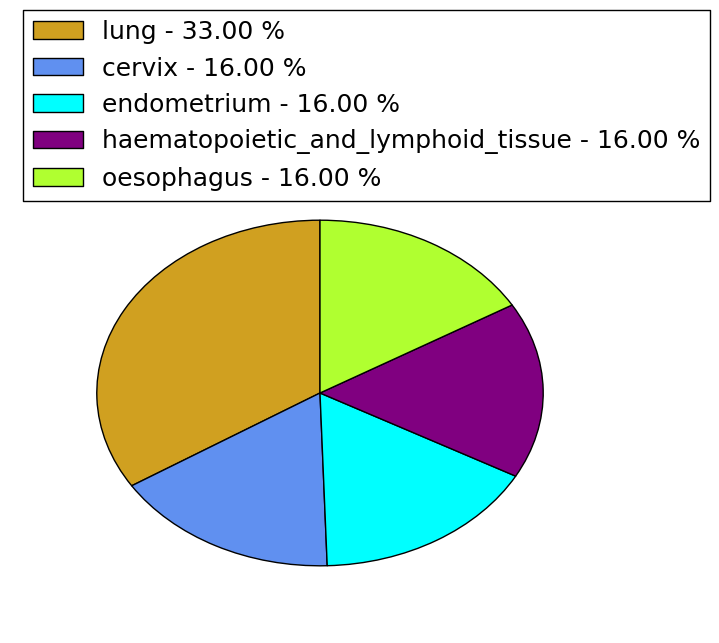
| * Under tables are showing count per each tissue to give us broad intuition about tissue specific mutation patterns.You can go to the detailed page for each mutation database's web site. |
| - Statistics for Tissue and Mutation type | Top |
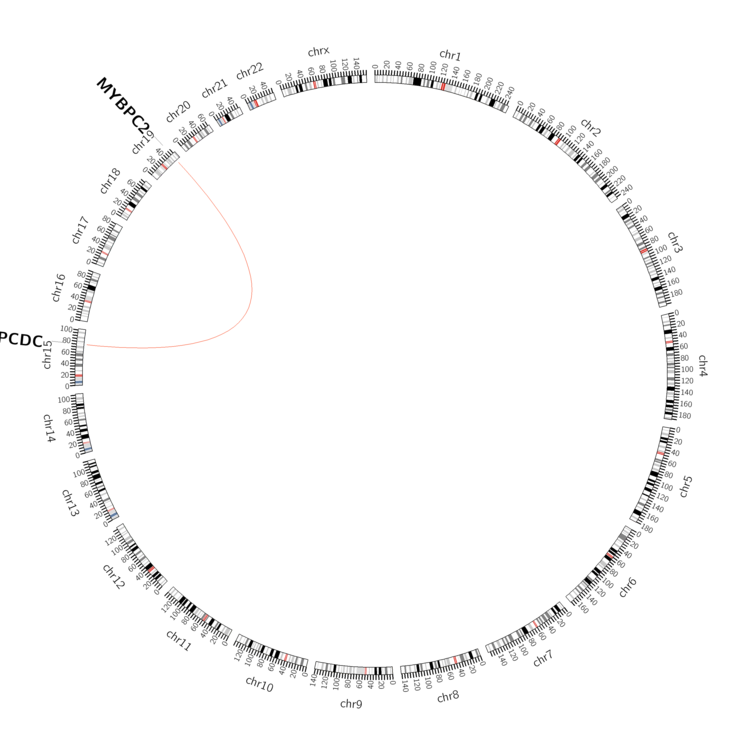 |
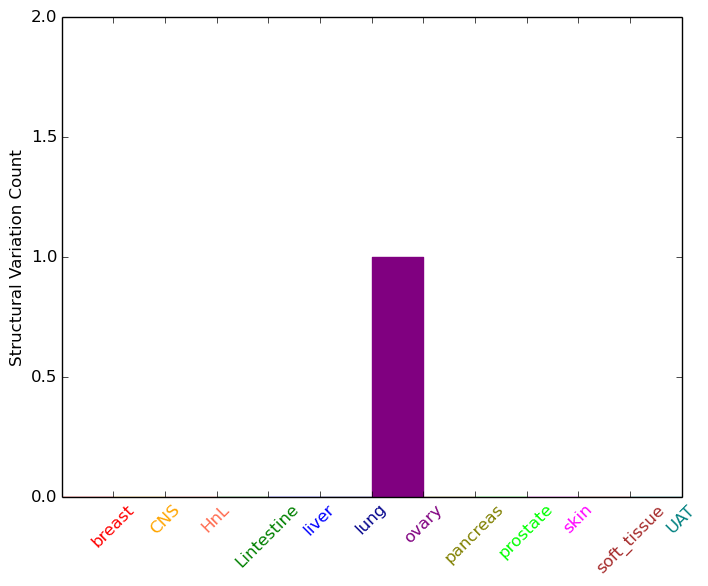
| - For Inter-chromosomal Variations |
| * Inter-chromosomal variantions includes 'interchromosomal amplicon to amplicon', 'interchromosomal amplicon to non-amplified dna', 'interchromosomal insertion', 'Interchromosomal unknown type'. |
 |
| - For Intra-chromosomal Variations |
| There's no intra-chromosomal structural variation. |
| Sample | Symbol_a | Chr_a | Start_a | End_a | Symbol_b | Chr_b | Start_b | End_b |
| ovary | PPCDC | chr15 | 75330117 | 75330137 | MYBPC2 | chr19 | 50951875 | 50951895 |
| cf) Tissue number; Tissue name (1;Breast, 2;Central_nervous_system, 3;Haematopoietic_and_lymphoid_tissue, 4;Large_intestine, 5;Liver, 6;Lung, 7;Ovary, 8;Pancreas, 9;Prostate, 10;Skin, 11;Soft_tissue, 12;Upper_aerodigestive_tract) |
| * From mRNA Sanger sequences, Chitars2.0 arranged chimeric transcripts. This table shows PPCDC related fusion information. |
| ID | Head Gene | Tail Gene | Accession | Gene_a | qStart_a | qEnd_a | Chromosome_a | tStart_a | tEnd_a | Gene_a | qStart_a | qEnd_a | Chromosome_a | tStart_a | tEnd_a |
| Top |
| There's no copy number variation information in COSMIC data for this gene. |
| Top |
|
 |
| Top |
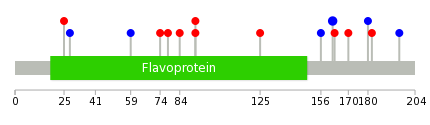
| Stat. for Non-Synonymous SNVs (# total SNVs=6) | (# total SNVs=2) |
 |  |
(# total SNVs=0) | (# total SNVs=0) |
| Top |
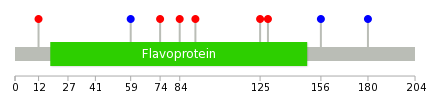
| * When you move the cursor on each content, you can see more deailed mutation information on the Tooltip. Those are primary_site,primary_histology,mutation(aa),pubmedID. |
| GRCh37 position | Mutation(aa) | Unique sampleID count |
| chr15:75341019-75341019 | p.V162V | 2 |
| chr15:75336745-75336745 | p.D84N | 1 |
| chr15:75336769-75336769 | p.R92W | 1 |
| chr15:75336770-75336770 | p.R92Q | 1 |
| chr15:75340907-75340907 | p.R125Q | 1 |
| chr15:75341001-75341001 | p.L156L | 1 |
| chr15:75320733-75320733 | p.T25M | 1 |
| chr15:75341021-75341021 | p.E163V | 1 |
| chr15:75320743-75320743 | p.V28V | 1 |
| chr15:75341043-75341043 | p.K170N | 1 |
| Top |
|
 |
| Point Mutation/ Tissue ID | 1 | 2 | 3 | 4 | 5 | 6 | 7 | 8 | 9 | 10 | 11 | 12 | 13 | 14 | 15 | 16 | 17 | 18 | 19 | 20 |
| # sample | 2 | 1 | 1 | 2 | 1 | 1 | 1 | |||||||||||||
| # mutation | 2 | 1 | 1 | 2 | 1 | 1 | 1 | |||||||||||||
| nonsynonymous SNV | 1 | 1 | 2 | 1 | 1 | |||||||||||||||
| synonymous SNV | 1 | 1 | 1 |
| cf) Tissue ID; Tissue type (1; BLCA[Bladder Urothelial Carcinoma], 2; BRCA[Breast invasive carcinoma], 3; CESC[Cervical squamous cell carcinoma and endocervical adenocarcinoma], 4; COAD[Colon adenocarcinoma], 5; GBM[Glioblastoma multiforme], 6; Glioma Low Grade, 7; HNSC[Head and Neck squamous cell carcinoma], 8; KICH[Kidney Chromophobe], 9; KIRC[Kidney renal clear cell carcinoma], 10; KIRP[Kidney renal papillary cell carcinoma], 11; LAML[Acute Myeloid Leukemia], 12; LUAD[Lung adenocarcinoma], 13; LUSC[Lung squamous cell carcinoma], 14; OV[Ovarian serous cystadenocarcinoma ], 15; PAAD[Pancreatic adenocarcinoma], 16; PRAD[Prostate adenocarcinoma], 17; SKCM[Skin Cutaneous Melanoma], 18:STAD[Stomach adenocarcinoma], 19:THCA[Thyroid carcinoma], 20:UCEC[Uterine Corpus Endometrial Carcinoma]) |
| Top |
| * We represented just top 10 SNVs. When you move the cursor on each content, you can see more deailed mutation information on the Tooltip. Those are primary_site, primary_histology, mutation(aa), pubmedID. |
| Genomic Position | Mutation(aa) | Unique sampleID count |
| chr15:75336770 | p.R92Q | 1 |
| chr15:75340907 | p.R125Q | 1 |
| chr15:75340919 | p.R129H | 1 |
| chr15:75341001 | p.L156L | 1 |
| chr15:75341501 | p.A180A | 1 |
| chr15:75320694 | p.P12H | 1 |
| chr15:75335823 | p.F59F | 1 |
| chr15:75335866 | p.D74N | 1 |
| chr15:75336745 | p.D84N | 1 |
| * Copy number data were extracted from TCGA using R package TCGA-Assembler. The URLs of all public data files on TCGA DCC data server were gathered on Jan-05-2015. Function ProcessCNAData in TCGA-Assembler package was used to obtain gene-level copy number value which is calculated as the average copy number of the genomic region of a gene. |
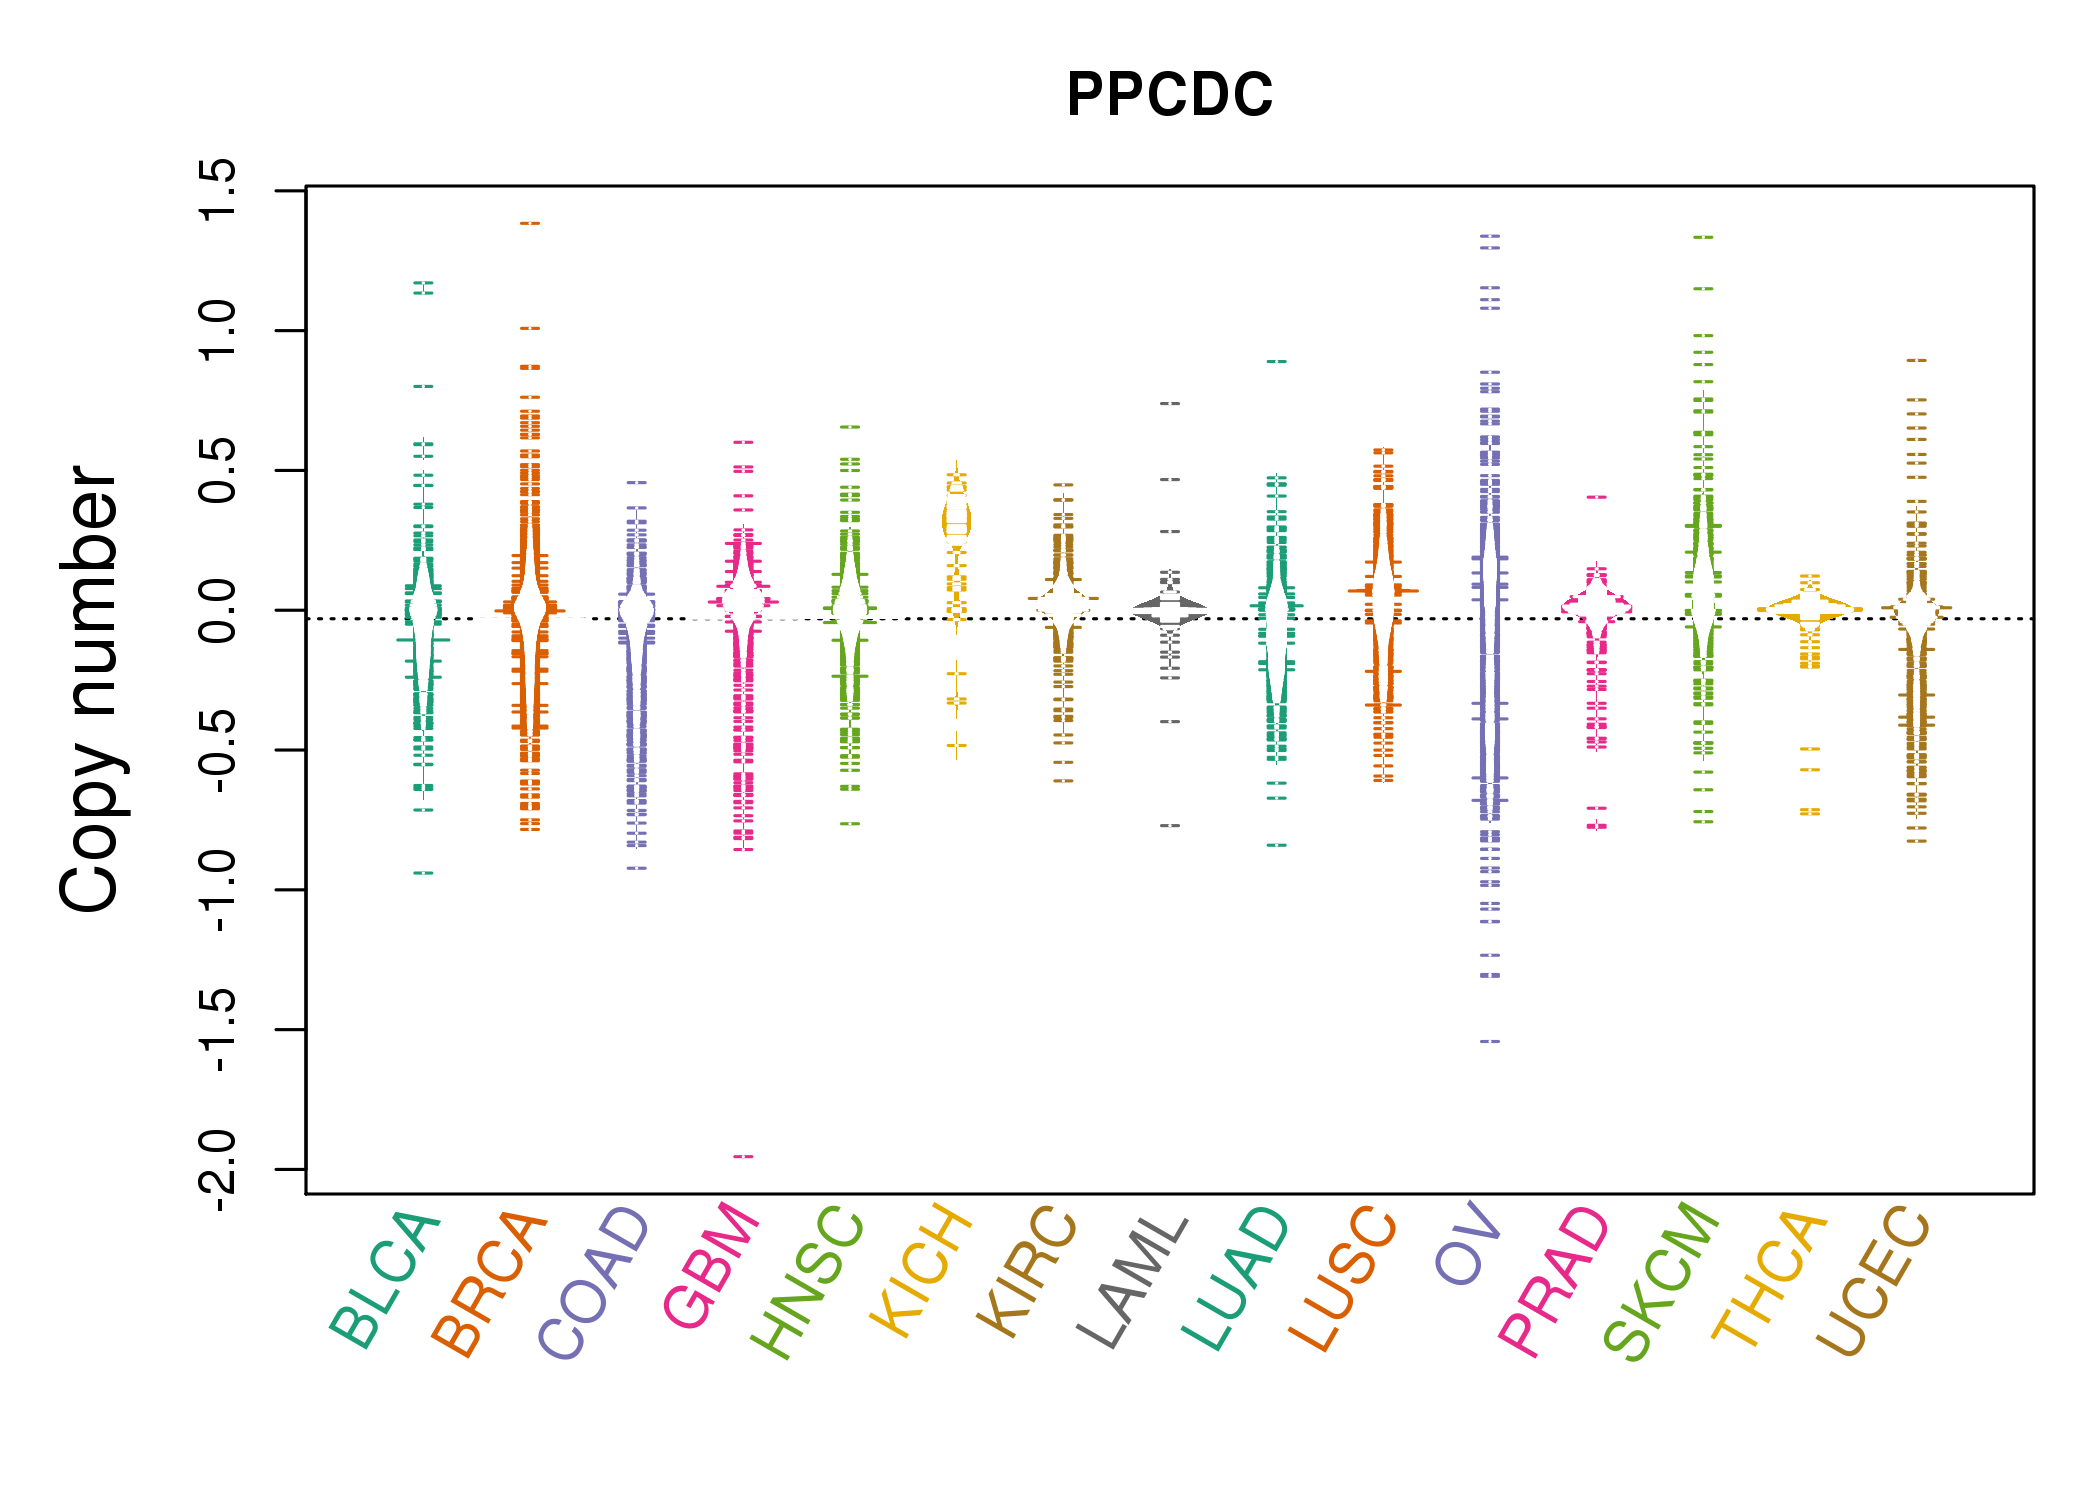 |
| cf) Tissue ID[Tissue type]: BLCA[Bladder Urothelial Carcinoma], BRCA[Breast invasive carcinoma], CESC[Cervical squamous cell carcinoma and endocervical adenocarcinoma], COAD[Colon adenocarcinoma], GBM[Glioblastoma multiforme], Glioma Low Grade, HNSC[Head and Neck squamous cell carcinoma], KICH[Kidney Chromophobe], KIRC[Kidney renal clear cell carcinoma], KIRP[Kidney renal papillary cell carcinoma], LAML[Acute Myeloid Leukemia], LUAD[Lung adenocarcinoma], LUSC[Lung squamous cell carcinoma], OV[Ovarian serous cystadenocarcinoma ], PAAD[Pancreatic adenocarcinoma], PRAD[Prostate adenocarcinoma], SKCM[Skin Cutaneous Melanoma], STAD[Stomach adenocarcinoma], THCA[Thyroid carcinoma], UCEC[Uterine Corpus Endometrial Carcinoma] |
| Top |
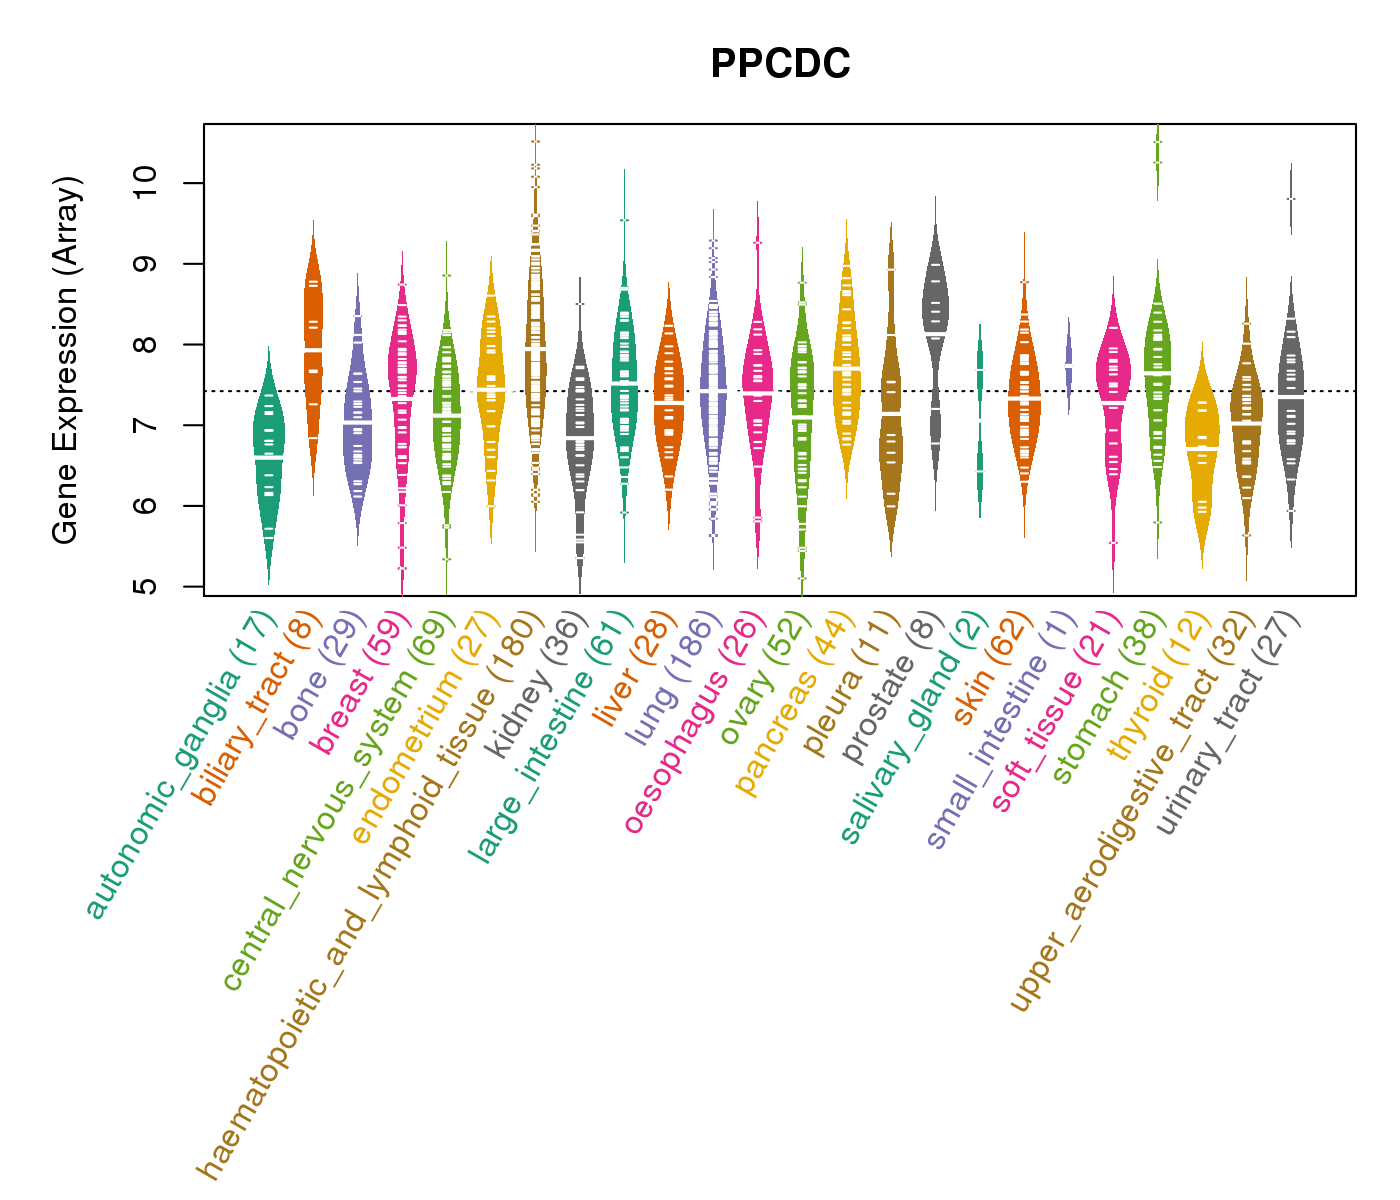
| Gene Expression for PPCDC |
| * CCLE gene expression data were extracted from CCLE_Expression_Entrez_2012-10-18.res: Gene-centric RMA-normalized mRNA expression data. |
 |
| * Normalized gene expression data of RNASeqV2 was extracted from TCGA using R package TCGA-Assembler. The URLs of all public data files on TCGA DCC data server were gathered at Jan-05-2015. Only eight cancer types have enough normal control samples for differential expression analysis. (t test, adjusted p<0.05 (using Benjamini-Hochberg FDR)) |
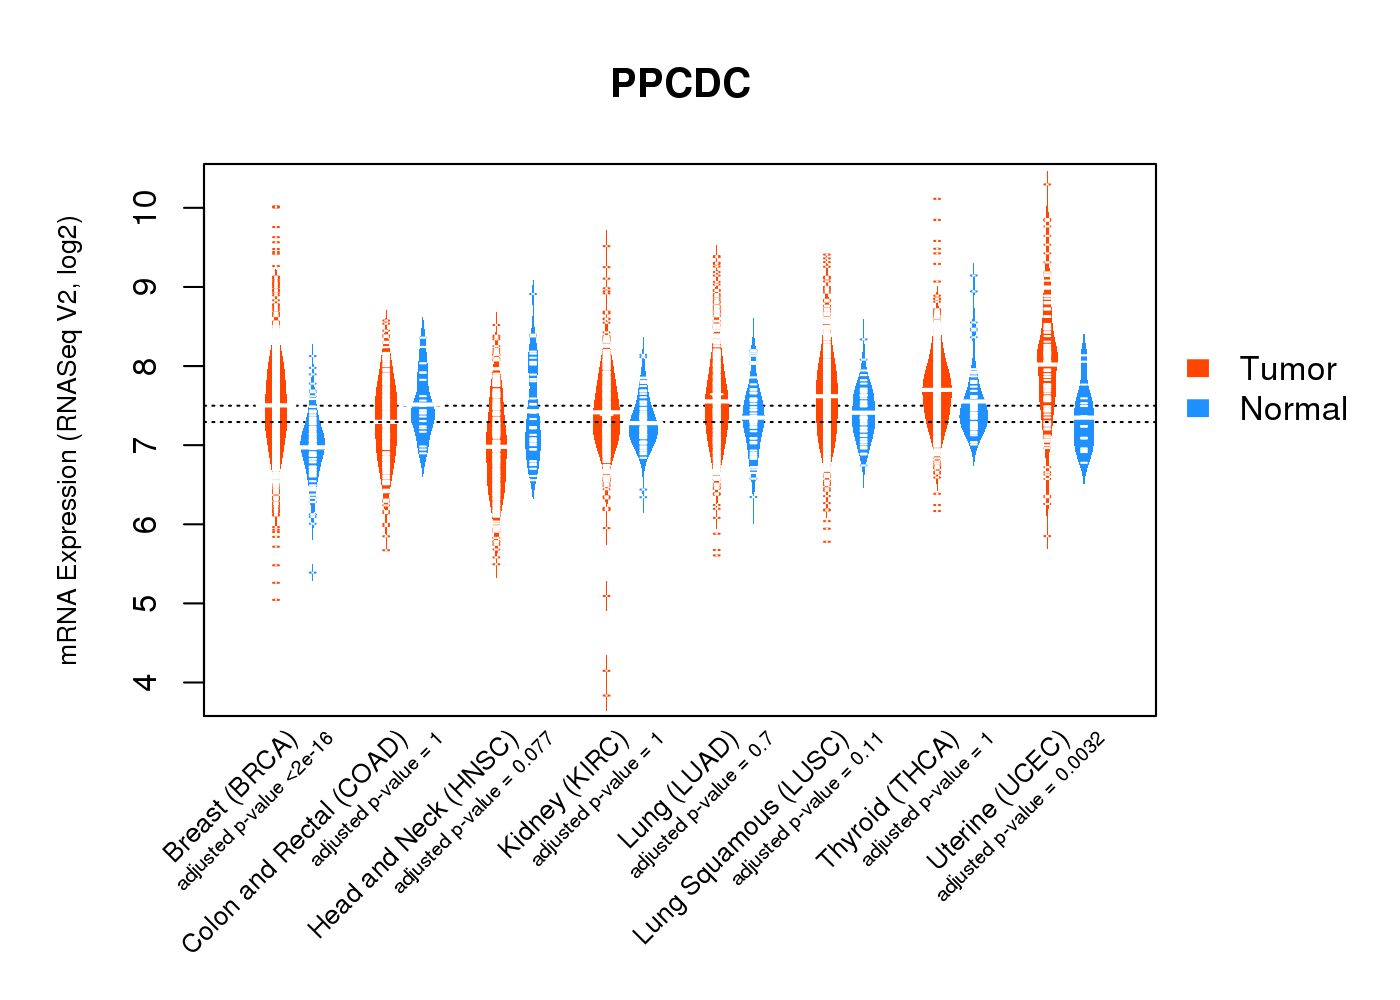 |
| Top |
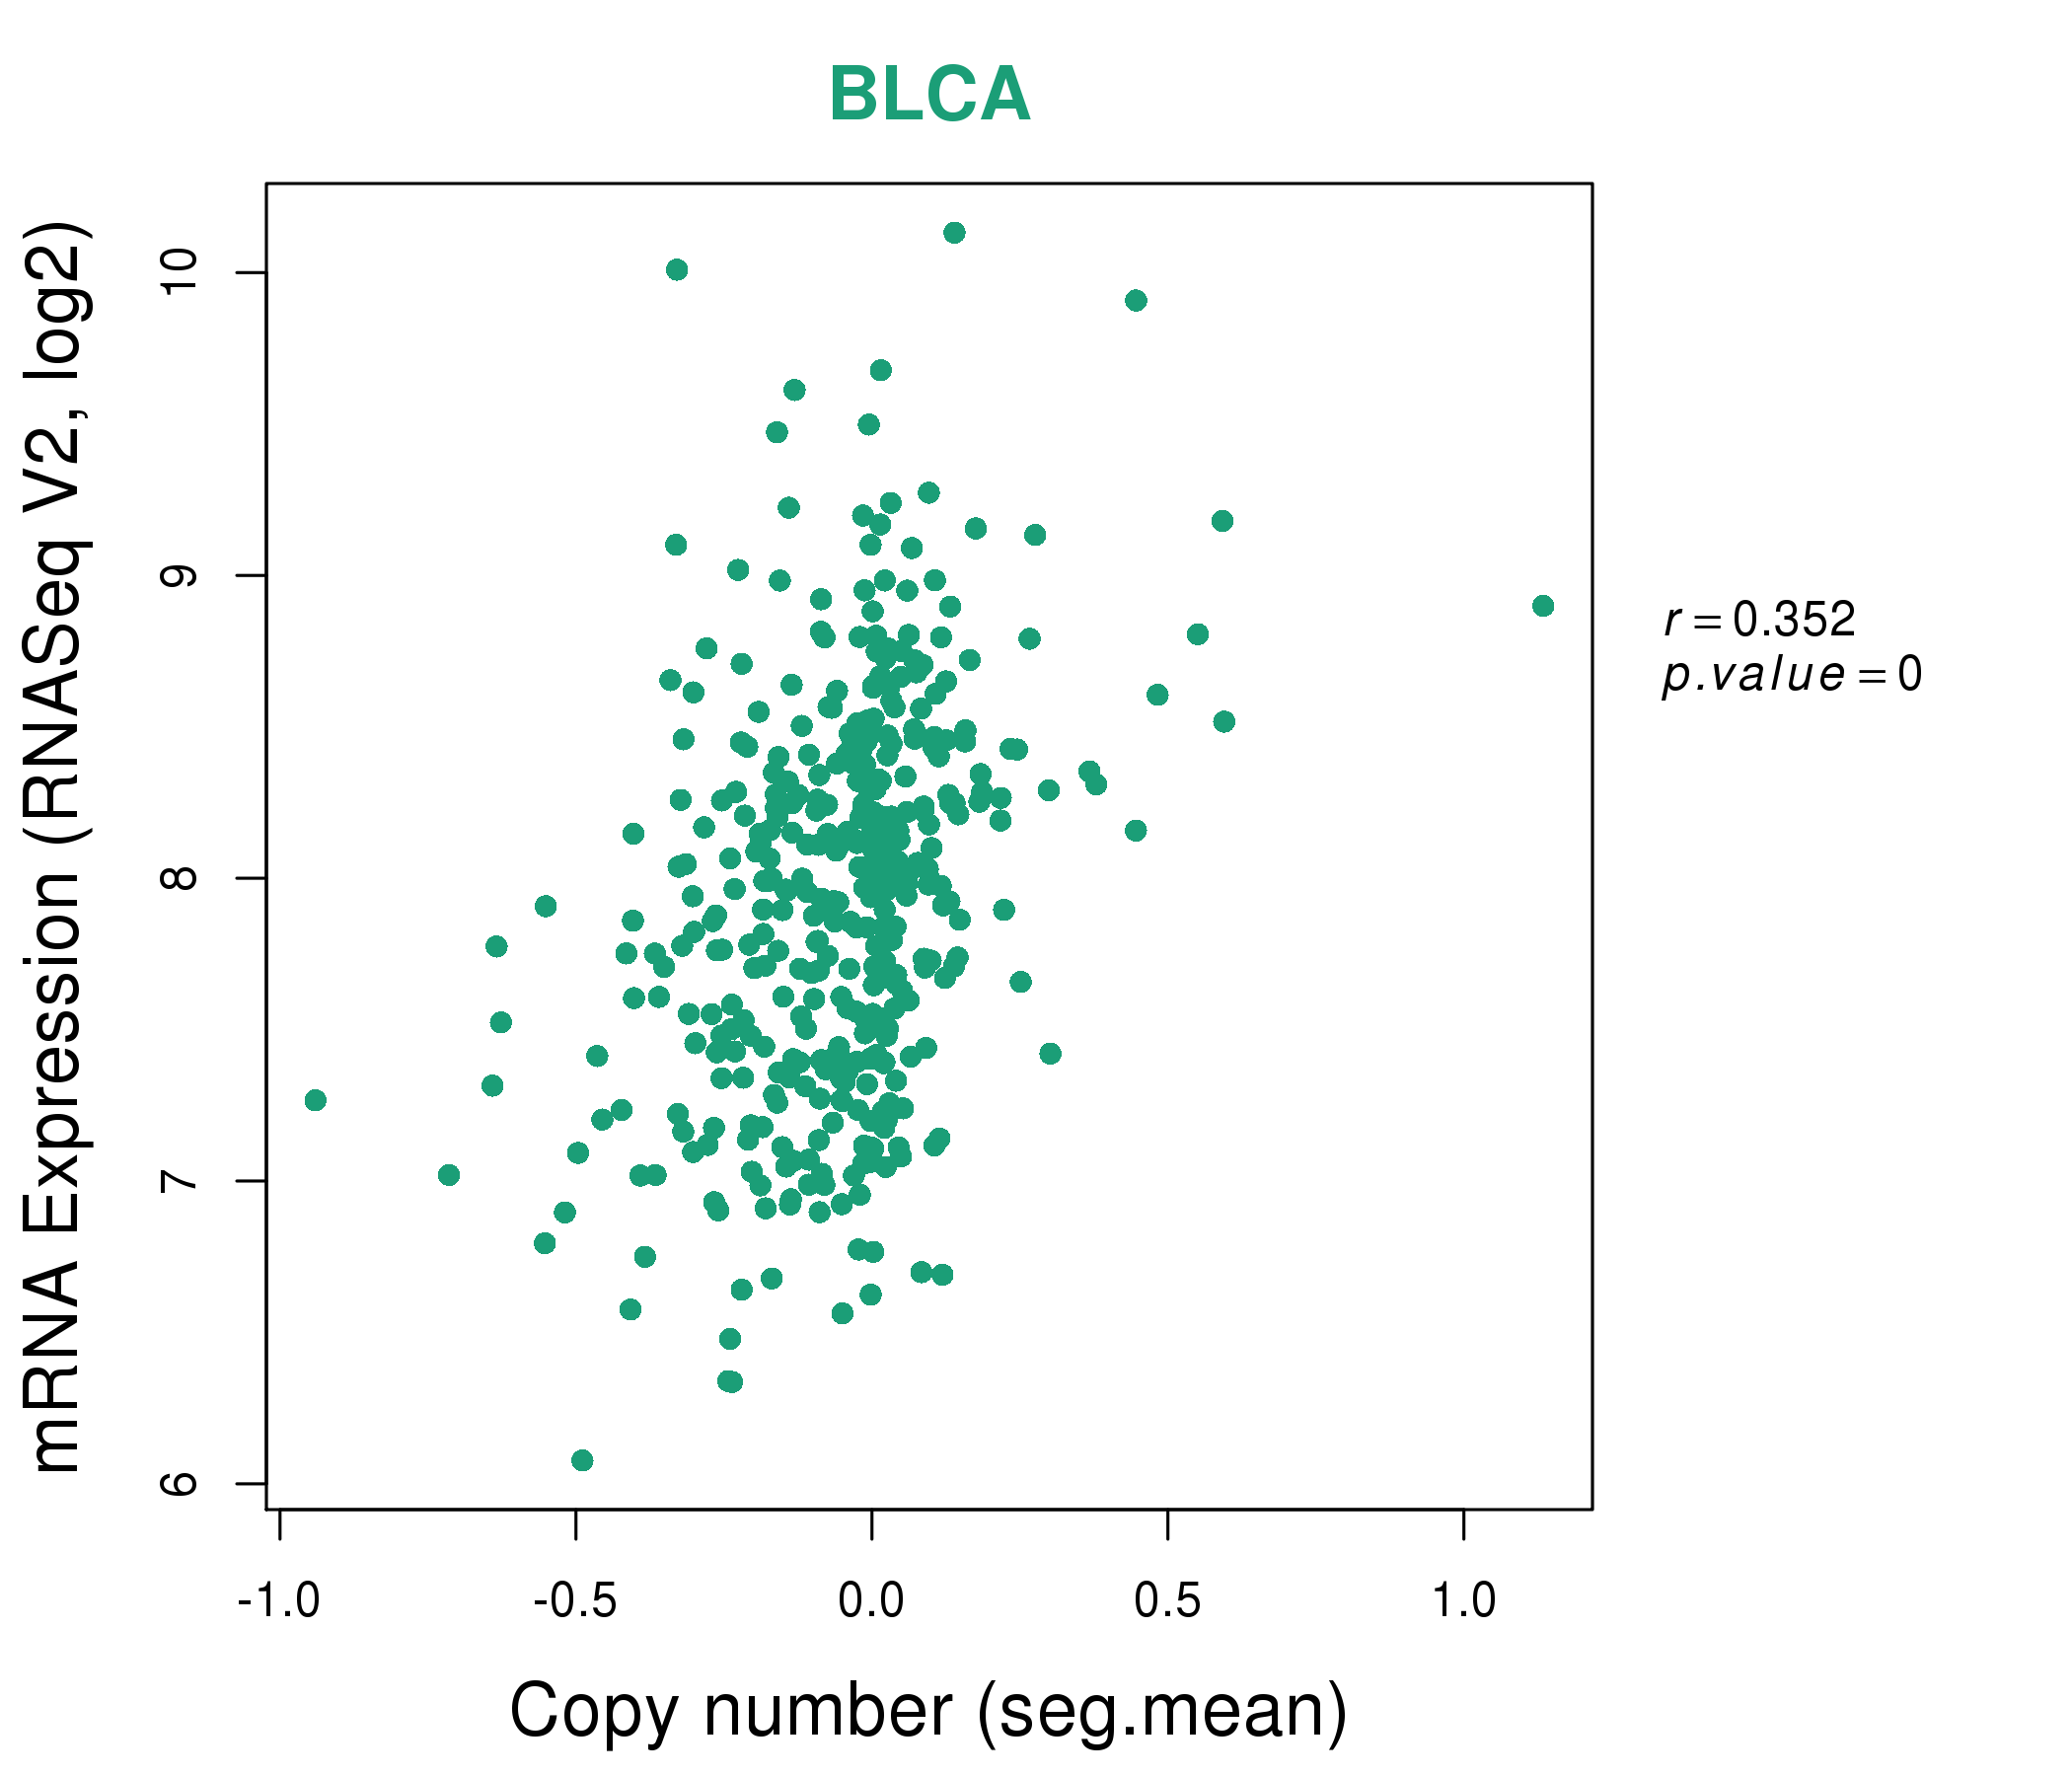
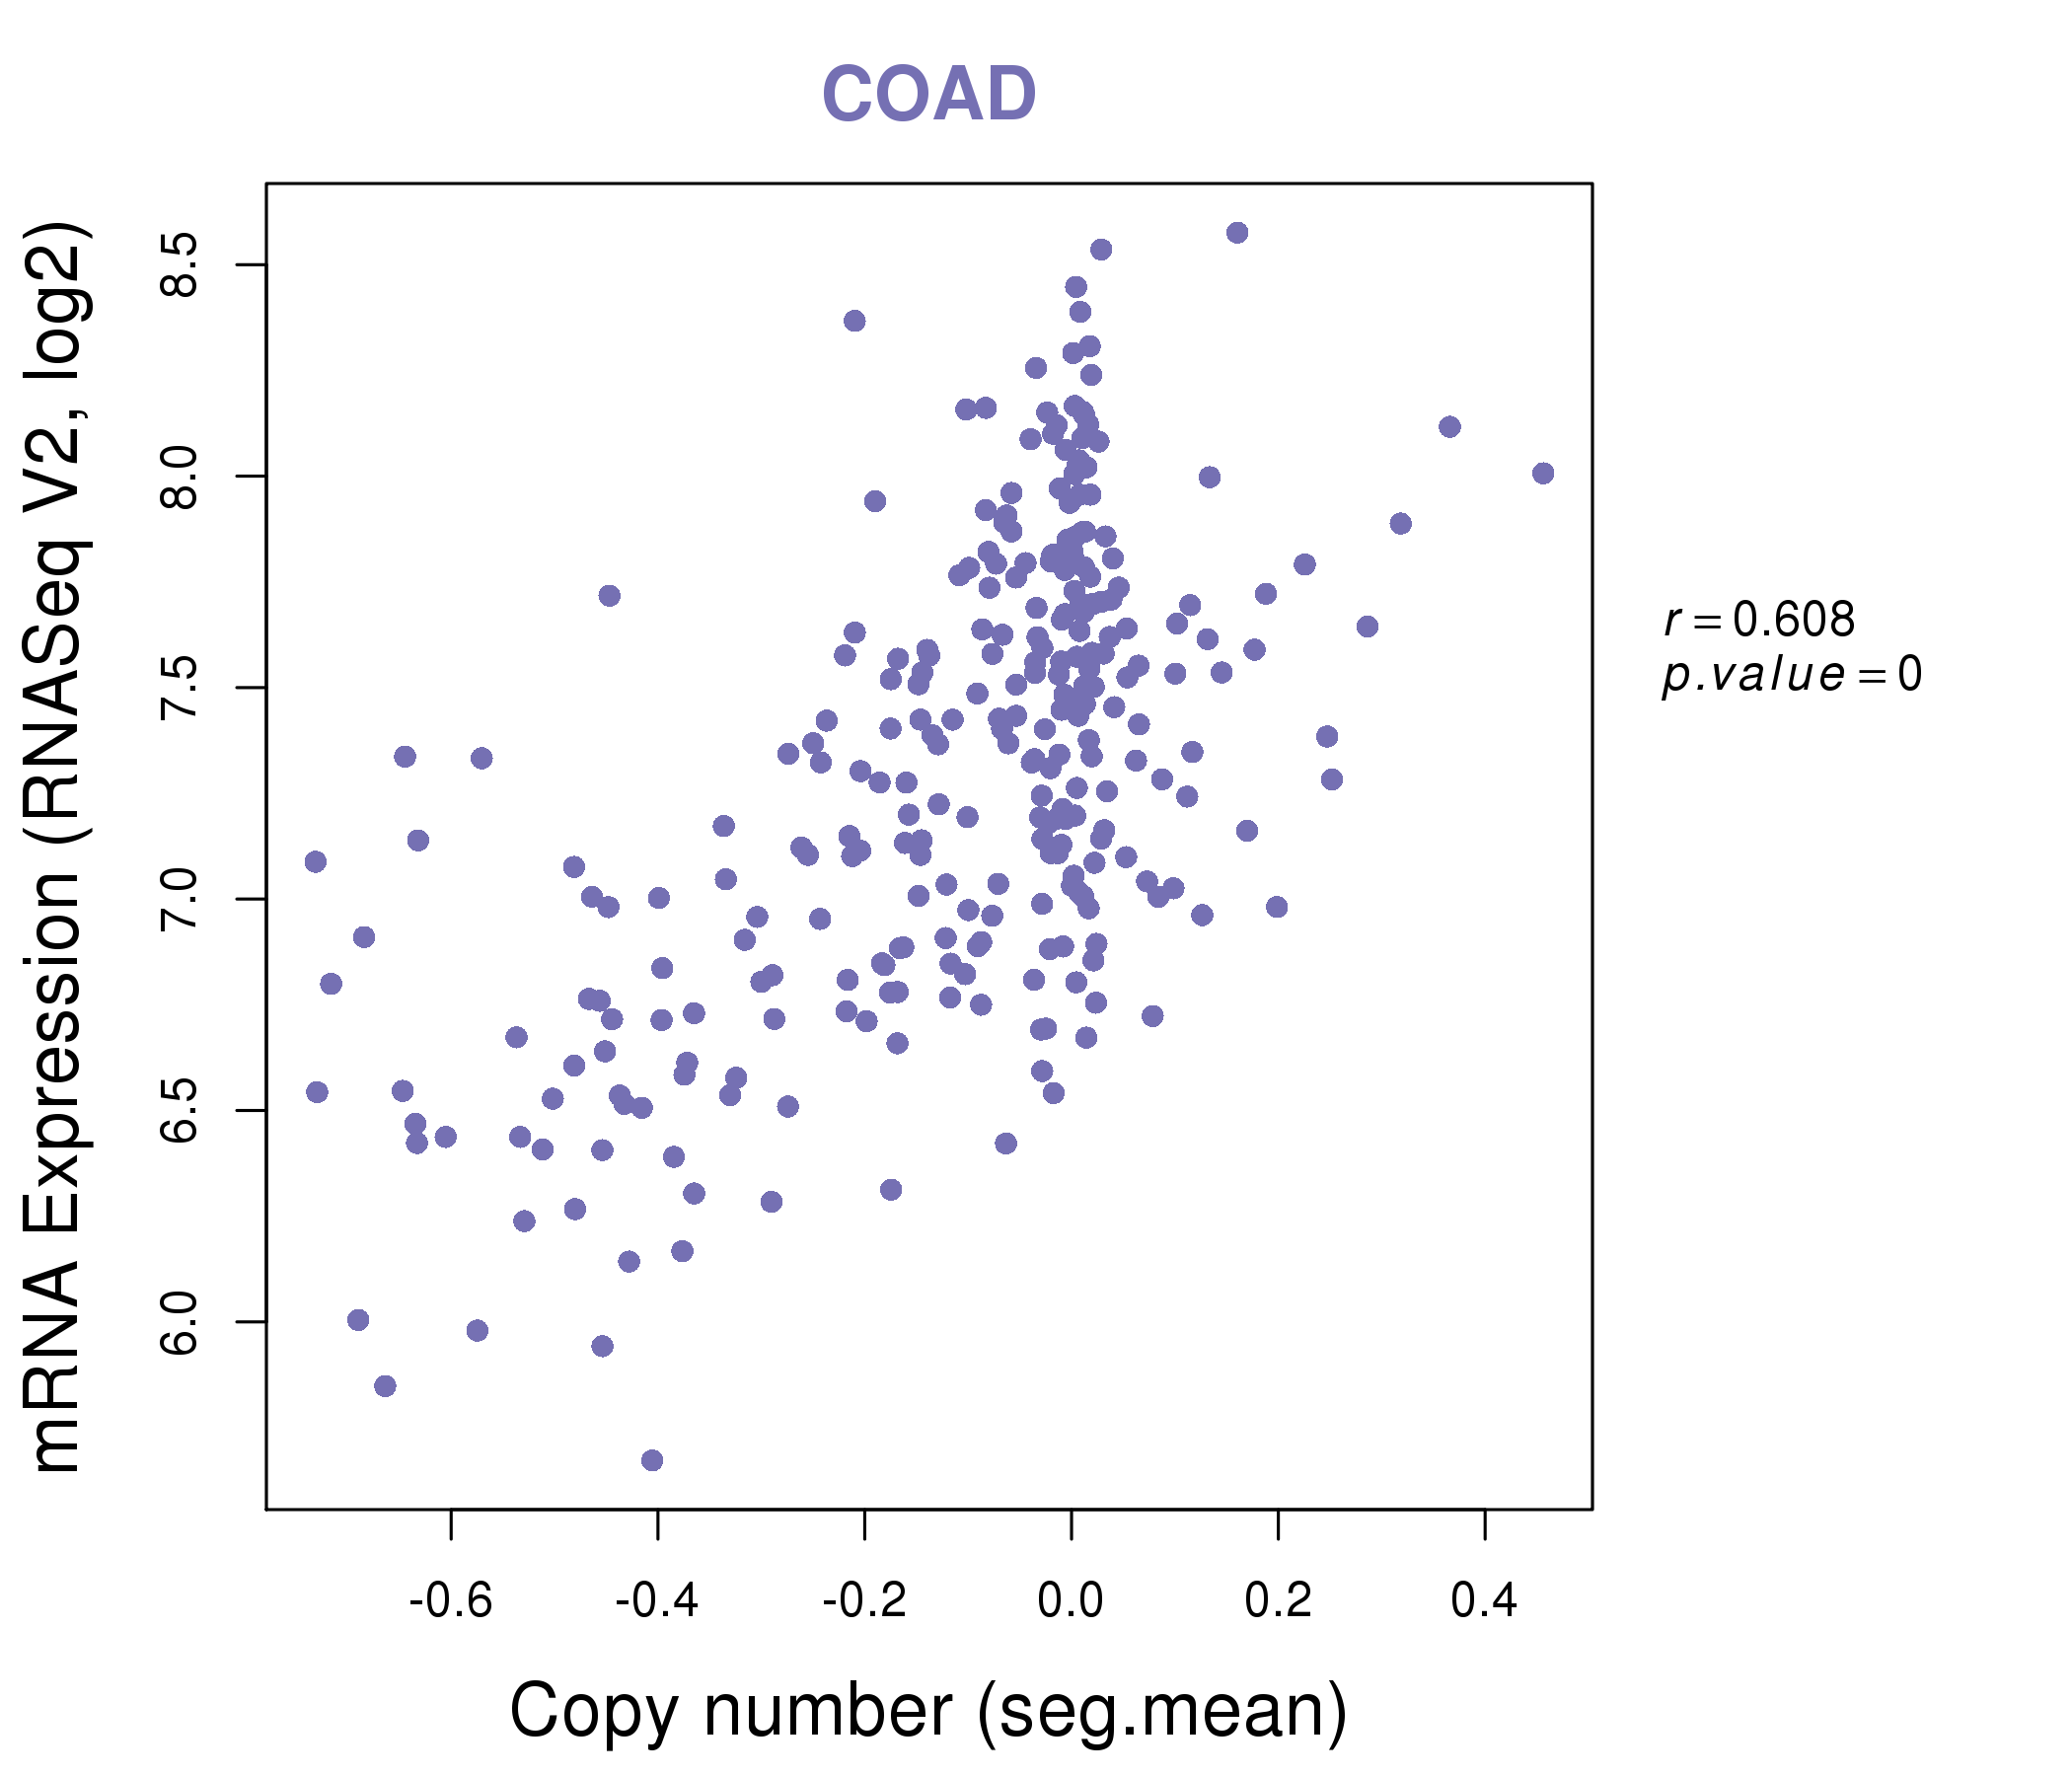
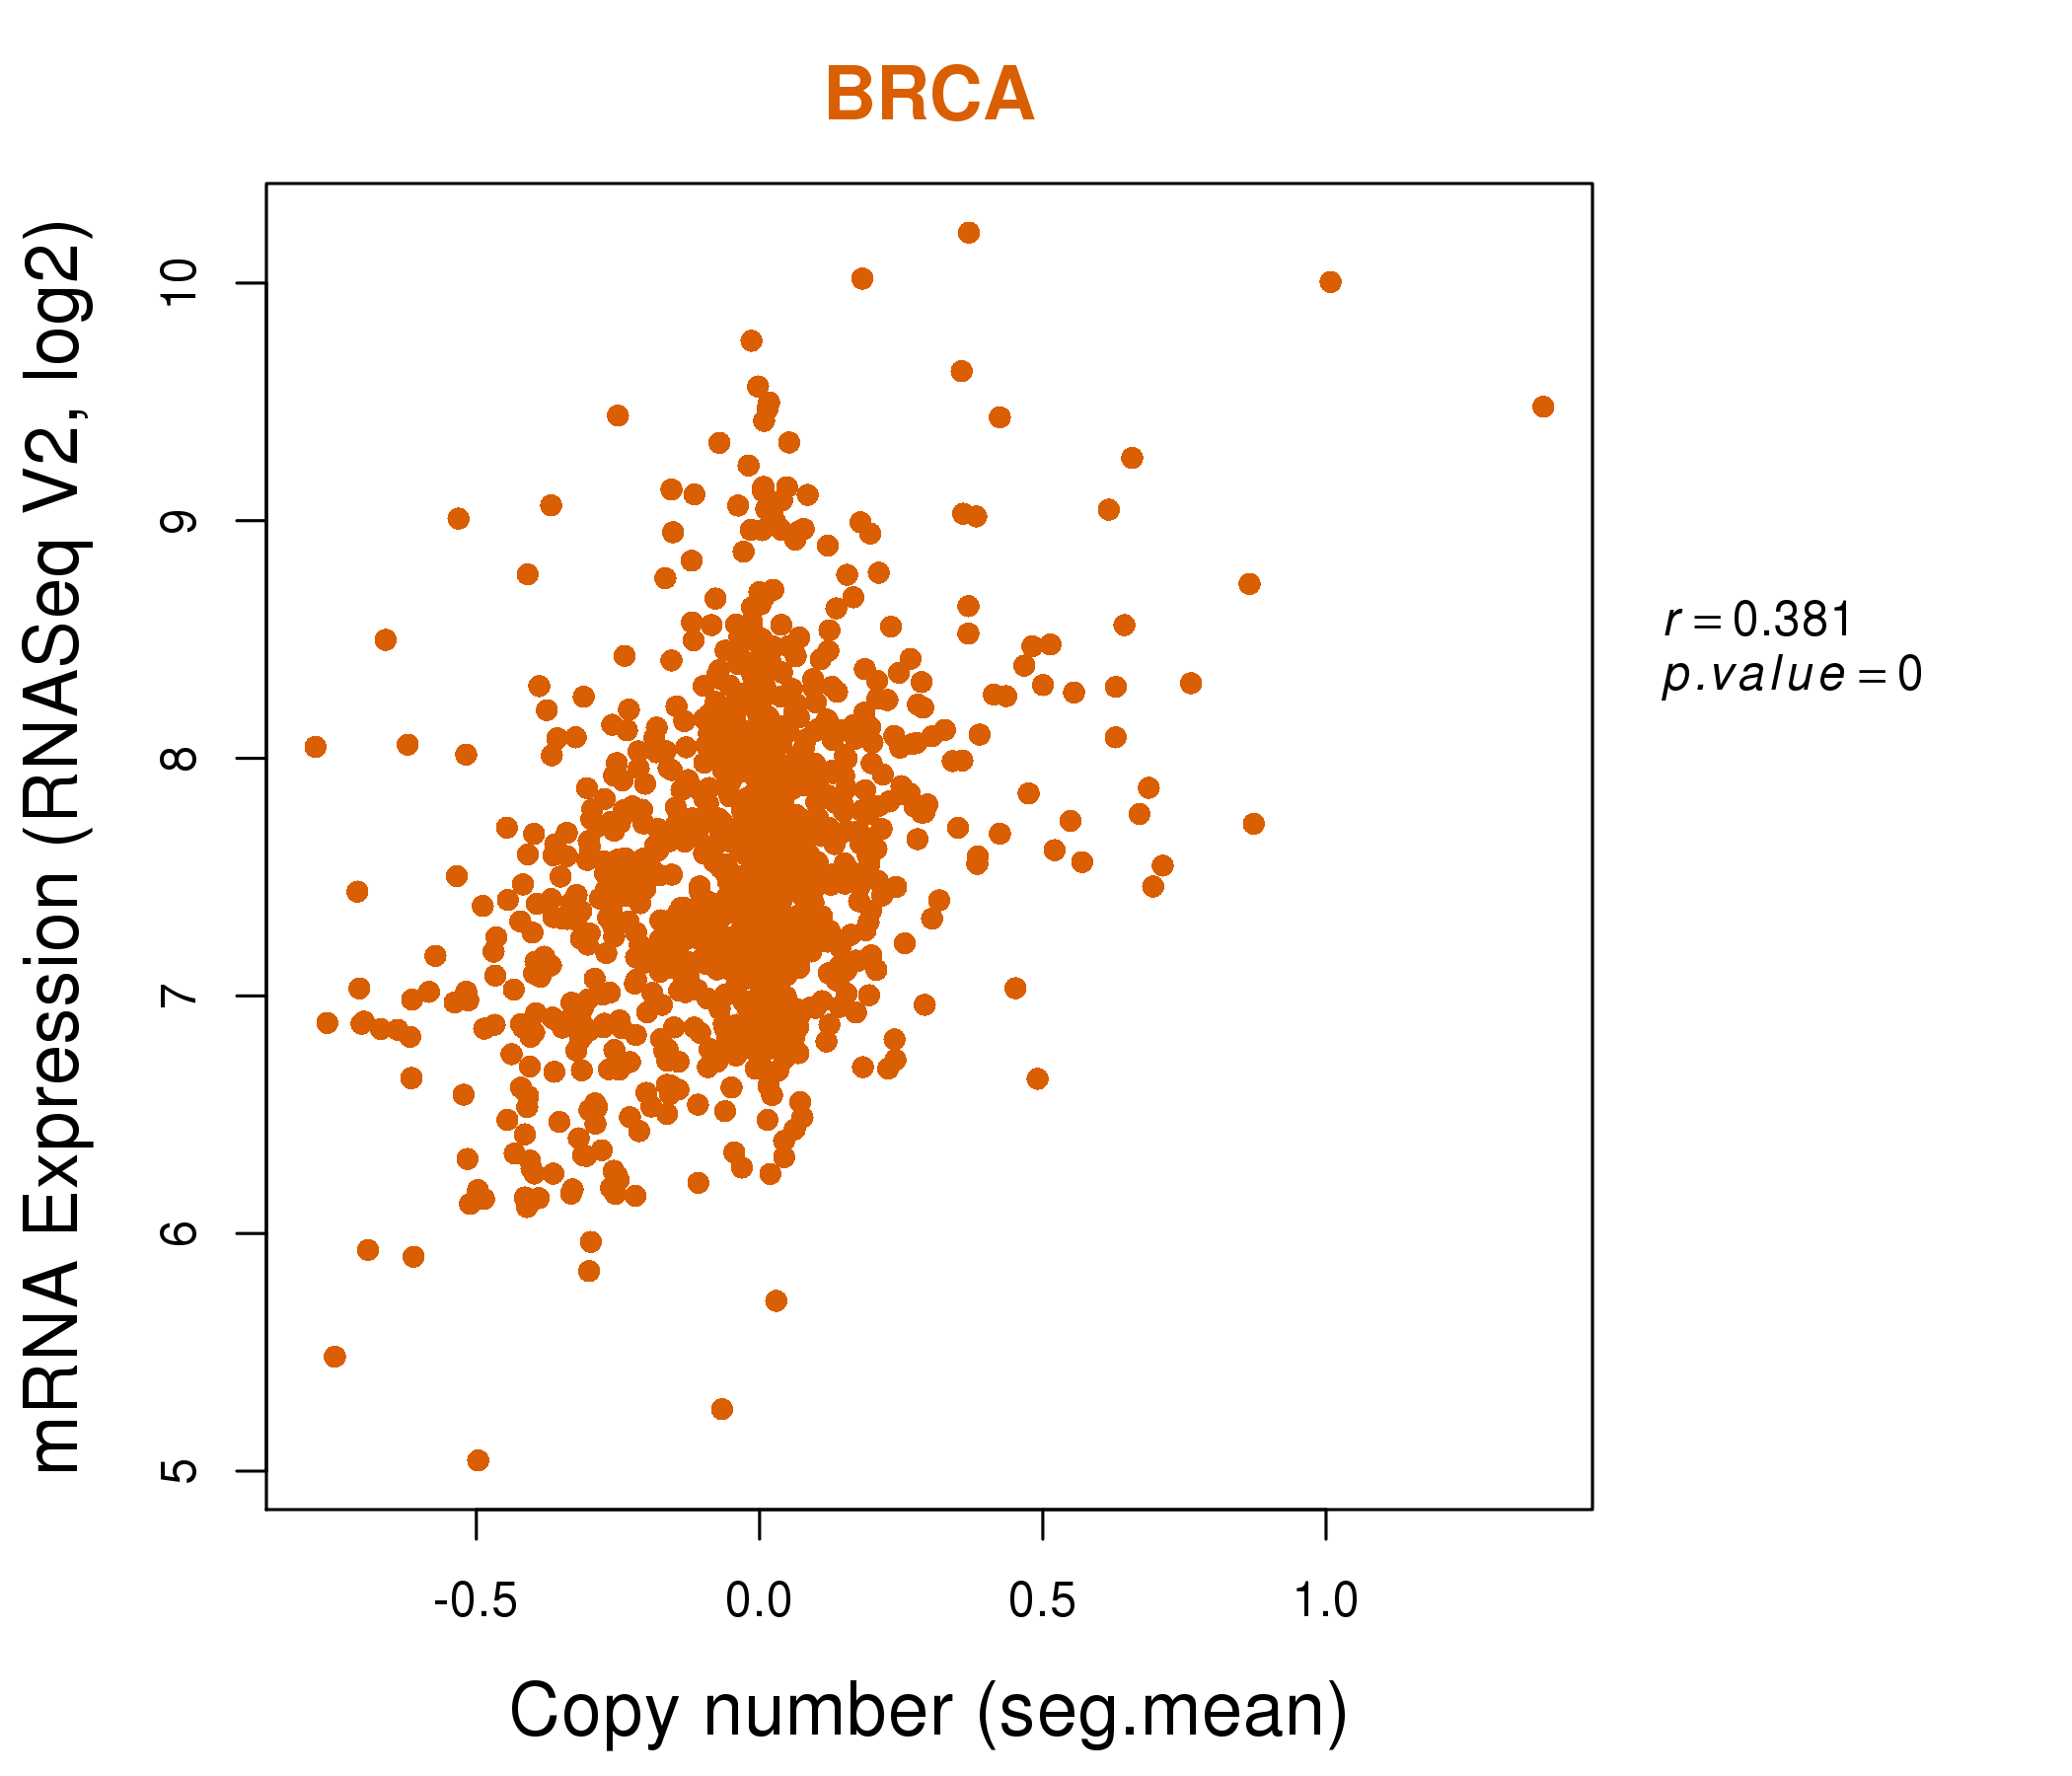
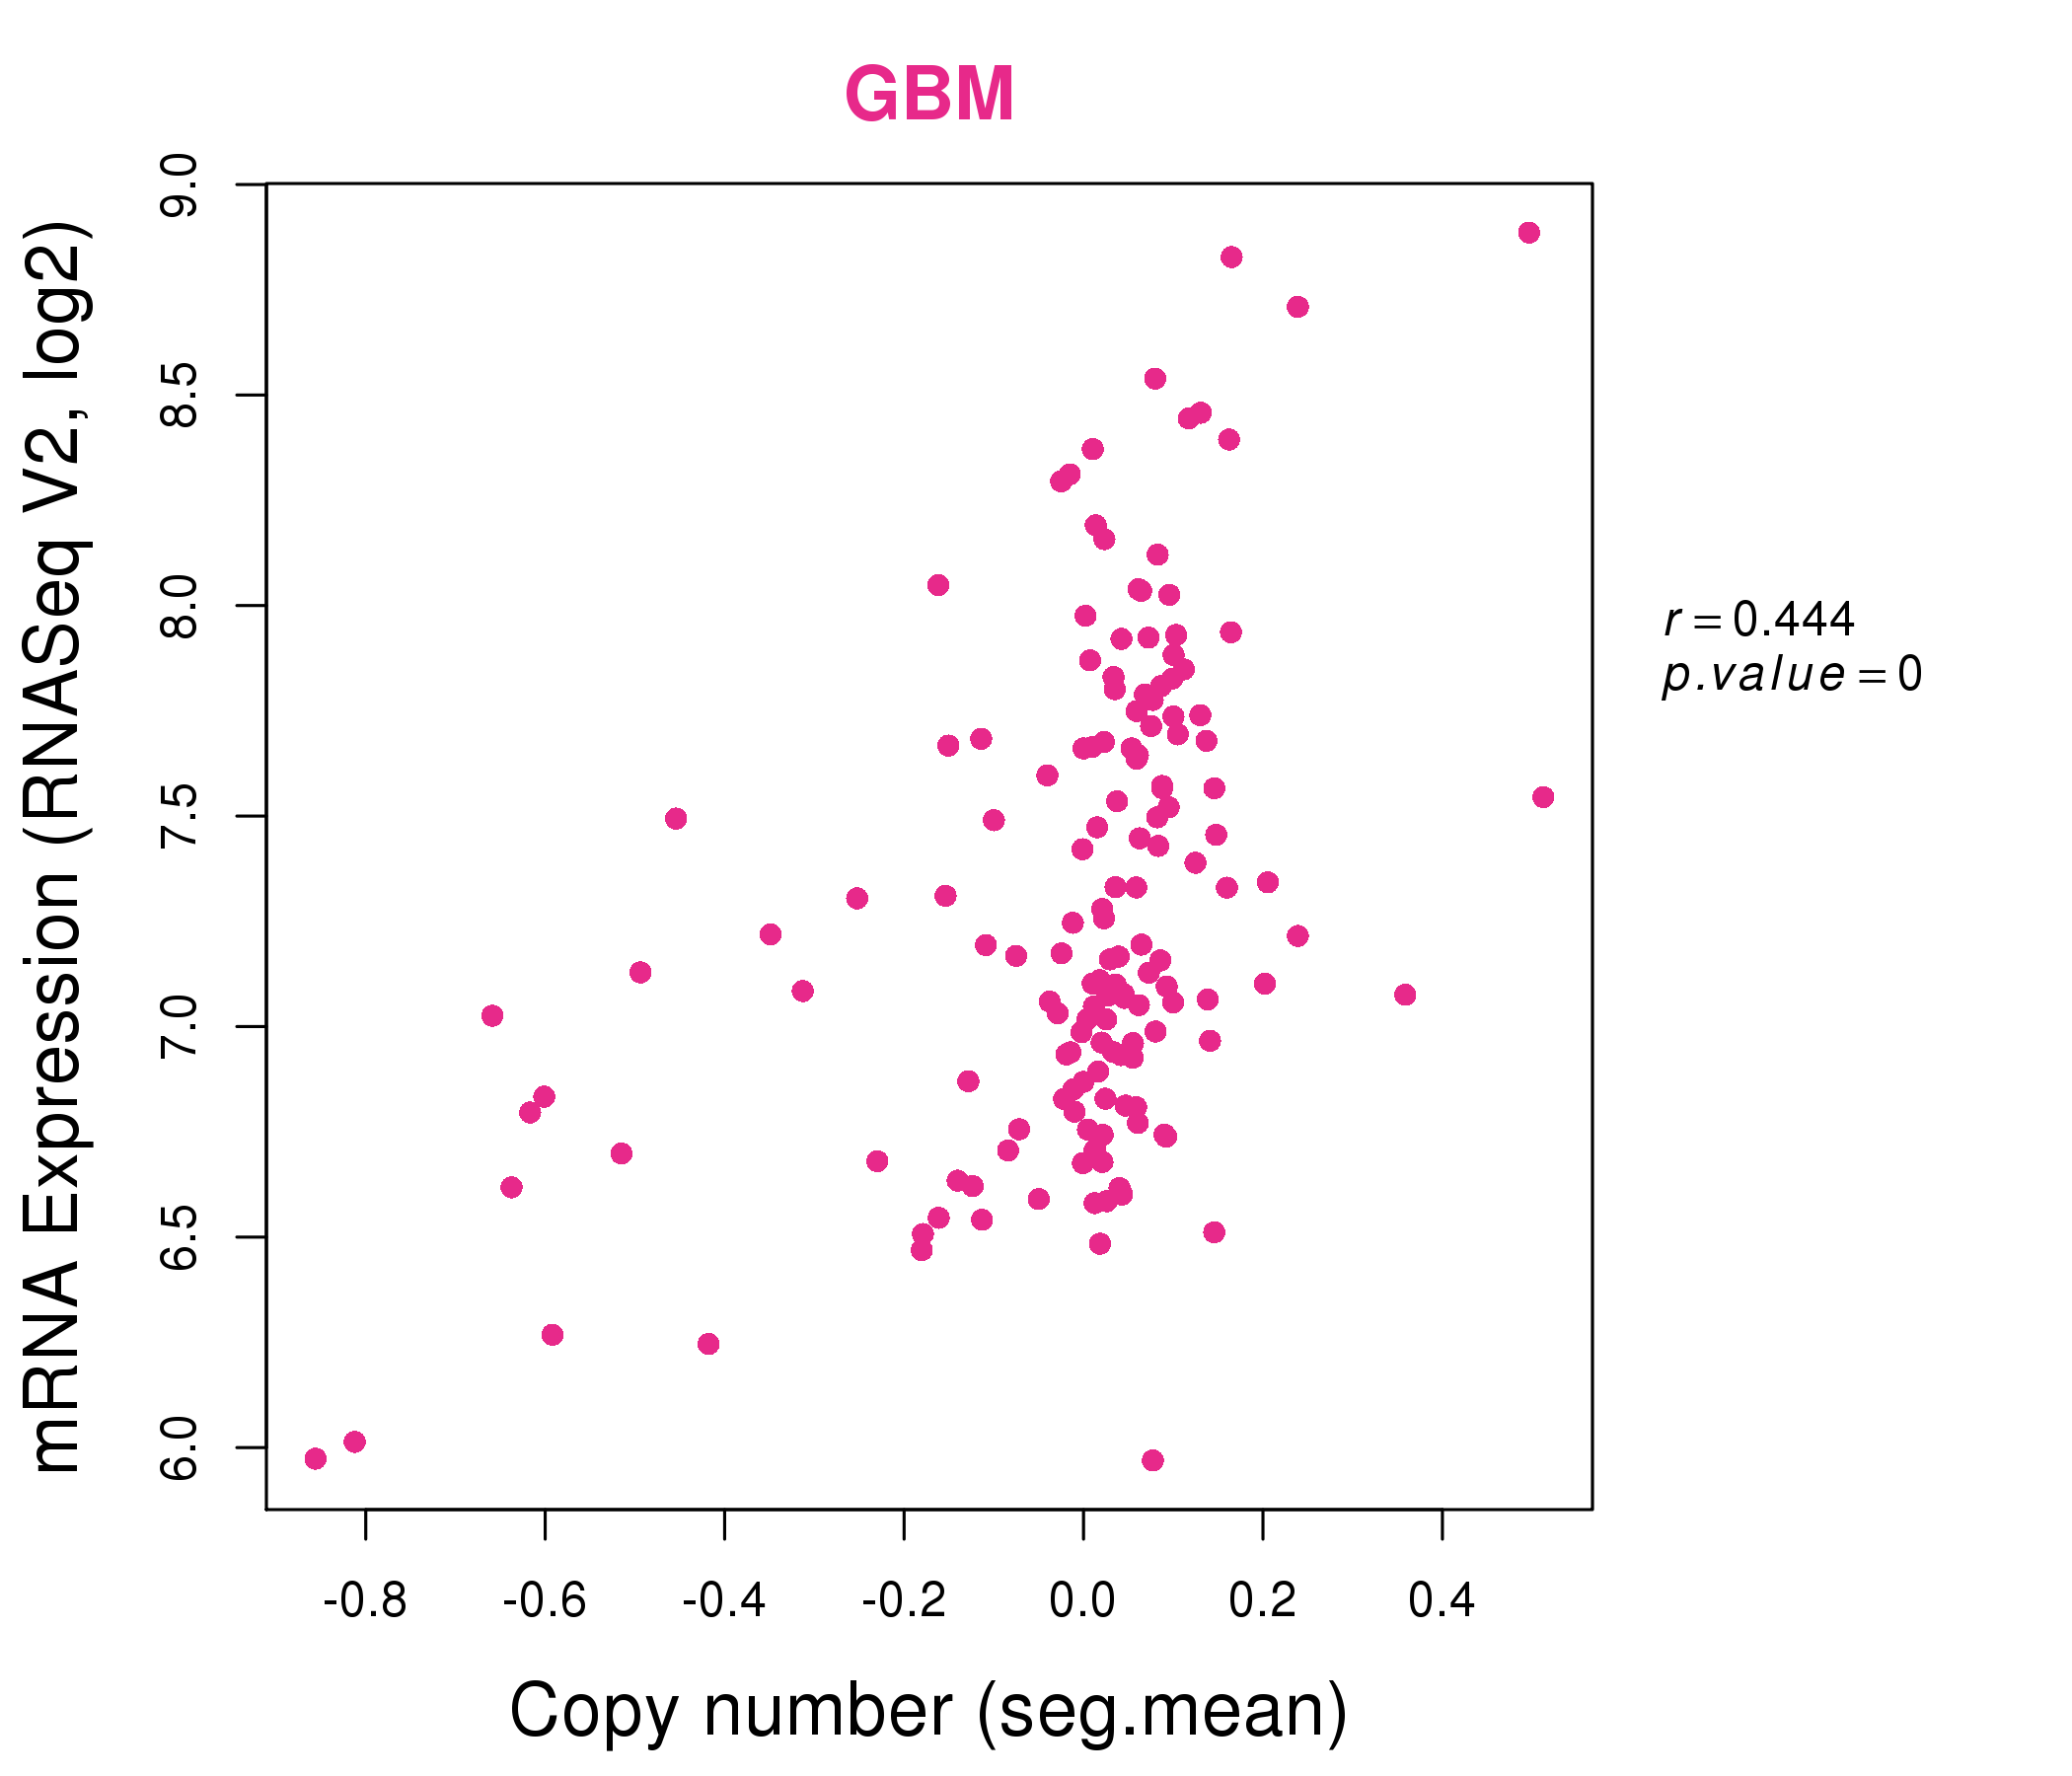
| * This plots show the correlation between CNV and gene expression. |
: Open all plots for all cancer types
 |
|
 |
|
| Top |
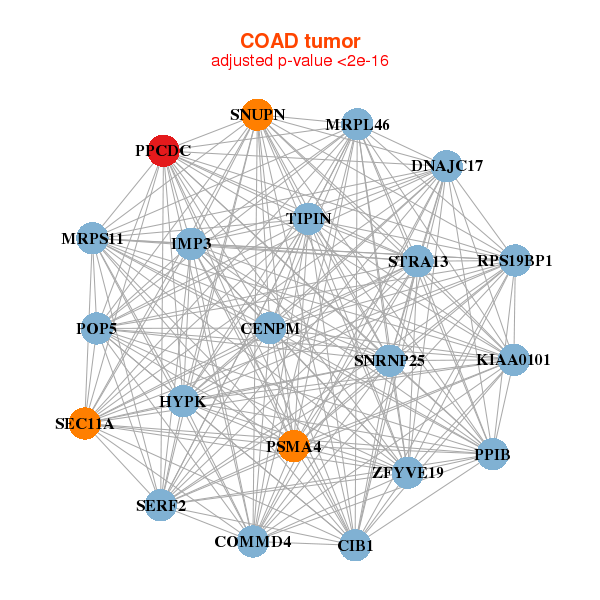
| Gene-Gene Network Information |
| * Co-Expression network figures were drawn using R package igraph. Only the top 20 genes with the highest correlations were shown. Red circle: input gene, orange circle: cell metabolism gene, sky circle: other gene |
: Open all plots for all cancer types
 |
| ||||
| AURKAIP1,C19orf70,LAMTOR4,CCDC12,COMMD4,IMP3,MRPL53, MRPL54,NDUFA13,NDUFS7,PLEKHJ1,PPCDC,RPS19BP1,SDHAF1, STOML1,THAP3,THAP7,TIMM13,TSSC4,UBL7,UQCR11 | ARFRP1,ASMTL,B4GALT7,CCDC12,CCS,CD2BP2,NELFB, DGCR14,EDF1,LOC148413,NT5C,PPCDC,NELFE,RPS19BP1, SART1,SDHAF1,SELO,SURF2,TBC1D10A,TFPT,WDR83 | ||||
 |
| ||||
| HYPK,CENPM,CIB1,COMMD4,DNAJC17,IMP3,KIAA0101, MRPL46,MRPS11,POP5,PPCDC,PPIB,PSMA4,RPS19BP1, SEC11A,SERF2,SNRNP25,SNUPN,STRA13,TIPIN,ZFYVE19 | ARPC3,ARPC4,ARPC5,COMMD5,COX6A1,CYB5R4,LOC541471, LYZ,MOB1A,MRPL14,MRPS11,PDCD6,PPCDC,PPP1CA, SDF2,SNX11,STX18,TCEB2,TMEM199,TMSB4XP8,WIBG |


| * Co-Expression network figures were drawn using R package igraph. Only the top 20 genes with the highest correlations were shown. Red circle: input gene, orange circle: cell metabolism gene, sky circle: other gene |
: Open all plots for all cancer types
| Top |
: Open all interacting genes' information including KEGG pathway for all interacting genes from DAVID
| Top |
| Pharmacological Information for PPCDC |
| DB Category | DB Name | DB's ID and Url link |
| * Gene Centered Interaction Network. |
 |
| * Drug Centered Interaction Network. |
| DrugBank ID | Target Name | Drug Groups | Generic Name | Drug Centered Network | Drug Structure |
| DB03247 | phosphopantothenoylcysteine decarboxylase | experimental | Riboflavin Monophosphate |  | 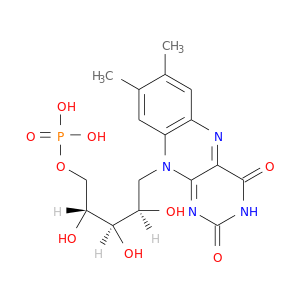 |
| DB03738 | phosphopantothenoylcysteine decarboxylase | experimental | Pantothenoylaminoethenethiol | 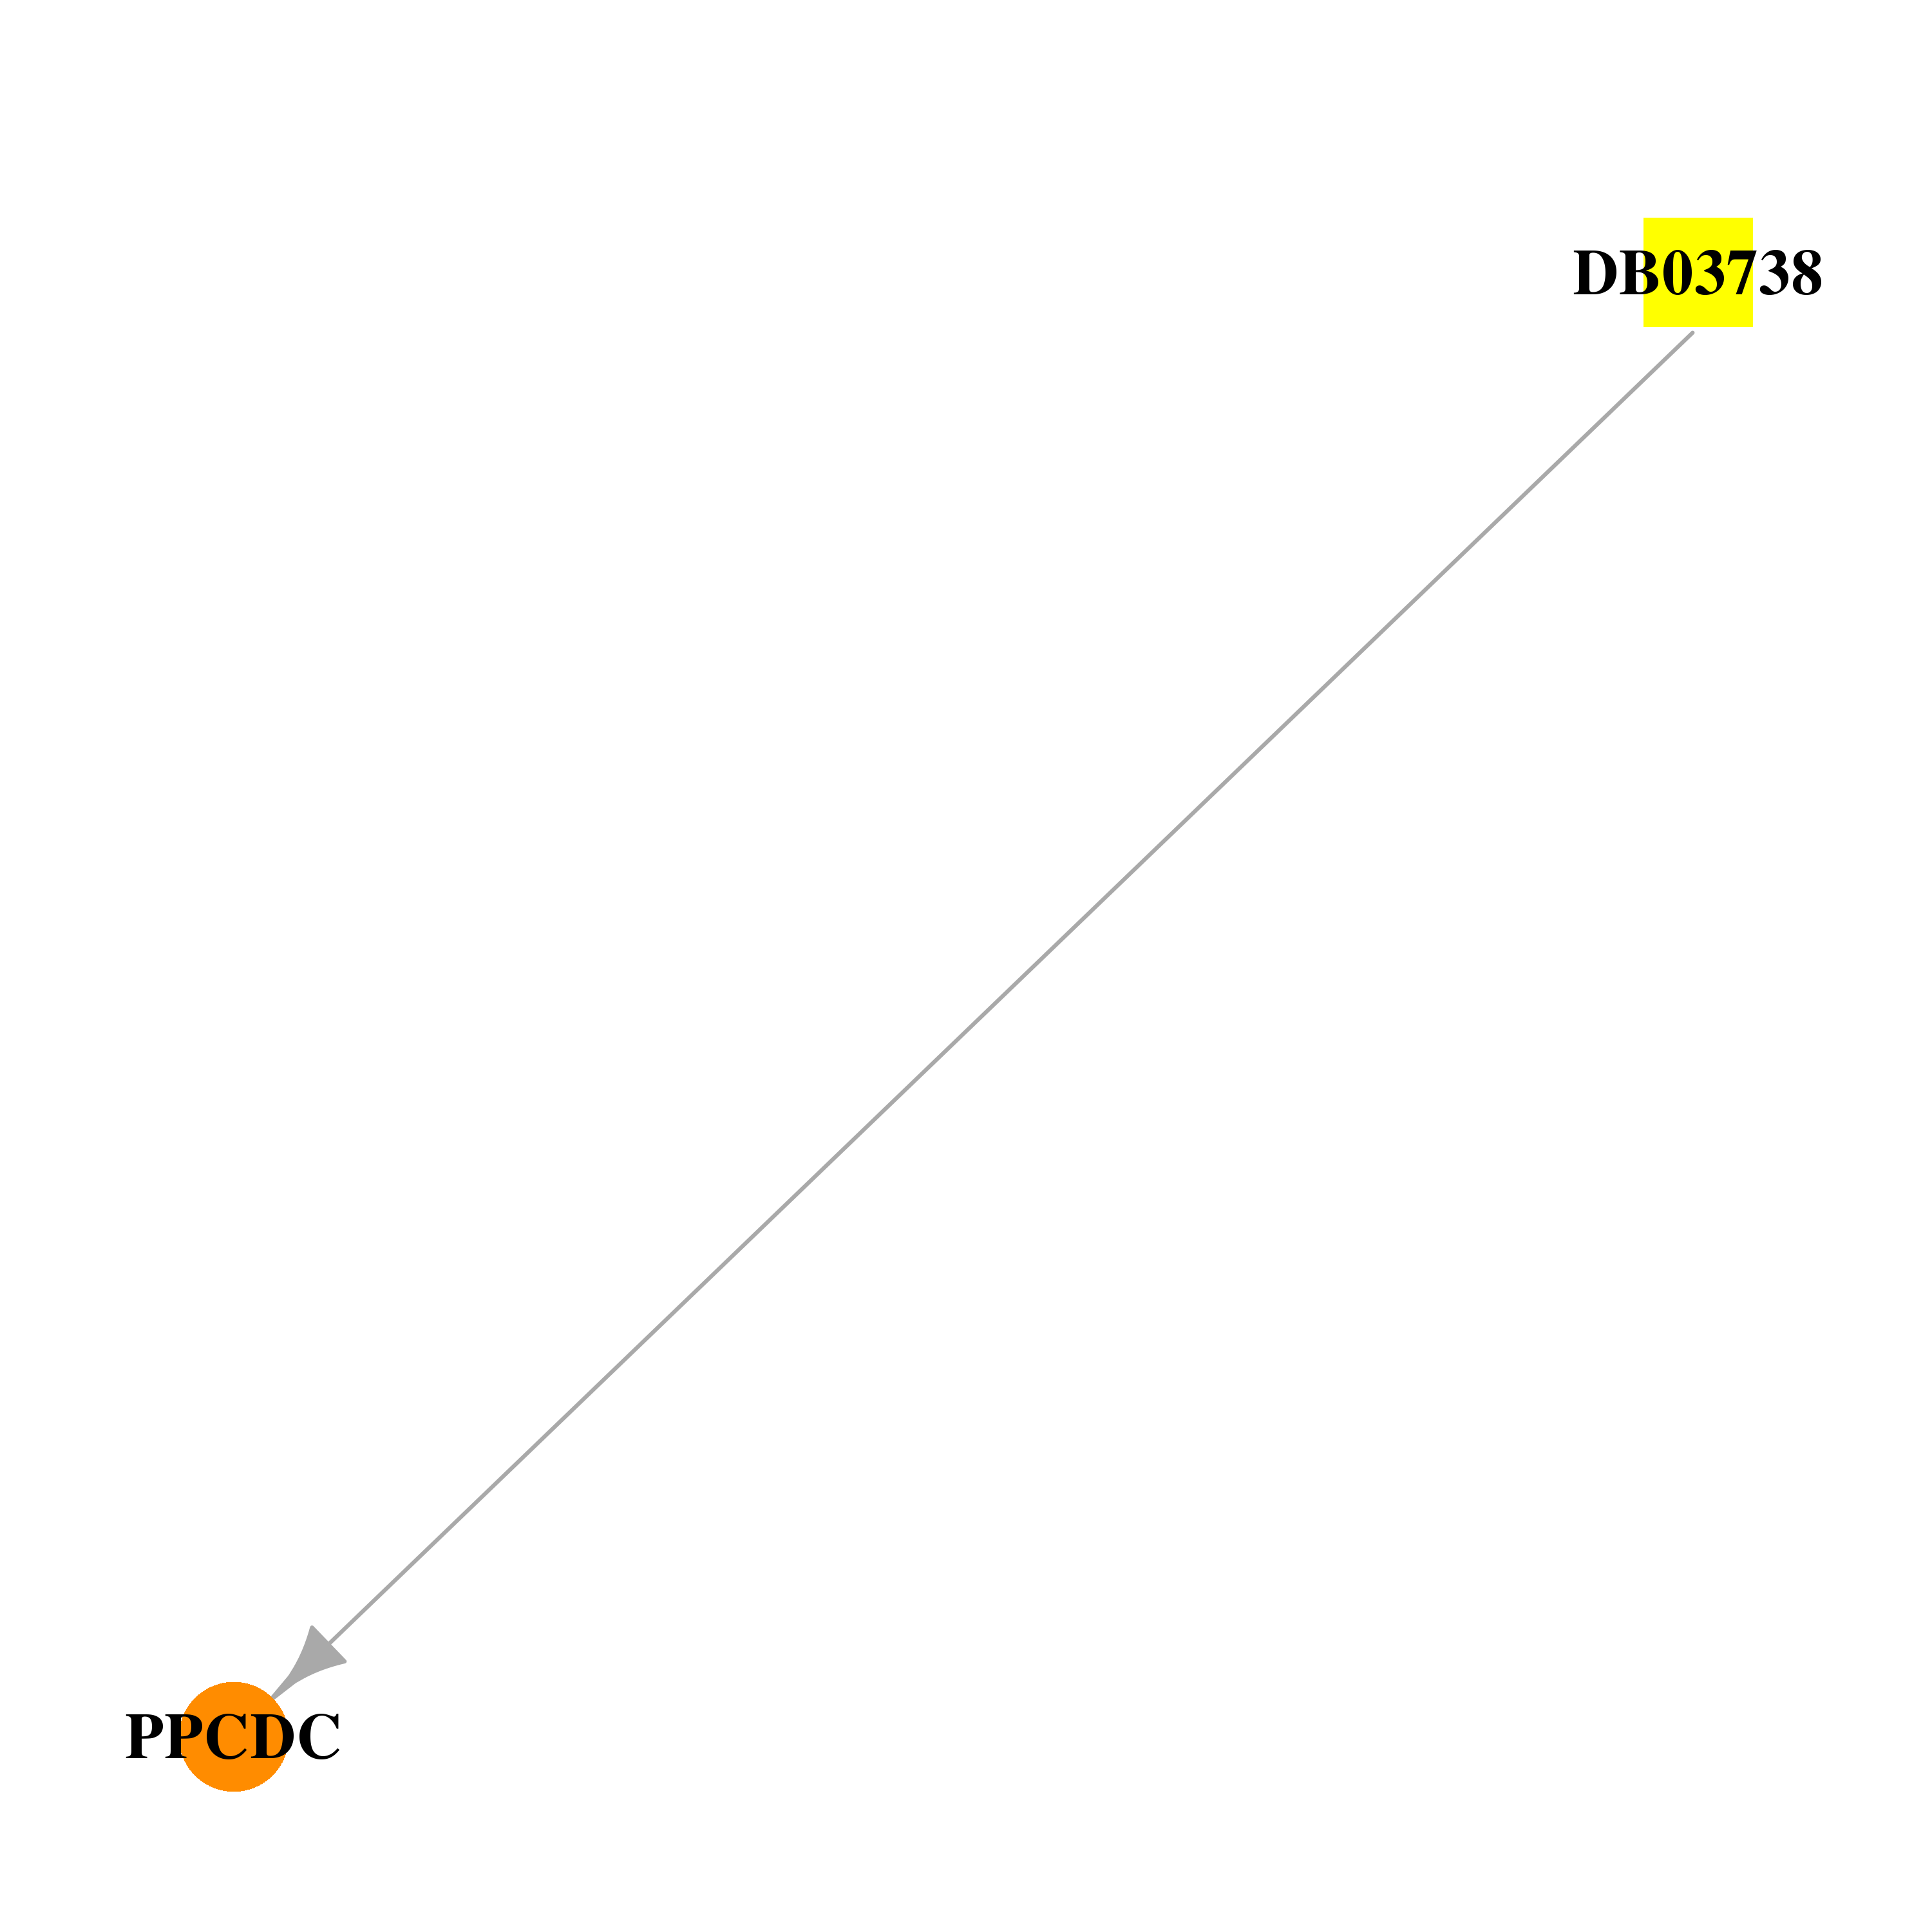 | 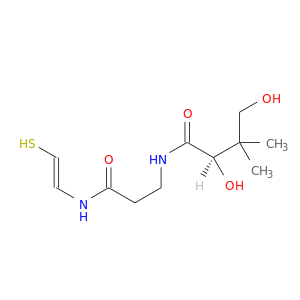 |
| DB00151 | phosphopantothenoylcysteine decarboxylase | approved; nutraceutical | L-Cysteine | 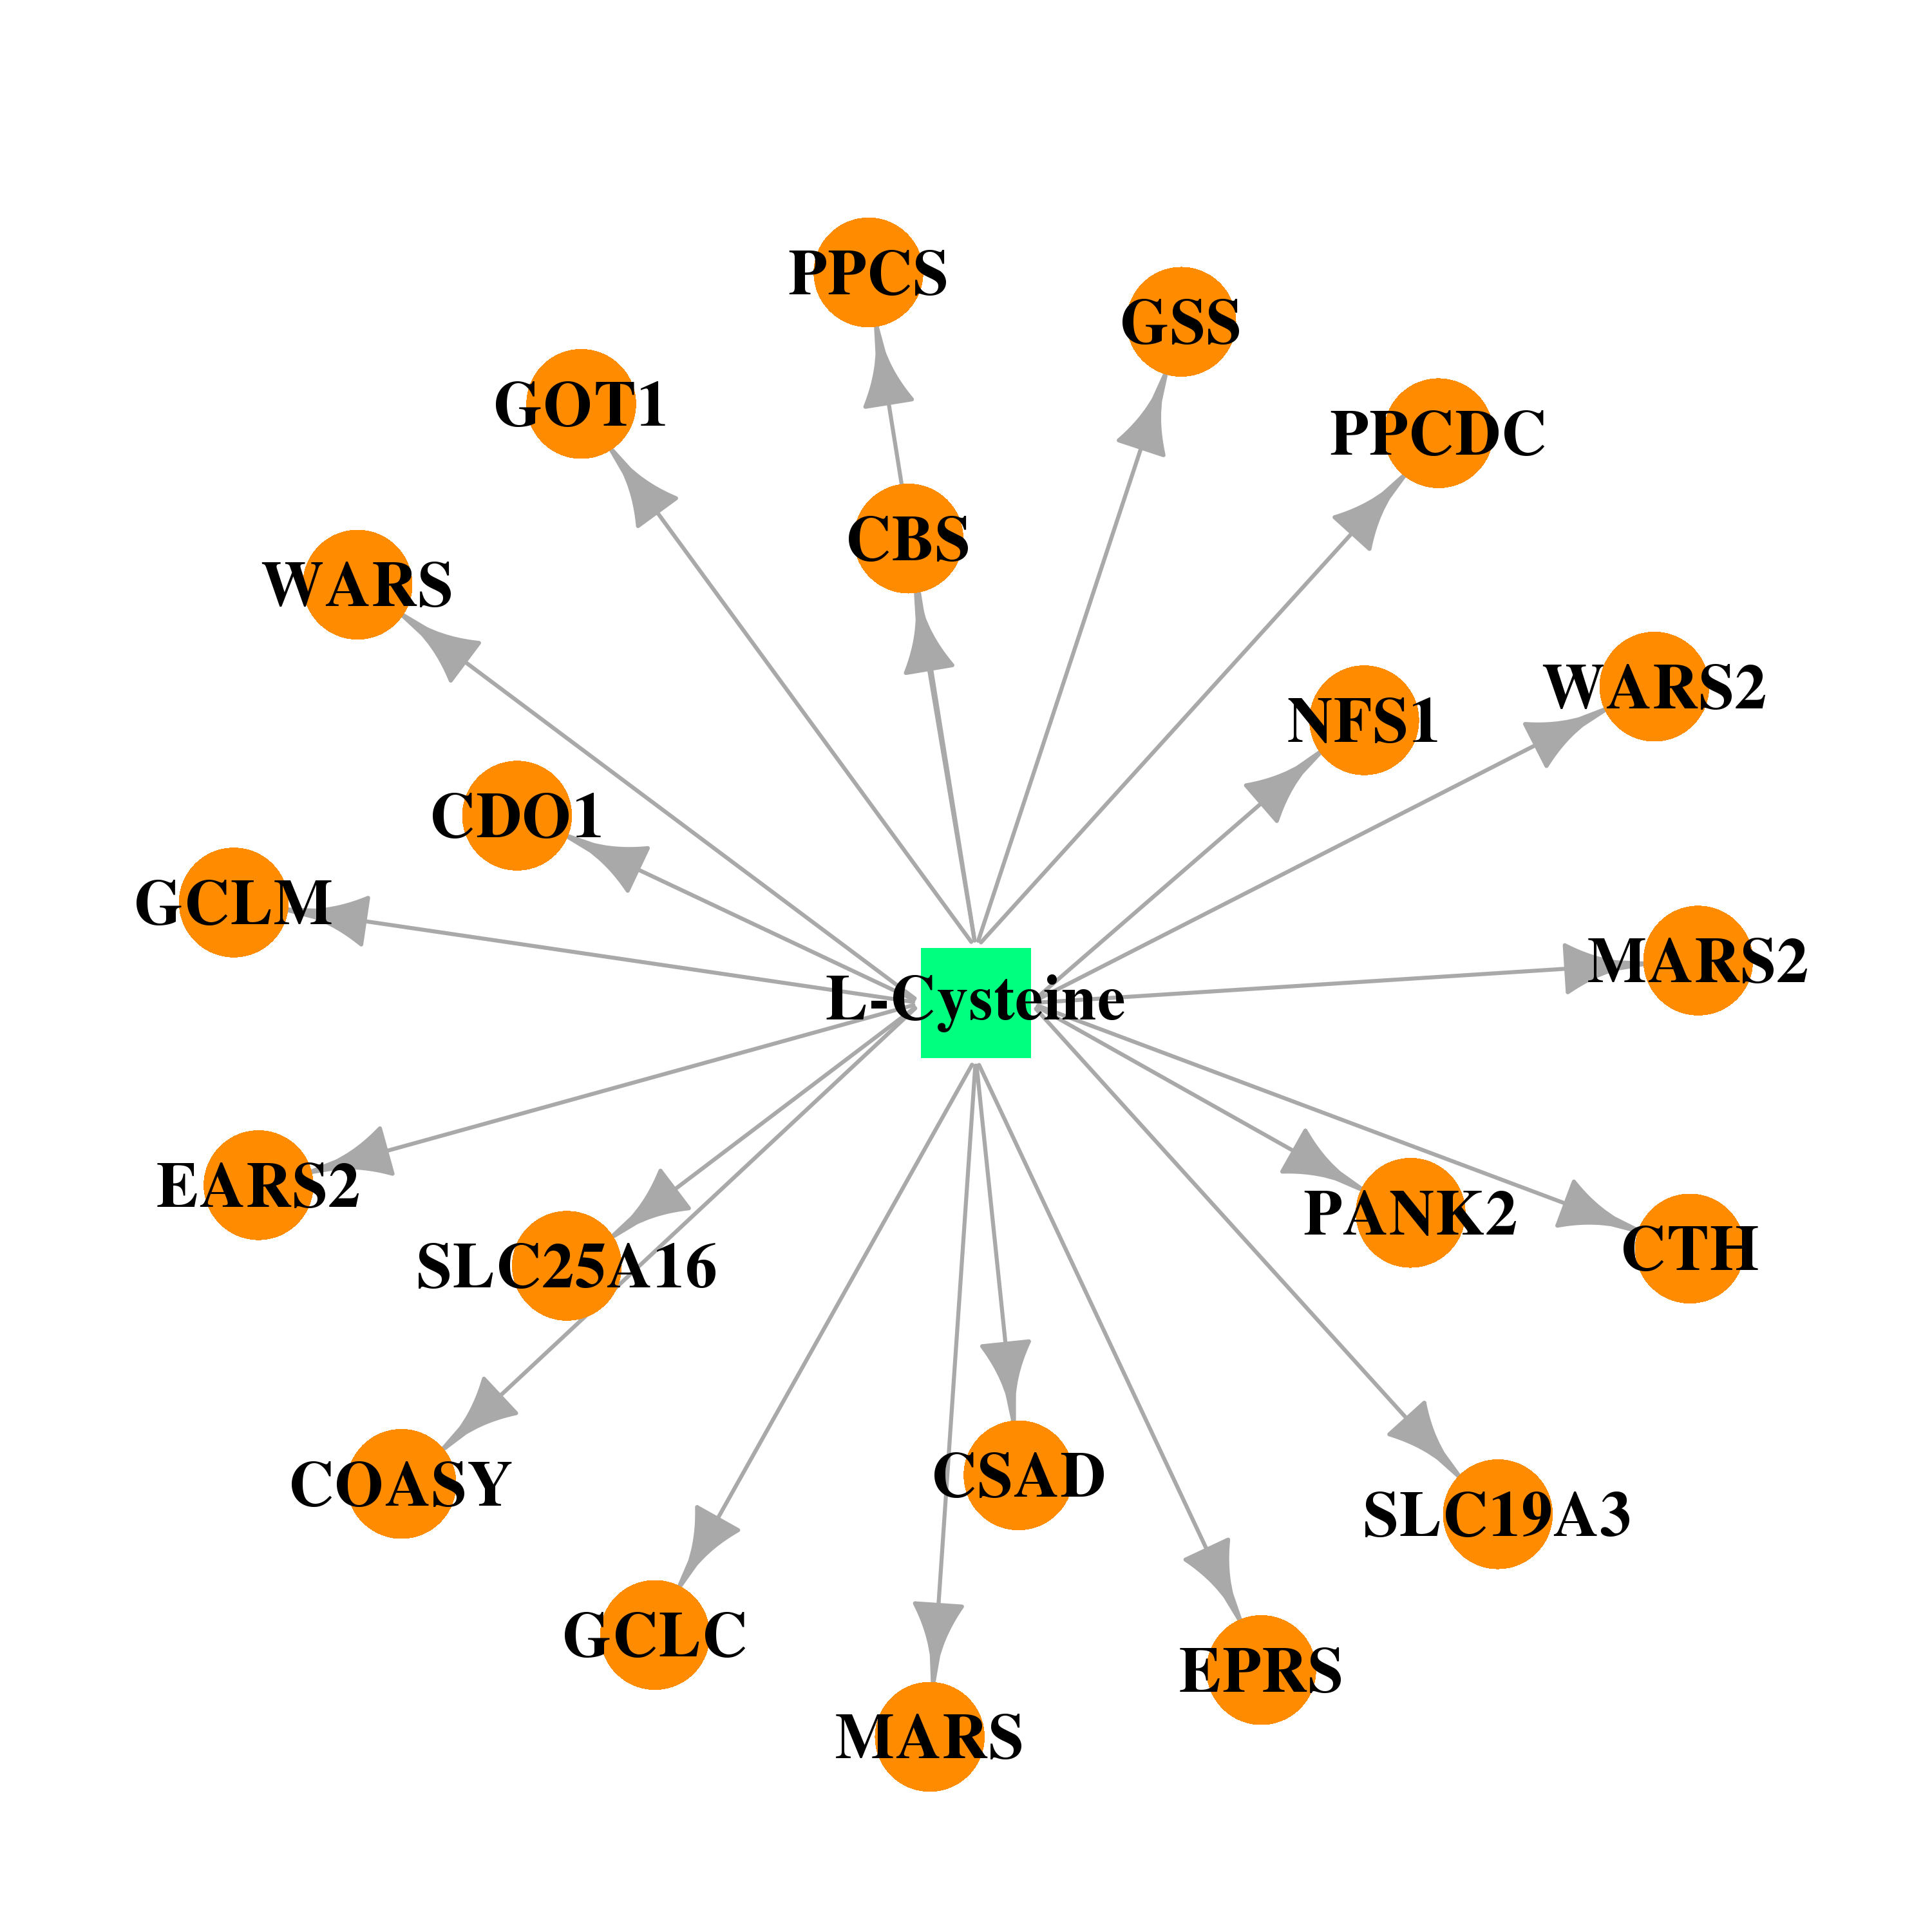 | 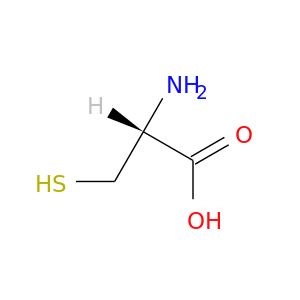 |
| Top |
| Cross referenced IDs for PPCDC |
| * We obtained these cross-references from Uniprot database. It covers 150 different DBs, 18 categories. http://www.uniprot.org/help/cross_references_section |
: Open all cross reference information
|
Copyright © 2016-Present - The Univsersity of Texas Health Science Center at Houston @ |