|
||||||||||||||||||||
| |
| Phenotypic Information (metabolism pathway, cancer, disease, phenome) |
| |
| |
| Gene-Gene Network Information: Co-Expression Network, Interacting Genes & KEGG |
| |
|


| Gene Summary for AASDHPPT |
| Basic gene info. | Gene symbol | AASDHPPT |
| Gene name | aminoadipate-semialdehyde dehydrogenase-phosphopantetheinyl transferase | |
| Synonyms | AASD-PPT|LYS2|LYS5 | |
| Cytomap | UCSC genome browser: 11q22 | |
| Genomic location | chr11 :105948291-105969419 | |
| Type of gene | protein-coding | |
| RefGenes | NM_015423.2, | |
| Ensembl id | ENSG00000149313 | |
| Description | 4'-phosphopantetheinyl transferaseL-aminoadipate-semialdehyde dehydrogenase-phosphopantetheinyl transferaseLYS5 orthologalpha-aminoadipic semialdehyde dehydrogenase-phosphopantetheinyl transferase | |
| Modification date | 20141207 | |
| dbXrefs | MIM : 607756 | |
| HGNC : HGNC | ||
| Ensembl : ENSG00000149313 | ||
| HPRD : 09675 | ||
| Vega : OTTHUMG00000166253 | ||
| Protein | UniProt: go to UniProt's Cross Reference DB Table | |
| Expression | CleanEX: HS_AASDHPPT | |
| BioGPS: 60496 | ||
| Gene Expression Atlas: ENSG00000149313 | ||
| The Human Protein Atlas: ENSG00000149313 | ||
| Pathway | NCI Pathway Interaction Database: AASDHPPT | |
| KEGG: AASDHPPT | ||
| REACTOME: AASDHPPT | ||
| ConsensusPathDB | ||
| Pathway Commons: AASDHPPT | ||
| Metabolism | MetaCyc: AASDHPPT | |
| HUMANCyc: AASDHPPT | ||
| Regulation | Ensembl's Regulation: ENSG00000149313 | |
| miRBase: chr11 :105,948,291-105,969,419 | ||
| TargetScan: NM_015423 | ||
| cisRED: ENSG00000149313 | ||
| Context | iHOP: AASDHPPT | |
| cancer metabolism search in PubMed: AASDHPPT | ||
| UCL Cancer Institute: AASDHPPT | ||
| Assigned class in ccmGDB | C | |
| Top |
| Phenotypic Information for AASDHPPT(metabolism pathway, cancer, disease, phenome) |
| Cancer | CGAP: AASDHPPT |
| Familial Cancer Database: AASDHPPT | |
| * This gene is included in those cancer gene databases. |
|
|
|
|
|
| . | ||||||||||||||
Oncogene 1 | Significant driver gene in | |||||||||||||||||||
| cf) number; DB name 1 Oncogene; http://nar.oxfordjournals.org/content/35/suppl_1/D721.long, 2 Tumor Suppressor gene; https://bioinfo.uth.edu/TSGene/, 3 Cancer Gene Census; http://www.nature.com/nrc/journal/v4/n3/abs/nrc1299.html, 4 CancerGenes; http://nar.oxfordjournals.org/content/35/suppl_1/D721.long, 5 Network of Cancer Gene; http://ncg.kcl.ac.uk/index.php, 1Therapeutic Vulnerabilities in Cancer; http://cbio.mskcc.org/cancergenomics/statius/ |
| REACTOME_METABOLISM_OF_VITAMINS_AND_COFACTORS | |
| Mutations for AASDHPPT |
| * Under tables are showing count per each tissue to give us broad intuition about tissue specific mutation patterns.You can go to the detailed page for each mutation database's web site. |
| There's no structural variation information in COSMIC data for this gene. |
| * From mRNA Sanger sequences, Chitars2.0 arranged chimeric transcripts. This table shows AASDHPPT related fusion information. |
| ID | Head Gene | Tail Gene | Accession | Gene_a | qStart_a | qEnd_a | Chromosome_a | tStart_a | tEnd_a | Gene_a | qStart_a | qEnd_a | Chromosome_a | tStart_a | tEnd_a |
| DA211258 | CLDN11 | 3 | 409 | 3 | 170232416 | 170232821 | AASDHPPT | 406 | 566 | 11 | 105955609 | 105955769 | |
| Top |
| There's no copy number variation information in COSMIC data for this gene. |
| Top |
|
 |
| Top |
| Stat. for Non-Synonymous SNVs (# total SNVs=33) | (# total SNVs=13) |
 |  |
(# total SNVs=0) | (# total SNVs=0) |
| Top |
| * When you move the cursor on each content, you can see more deailed mutation information on the Tooltip. Those are primary_site,primary_histology,mutation(aa),pubmedID. |
| GRCh37 position | Mutation(aa) | Unique sampleID count |
| chr11:105950307-105950307 | p.S99S | 4 |
| chr11:105967614-105967614 | p.R304* | 4 |
| chr11:105948530-105948530 | p.A31A | 3 |
| chr11:105948464-105948464 | p.C9* | 2 |
| chr11:105967543-105967543 | p.S280F | 2 |
| chr11:105961323-105961323 | p.R150I | 2 |
| chr11:105961333-105961333 | p.T153T | 1 |
| chr11:105962133-105962133 | p.D208H | 1 |
| chr11:105950229-105950229 | p.E73D | 1 |
| chr11:105961344-105961344 | p.W157L | 1 |
| Top |
|
 |
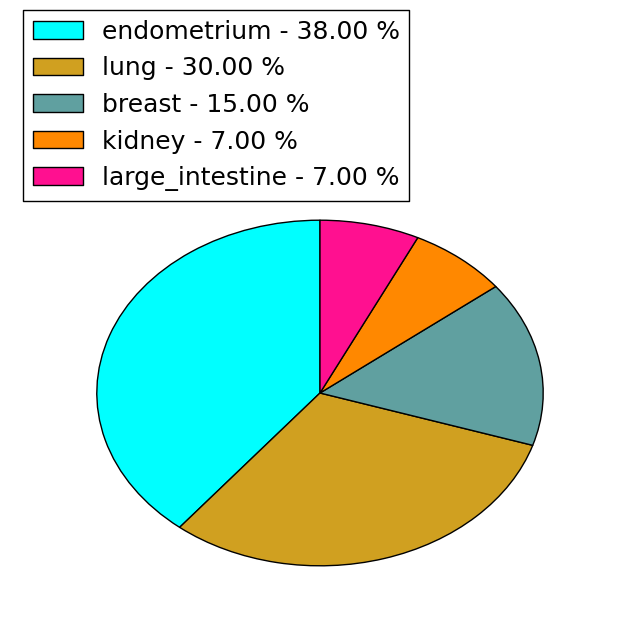
| Point Mutation/ Tissue ID | 1 | 2 | 3 | 4 | 5 | 6 | 7 | 8 | 9 | 10 | 11 | 12 | 13 | 14 | 15 | 16 | 17 | 18 | 19 | 20 |
| # sample | 3 | 4 | 2 | 3 | 5 | 2 | 1 | 3 | 1 | 11 | ||||||||||
| # mutation | 3 | 4 | 2 | 3 | 5 | 2 | 1 | 3 | 1 | 9 | ||||||||||
| nonsynonymous SNV | 3 | 3 | 2 | 2 | 2 | 1 | 3 | 7 | ||||||||||||
| synonymous SNV | 1 | 1 | 3 | 2 | 1 | 2 |
| cf) Tissue ID; Tissue type (1; BLCA[Bladder Urothelial Carcinoma], 2; BRCA[Breast invasive carcinoma], 3; CESC[Cervical squamous cell carcinoma and endocervical adenocarcinoma], 4; COAD[Colon adenocarcinoma], 5; GBM[Glioblastoma multiforme], 6; Glioma Low Grade, 7; HNSC[Head and Neck squamous cell carcinoma], 8; KICH[Kidney Chromophobe], 9; KIRC[Kidney renal clear cell carcinoma], 10; KIRP[Kidney renal papillary cell carcinoma], 11; LAML[Acute Myeloid Leukemia], 12; LUAD[Lung adenocarcinoma], 13; LUSC[Lung squamous cell carcinoma], 14; OV[Ovarian serous cystadenocarcinoma ], 15; PAAD[Pancreatic adenocarcinoma], 16; PRAD[Prostate adenocarcinoma], 17; SKCM[Skin Cutaneous Melanoma], 18:STAD[Stomach adenocarcinoma], 19:THCA[Thyroid carcinoma], 20:UCEC[Uterine Corpus Endometrial Carcinoma]) |
| Top |
| * We represented just top 10 SNVs. When you move the cursor on each content, you can see more deailed mutation information on the Tooltip. Those are primary_site, primary_histology, mutation(aa), pubmedID. |
| Genomic Position | Mutation(aa) | Unique sampleID count |
| chr11:105950307 | p.S99S | 5 |
| chr11:105961323 | p.S280F | 2 |
| chr11:105967543 | p.R150I | 2 |
| chr11:105962100 | p.V11L | 1 |
| chr11:105967590 | p.G190E | 1 |
| chr11:105962101 | p.P12P | 1 |
| chr11:105967615 | p.R197R | 1 |
| chr11:105950319 | p.A31A | 1 |
| chr11:105962108 | p.R197P | 1 |
| chr11:105950416 | p.R38L | 1 |
| * Copy number data were extracted from TCGA using R package TCGA-Assembler. The URLs of all public data files on TCGA DCC data server were gathered on Jan-05-2015. Function ProcessCNAData in TCGA-Assembler package was used to obtain gene-level copy number value which is calculated as the average copy number of the genomic region of a gene. |
 |
| cf) Tissue ID[Tissue type]: BLCA[Bladder Urothelial Carcinoma], BRCA[Breast invasive carcinoma], CESC[Cervical squamous cell carcinoma and endocervical adenocarcinoma], COAD[Colon adenocarcinoma], GBM[Glioblastoma multiforme], Glioma Low Grade, HNSC[Head and Neck squamous cell carcinoma], KICH[Kidney Chromophobe], KIRC[Kidney renal clear cell carcinoma], KIRP[Kidney renal papillary cell carcinoma], LAML[Acute Myeloid Leukemia], LUAD[Lung adenocarcinoma], LUSC[Lung squamous cell carcinoma], OV[Ovarian serous cystadenocarcinoma ], PAAD[Pancreatic adenocarcinoma], PRAD[Prostate adenocarcinoma], SKCM[Skin Cutaneous Melanoma], STAD[Stomach adenocarcinoma], THCA[Thyroid carcinoma], UCEC[Uterine Corpus Endometrial Carcinoma] |
| Top |
| Gene Expression for AASDHPPT |
| * CCLE gene expression data were extracted from CCLE_Expression_Entrez_2012-10-18.res: Gene-centric RMA-normalized mRNA expression data. |
 |
| * Normalized gene expression data of RNASeqV2 was extracted from TCGA using R package TCGA-Assembler. The URLs of all public data files on TCGA DCC data server were gathered at Jan-05-2015. Only eight cancer types have enough normal control samples for differential expression analysis. (t test, adjusted p<0.05 (using Benjamini-Hochberg FDR)) |
 |
| Top |
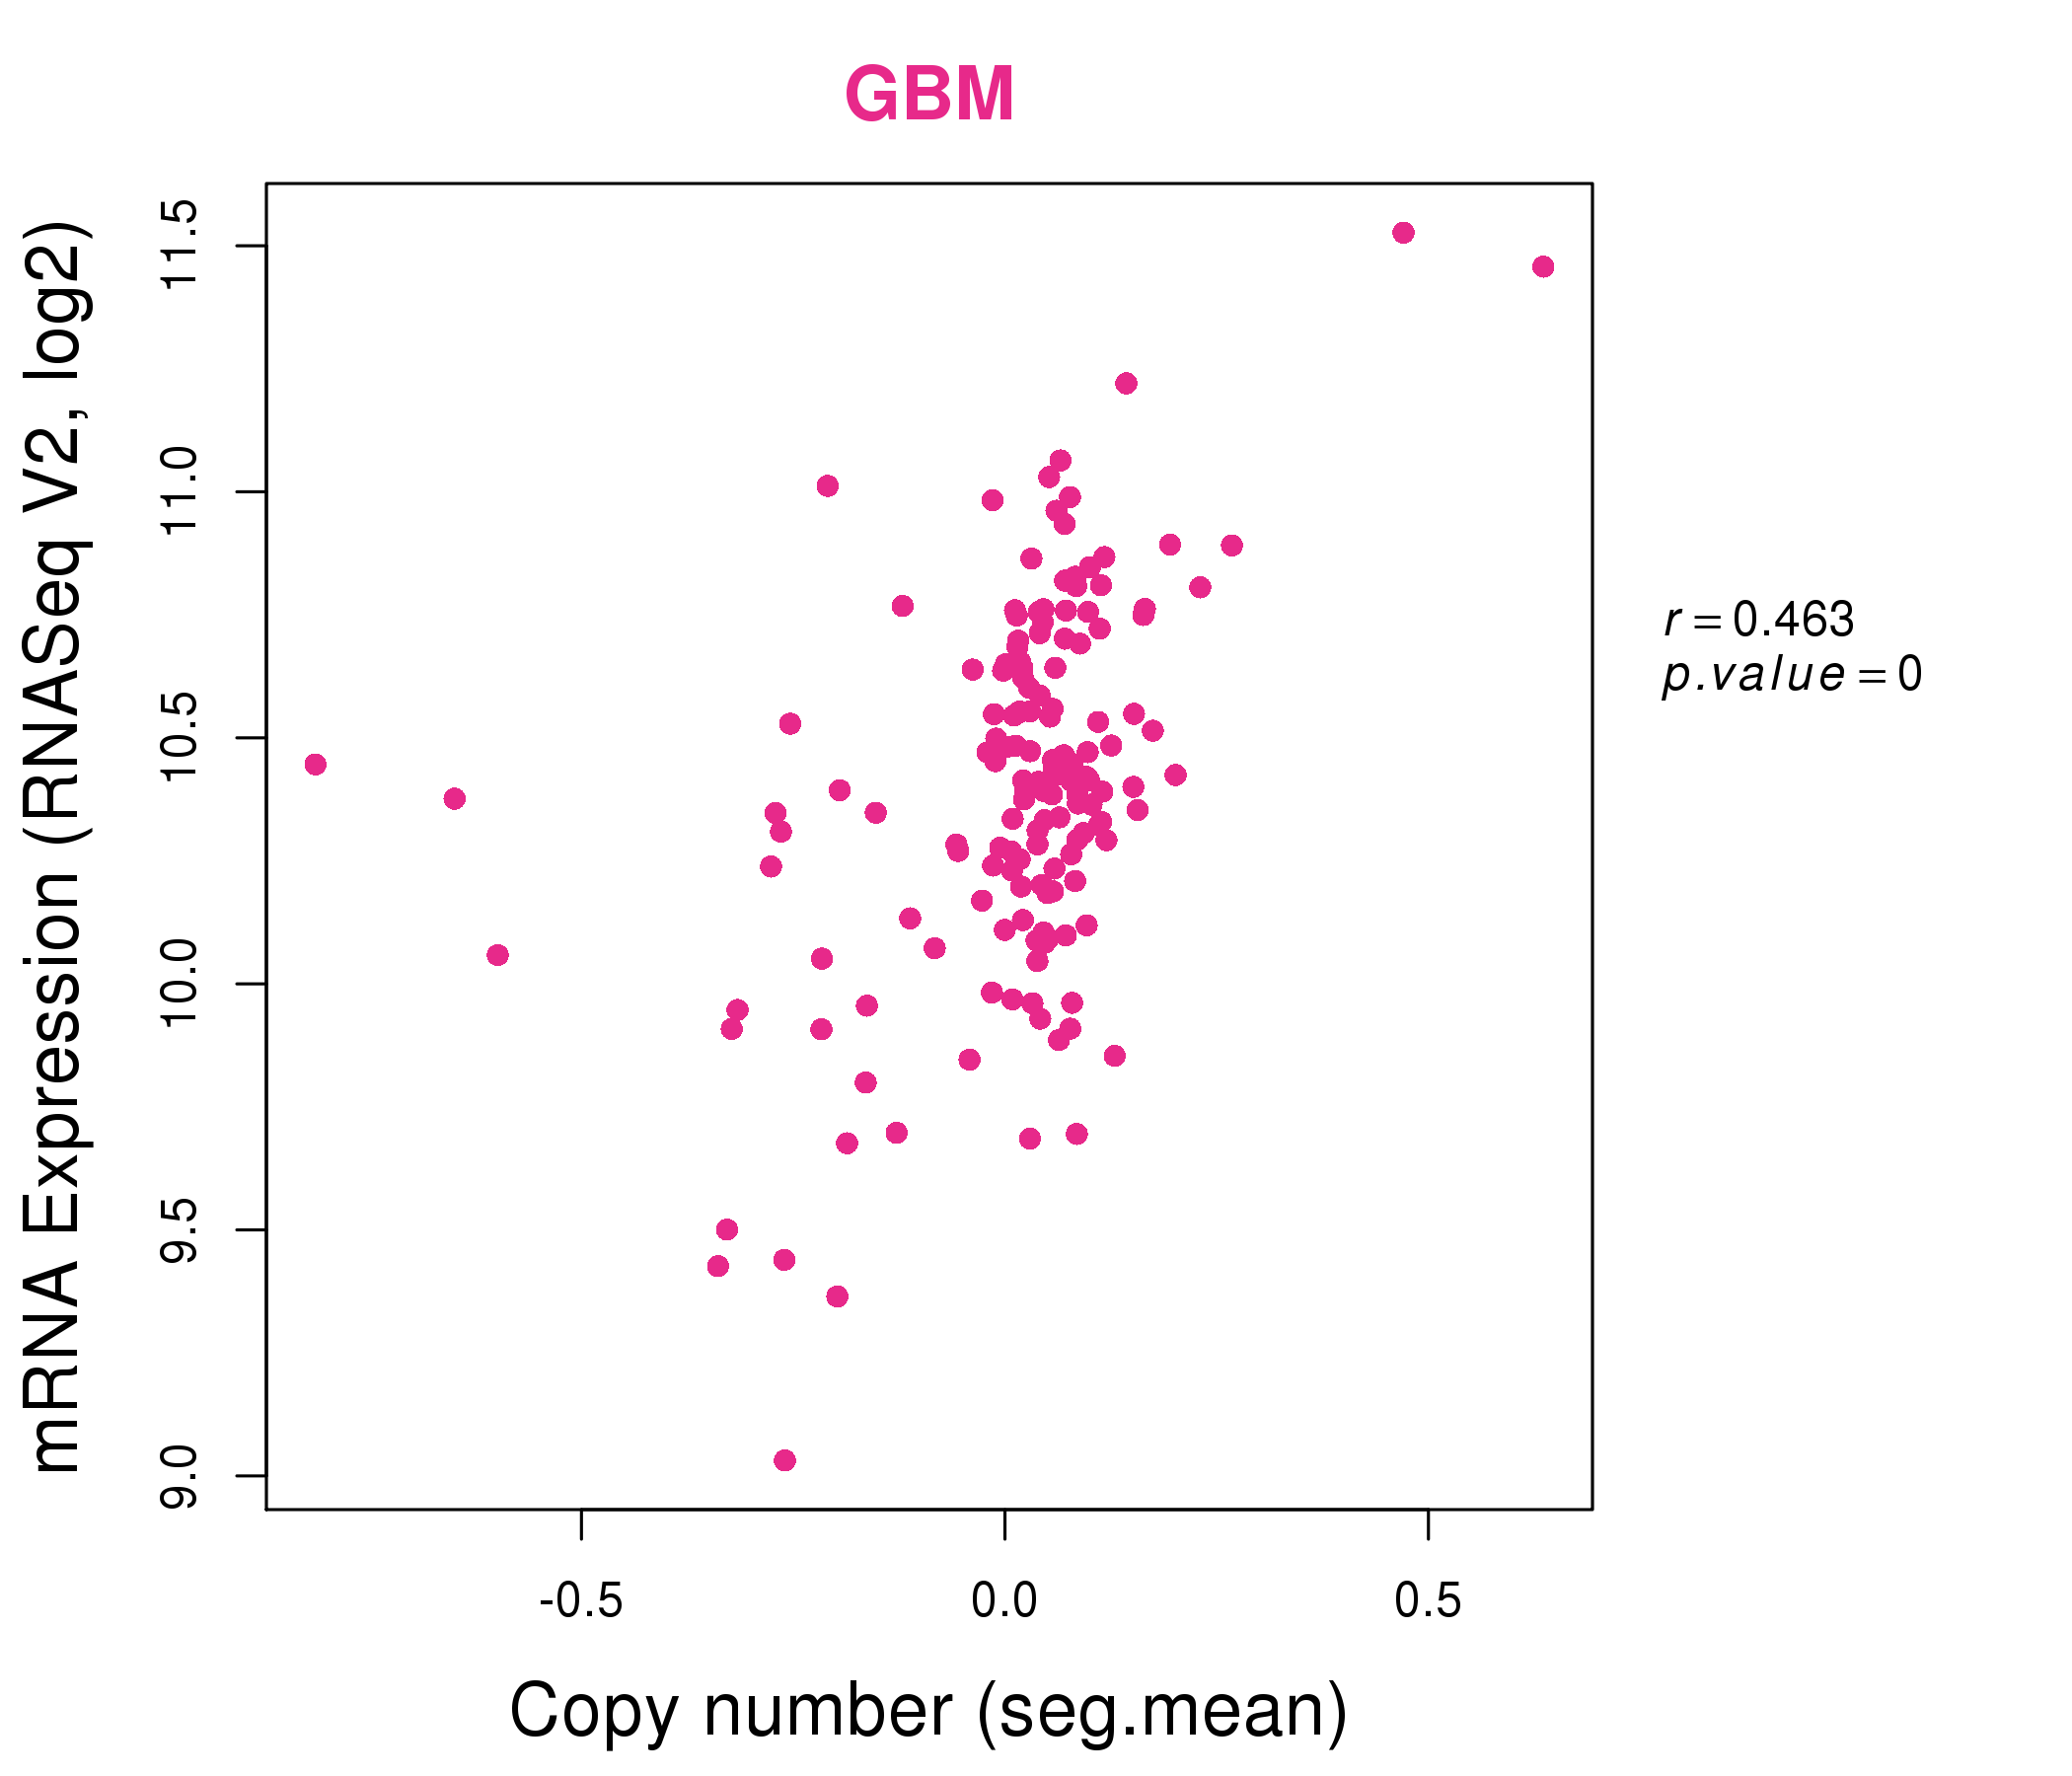
| * This plots show the correlation between CNV and gene expression. |
: Open all plots for all cancer types
 |
|
 |
|

| Top |
| Gene-Gene Network Information |
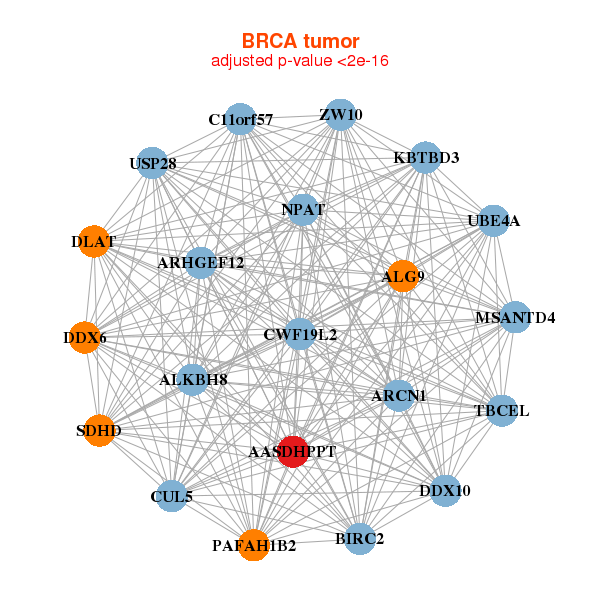
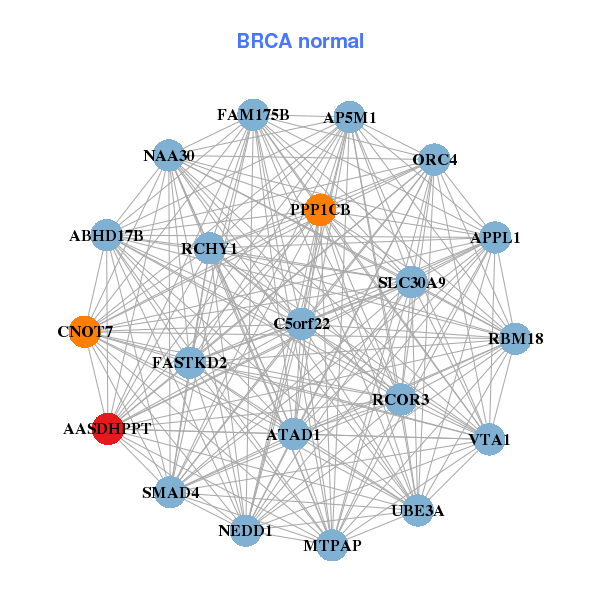
| * Co-Expression network figures were drawn using R package igraph. Only the top 20 genes with the highest correlations were shown. Red circle: input gene, orange circle: cell metabolism gene, sky circle: other gene |
: Open all plots for all cancer types
 |
|
| AASDHPPT,ALG9,ALKBH8,ARCN1,ARHGEF12,BIRC2,C11orf57, CUL5,CWF19L2,DDX10,DDX6,DLAT,KBTBD3,MSANTD4, NPAT,PAFAH1B2,SDHD,TBCEL,UBE4A,USP28,ZW10 | AASDHPPT,APPL1,ATAD1,C5orf22,CNOT7,ABHD17B,FAM175B, FASTKD2,MTPAP,AP5M1,NAA30,NEDD1,ORC4,PPP1CB, RBM18,RCHY1,RCOR3,SLC30A9,SMAD4,UBE3A,VTA1 |
 |
|
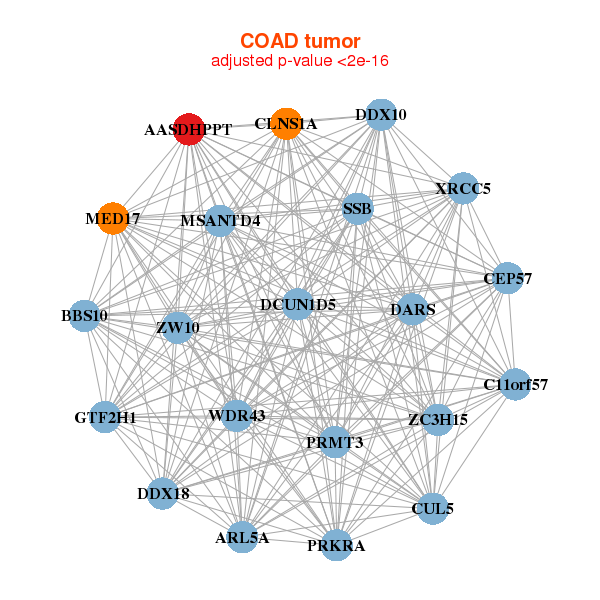
| AASDHPPT,ARL5A,BBS10,C11orf57,CEP57,CLNS1A,CUL5, DARS,DCUN1D5,DDX10,DDX18,GTF2H1,MSANTD4,MED17, PRKRA,PRMT3,SSB,WDR43,XRCC5,ZC3H15,ZW10 | AASDHPPT,AGK,ARRDC3,BMI1,CGGBP1,DARS,DBT, POLR2M___GCOM1,KIAA1586,LZTFL1,MATR3,MBLAC2,MDFIC,NAP1L1, PIGK,PTCD2,RANBP6,SMARCE1,STYX,TMEM123,ZNF22 |
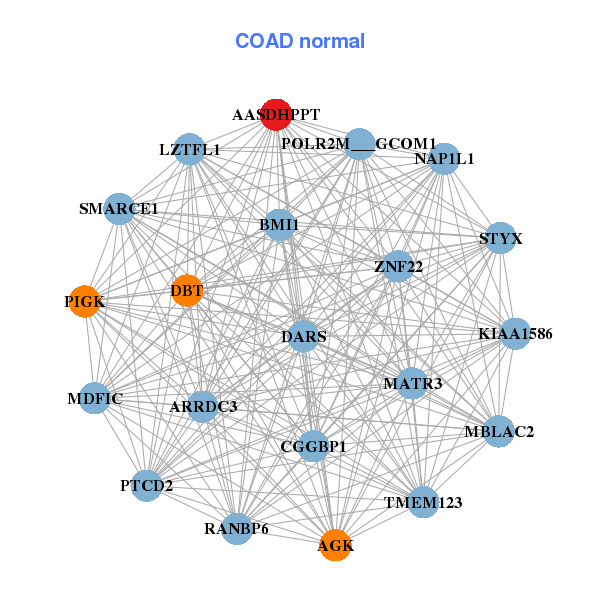
| * Co-Expression network figures were drawn using R package igraph. Only the top 20 genes with the highest correlations were shown. Red circle: input gene, orange circle: cell metabolism gene, sky circle: other gene |
: Open all plots for all cancer types
| Top |
: Open all interacting genes' information including KEGG pathway for all interacting genes from DAVID
| Top |
| Pharmacological Information for AASDHPPT |
| There's no related Drug. |
| Top |
| Cross referenced IDs for AASDHPPT |
| * We obtained these cross-references from Uniprot database. It covers 150 different DBs, 18 categories. http://www.uniprot.org/help/cross_references_section |
: Open all cross reference information
|
Copyright © 2016-Present - The Univsersity of Texas Health Science Center at Houston @ |