|
||||||||||||||||||||
| |
| Phenotypic Information (metabolism pathway, cancer, disease, phenome) |
| |
| |
| Gene-Gene Network Information: Co-Expression Network, Interacting Genes & KEGG |
| |
|


| Gene Summary for RPL3 |
| Top |
| Phenotypic Information for RPL3(metabolism pathway, cancer, disease, phenome) |
| Cancer | CGAP: RPL3 |
| Familial Cancer Database: RPL3 | |
| * This gene is included in those cancer gene databases. |
|
|
|
|
|
| . | ||||||||||||||
Oncogene 1 | Significant driver gene in | |||||||||||||||||||
| cf) number; DB name 1 Oncogene; http://nar.oxfordjournals.org/content/35/suppl_1/D721.long, 2 Tumor Suppressor gene; https://bioinfo.uth.edu/TSGene/, 3 Cancer Gene Census; http://www.nature.com/nrc/journal/v4/n3/abs/nrc1299.html, 4 CancerGenes; http://nar.oxfordjournals.org/content/35/suppl_1/D721.long, 5 Network of Cancer Gene; http://ncg.kcl.ac.uk/index.php, 1Therapeutic Vulnerabilities in Cancer; http://cbio.mskcc.org/cancergenomics/statius/ |
| REACTOME_METABOLISM_OF_PROTEINS REACTOME_METABOLISM_OF_MRNA REACTOME_METABOLISM_OF_RNA | |
| OMIM | |
| Orphanet | |
| Disease | KEGG Disease: RPL3 |
| MedGen: RPL3 (Human Medical Genetics with Condition) | |
| ClinVar: RPL3 | |
| Phenotype | MGI: RPL3 (International Mouse Phenotyping Consortium) |
| PhenomicDB: RPL3 | |
| Mutations for RPL3 |
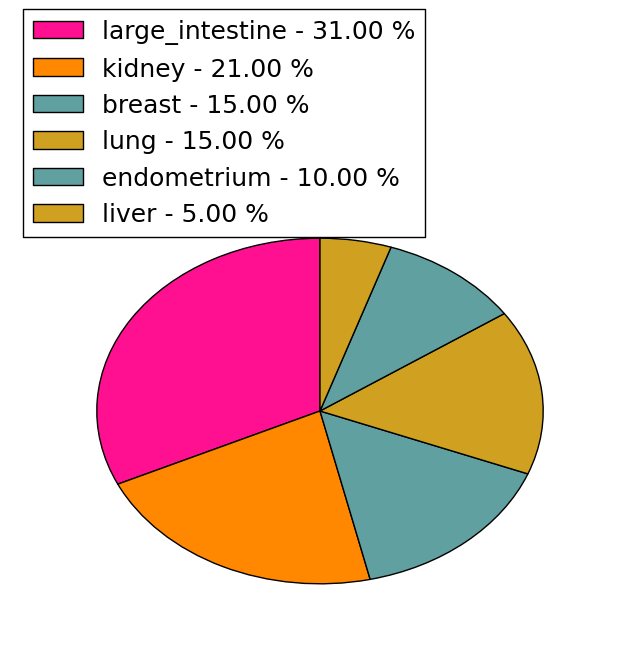
| * Under tables are showing count per each tissue to give us broad intuition about tissue specific mutation patterns.You can go to the detailed page for each mutation database's web site. |
| - Statistics for Tissue and Mutation type | Top |
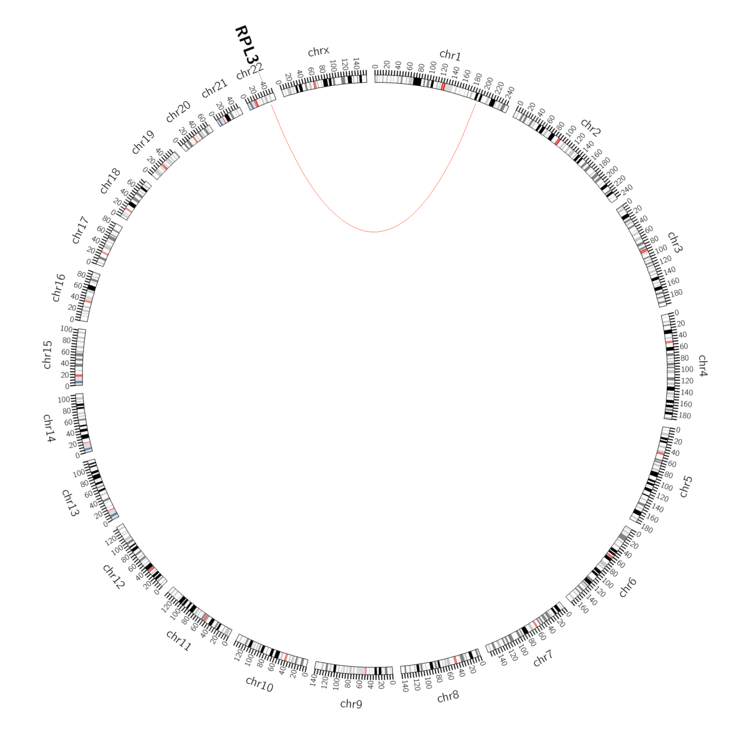 |
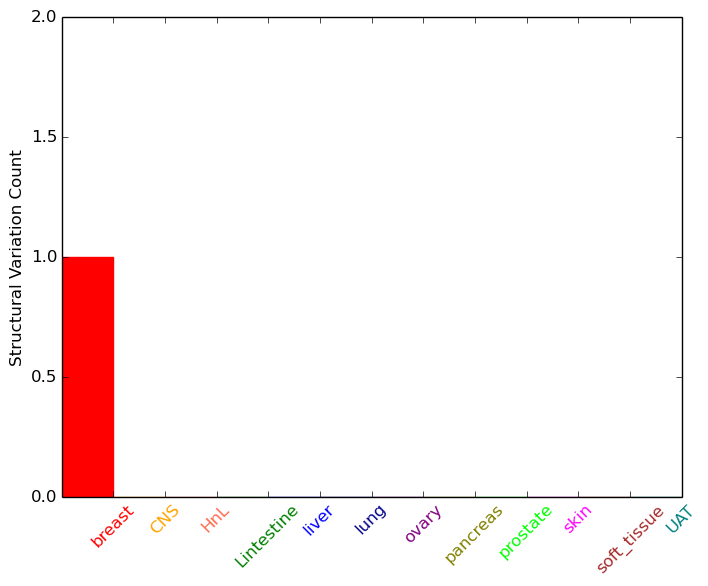
| - For Inter-chromosomal Variations |
| * Inter-chromosomal variantions includes 'interchromosomal amplicon to amplicon', 'interchromosomal amplicon to non-amplified dna', 'interchromosomal insertion', 'Interchromosomal unknown type'. |
 |
| - For Intra-chromosomal Variations |
| There's no intra-chromosomal structural variation. |
| Sample | Symbol_a | Chr_a | Start_a | End_a | Symbol_b | Chr_b | Start_b | End_b |
| cf) Tissue number; Tissue name (1;Breast, 2;Central_nervous_system, 3;Haematopoietic_and_lymphoid_tissue, 4;Large_intestine, 5;Liver, 6;Lung, 7;Ovary, 8;Pancreas, 9;Prostate, 10;Skin, 11;Soft_tissue, 12;Upper_aerodigestive_tract) |
| * From mRNA Sanger sequences, Chitars2.0 arranged chimeric transcripts. This table shows RPL3 related fusion information. |
| ID | Head Gene | Tail Gene | Accession | Gene_a | qStart_a | qEnd_a | Chromosome_a | tStart_a | tEnd_a | Gene_a | qStart_a | qEnd_a | Chromosome_a | tStart_a | tEnd_a |
| CN268128 | EMILIN1 | 1 | 145 | 2 | 27301589 | 27301733 | RPL3 | 141 | 193 | 22 | 39708889 | 39708941 | |
| BQ349966 | RPL3 | 10 | 328 | 22 | 39713539 | 39715630 | RPL3 | 323 | 592 | 22 | 39710198 | 39711466 | |
| BQ923637 | HLA-B | 1 | 48 | 6 | 2581523 | 2581571 | RPL3 | 45 | 813 | 22 | 39710699 | 39714528 | |
| CD699756 | LPAR5 | 42 | 210 | 12 | 6730603 | 6745126 | RPL3 | 201 | 606 | 22 | 39711434 | 39713608 | |
| AL702234 | SEPT11 | 1 | 54 | 4 | 77949830 | 77949883 | RPL3 | 48 | 163 | 22 | 39708894 | 39709215 | |
| CV360980 | MICB | 22 | 334 | 6 | 2594912 | 2596137 | RPL3 | 331 | 584 | 22 | 39710691 | 39711466 | |
| BP429026 | GPX1 | 7 | 292 | 3 | 49394925 | 49395489 | RPL3 | 291 | 388 | 22 | 39709703 | 39710177 | |
| BG505035 | FLT3LG | 2 | 522 | 19 | 49990865 | 49994778 | RPL3 | 521 | 637 | 22 | 39708915 | 39709232 | |
| BM972994 | PPAPDC1B | 17 | 545 | 8 | 38124500 | 38125533 | RPL3 | 539 | 689 | 22 | 39713598 | 39714519 | |
| AA242792 | RPL3 | 1 | 154 | 22 | 39711373 | 39711526 | SOX8 | 154 | 490 | 16 | 1036443 | 1036779 | |
| CD368190 | RPL38 | 17 | 208 | 17 | 72205334 | 72206019 | RPL3 | 203 | 697 | 22 | 39710181 | 39712824 | |
| CX786698 | RPL3 | 1 | 495 | 22 | 39711429 | 39714462 | BCL2L2-PABPN1 | 491 | 616 | 14 | 23795153 | 23795279 | |
| AW999090 | NGLY1 | 15 | 283 | 3 | 25773848 | 25775506 | RPL3 | 269 | 539 | 22 | 39713058 | 39713328 | |
| BF360749 | RPL3 | 61 | 213 | 22 | 39710691 | 39710841 | STX11 | 202 | 222 | 6 | 144483951 | 144483971 | |
| Top |
| There's no copy number variation information in COSMIC data for this gene. |
| Top |
|
 |
| Top |
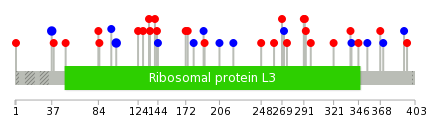
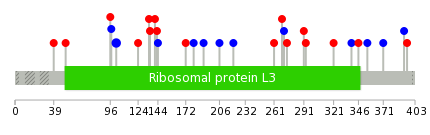
| Stat. for Non-Synonymous SNVs (# total SNVs=19) | (# total SNVs=10) |
 |  |
(# total SNVs=0) | (# total SNVs=0) |
| Top |
| * When you move the cursor on each content, you can see more deailed mutation information on the Tooltip. Those are primary_site,primary_histology,mutation(aa),pubmedID. |
| GRCh37 position | Mutation(aa) | Unique sampleID count |
| chr22:39714490-39714490 | p.P37P | 2 |
| chr22:39713525-39713525 | p.F102F | 2 |
| chr22:39711522-39711522 | p.L180L | 1 |
| chr22:39708981-39708981 | p.L392L | 1 |
| chr22:39713540-39713540 | p.R97R | 1 |
| chr22:39710191-39710191 | p.Y291C | 1 |
| chr22:39711541-39711541 | p.R174H | 1 |
| chr22:39709250-39709250 | p.T371T | 1 |
| chr22:39713577-39713577 | p.V85G | 1 |
| chr22:39710719-39710719 | p.Y274C | 1 |
| Top |
|
 |
| Point Mutation/ Tissue ID | 1 | 2 | 3 | 4 | 5 | 6 | 7 | 8 | 9 | 10 | 11 | 12 | 13 | 14 | 15 | 16 | 17 | 18 | 19 | 20 |
| # sample | 3 | 1 | 7 | 4 | 1 | 3 | 1 | 4 | 2 | 4 | ||||||||||
| # mutation | 3 | 1 | 7 | 4 | 1 | 3 | 1 | 4 | 2 | 4 | ||||||||||
| nonsynonymous SNV | 1 | 6 | 2 | 1 | 1 | 2 | 2 | 2 | ||||||||||||
| synonymous SNV | 2 | 1 | 1 | 2 | 2 | 1 | 2 | 2 |
| cf) Tissue ID; Tissue type (1; BLCA[Bladder Urothelial Carcinoma], 2; BRCA[Breast invasive carcinoma], 3; CESC[Cervical squamous cell carcinoma and endocervical adenocarcinoma], 4; COAD[Colon adenocarcinoma], 5; GBM[Glioblastoma multiforme], 6; Glioma Low Grade, 7; HNSC[Head and Neck squamous cell carcinoma], 8; KICH[Kidney Chromophobe], 9; KIRC[Kidney renal clear cell carcinoma], 10; KIRP[Kidney renal papillary cell carcinoma], 11; LAML[Acute Myeloid Leukemia], 12; LUAD[Lung adenocarcinoma], 13; LUSC[Lung squamous cell carcinoma], 14; OV[Ovarian serous cystadenocarcinoma ], 15; PAAD[Pancreatic adenocarcinoma], 16; PRAD[Prostate adenocarcinoma], 17; SKCM[Skin Cutaneous Melanoma], 18:STAD[Stomach adenocarcinoma], 19:THCA[Thyroid carcinoma], 20:UCEC[Uterine Corpus Endometrial Carcinoma]) |
| Top |
| * We represented just top 10 SNVs. When you move the cursor on each content, you can see more deailed mutation information on the Tooltip. Those are primary_site, primary_histology, mutation(aa), pubmedID. |
| Genomic Position | Mutation(aa) | Unique sampleID count |
| chr22:39713525 | p.F102F,RPL3 | 2 |
| chr22:39712807 | p.L392L,RPL3 | 1 |
| chr22:39708981 | p.P172T | 1 |
| chr22:39710758 | p.T371T,RPL3 | 1 |
| chr22:39712841 | p.K144K | 1 |
| chr22:39709250 | p.T355T,RPL3 | 1 |
| chr22:39711402 | p.K143N | 1 |
| chr22:39709298 | p.T346A,RPL3 | 1 |
| chr22:39711444 | p.D141G | 1 |
| chr22:39713540 | p.G339G,RPL3 | 1 |
| * Copy number data were extracted from TCGA using R package TCGA-Assembler. The URLs of all public data files on TCGA DCC data server were gathered on Jan-05-2015. Function ProcessCNAData in TCGA-Assembler package was used to obtain gene-level copy number value which is calculated as the average copy number of the genomic region of a gene. |
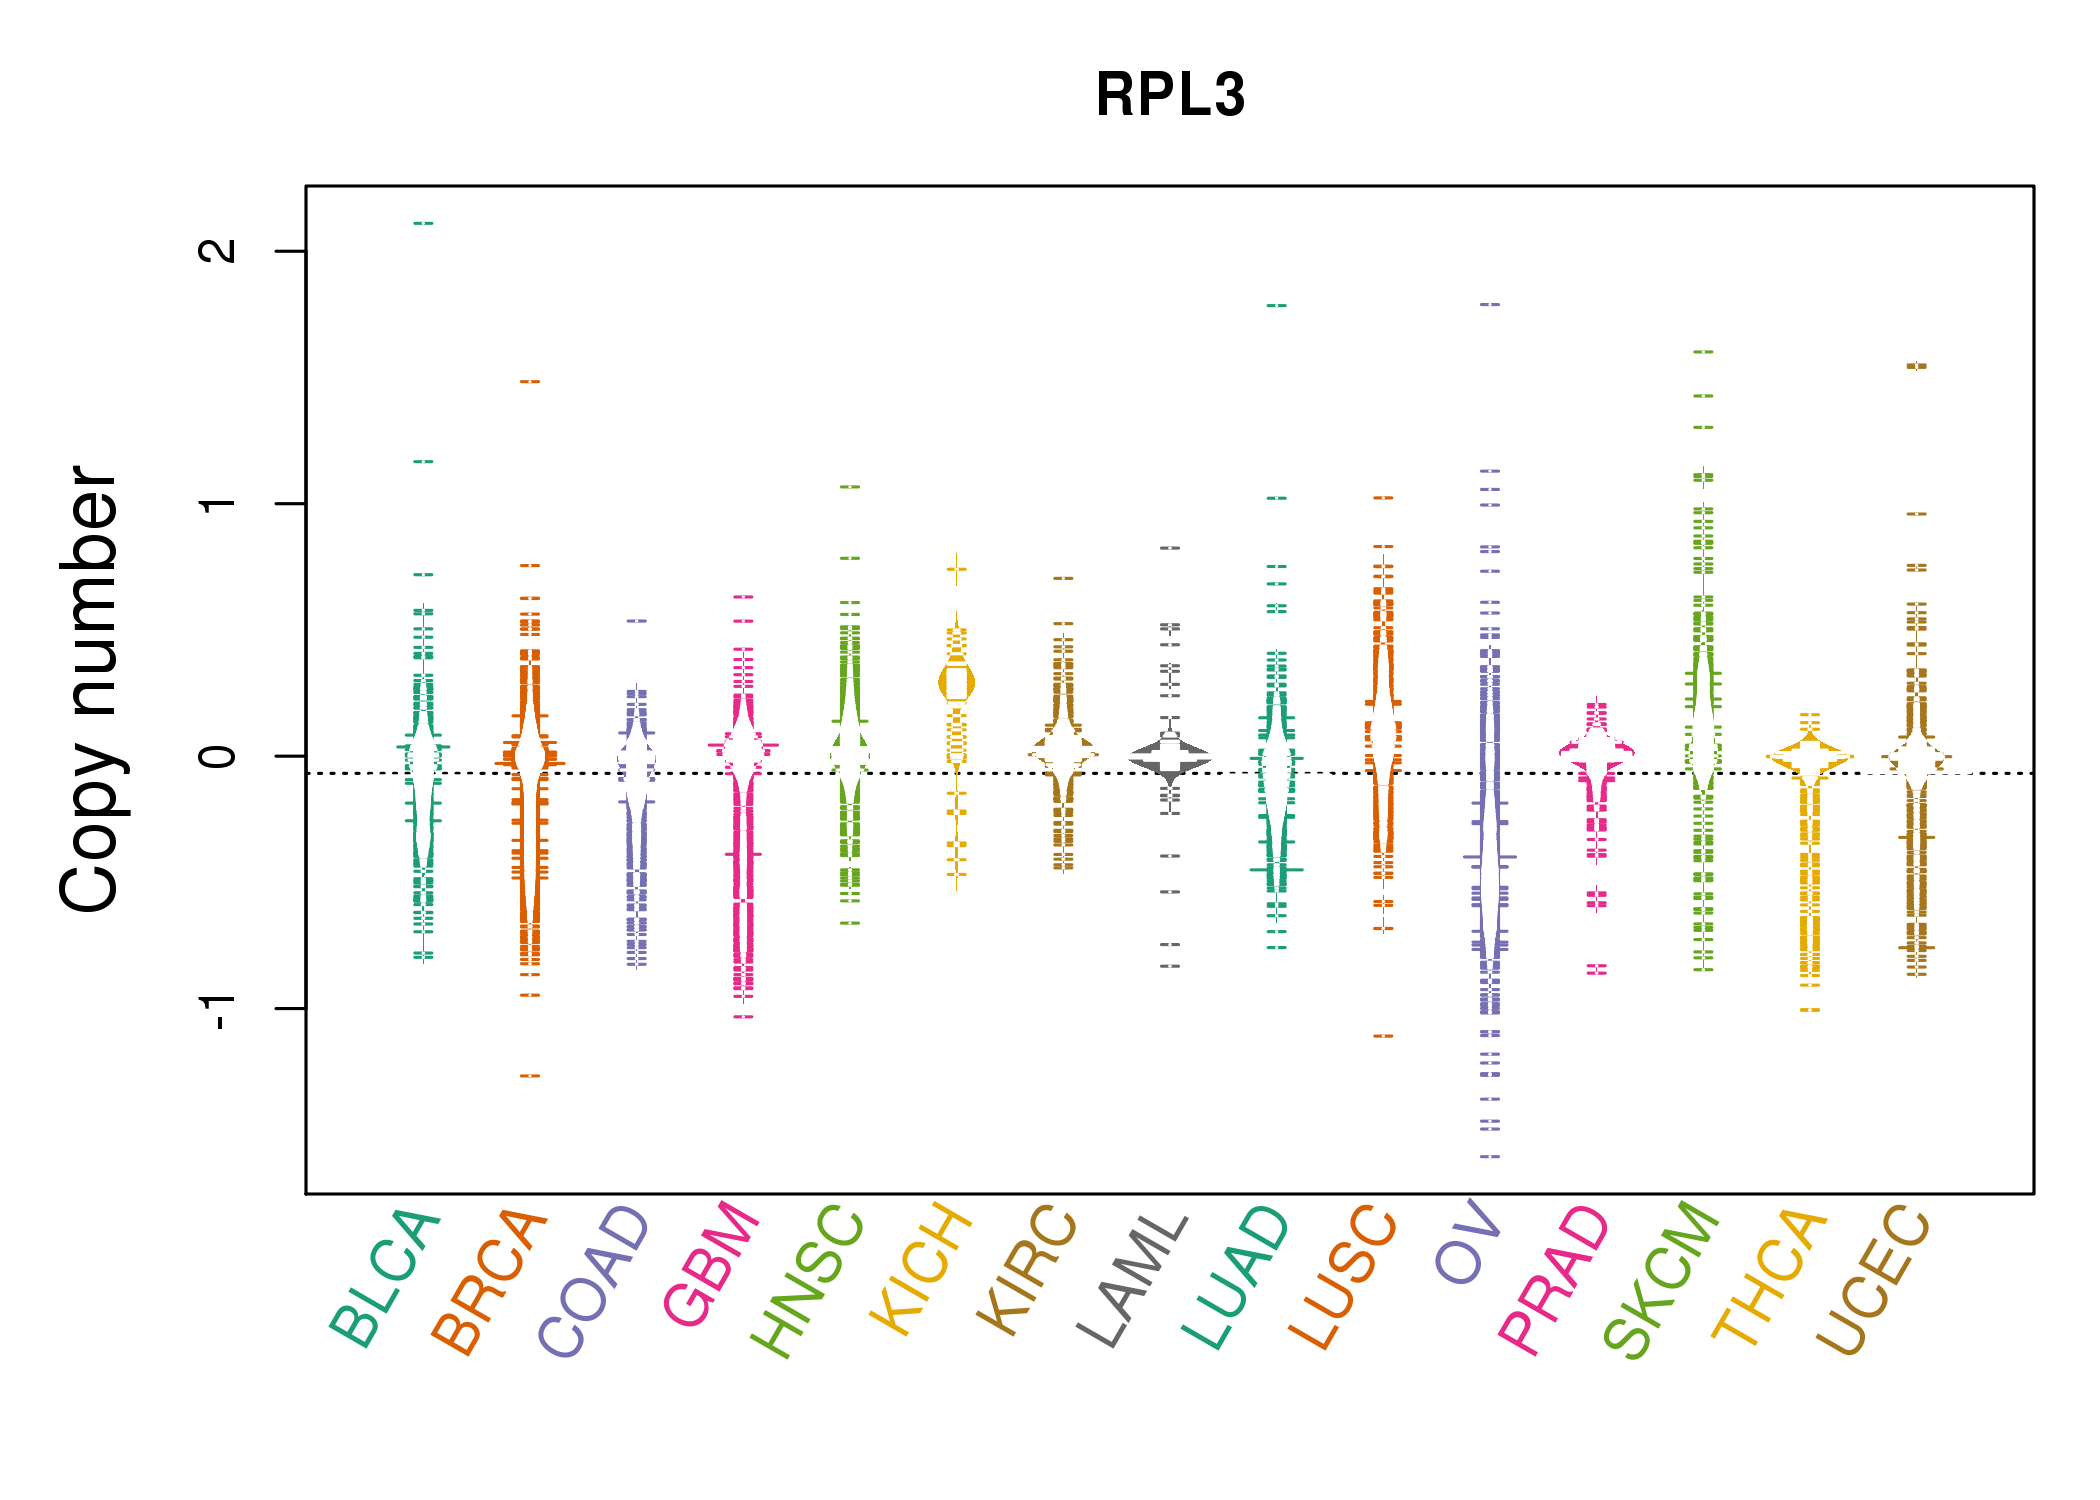 |
| cf) Tissue ID[Tissue type]: BLCA[Bladder Urothelial Carcinoma], BRCA[Breast invasive carcinoma], CESC[Cervical squamous cell carcinoma and endocervical adenocarcinoma], COAD[Colon adenocarcinoma], GBM[Glioblastoma multiforme], Glioma Low Grade, HNSC[Head and Neck squamous cell carcinoma], KICH[Kidney Chromophobe], KIRC[Kidney renal clear cell carcinoma], KIRP[Kidney renal papillary cell carcinoma], LAML[Acute Myeloid Leukemia], LUAD[Lung adenocarcinoma], LUSC[Lung squamous cell carcinoma], OV[Ovarian serous cystadenocarcinoma ], PAAD[Pancreatic adenocarcinoma], PRAD[Prostate adenocarcinoma], SKCM[Skin Cutaneous Melanoma], STAD[Stomach adenocarcinoma], THCA[Thyroid carcinoma], UCEC[Uterine Corpus Endometrial Carcinoma] |
| Top |
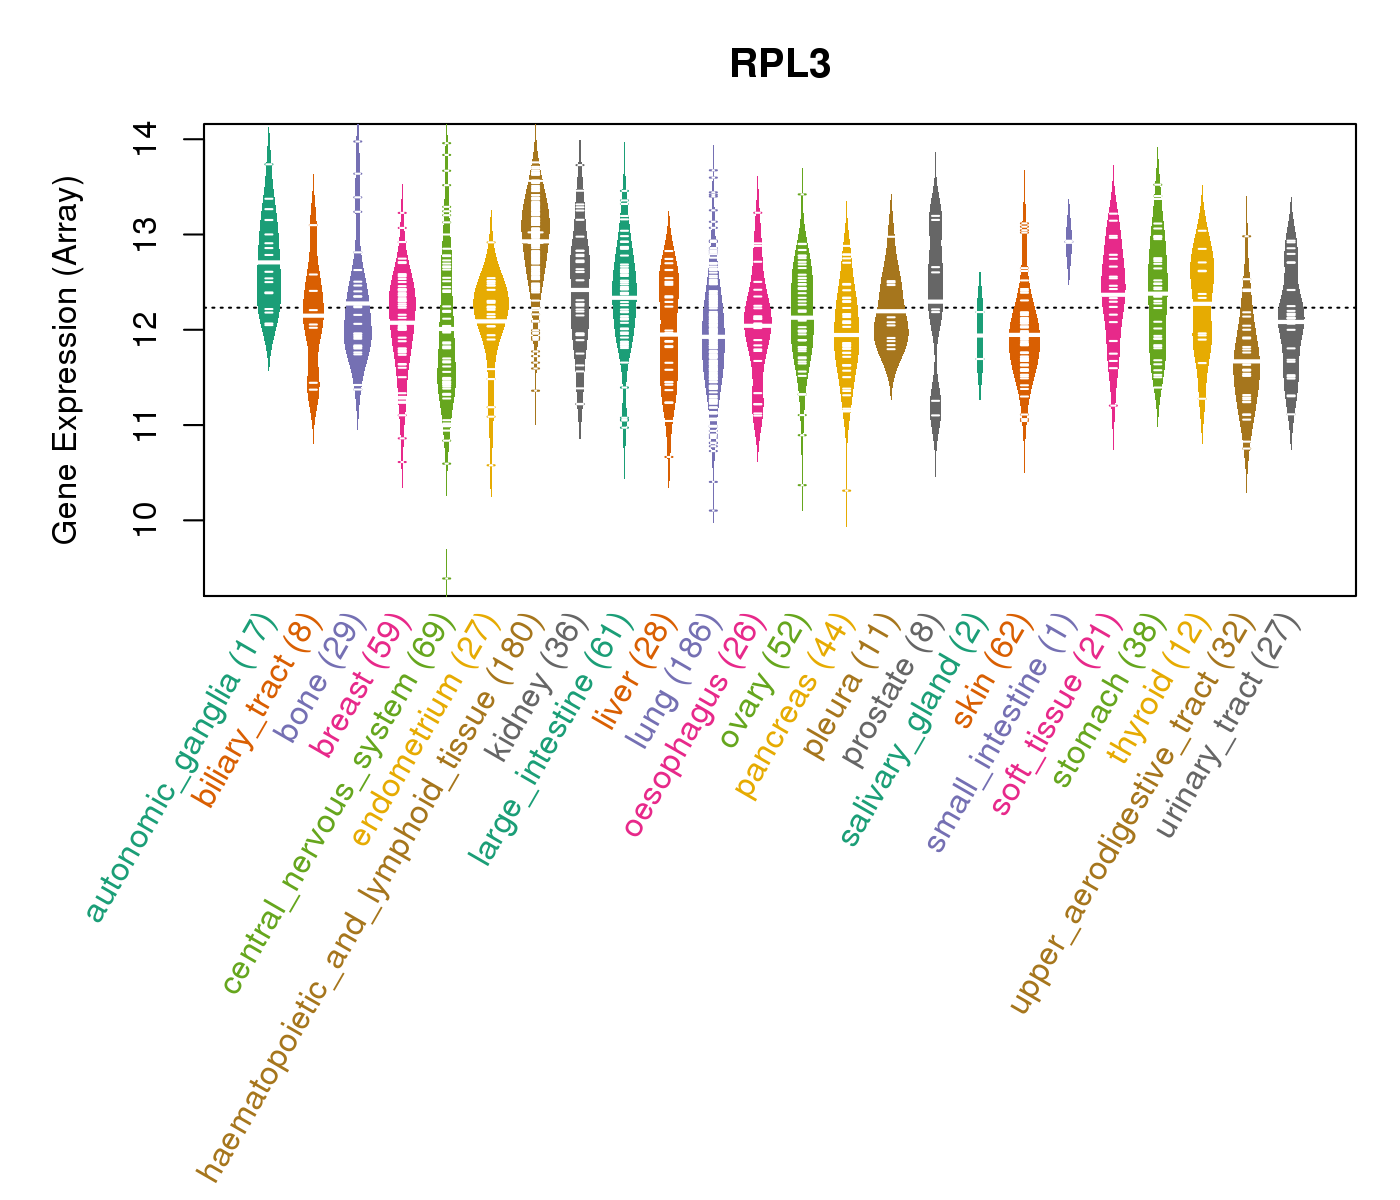
| Gene Expression for RPL3 |
| * CCLE gene expression data were extracted from CCLE_Expression_Entrez_2012-10-18.res: Gene-centric RMA-normalized mRNA expression data. |
 |
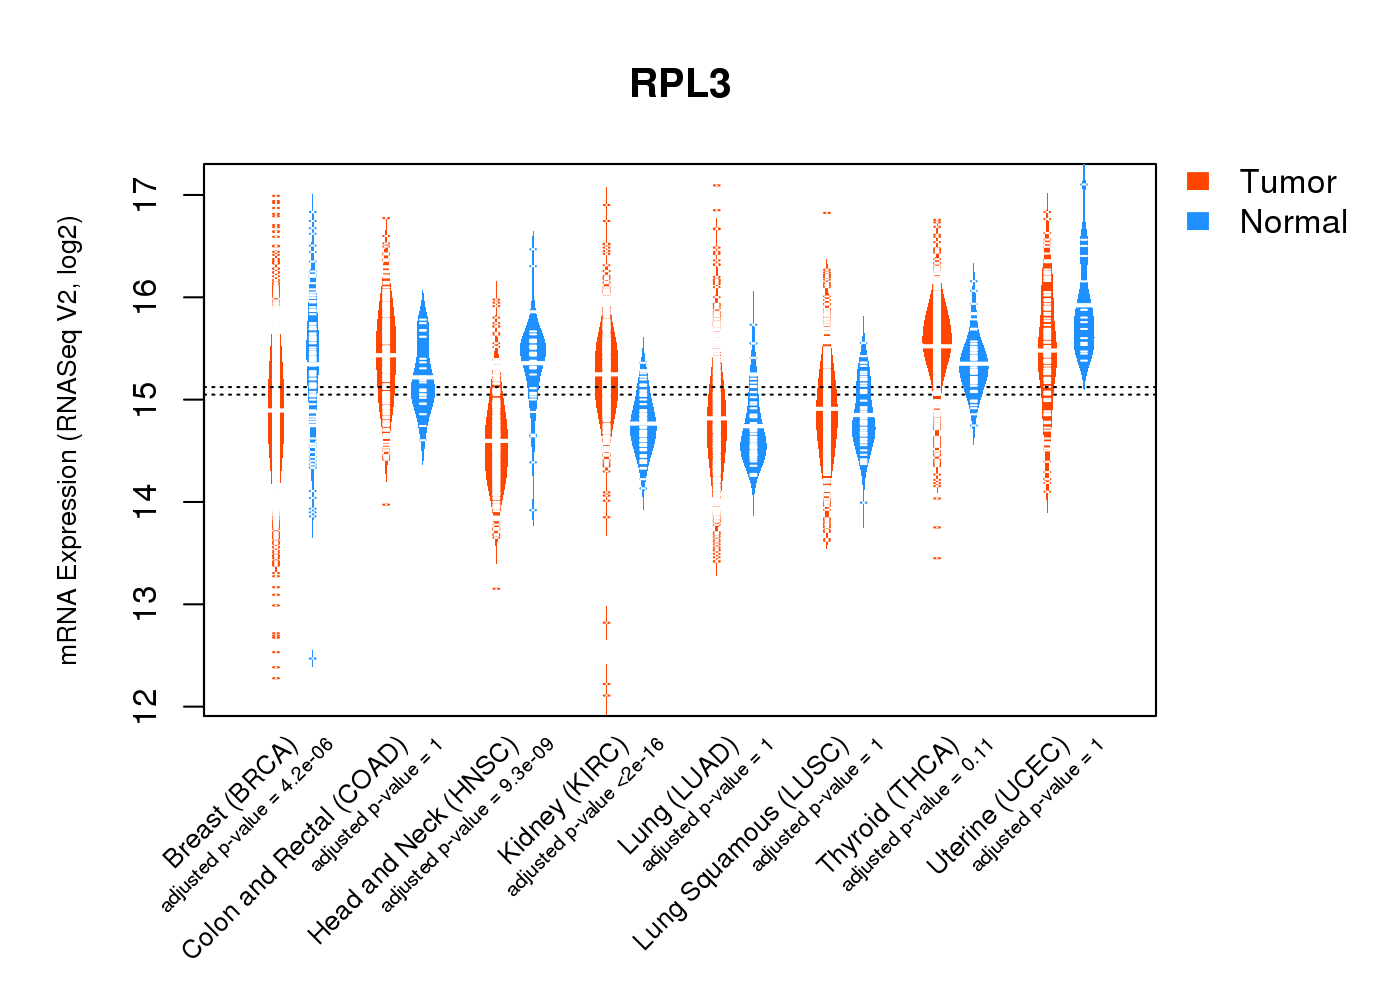
| * Normalized gene expression data of RNASeqV2 was extracted from TCGA using R package TCGA-Assembler. The URLs of all public data files on TCGA DCC data server were gathered at Jan-05-2015. Only eight cancer types have enough normal control samples for differential expression analysis. (t test, adjusted p<0.05 (using Benjamini-Hochberg FDR)) |
 |
| Top |
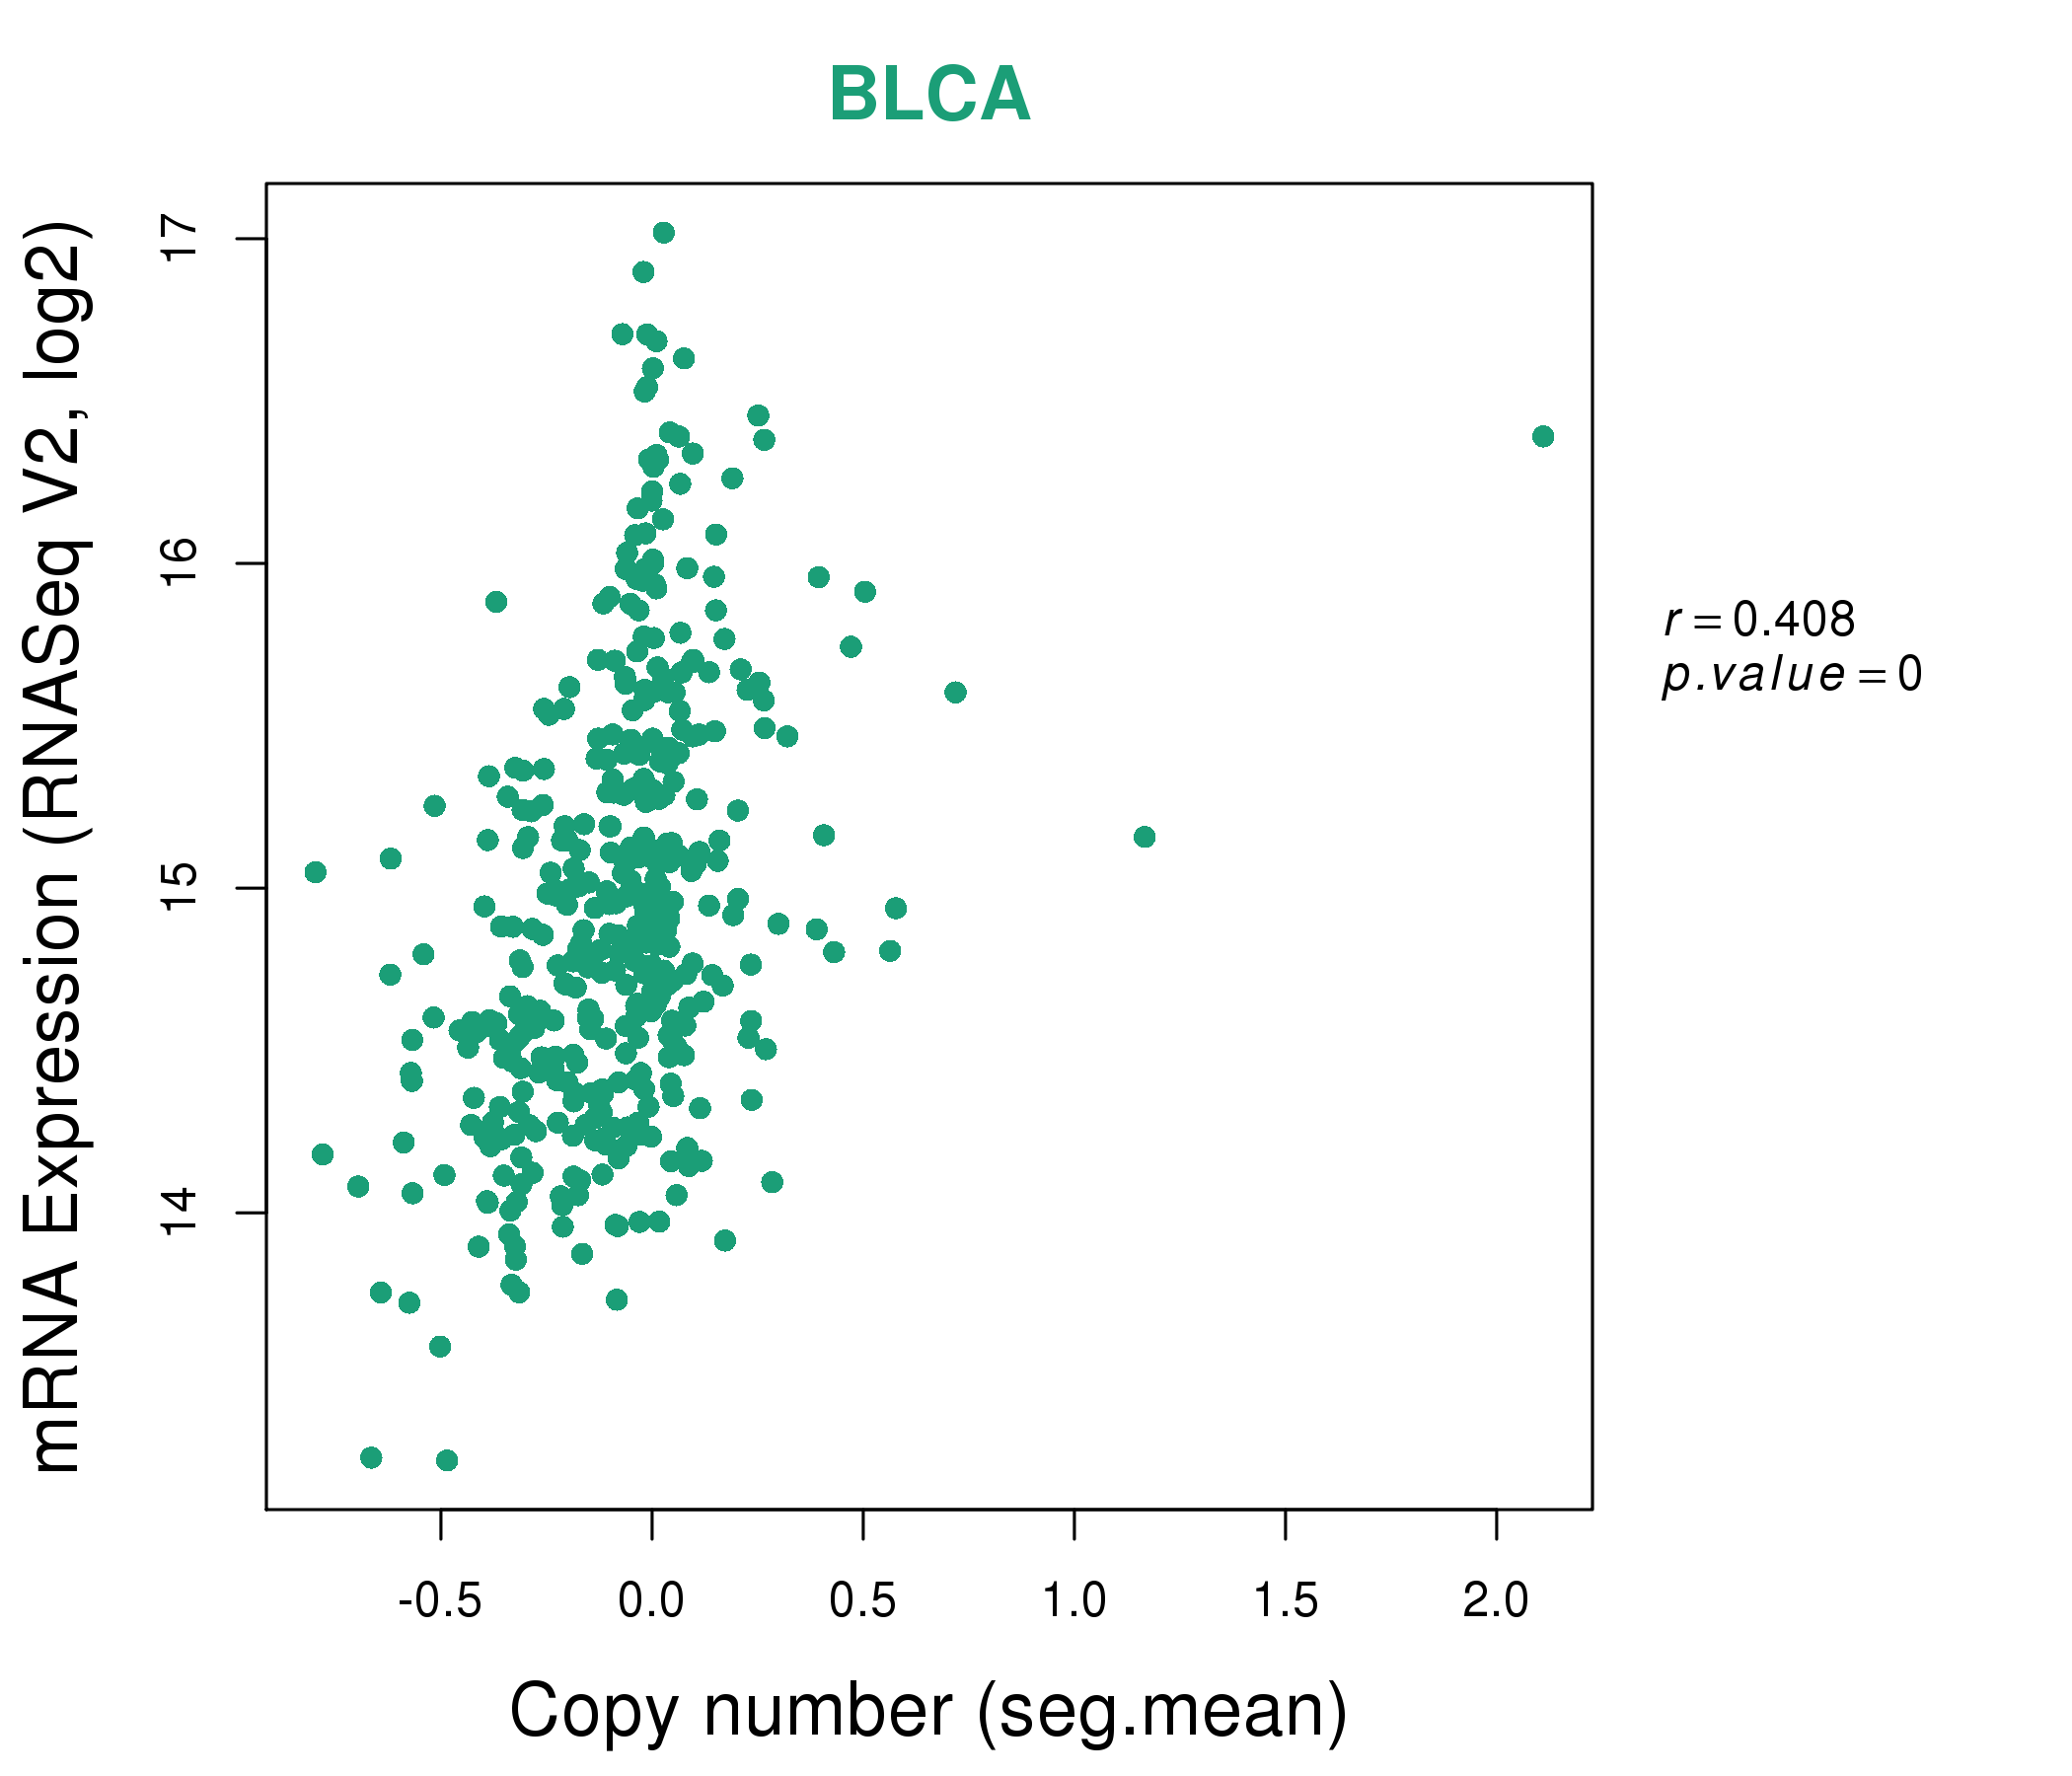
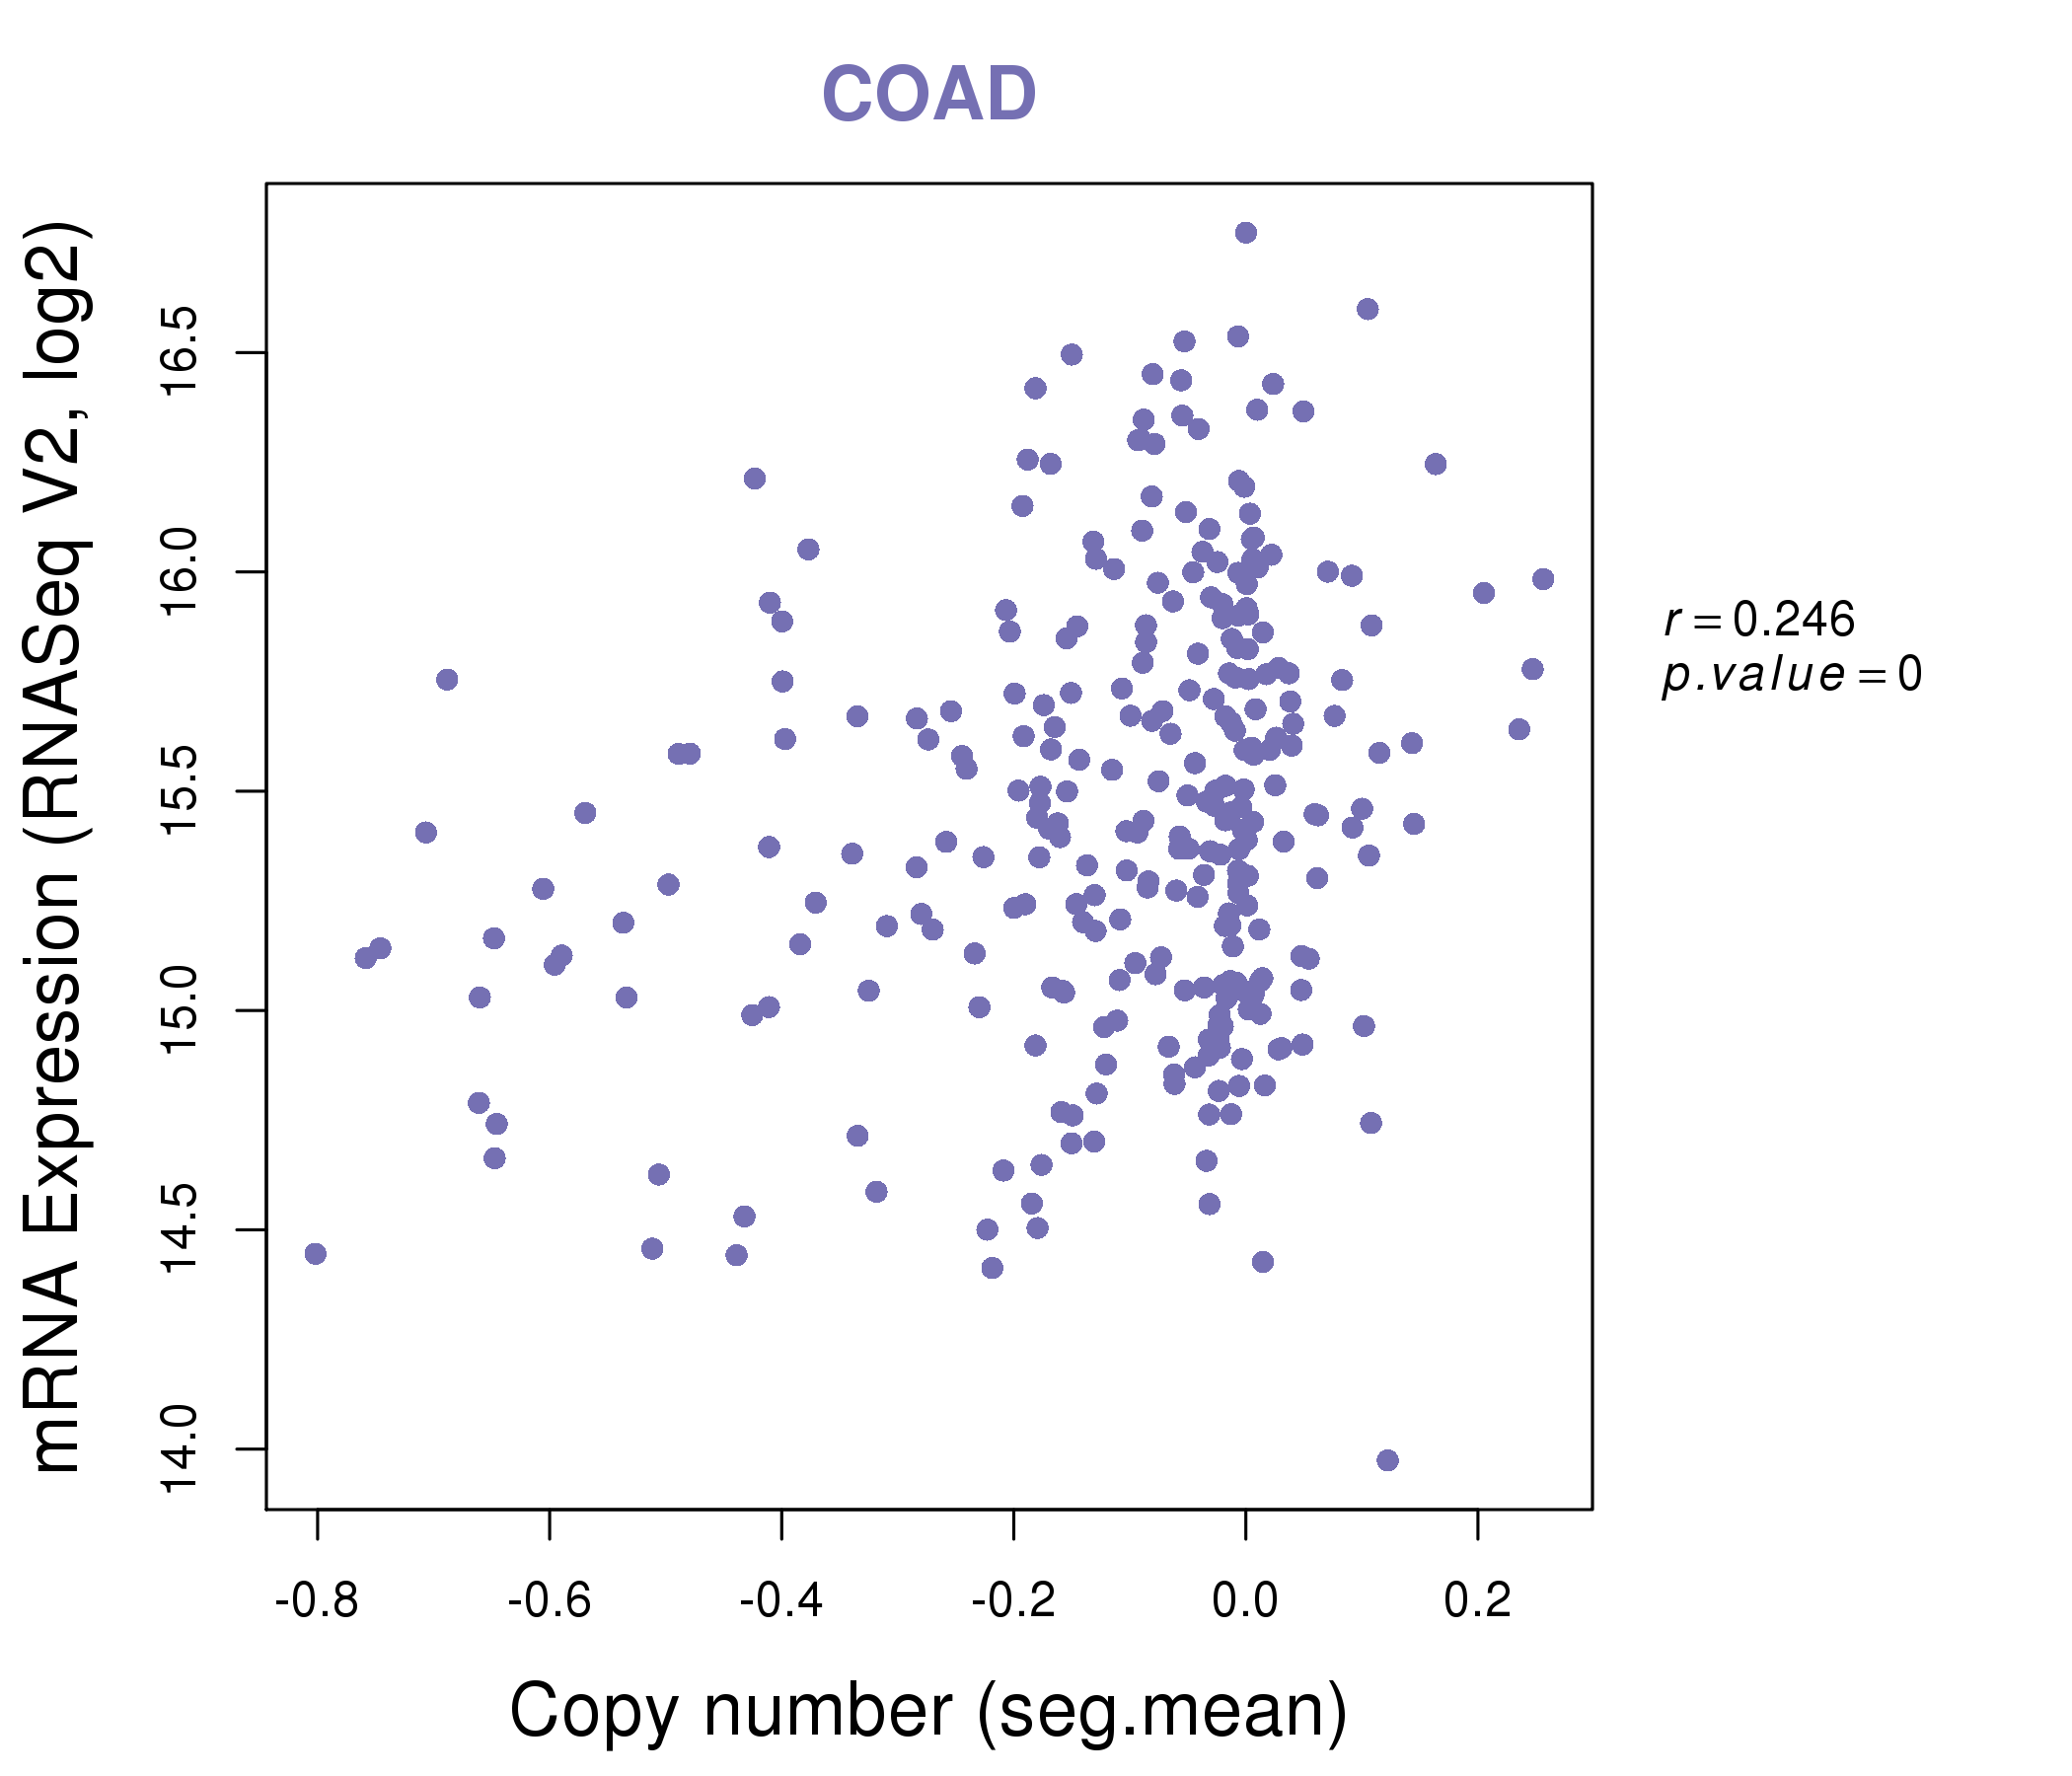
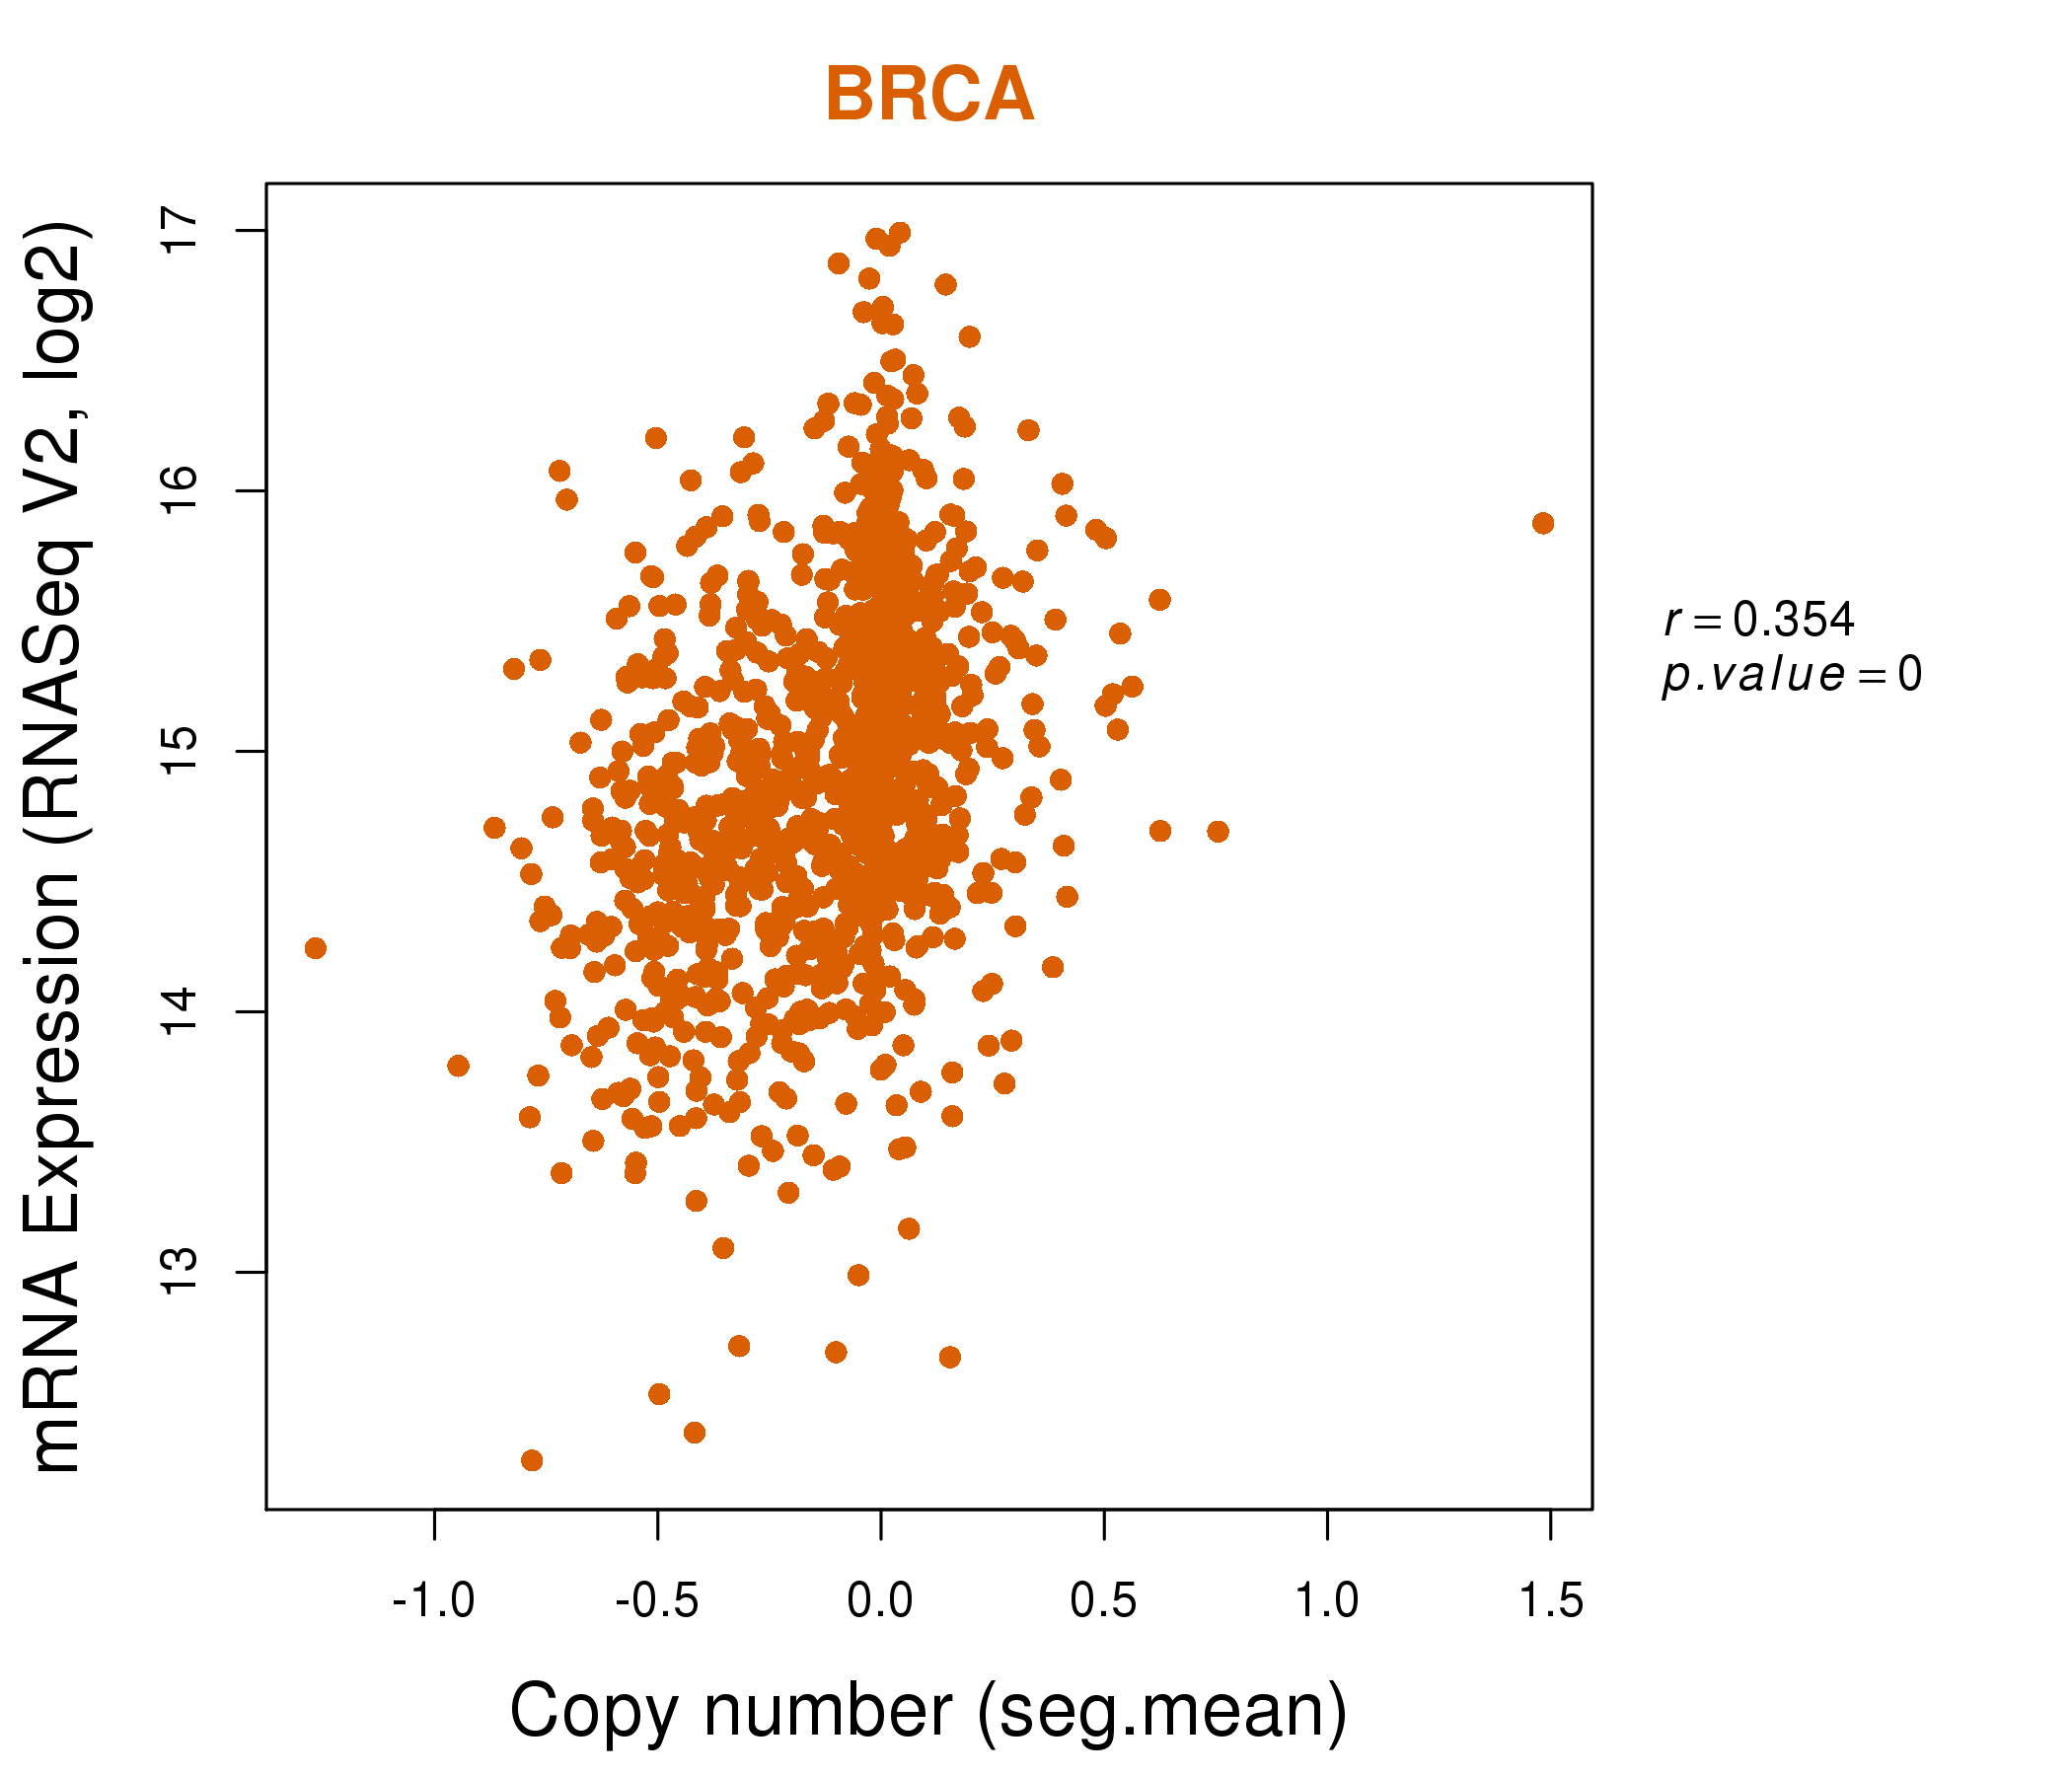
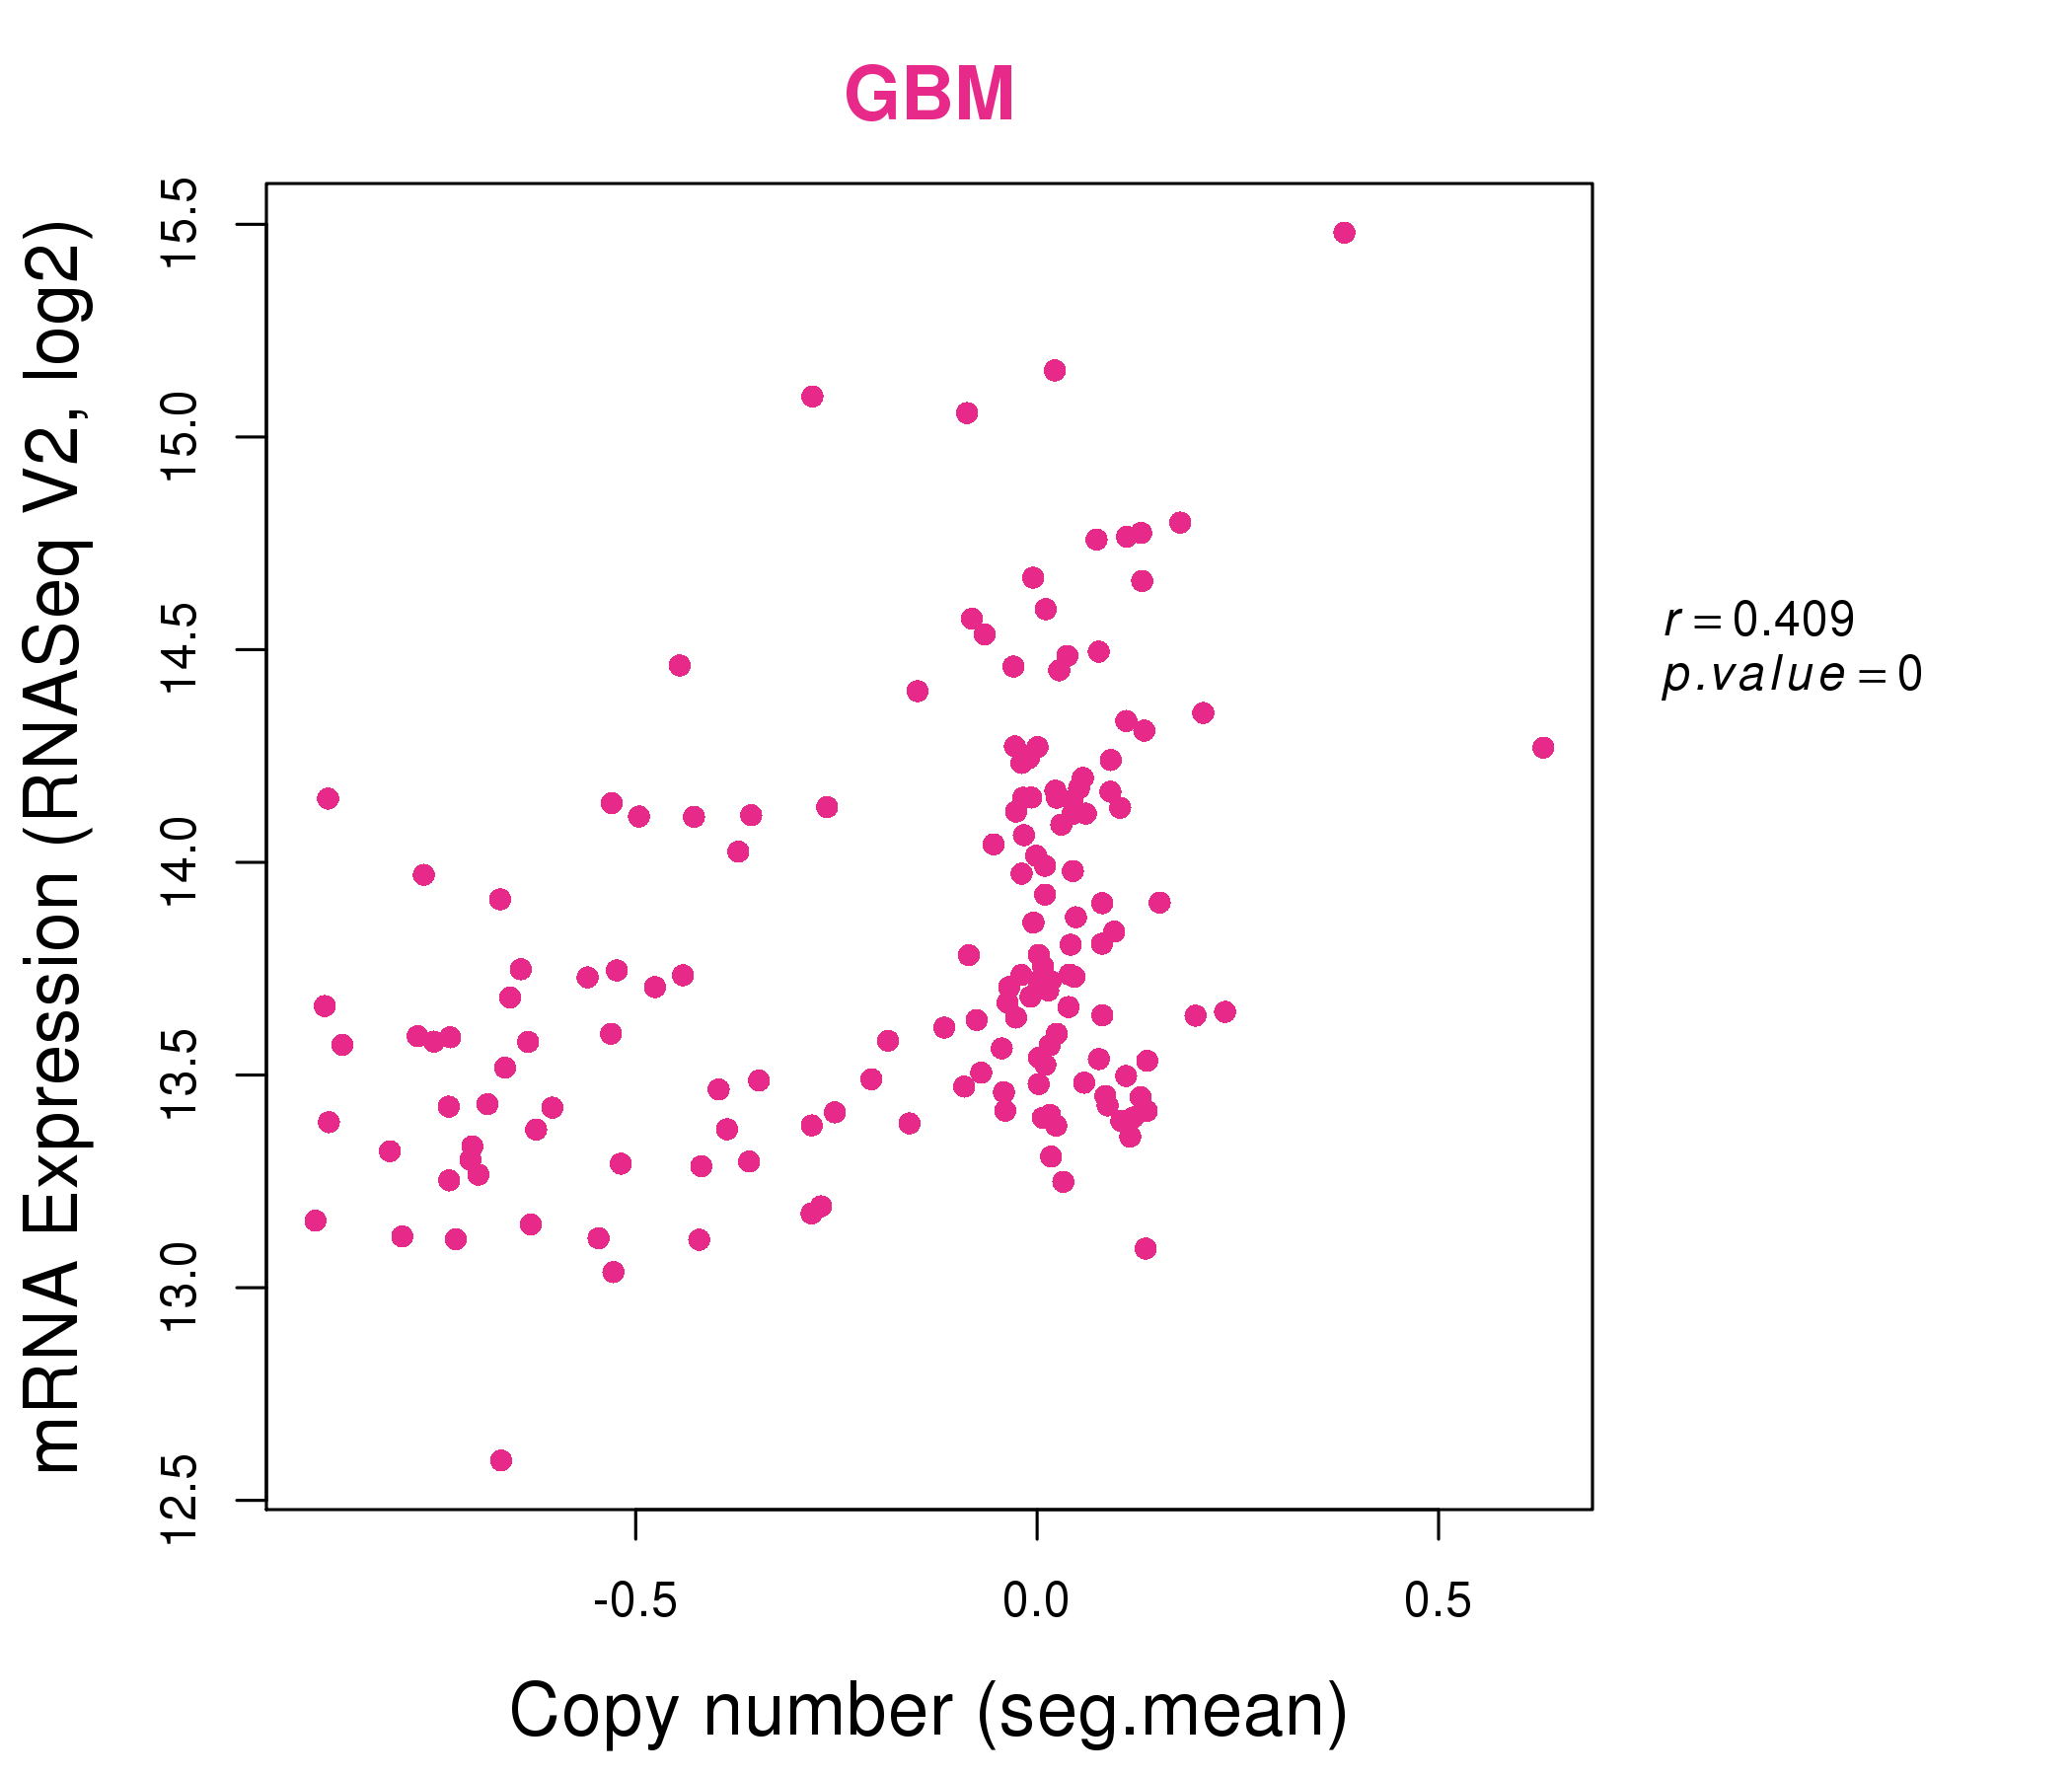
| * This plots show the correlation between CNV and gene expression. |
: Open all plots for all cancer types
 |
|
 |
|
| Top |
| Gene-Gene Network Information |
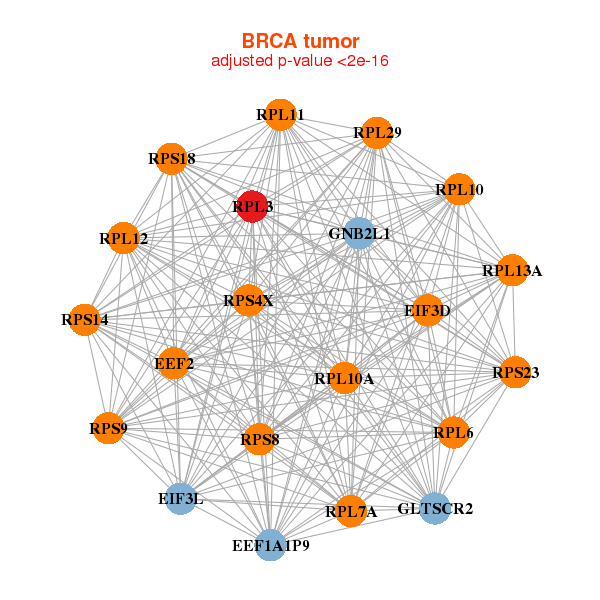
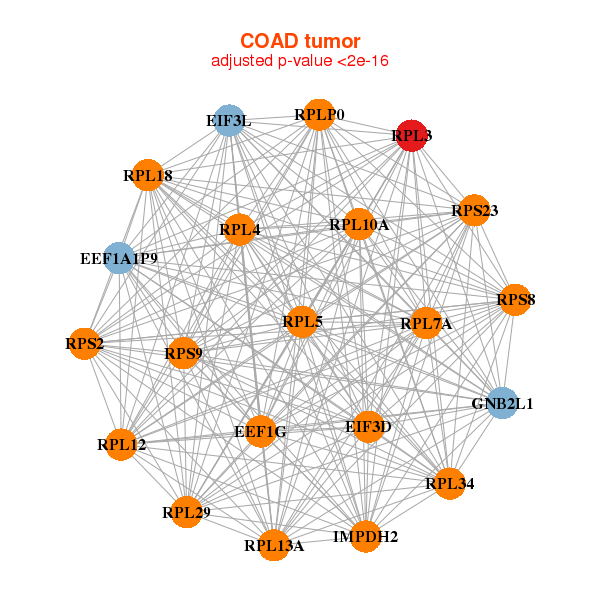
| * Co-Expression network figures were drawn using R package igraph. Only the top 20 genes with the highest correlations were shown. Red circle: input gene, orange circle: cell metabolism gene, sky circle: other gene |
: Open all plots for all cancer types
 |
| ||||
| C1QTNF9B,CT45A1,CT45A3,DHRS2,FRG2B,GABPB1,HGC6.3, LOC643008,MAGEA8,MAGEB18,MAGEB2,RGS5,RPL3L,SPPL2A, SUMO2,TYRP1,UGT2B10,UGT2B15,USP29,USP8,ZIM3 | ACTA1,ATP2A1,MIR1-1HG,CKM,CSRP3,LMOD2,LOC151300, MYBPC2,MYH2,MYH6,MYH7,MYL1,MYL2,MYLPF, NEB,NRAP,OR5H15,P2RX6P,PPP1R3A,RPL3L,XIRP2 | ||||
 |
| ||||
| PPP1R17,LINC00588,CACNG7,CER1,CHRNA4,CPLX3,FAM27L, LHX3,PAQR9,RBMY1A3P,RPL3L,SHISA7,SLC1A6,SLC6A5, TFAP2D,TSPY1,TSPY4,UNCX | ACTBL2,LINC00596,SCP2D1,DUOX1,FAM74A1,FAM92A1P2,FLJ25758, GAL,HELT,KRTAP13-1,LY6D,MCHR1,OR1J2,PFN3, PRAMEF12,RBMXL3,RPL3L,SNORA64,SNORA74A,tAKR,TM4SF19, TRIM42,USP26,VWCE,X |

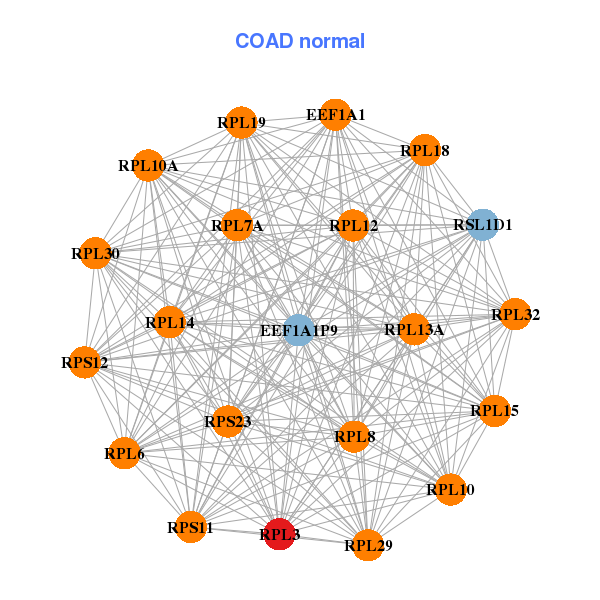
| * Co-Expression network figures were drawn using R package igraph. Only the top 20 genes with the highest correlations were shown. Red circle: input gene, orange circle: cell metabolism gene, sky circle: other gene |
: Open all plots for all cancer types
| Top |
: Open all interacting genes' information including KEGG pathway for all interacting genes from DAVID
| Top |
| Pharmacological Information for RPL3 |
| DB Category | DB Name | DB's ID and Url link |
| * Gene Centered Interaction Network. |
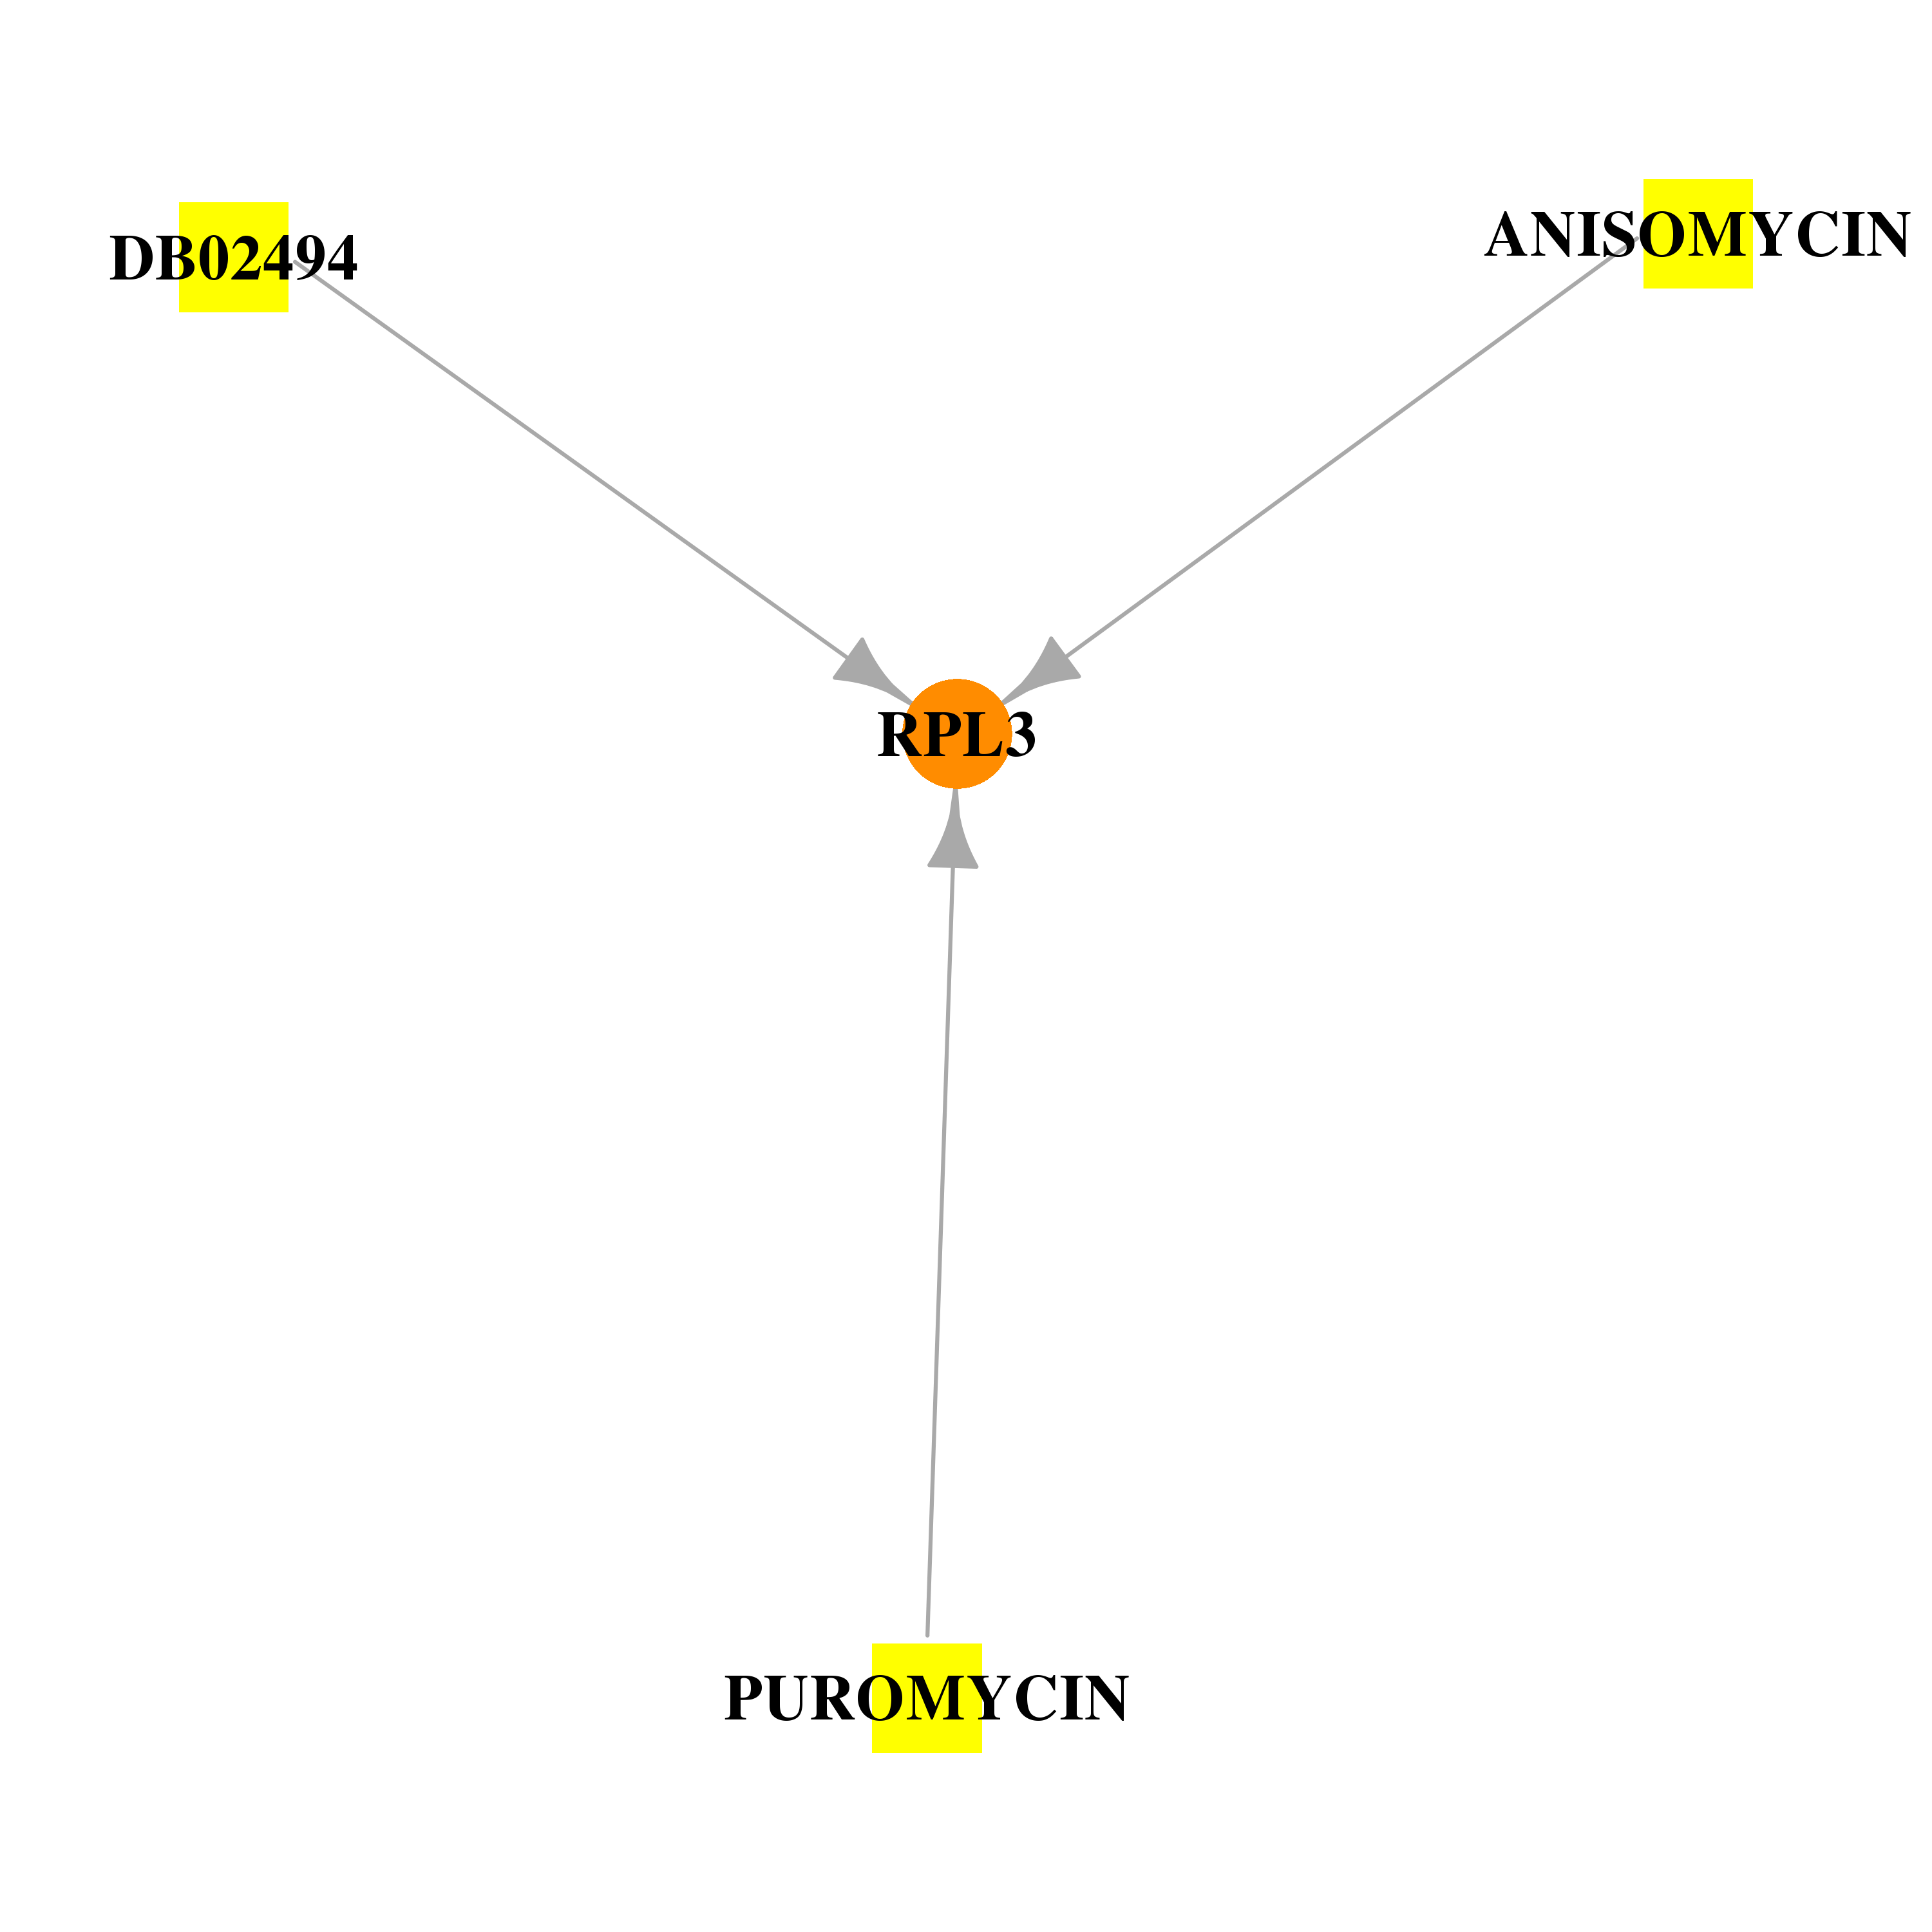 |
| * Drug Centered Interaction Network. |
| DrugBank ID | Target Name | Drug Groups | Generic Name | Drug Centered Network | Drug Structure |
| DB02494 | ribosomal protein L3 | experimental | Alpha-Hydroxy-Beta-Phenyl-Propionic Acid | 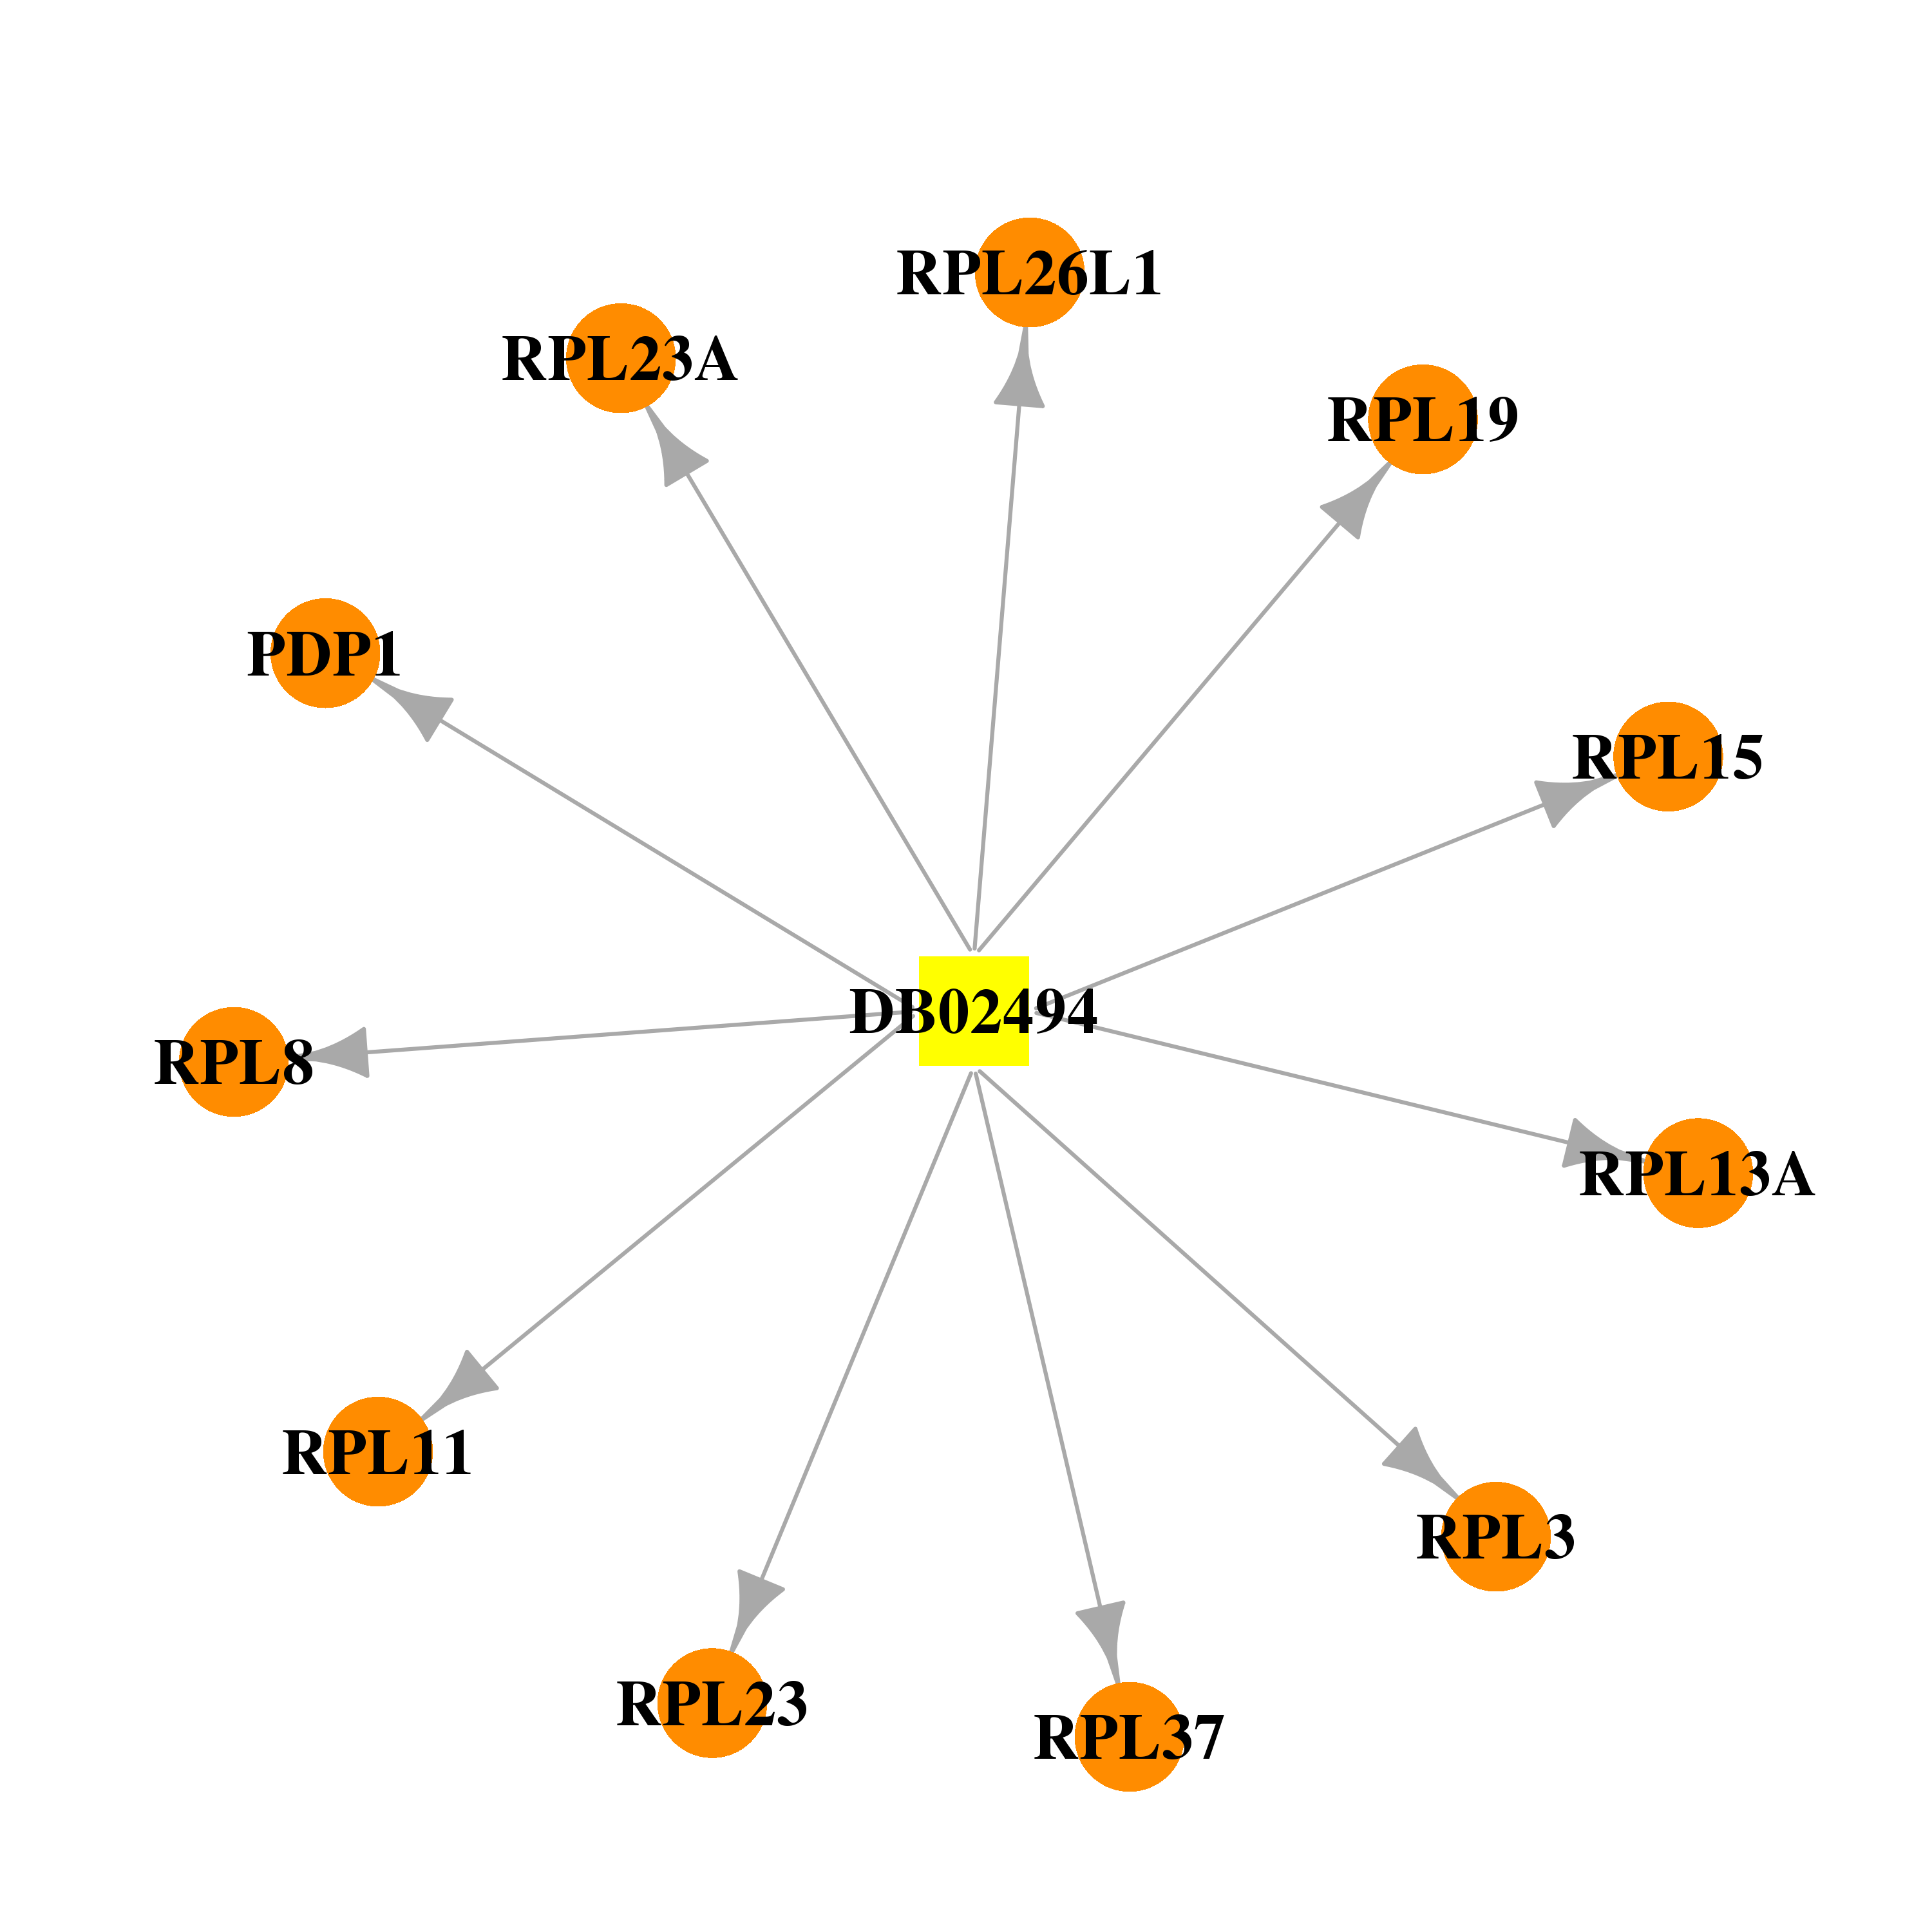 | 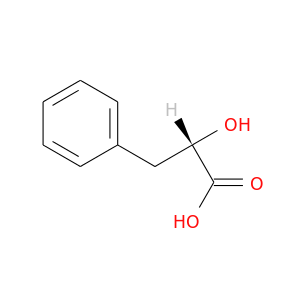 |
| DB07374 | ribosomal protein L3 | experimental | ANISOMYCIN |  | 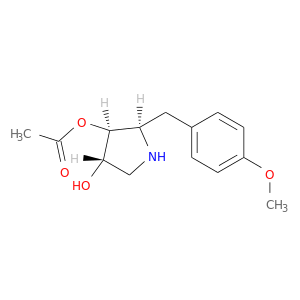 |
| DB08437 | ribosomal protein L3 | experimental | PUROMYCIN |  | 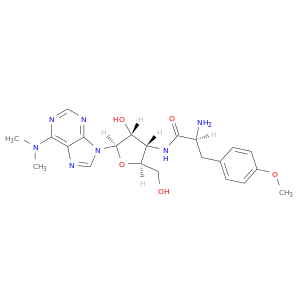 |
| Top |
| Cross referenced IDs for RPL3 |
| * We obtained these cross-references from Uniprot database. It covers 150 different DBs, 18 categories. http://www.uniprot.org/help/cross_references_section |
: Open all cross reference information
|
Copyright © 2016-Present - The Univsersity of Texas Health Science Center at Houston @ |