|
||||||||||||||||||||
| |
| Phenotypic Information (metabolism pathway, cancer, disease, phenome) |
| |
| |
| Gene-Gene Network Information: Co-Expression Network, Interacting Genes & KEGG |
| |
|


| Gene Summary for RPL8 |
| Basic gene info. | Gene symbol | RPL8 |
| Gene name | ribosomal protein L8 | |
| Synonyms | L8 | |
| Cytomap | UCSC genome browser: 8q24.3 | |
| Genomic location | chr8 :146015153-146017729 | |
| Type of gene | protein-coding | |
| RefGenes | NM_000973.3, NM_033301.1, | |
| Ensembl id | ENSG00000161016 | |
| Description | 60S ribosomal protein L8 | |
| Modification date | 20141207 | |
| dbXrefs | MIM : 604177 | |
| HGNC : HGNC | ||
| Ensembl : ENSG00000161016 | ||
| HPRD : 16044 | ||
| Vega : OTTHUMG00000165249 | ||
| Protein | UniProt: go to UniProt's Cross Reference DB Table | |
| Expression | CleanEX: HS_RPL8 | |
| BioGPS: 6132 | ||
| Gene Expression Atlas: ENSG00000161016 | ||
| The Human Protein Atlas: ENSG00000161016 | ||
| Pathway | NCI Pathway Interaction Database: RPL8 | |
| KEGG: RPL8 | ||
| REACTOME: RPL8 | ||
| ConsensusPathDB | ||
| Pathway Commons: RPL8 | ||
| Metabolism | MetaCyc: RPL8 | |
| HUMANCyc: RPL8 | ||
| Regulation | Ensembl's Regulation: ENSG00000161016 | |
| miRBase: chr8 :146,015,153-146,017,729 | ||
| TargetScan: NM_000973 | ||
| cisRED: ENSG00000161016 | ||
| Context | iHOP: RPL8 | |
| cancer metabolism search in PubMed: RPL8 | ||
| UCL Cancer Institute: RPL8 | ||
| Assigned class in ccmGDB | C | |
| Top |
| Phenotypic Information for RPL8(metabolism pathway, cancer, disease, phenome) |
| Cancer | CGAP: RPL8 |
| Familial Cancer Database: RPL8 | |
| * This gene is included in those cancer gene databases. |
|
|
|
|
|
| . | ||||||||||||||
Oncogene 1 | Significant driver gene in | |||||||||||||||||||
| cf) number; DB name 1 Oncogene; http://nar.oxfordjournals.org/content/35/suppl_1/D721.long, 2 Tumor Suppressor gene; https://bioinfo.uth.edu/TSGene/, 3 Cancer Gene Census; http://www.nature.com/nrc/journal/v4/n3/abs/nrc1299.html, 4 CancerGenes; http://nar.oxfordjournals.org/content/35/suppl_1/D721.long, 5 Network of Cancer Gene; http://ncg.kcl.ac.uk/index.php, 1Therapeutic Vulnerabilities in Cancer; http://cbio.mskcc.org/cancergenomics/statius/ |
| REACTOME_METABOLISM_OF_PROTEINS REACTOME_METABOLISM_OF_MRNA REACTOME_METABOLISM_OF_RNA | |
| OMIM | |
| Orphanet | |
| Disease | KEGG Disease: RPL8 |
| MedGen: RPL8 (Human Medical Genetics with Condition) | |
| ClinVar: RPL8 | |
| Phenotype | MGI: RPL8 (International Mouse Phenotyping Consortium) |
| PhenomicDB: RPL8 | |
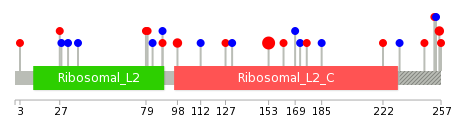
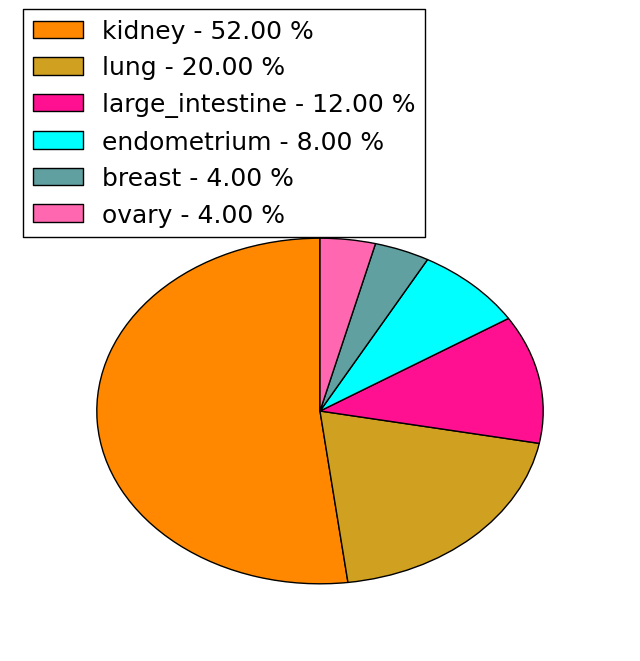
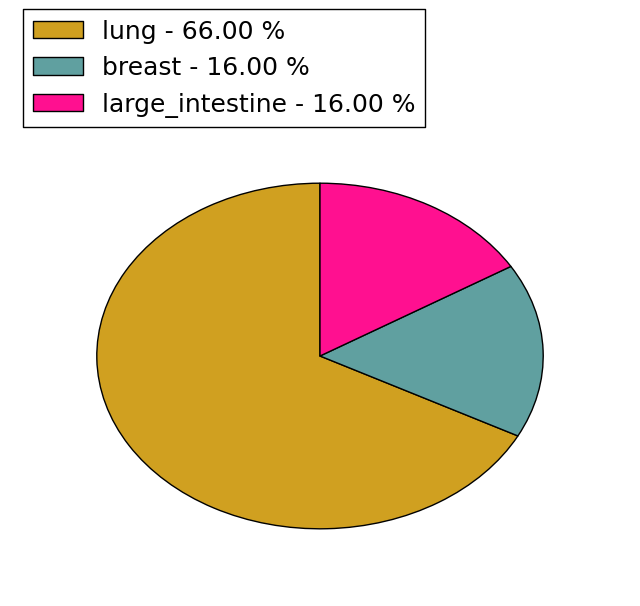
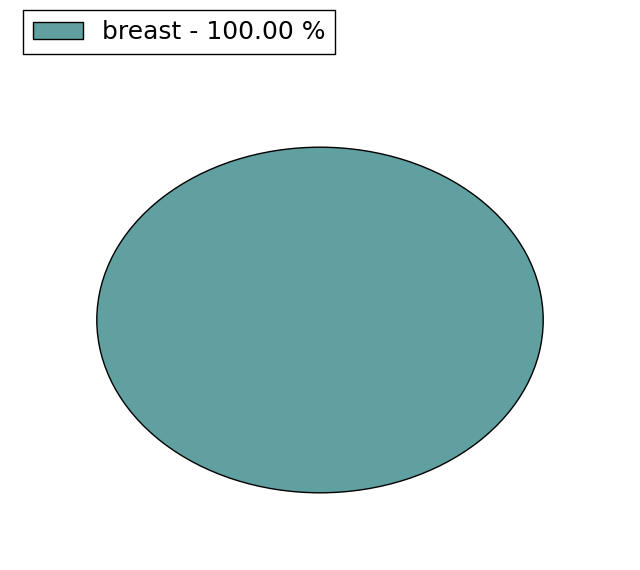
| Mutations for RPL8 |
| * Under tables are showing count per each tissue to give us broad intuition about tissue specific mutation patterns.You can go to the detailed page for each mutation database's web site. |
| There's no structural variation information in COSMIC data for this gene. |
| * From mRNA Sanger sequences, Chitars2.0 arranged chimeric transcripts. This table shows RPL8 related fusion information. |
| ID | Head Gene | Tail Gene | Accession | Gene_a | qStart_a | qEnd_a | Chromosome_a | tStart_a | tEnd_a | Gene_a | qStart_a | qEnd_a | Chromosome_a | tStart_a | tEnd_a |
| BG180082 | RPL8 | 110 | 394 | 8 | 146015154 | 146015830 | LHFPL3 | 386 | 412 | 7 | 104381901 | 104381927 | |
| BQ330581 | DAPK2 | 1 | 179 | 15 | 64241232 | 64241410 | RPL8 | 174 | 300 | 8 | 146015269 | 146015787 | |
| BG924889 | LBH | 86 | 572 | 2 | 30481944 | 30482430 | RPL8 | 569 | 682 | 8 | 146017411 | 146017524 | |
| BP306137 | PRR13 | 1 | 467 | 12 | 53835538 | 53839831 | RPL8 | 468 | 581 | 8 | 146017436 | 146017774 | |
| CV366110 | RPL8 | 25 | 274 | 8 | 146015323 | 146016771 | TM9SF4 | 269 | 535 | 20 | 30729302 | 30729668 | |
| BQ949002 | RPL8 | 10 | 832 | 8 | 146015154 | 146017527 | ACTG1 | 831 | 926 | 17 | 79478270 | 79478365 | |
| BQ681327 | NVL | 1 | 107 | 1 | 224514150 | 224517862 | RPL8 | 107 | 564 | 8 | 146015156 | 146016811 | |
| BC015588 | MTX2 | 27 | 47 | 2 | 177178119 | 177178139 | RPL8 | 45 | 867 | 8 | 146015154 | 146017528 | |
| BF956598 | NRGN | 21 | 164 | 11 | 124616710 | 124616858 | RPL8 | 157 | 335 | 8 | 146016817 | 146017272 | |
| CX752756 | RPL8 | 1 | 618 | 8 | 146015760 | 146017762 | ACIN1 | 618 | 689 | 14 | 23531631 | 23531702 | |
| CV356443 | RPL8 | 18 | 316 | 8 | 146015211 | 146016710 | AZI1 | 313 | 573 | 17 | 79163446 | 79163777 | |
| Top |
| There's no copy number variation information in COSMIC data for this gene. |
| Top |
|
 |
| Top |
| Stat. for Non-Synonymous SNVs (# total SNVs=25) | (# total SNVs=6) |
 |  |
(# total SNVs=0) | (# total SNVs=1) |
 |
| Top |
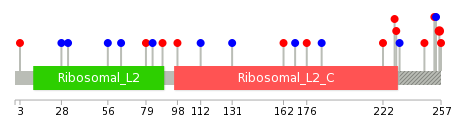
| * When you move the cursor on each content, you can see more deailed mutation information on the Tooltip. Those are primary_site,primary_histology,mutation(aa),pubmedID. |
| GRCh37 position | Mutation(aa) | Unique sampleID count |
| chr8:146016704-146016704 | p.G153S | 12 |
| chr8:146016869-146016869 | p.I98V | 2 |
| chr8:146015195-146015195 | p.E256D | 2 |
| chr8:146017507-146017507 | p.R3H | 1 |
| chr8:146015828-146015828 | p.D176G | 1 |
| chr8:146016888-146016888 | p.? | 1 |
| chr8:146015839-146015839 | p.G172G | 1 |
| chr8:146017171-146017171 | p.Y89Y | 1 |
| chr8:146015848-146015848 | p.V169V | 1 |
| chr8:146017173-146017173 | p.Y89H | 1 |
| Top |
|
 |
| Point Mutation/ Tissue ID | 1 | 2 | 3 | 4 | 5 | 6 | 7 | 8 | 9 | 10 | 11 | 12 | 13 | 14 | 15 | 16 | 17 | 18 | 19 | 20 |
| # sample | 2 | 1 | 1 | 1 | 2 | 6 | 1 | 1 | 3 | 3 | 2 | |||||||||
| # mutation | 2 | 1 | 1 | 1 | 2 | 6 | 1 | 1 | 4 | 4 | 2 | |||||||||
| nonsynonymous SNV | 2 | 1 | 1 | 1 | 3 | 1 | 1 | 2 | 2 | |||||||||||
| synonymous SNV | 1 | 1 | 3 | 4 | 2 |
| cf) Tissue ID; Tissue type (1; BLCA[Bladder Urothelial Carcinoma], 2; BRCA[Breast invasive carcinoma], 3; CESC[Cervical squamous cell carcinoma and endocervical adenocarcinoma], 4; COAD[Colon adenocarcinoma], 5; GBM[Glioblastoma multiforme], 6; Glioma Low Grade, 7; HNSC[Head and Neck squamous cell carcinoma], 8; KICH[Kidney Chromophobe], 9; KIRC[Kidney renal clear cell carcinoma], 10; KIRP[Kidney renal papillary cell carcinoma], 11; LAML[Acute Myeloid Leukemia], 12; LUAD[Lung adenocarcinoma], 13; LUSC[Lung squamous cell carcinoma], 14; OV[Ovarian serous cystadenocarcinoma ], 15; PAAD[Pancreatic adenocarcinoma], 16; PRAD[Prostate adenocarcinoma], 17; SKCM[Skin Cutaneous Melanoma], 18:STAD[Stomach adenocarcinoma], 19:THCA[Thyroid carcinoma], 20:UCEC[Uterine Corpus Endometrial Carcinoma]) |
| Top |
| * We represented just top 10 SNVs. When you move the cursor on each content, you can see more deailed mutation information on the Tooltip. Those are primary_site, primary_histology, mutation(aa), pubmedID. |
| Genomic Position | Mutation(aa) | Unique sampleID count |
| chr8:146015195 | p.E256D,RPL8 | 2 |
| chr8:146017203 | p.V169V,RPL8 | 1 |
| chr8:146015299 | p.N162S,RPL8 | 1 |
| chr8:146017246 | p.G131G,RPL8 | 1 |
| chr8:146015800 | p.I112I,RPL8 | 1 |
| chr8:146017270 | p.I98L,RPL8 | 1 |
| chr8:146015828 | p.N257D,RPL8 | 1 |
| chr8:146017419 | p.Y89H,RPL8 | 1 |
| chr8:146015194 | p.H83H,RPL8 | 1 |
| chr8:146015848 | p.E254E,RPL8 | 1 |
| * Copy number data were extracted from TCGA using R package TCGA-Assembler. The URLs of all public data files on TCGA DCC data server were gathered on Jan-05-2015. Function ProcessCNAData in TCGA-Assembler package was used to obtain gene-level copy number value which is calculated as the average copy number of the genomic region of a gene. |
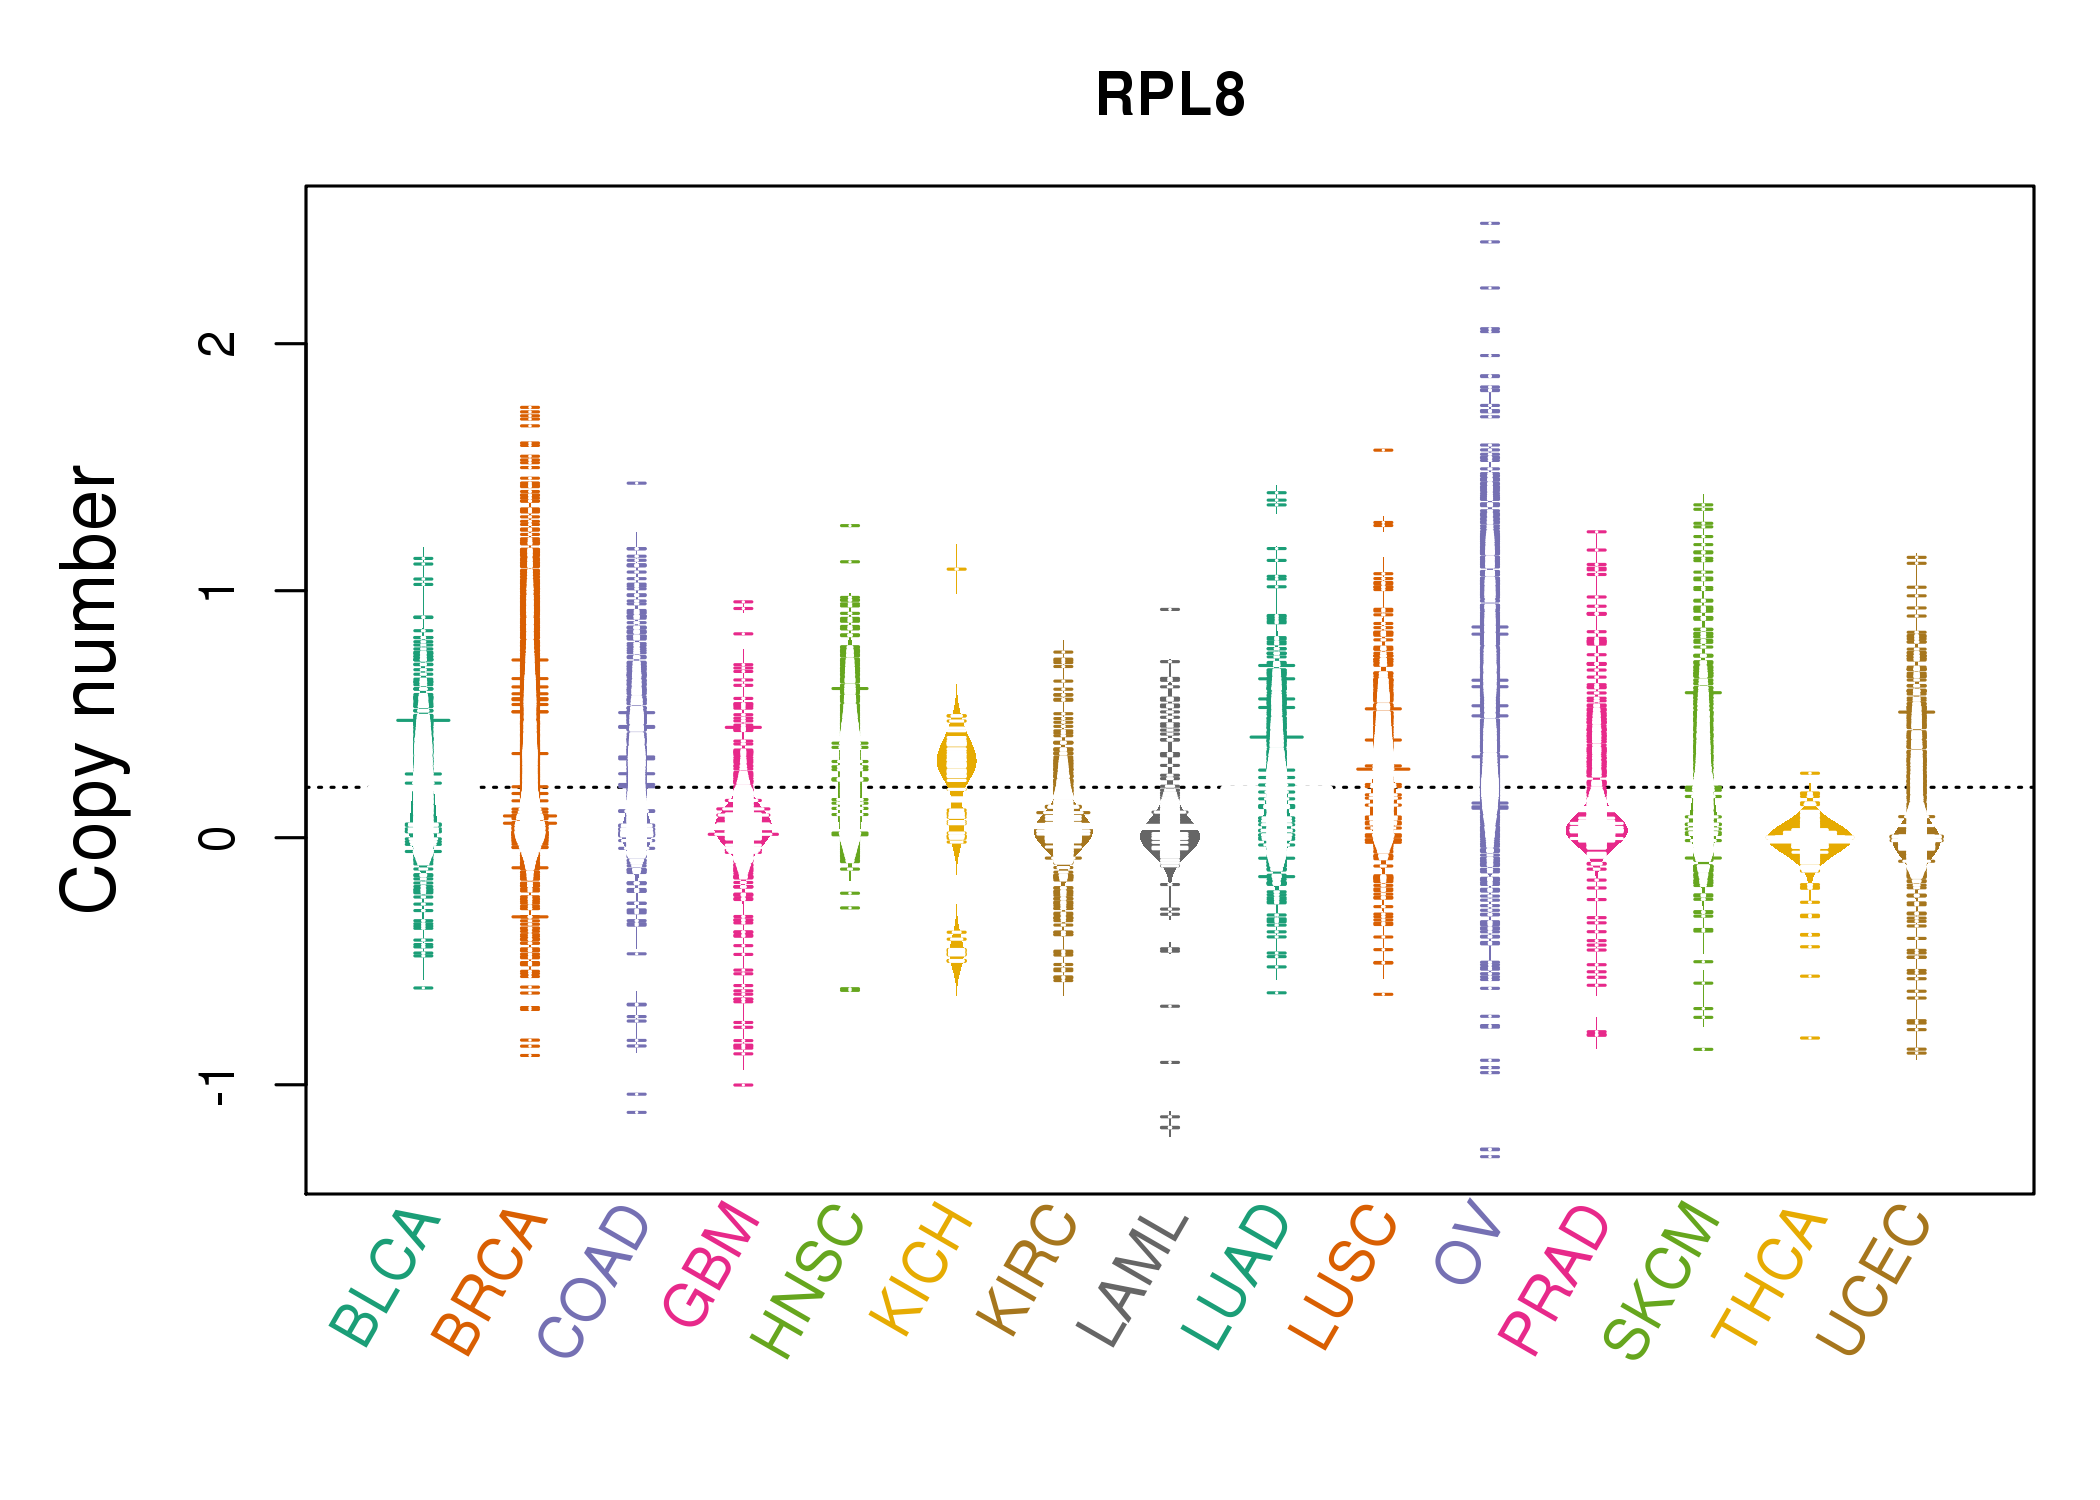 |
| cf) Tissue ID[Tissue type]: BLCA[Bladder Urothelial Carcinoma], BRCA[Breast invasive carcinoma], CESC[Cervical squamous cell carcinoma and endocervical adenocarcinoma], COAD[Colon adenocarcinoma], GBM[Glioblastoma multiforme], Glioma Low Grade, HNSC[Head and Neck squamous cell carcinoma], KICH[Kidney Chromophobe], KIRC[Kidney renal clear cell carcinoma], KIRP[Kidney renal papillary cell carcinoma], LAML[Acute Myeloid Leukemia], LUAD[Lung adenocarcinoma], LUSC[Lung squamous cell carcinoma], OV[Ovarian serous cystadenocarcinoma ], PAAD[Pancreatic adenocarcinoma], PRAD[Prostate adenocarcinoma], SKCM[Skin Cutaneous Melanoma], STAD[Stomach adenocarcinoma], THCA[Thyroid carcinoma], UCEC[Uterine Corpus Endometrial Carcinoma] |
| Top |
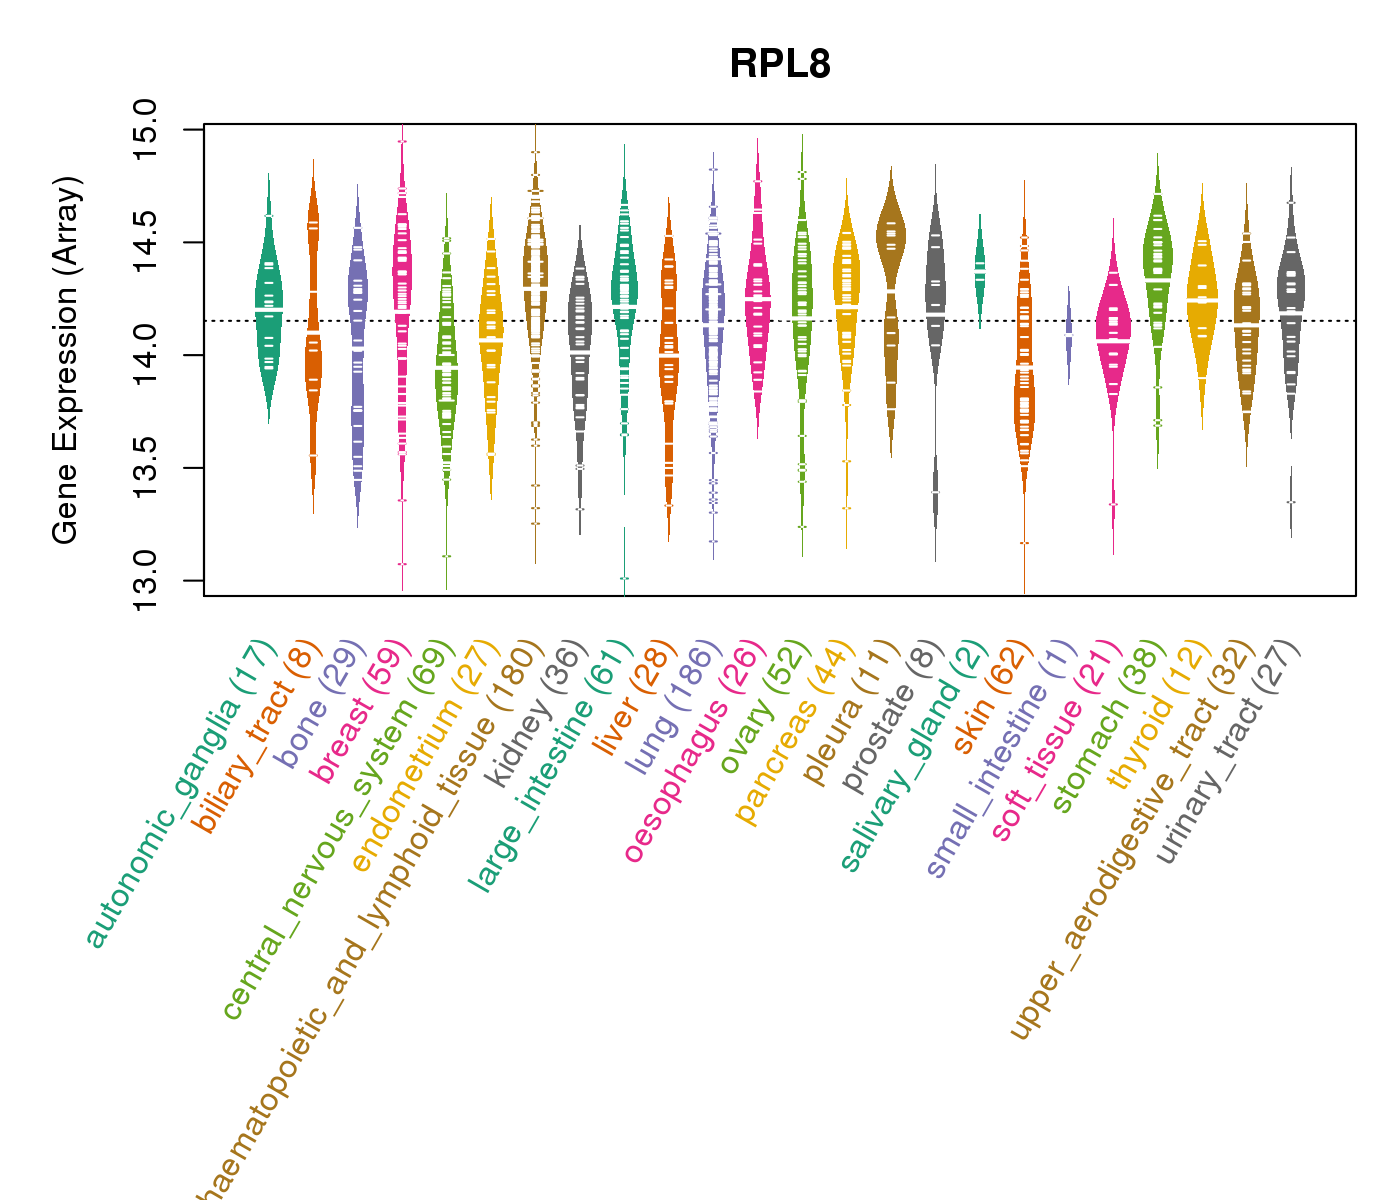
| Gene Expression for RPL8 |
| * CCLE gene expression data were extracted from CCLE_Expression_Entrez_2012-10-18.res: Gene-centric RMA-normalized mRNA expression data. |
 |
| * Normalized gene expression data of RNASeqV2 was extracted from TCGA using R package TCGA-Assembler. The URLs of all public data files on TCGA DCC data server were gathered at Jan-05-2015. Only eight cancer types have enough normal control samples for differential expression analysis. (t test, adjusted p<0.05 (using Benjamini-Hochberg FDR)) |
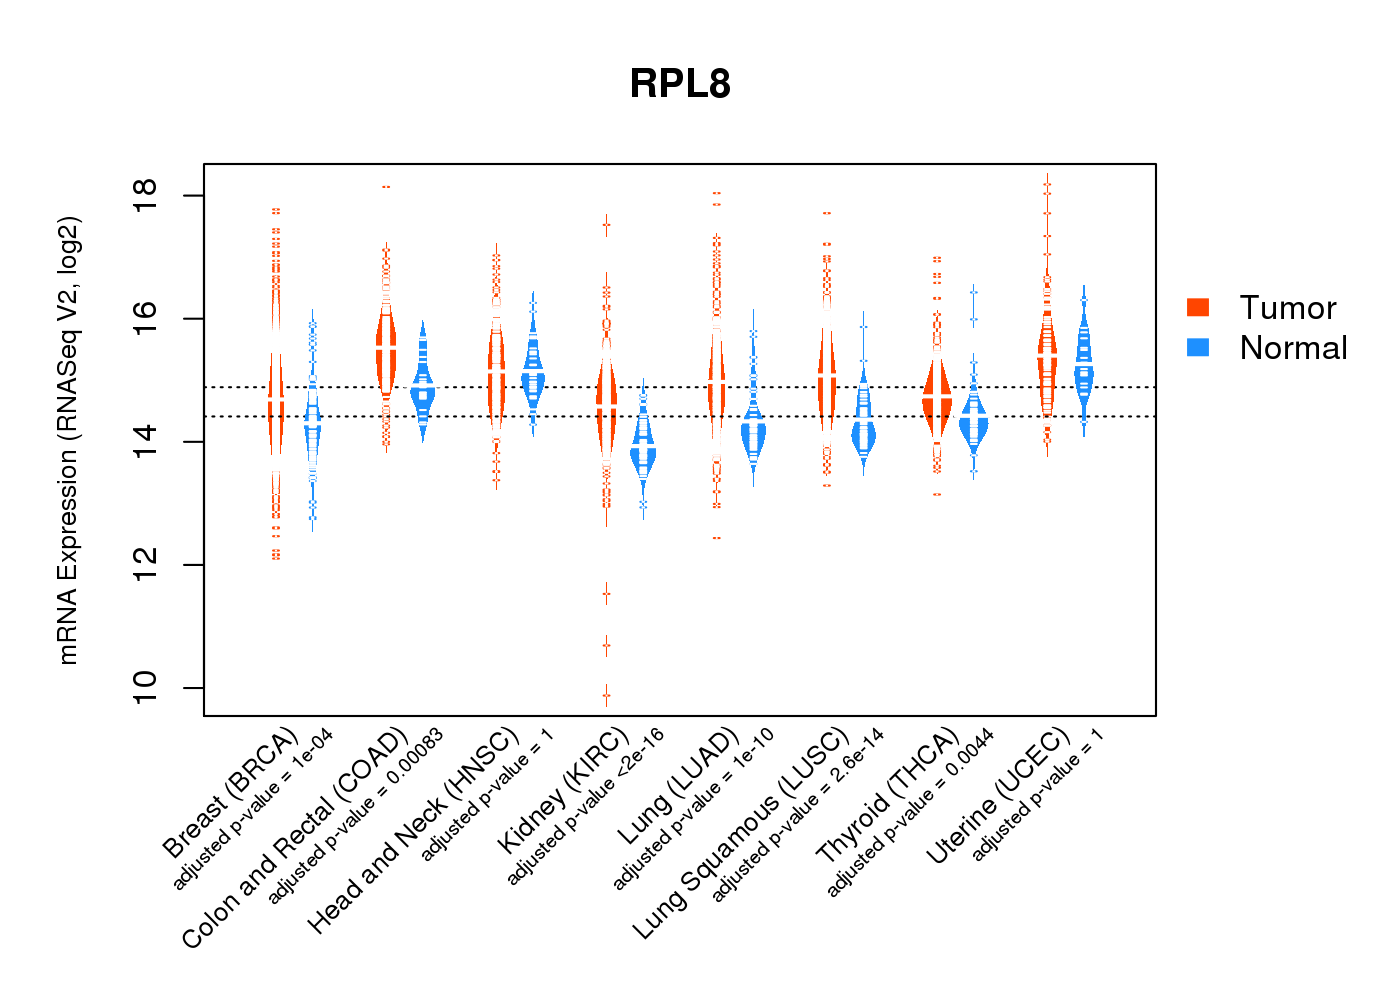 |
| Top |
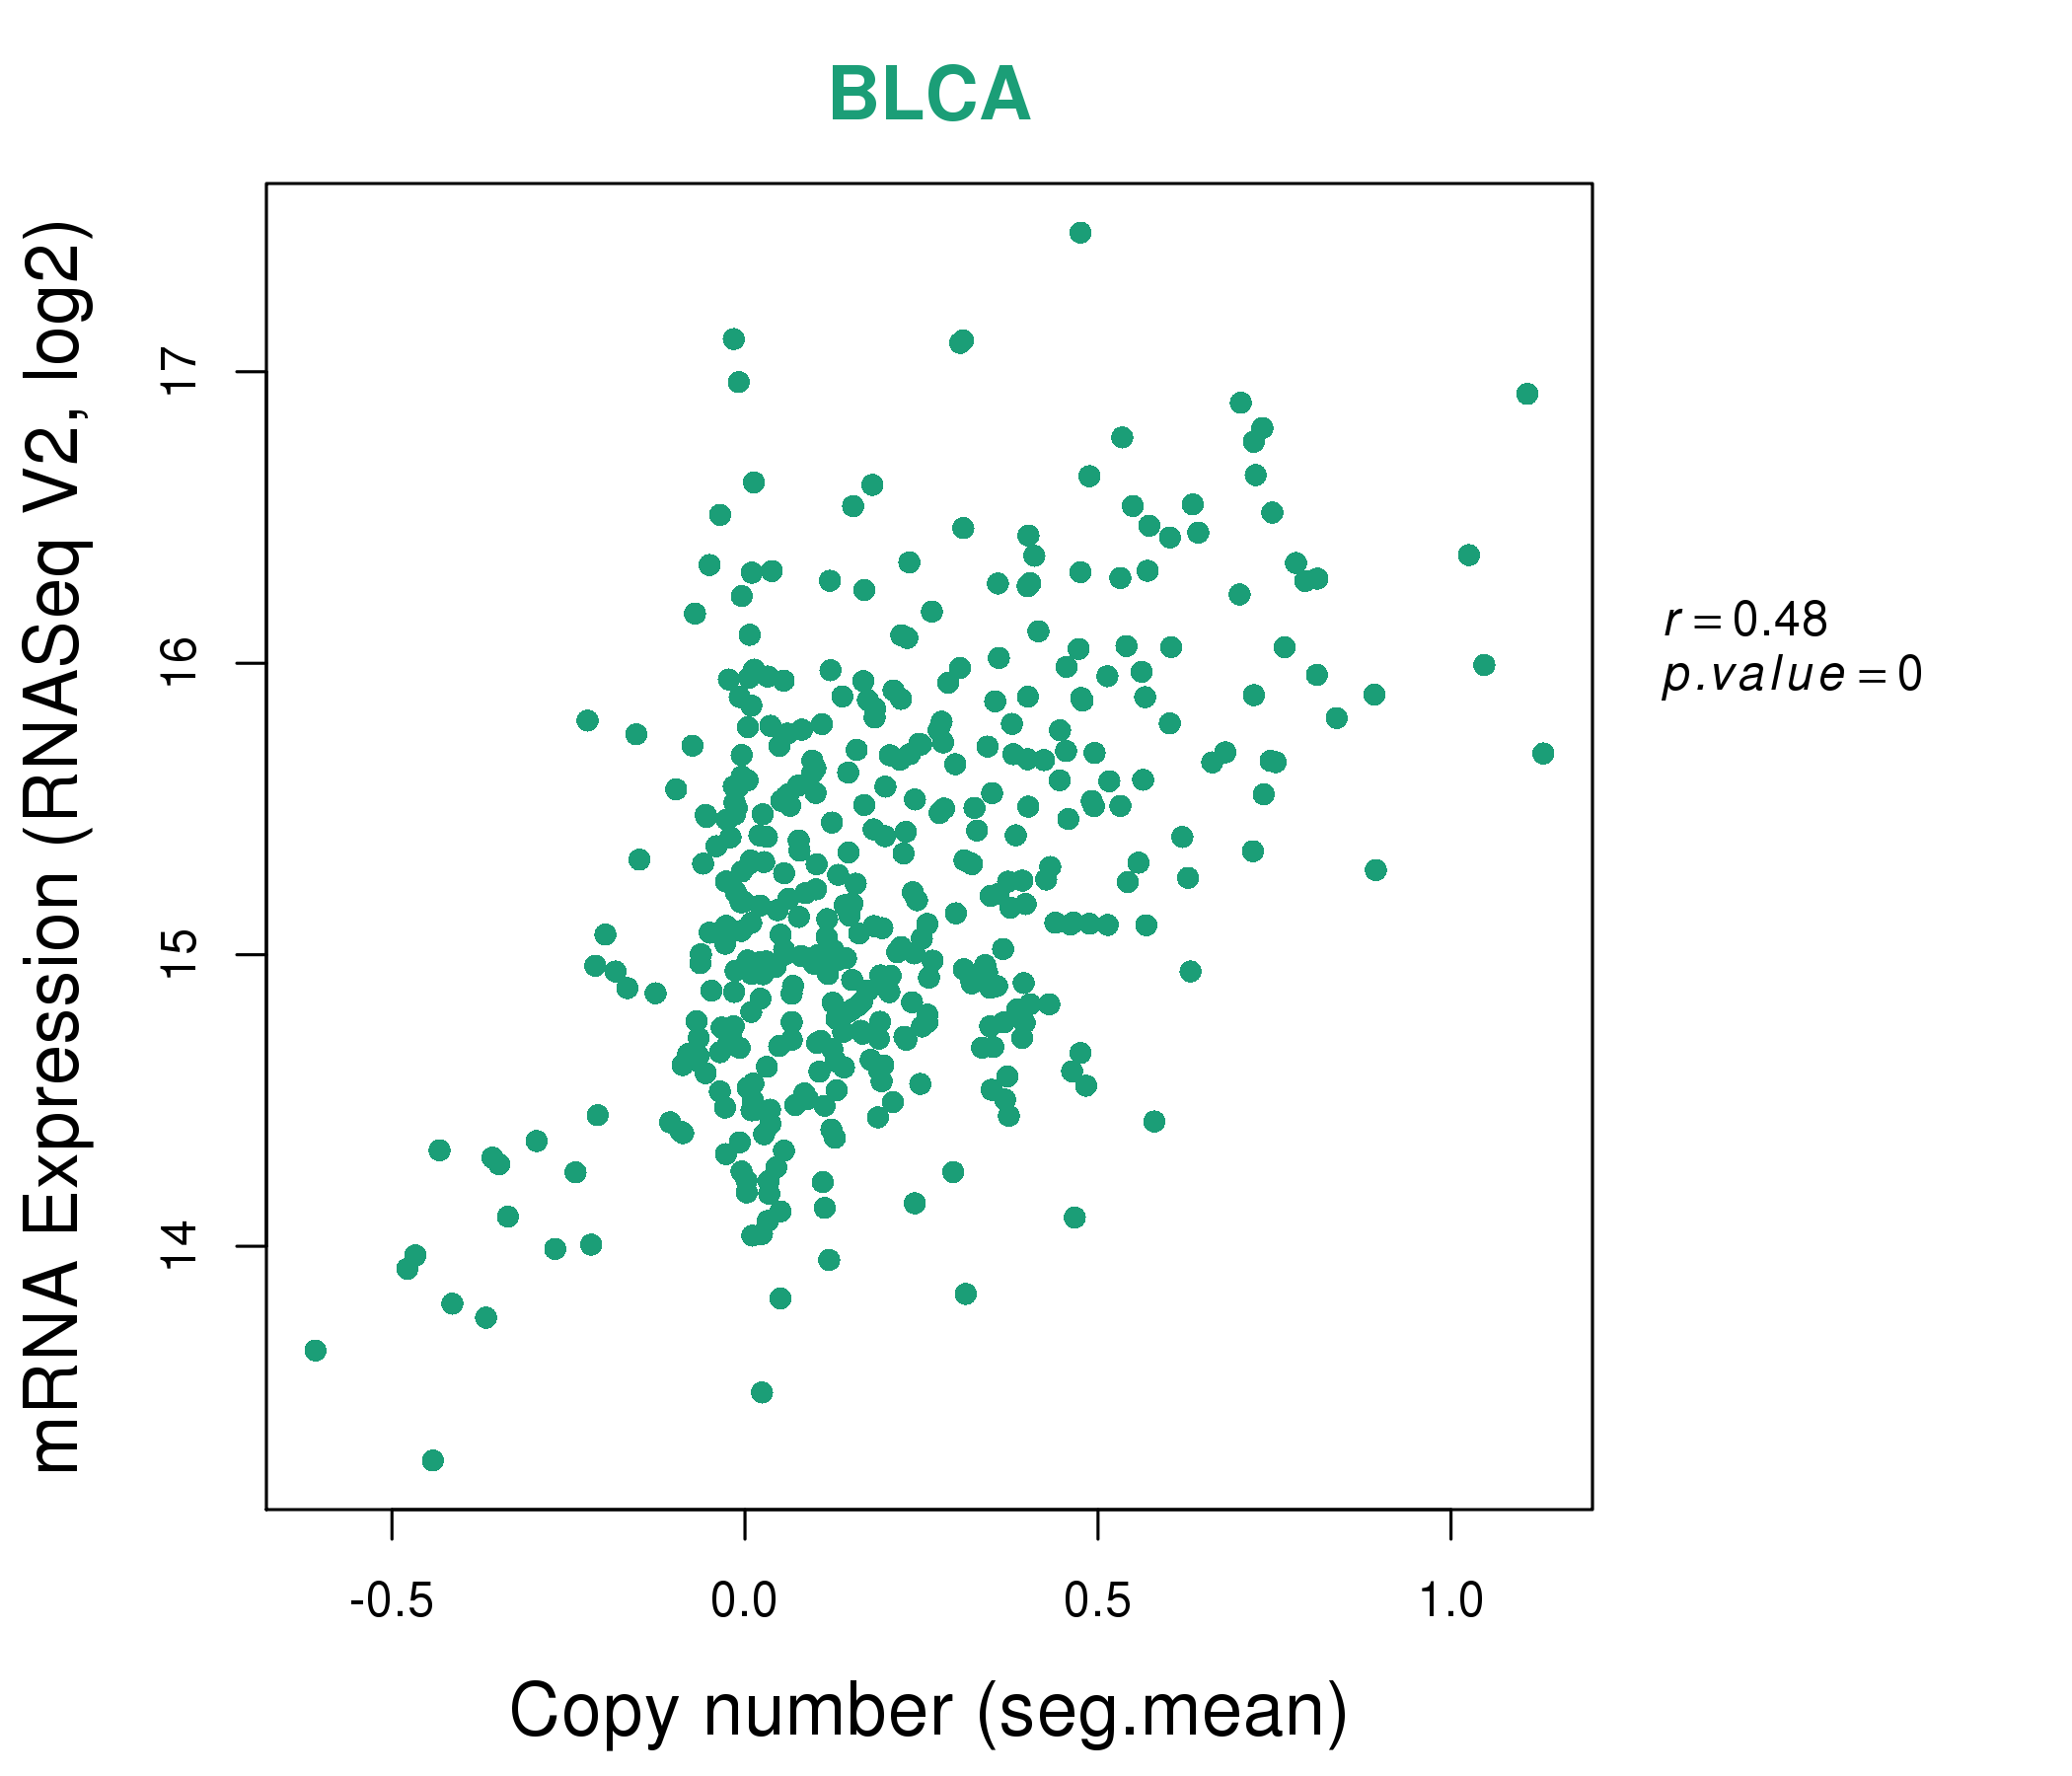
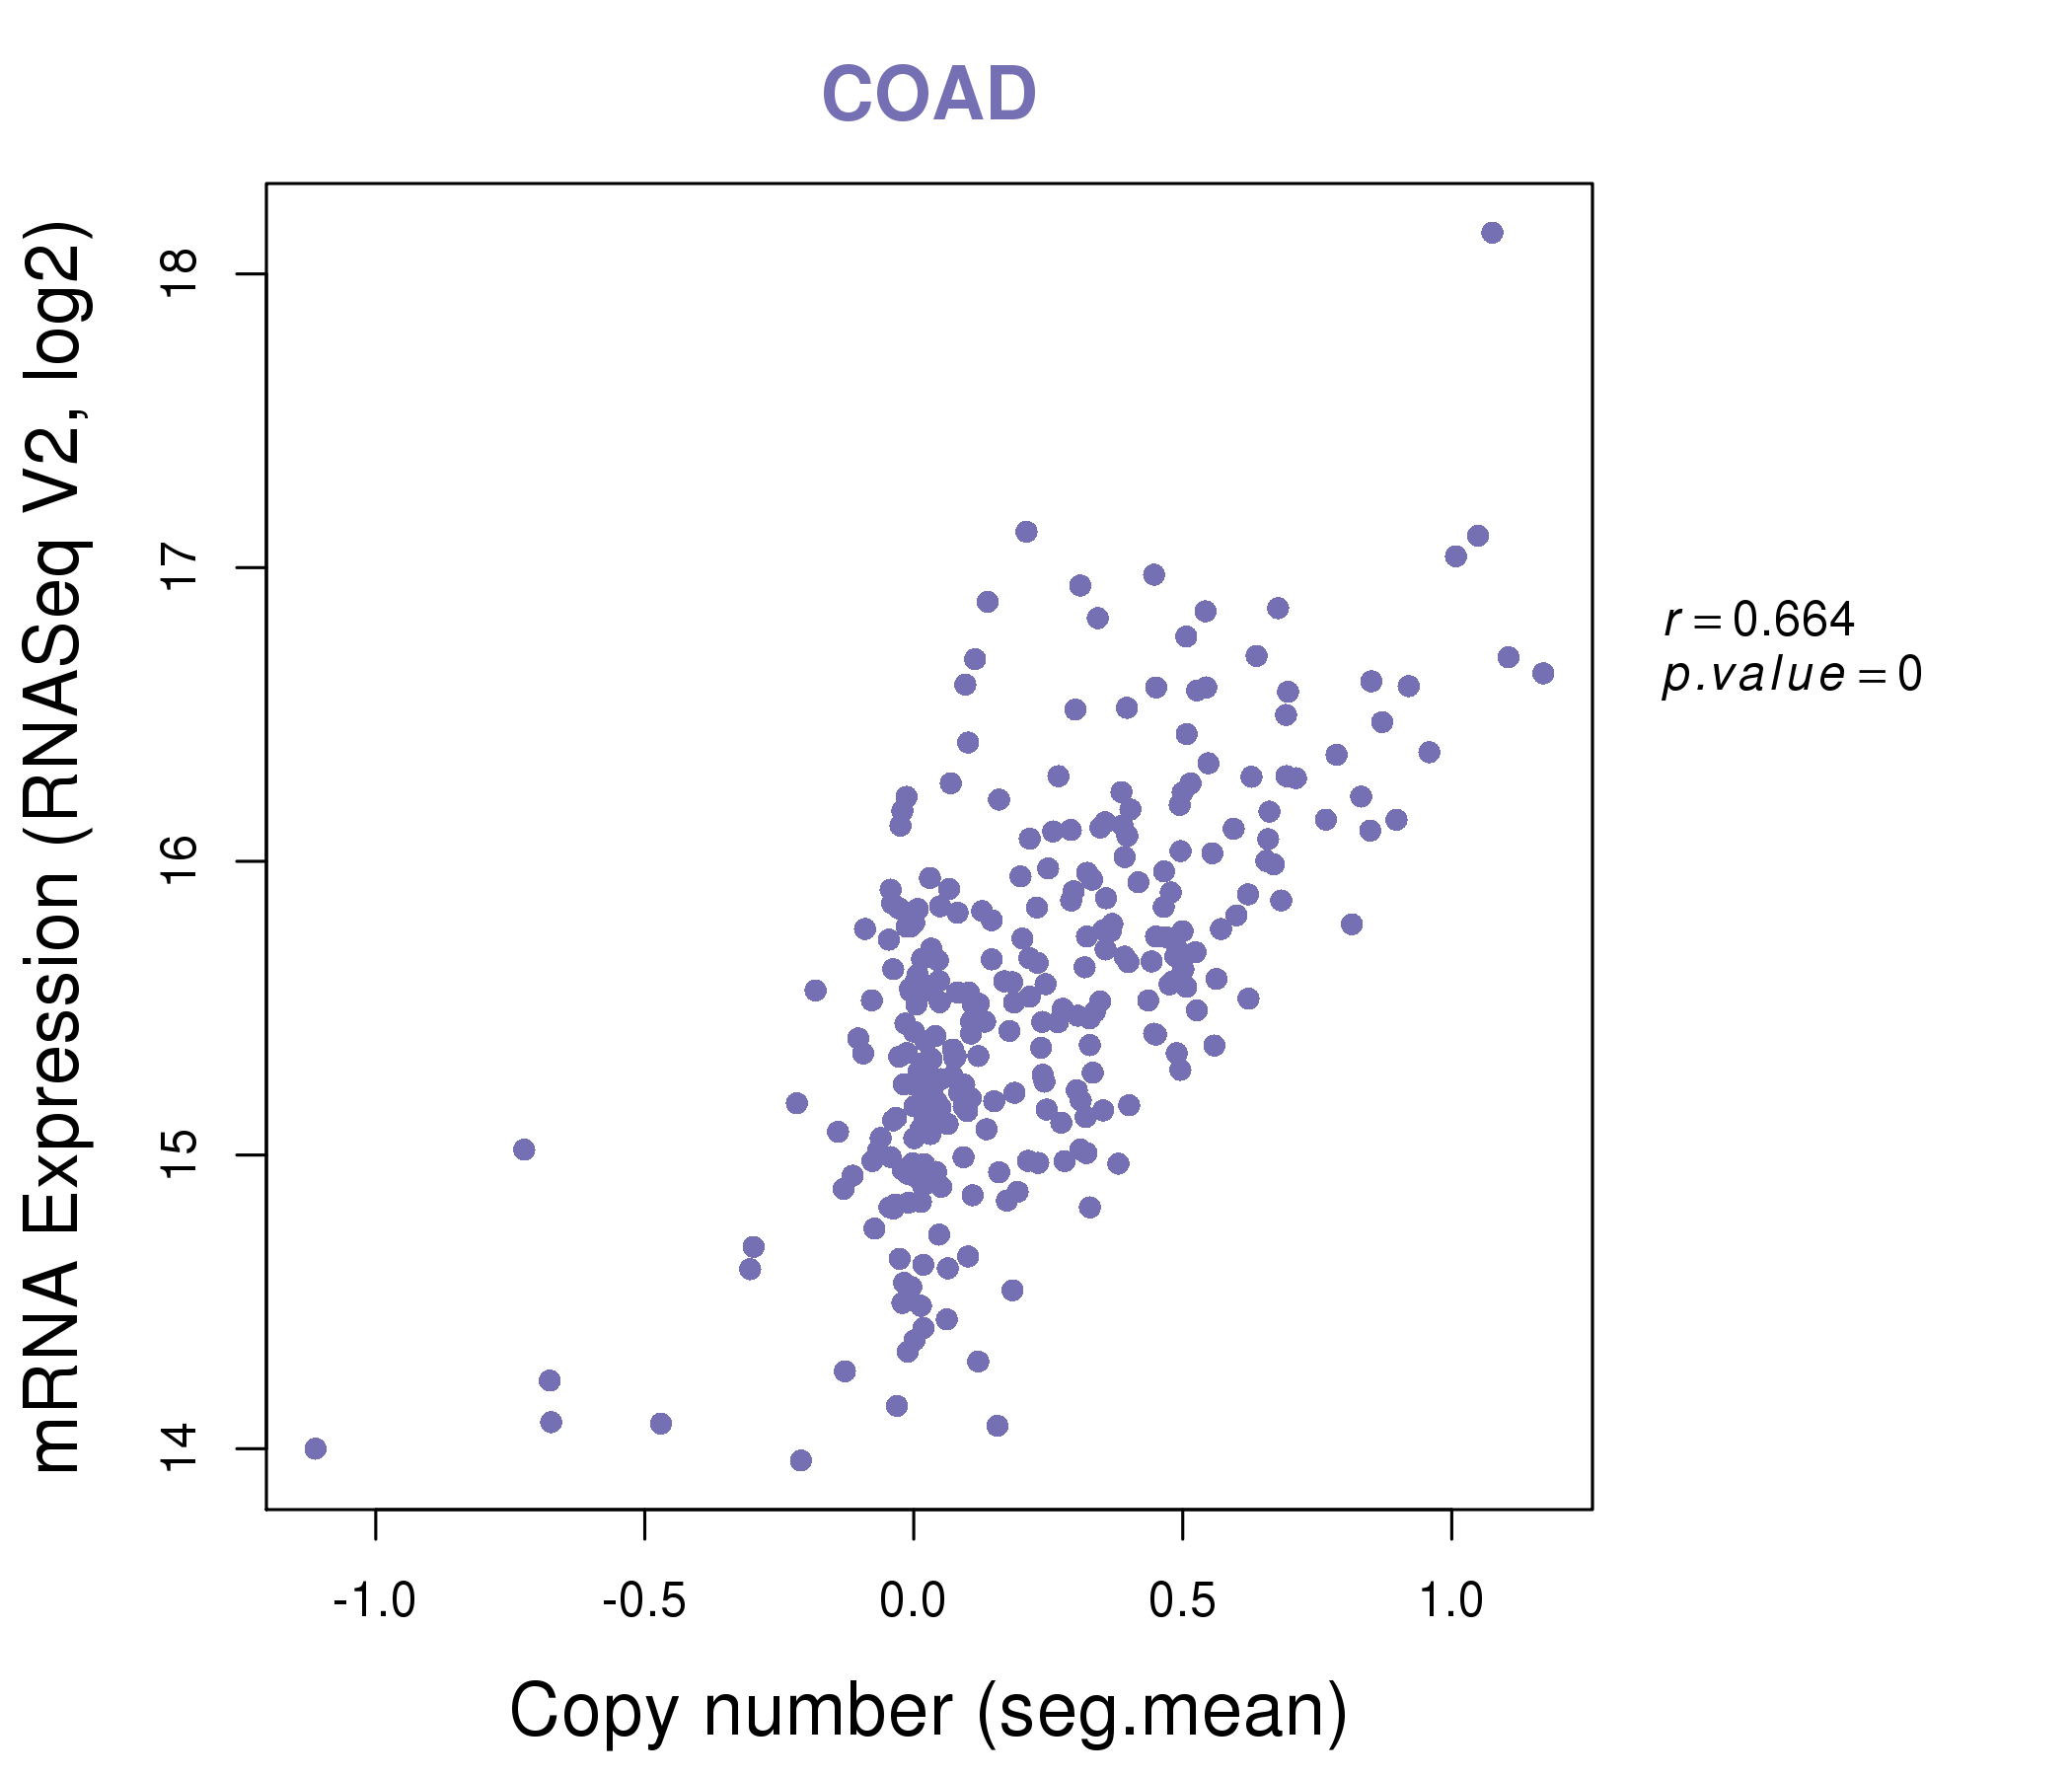
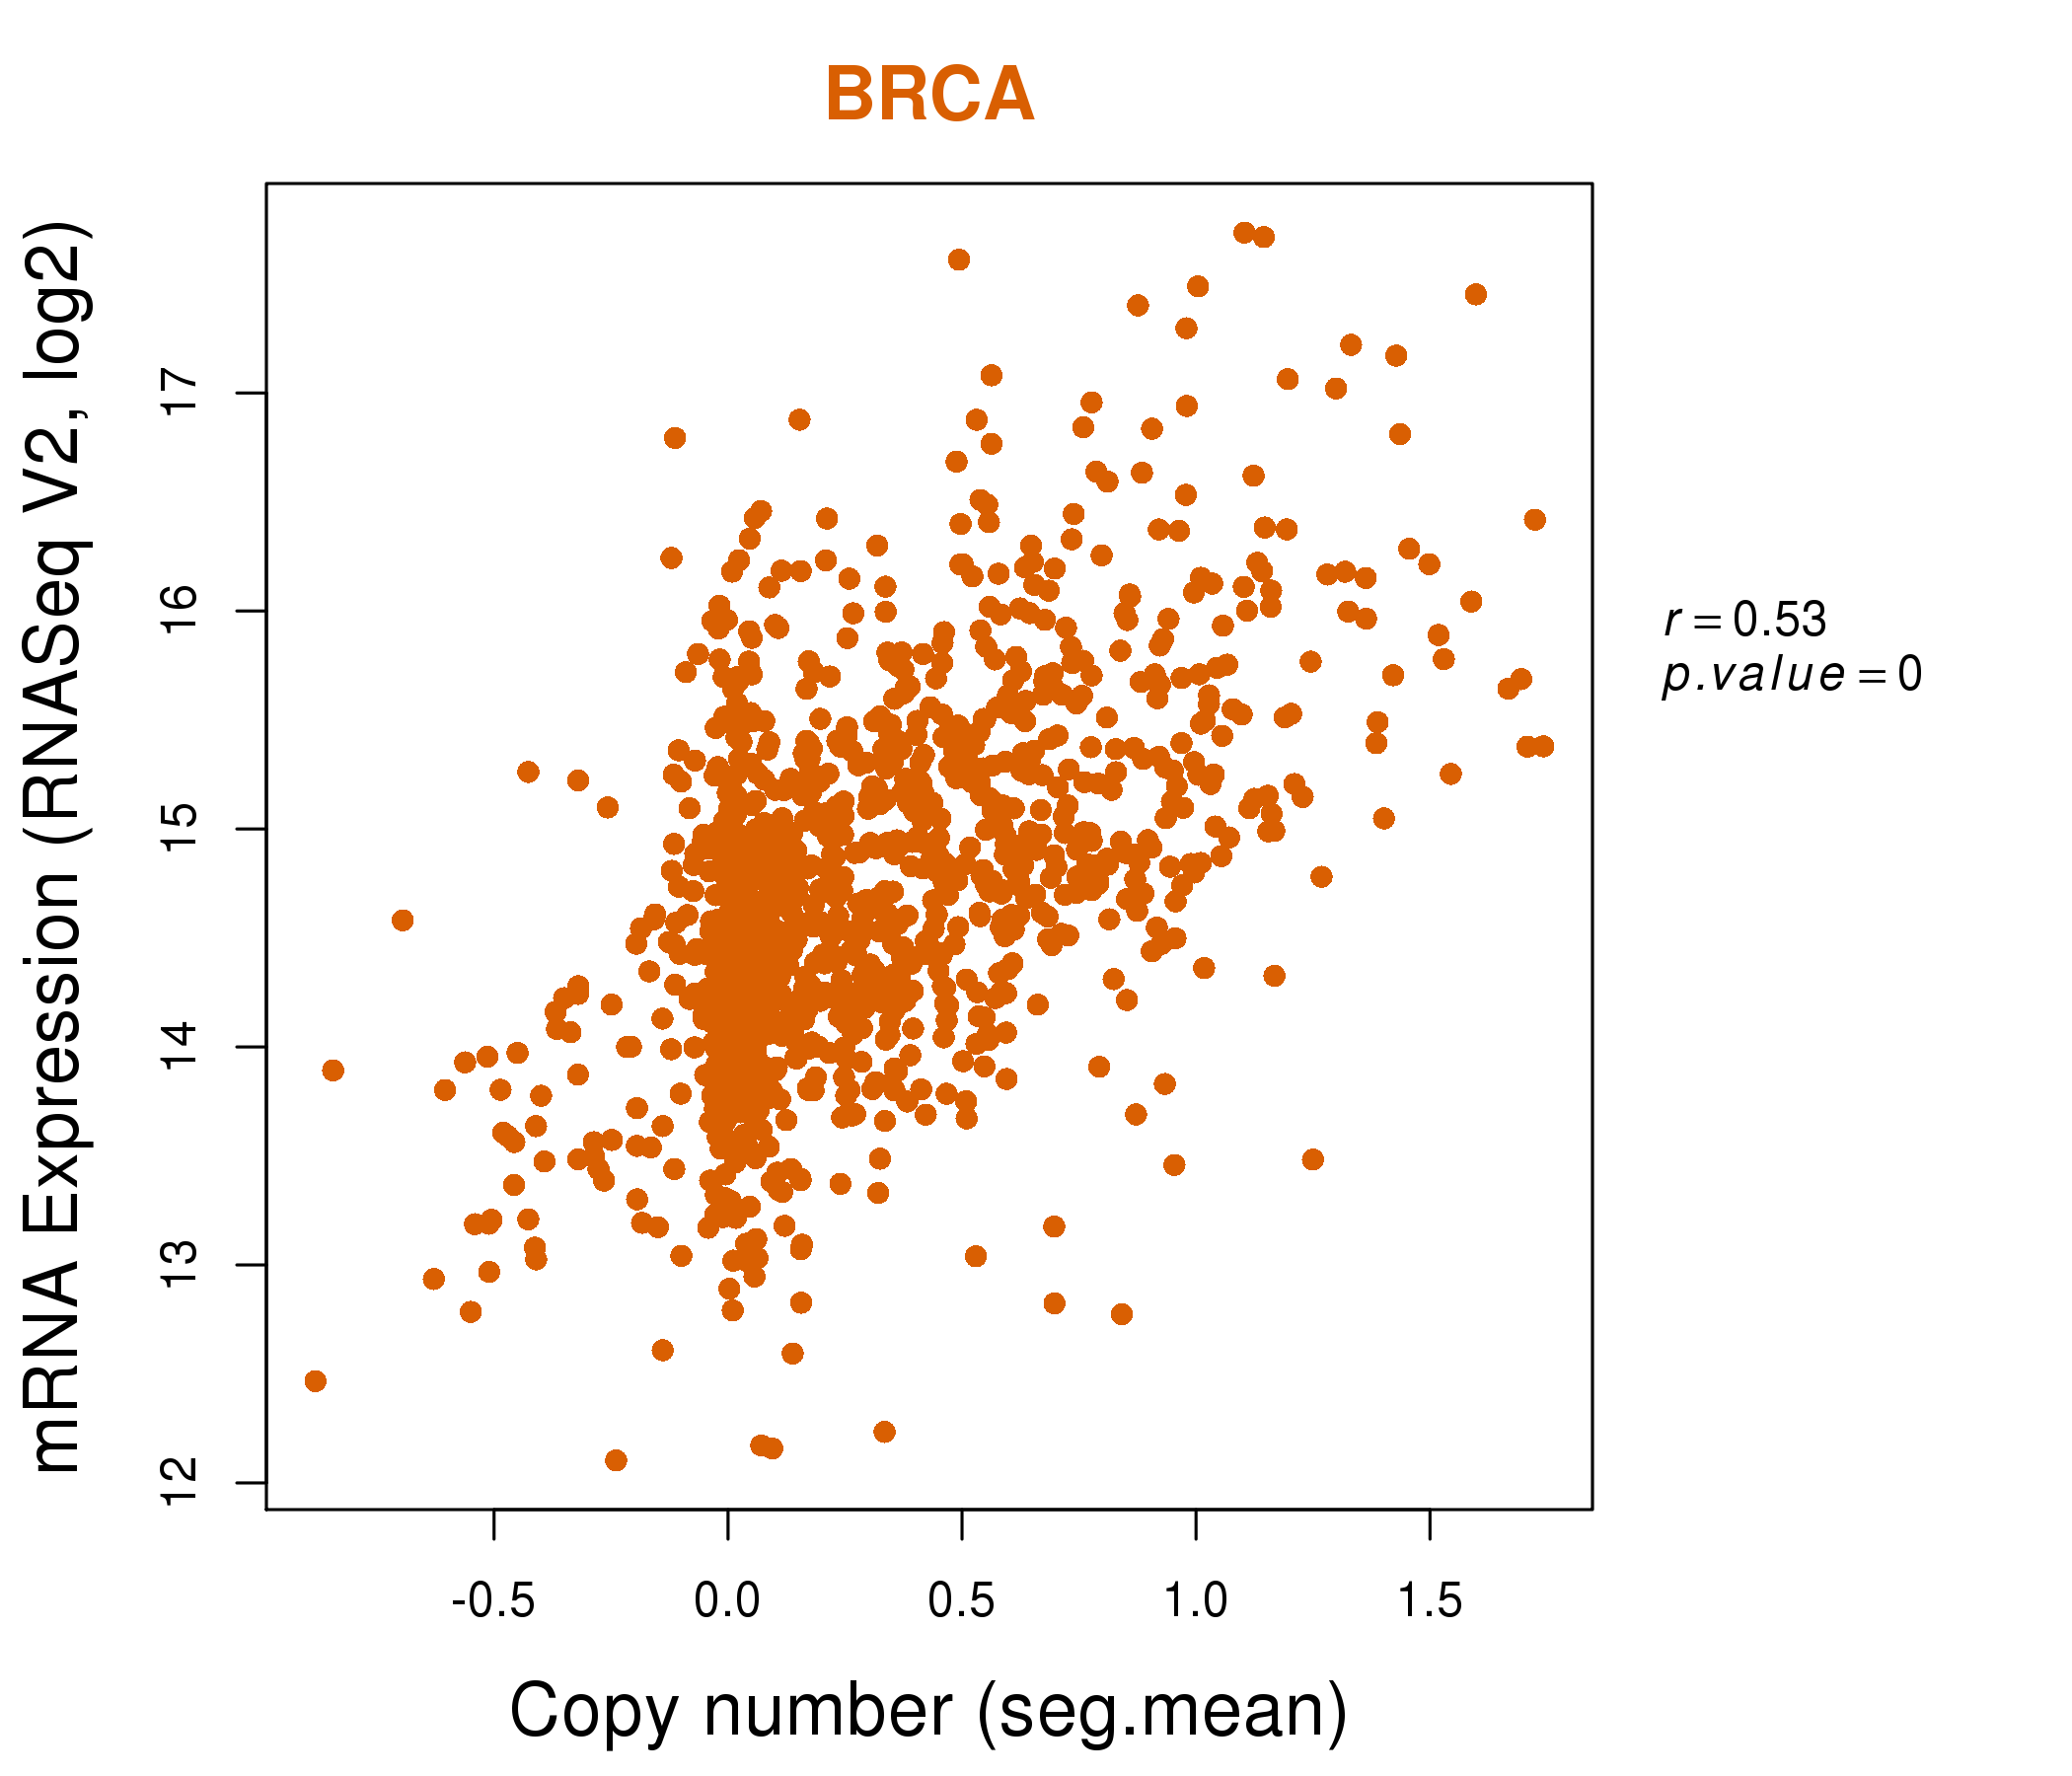
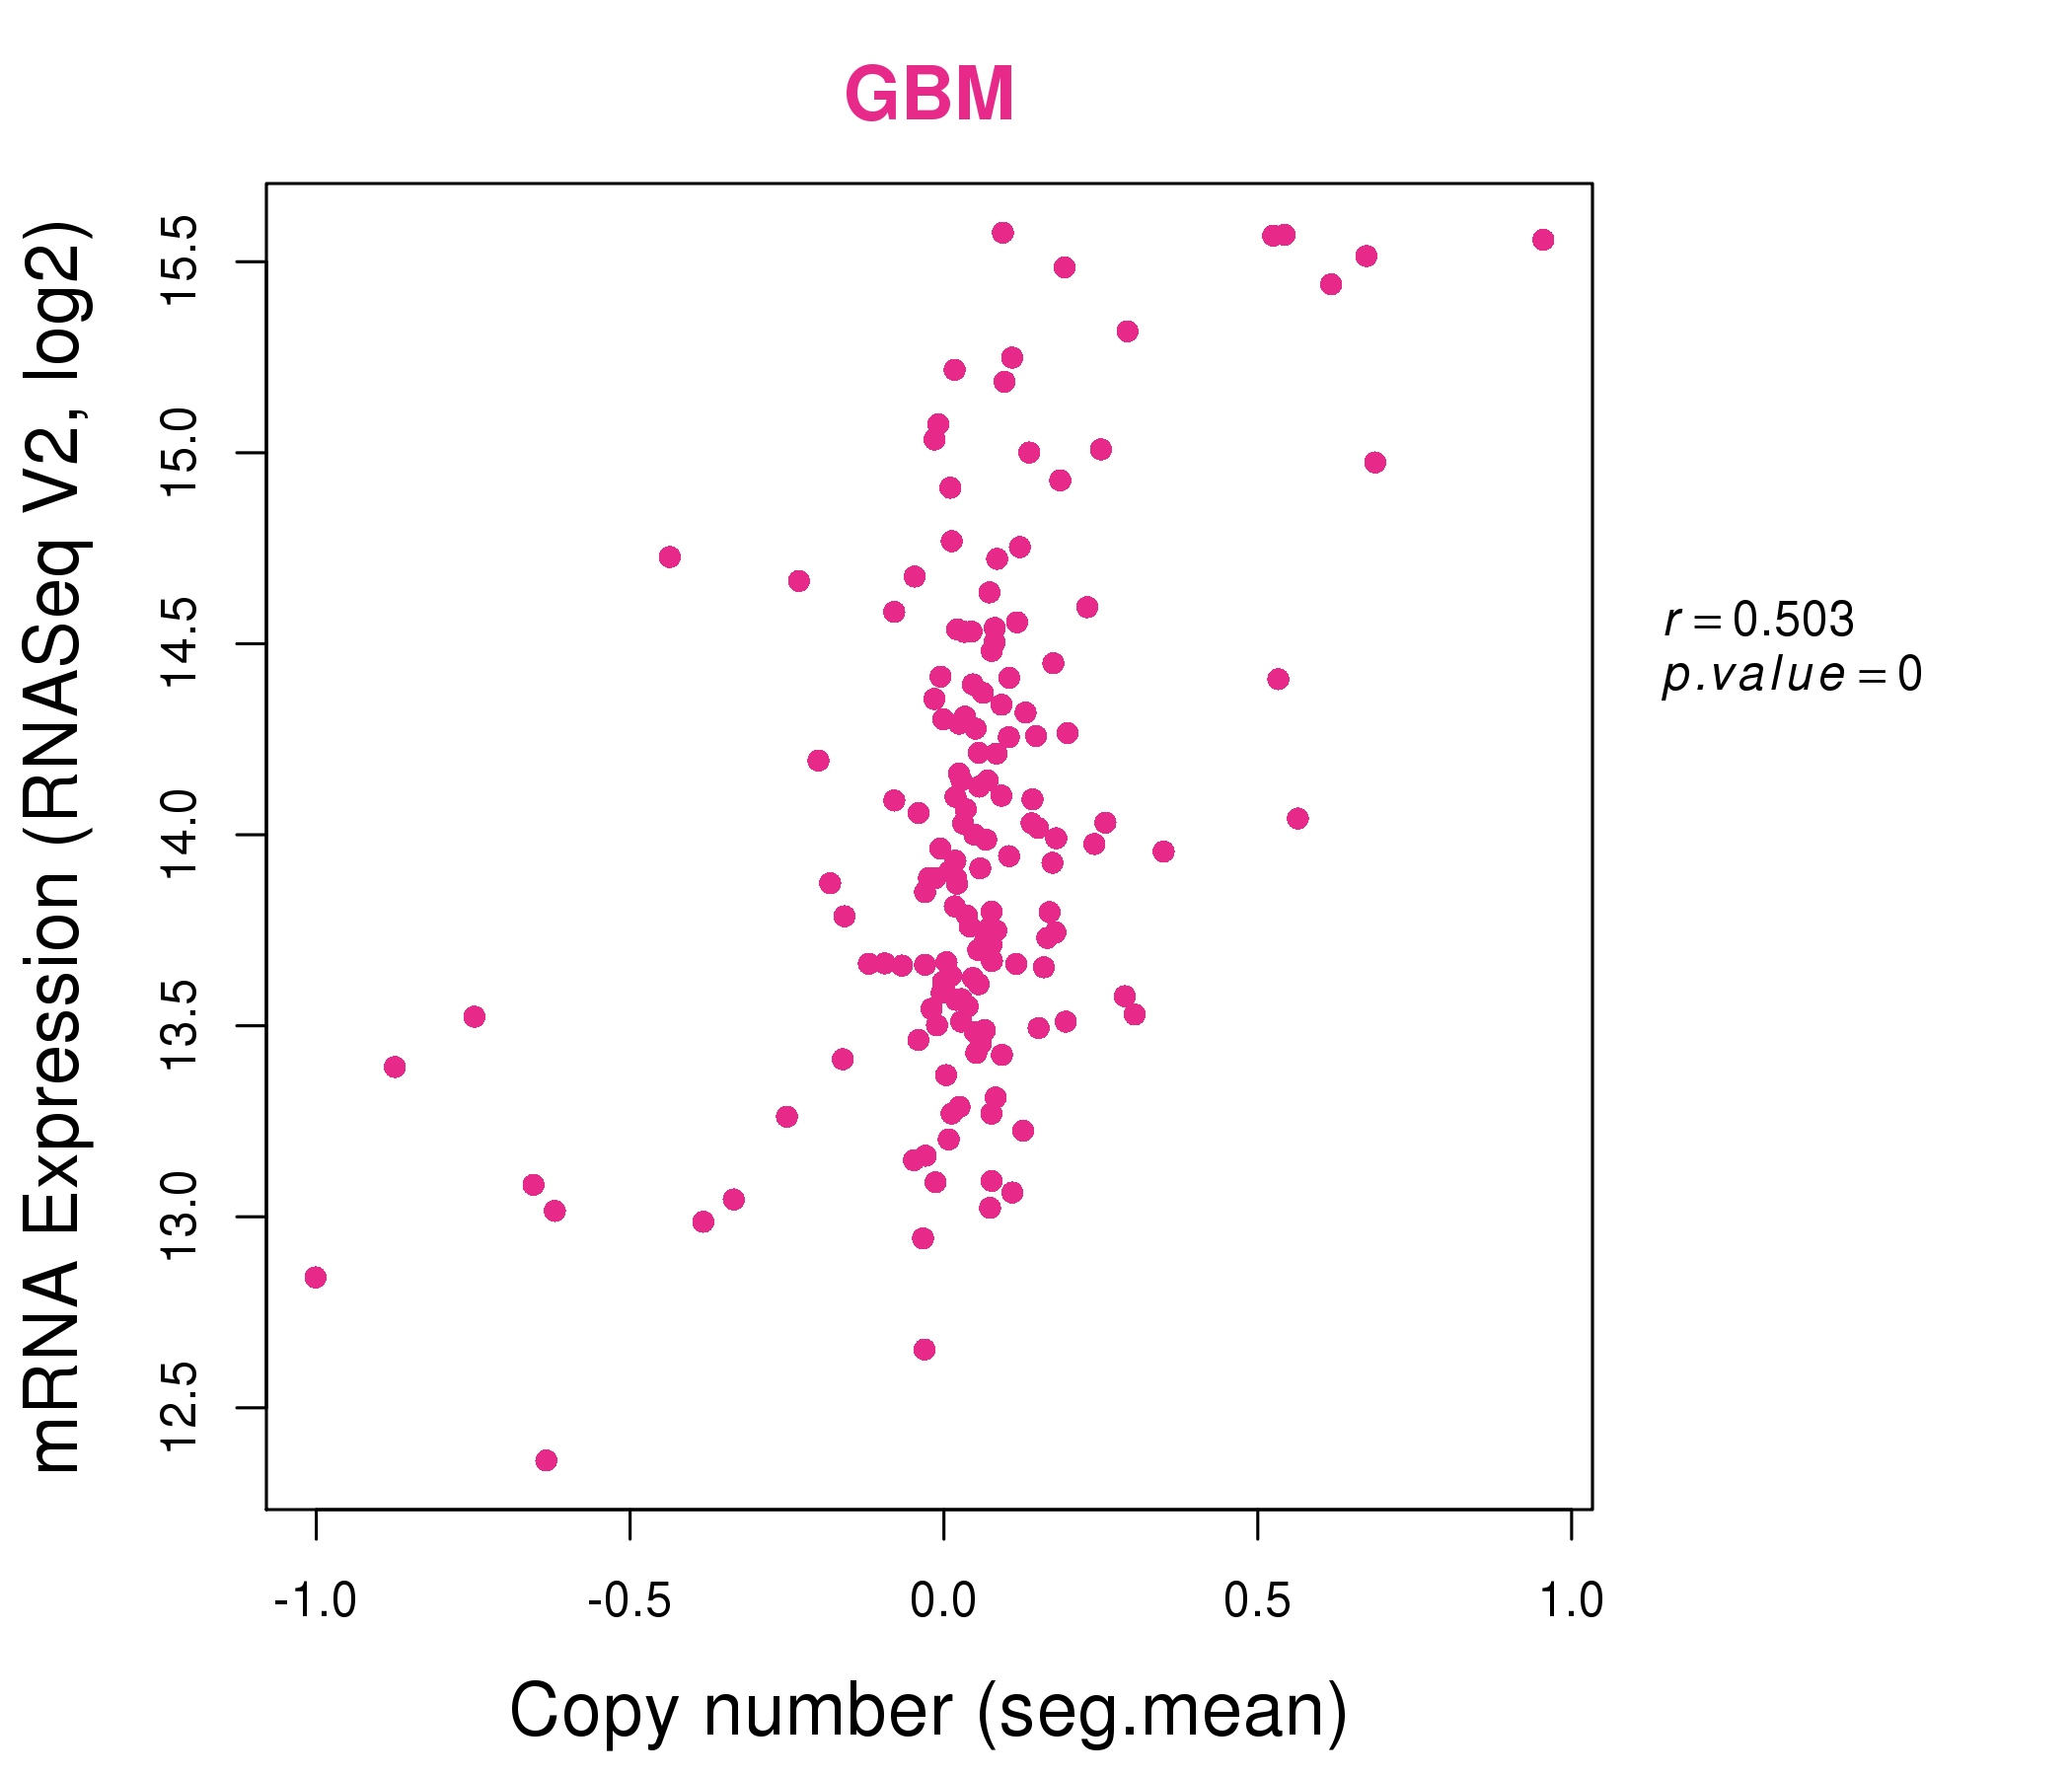
| * This plots show the correlation between CNV and gene expression. |
: Open all plots for all cancer types
 |
|
 |
|
| Top |
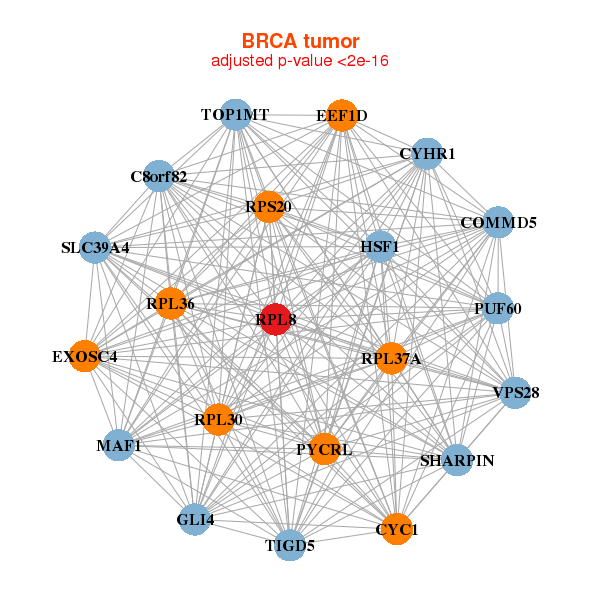
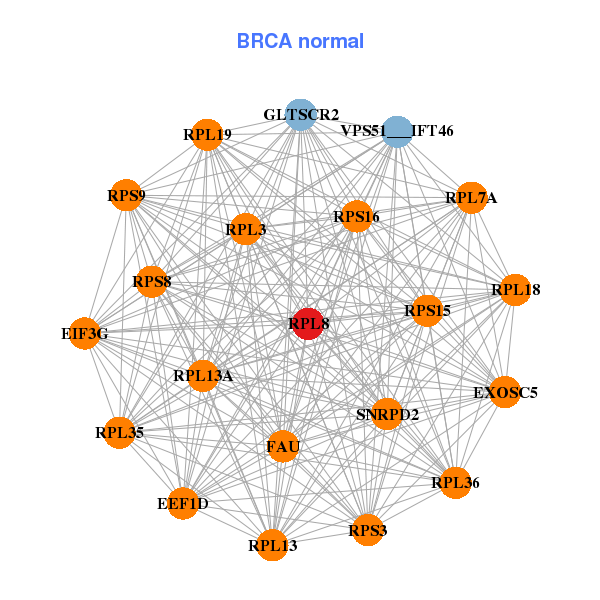
| Gene-Gene Network Information |
| * Co-Expression network figures were drawn using R package igraph. Only the top 20 genes with the highest correlations were shown. Red circle: input gene, orange circle: cell metabolism gene, sky circle: other gene |
: Open all plots for all cancer types
 |
| ||||
| COMMD5,CYC1,CYHR1,EEF1D,EXOSC4,GLI4,HSF1, MAF1,C8orf82,PUF60,PYCRL,RPL30,RPL36,RPL37A, RPL8,RPS20,SHARPIN,SLC39A4,TIGD5,TOP1MT,VPS28 | VPS51___IFT46,EEF1D,EIF3G,EXOSC5,FAU,GLTSCR2,RPL13, RPL13A,RPL18,RPL19,RPL35,RPL3,RPL36,RPL7A, RPL8,RPS15,RPS16,RPS3,RPS8,RPS9,SNRPD2 | ||||
 |
| ||||
| NDUFAF6,C8orf59,COMMD5,COPS5,CYC1,EEF1D,EIF3E, EIF3H,MAF1,MED30,MRPS28,NDUFB9,PUF60,RPL30, RPL35,RPL8,RPS20,TATDN1,WDYHV1,ZFAND1,ZNF16 | PHB2,RPL18,RPL18A,RPL19,RPL29,RPL32,RPL35, RPL7A,RPL8,RPLP0,RPLP1,RPS10,RPS11,RPS14, RPS21,RPS3,RPS5,RPS6,RPS8,RPS9,RPSAP58 |

| * Co-Expression network figures were drawn using R package igraph. Only the top 20 genes with the highest correlations were shown. Red circle: input gene, orange circle: cell metabolism gene, sky circle: other gene |
: Open all plots for all cancer types
| Top |
: Open all interacting genes' information including KEGG pathway for all interacting genes from DAVID
| Top |
| Pharmacological Information for RPL8 |
| DB Category | DB Name | DB's ID and Url link |
| * Gene Centered Interaction Network. |
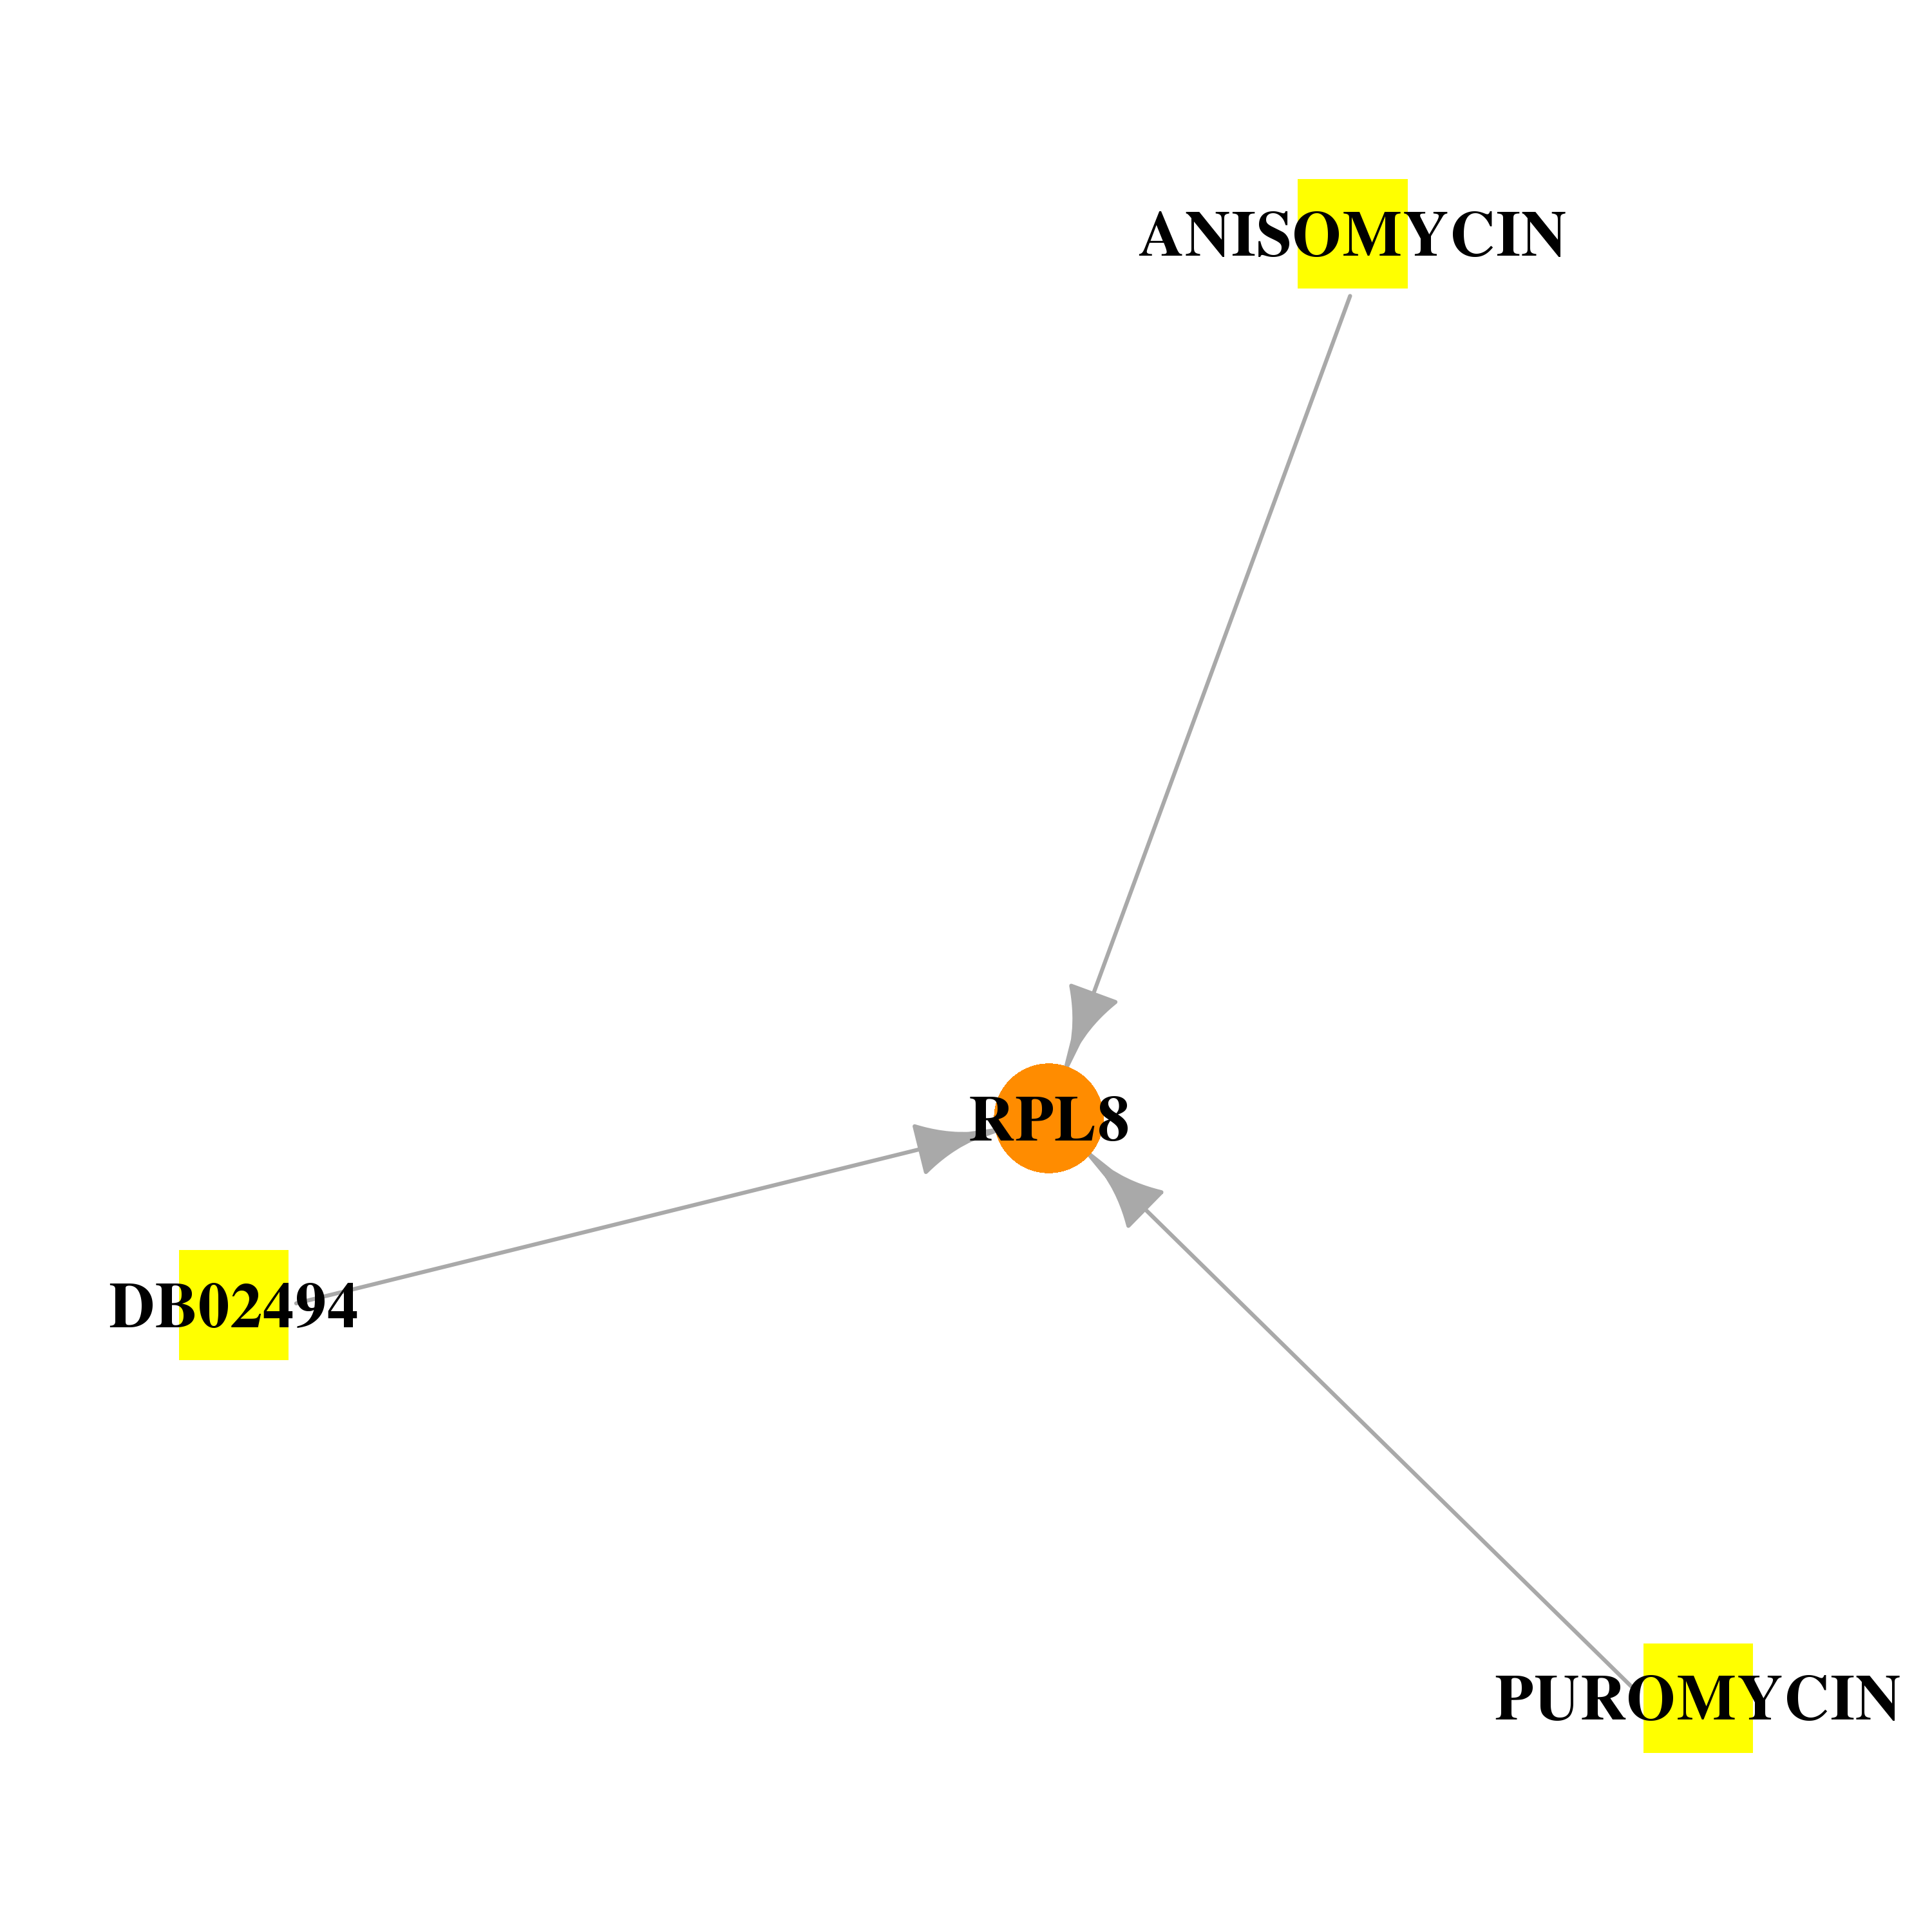 |
| * Drug Centered Interaction Network. |
| DrugBank ID | Target Name | Drug Groups | Generic Name | Drug Centered Network | Drug Structure |
| DB02494 | ribosomal protein L8 | experimental | Alpha-Hydroxy-Beta-Phenyl-Propionic Acid | 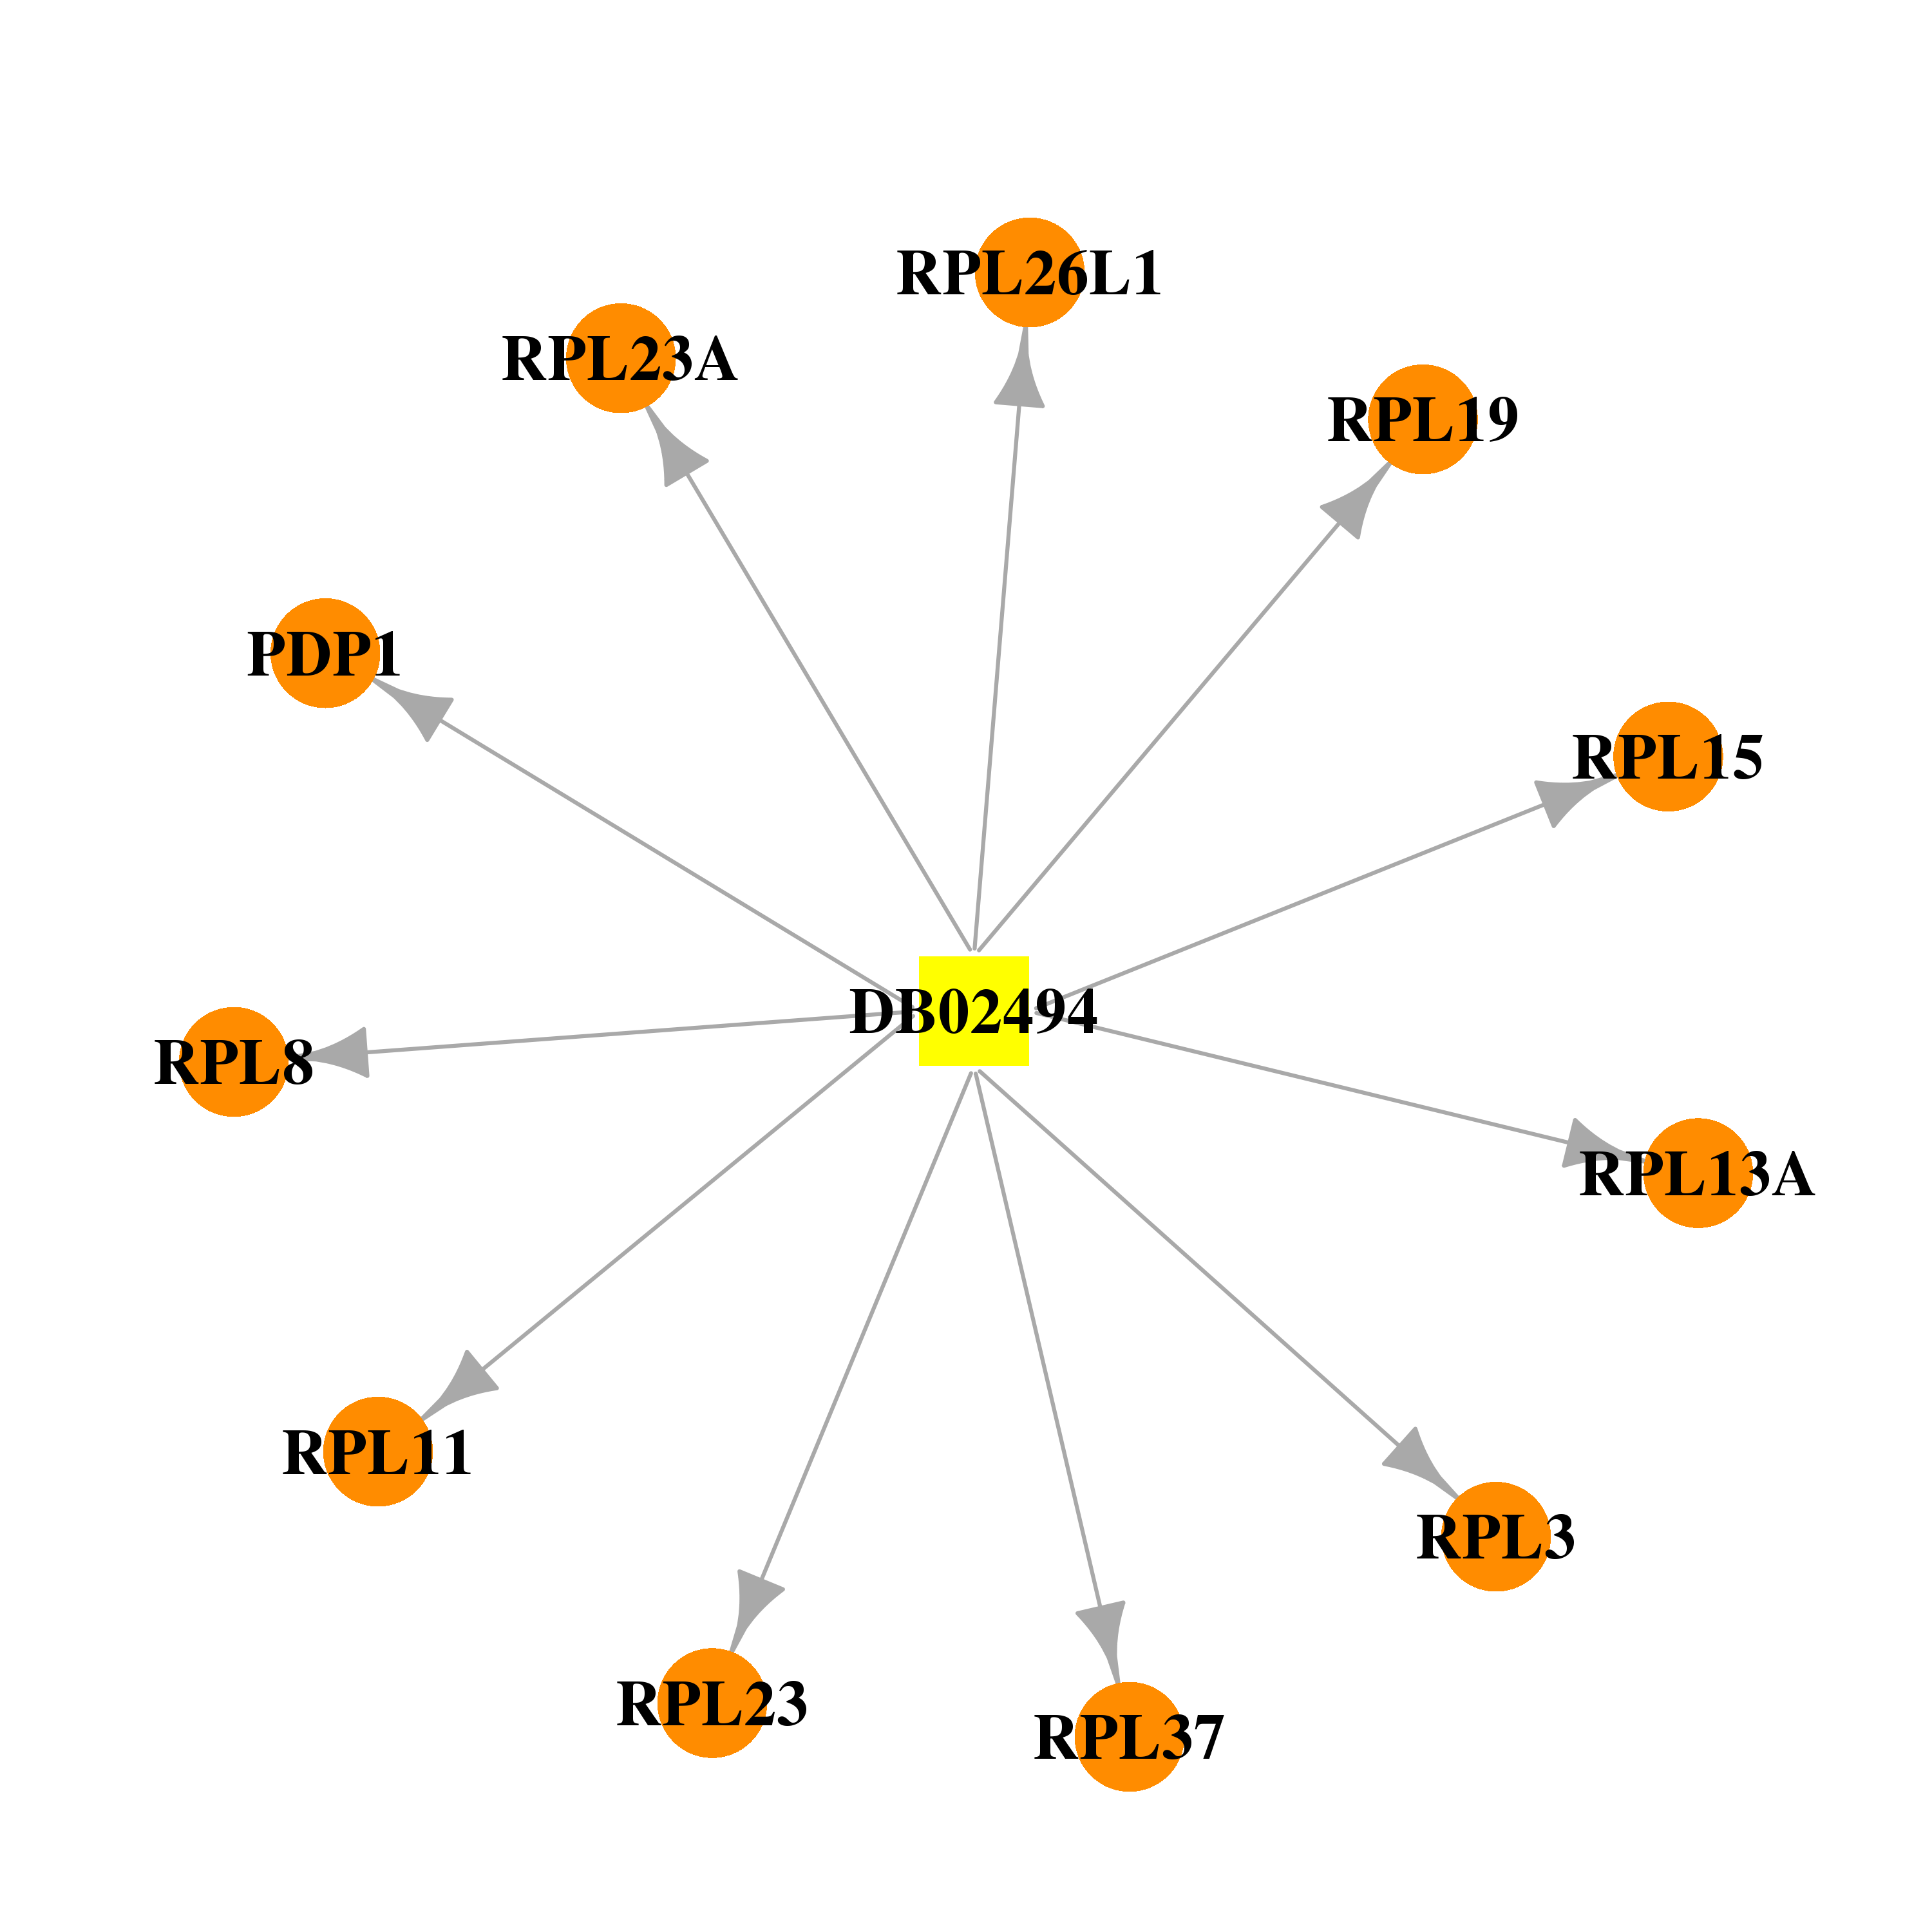 |  |
| DB07374 | ribosomal protein L8 | experimental | ANISOMYCIN |  |  |
| DB08437 | ribosomal protein L8 | experimental | PUROMYCIN |  |  |
| Top |
| Cross referenced IDs for RPL8 |
| * We obtained these cross-references from Uniprot database. It covers 150 different DBs, 18 categories. http://www.uniprot.org/help/cross_references_section |
: Open all cross reference information
|
Copyright © 2016-Present - The Univsersity of Texas Health Science Center at Houston @ |