|
||||||||||||||||||||||||||||||||||||||||||||||||||||||||||||||||||||||||||||||||||||||||||||||||||||||||||||||||||||||||||||||||||||||||||||||||||||||||||||||||||||||||||||||||||||||||||||||||||||||||||||||||||||||||||||||||||||||||||||||||||||||||||||||||||||||||||||||||||||||||||||||||||||||||||||||||||||||||||
| |
| Phenotypic Information (metabolism pathway, cancer, disease, phenome) |
| |
| |
| Gene-Gene Network Information: Co-Expression Network, Interacting Genes & KEGG |
| |
|


| Gene Summary for RPL9 |
| Basic gene info. | Gene symbol | RPL9 |
| Gene name | ribosomal protein L9 | |
| Synonyms | L9|NPC-A-16 | |
| Cytomap | UCSC genome browser: 4p13 | |
| Genomic location | chr4 :39455744-39460207 | |
| Type of gene | protein-coding | |
| RefGenes | NM_000661.4, NM_001024921.2, | |
| Ensembl id | ENSG00000163682 | |
| Description | 60S ribosomal protein L9 | |
| Modification date | 20141207 | |
| dbXrefs | MIM : 603686 | |
| HGNC : HGNC | ||
| Ensembl : ENSG00000163682 | ||
| HPRD : 04732 | ||
| Vega : OTTHUMG00000099367 | ||
| Protein | UniProt: go to UniProt's Cross Reference DB Table | |
| Expression | CleanEX: HS_RPL9 | |
| BioGPS: 6133 | ||
| Gene Expression Atlas: ENSG00000163682 | ||
| The Human Protein Atlas: ENSG00000163682 | ||
| Pathway | NCI Pathway Interaction Database: RPL9 | |
| KEGG: RPL9 | ||
| REACTOME: RPL9 | ||
| ConsensusPathDB | ||
| Pathway Commons: RPL9 | ||
| Metabolism | MetaCyc: RPL9 | |
| HUMANCyc: RPL9 | ||
| Regulation | Ensembl's Regulation: ENSG00000163682 | |
| miRBase: chr4 :39,455,744-39,460,207 | ||
| TargetScan: NM_000661 | ||
| cisRED: ENSG00000163682 | ||
| Context | iHOP: RPL9 | |
| cancer metabolism search in PubMed: RPL9 | ||
| UCL Cancer Institute: RPL9 | ||
| Assigned class in ccmGDB | C | |
| Top |
| Phenotypic Information for RPL9(metabolism pathway, cancer, disease, phenome) |
| Cancer | CGAP: RPL9 |
| Familial Cancer Database: RPL9 | |
| * This gene is included in those cancer gene databases. |
|
|
|
|
|
| . | ||||||||||||||||||||||||||||||||||||||||||||||||||||||||||||||||||||||||||||||||||||||||||||||||||||||||||||||||||||||||||||||||||||||||||||||||||||||||||||||||||||||||||||||||||||||||||||||||||||||||||||||||||||||||||||||||||||||||||||||||||||||||||||||||||||||||||||||||||||||||||||||||||||||||||||||||||||
Oncogene 1 | Significant driver gene in | |||||||||||||||||||||||||||||||||||||||||||||||||||||||||||||||||||||||||||||||||||||||||||||||||||||||||||||||||||||||||||||||||||||||||||||||||||||||||||||||||||||||||||||||||||||||||||||||||||||||||||||||||||||||||||||||||||||||||||||||||||||||||||||||||||||||||||||||||||||||||||||||||||||||||||||||||||||||||
| cf) number; DB name 1 Oncogene; http://nar.oxfordjournals.org/content/35/suppl_1/D721.long, 2 Tumor Suppressor gene; https://bioinfo.uth.edu/TSGene/, 3 Cancer Gene Census; http://www.nature.com/nrc/journal/v4/n3/abs/nrc1299.html, 4 CancerGenes; http://nar.oxfordjournals.org/content/35/suppl_1/D721.long, 5 Network of Cancer Gene; http://ncg.kcl.ac.uk/index.php, 1Therapeutic Vulnerabilities in Cancer; http://cbio.mskcc.org/cancergenomics/statius/ |
| REACTOME_METABOLISM_OF_PROTEINS REACTOME_METABOLISM_OF_MRNA REACTOME_METABOLISM_OF_RNA | |
| OMIM | |
| Orphanet | |
| Disease | KEGG Disease: RPL9 |
| MedGen: RPL9 (Human Medical Genetics with Condition) | |
| ClinVar: RPL9 | |
| Phenotype | MGI: RPL9 (International Mouse Phenotyping Consortium) |
| PhenomicDB: RPL9 | |
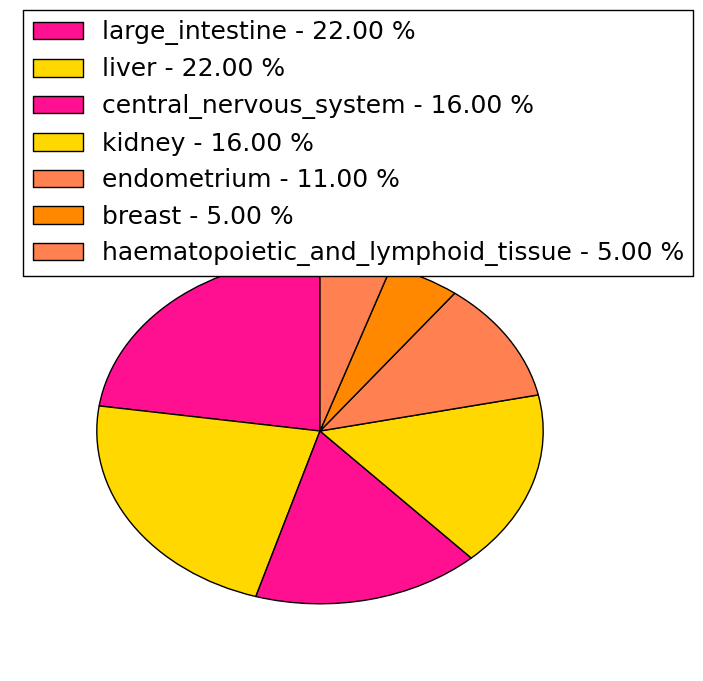
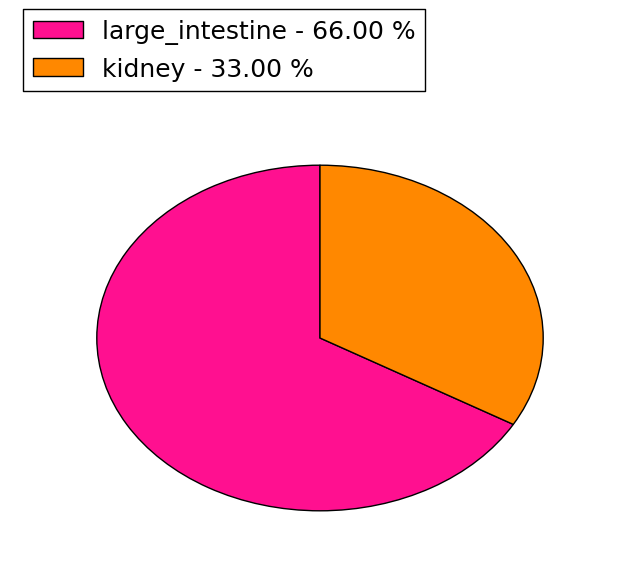
| Mutations for RPL9 |
| * Under tables are showing count per each tissue to give us broad intuition about tissue specific mutation patterns.You can go to the detailed page for each mutation database's web site. |
| - Statistics for Tissue and Mutation type | Top |
 |
| - For Inter-chromosomal Variations |
| There's no inter-chromosomal structural variation. |
| - For Intra-chromosomal Variations |
| * Intra-chromosomal variantions includes 'intrachromosomal amplicon to amplicon', 'intrachromosomal amplicon to non-amplified dna', 'intrachromosomal deletion', 'intrachromosomal fold-back inversion', 'intrachromosomal inversion', 'intrachromosomal tandem duplication', 'Intrachromosomal unknown type', 'intrachromosomal with inverted orientation', 'intrachromosomal with non-inverted orientation'. |
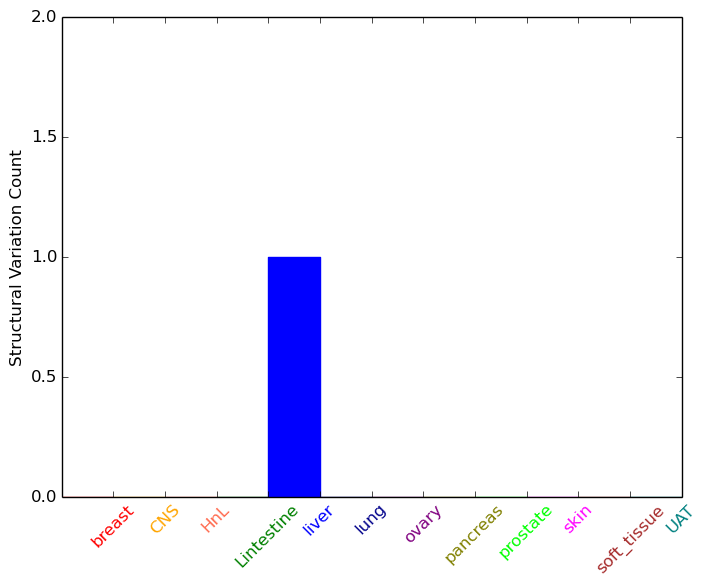 |
| Sample | Symbol_a | Chr_a | Start_a | End_a | Symbol_b | Chr_b | Start_b | End_b |
| liver | RPL9 | chr4 | 39457755 | 39457755 | chr4 | 45511511 | 45511511 |
| cf) Tissue number; Tissue name (1;Breast, 2;Central_nervous_system, 3;Haematopoietic_and_lymphoid_tissue, 4;Large_intestine, 5;Liver, 6;Lung, 7;Ovary, 8;Pancreas, 9;Prostate, 10;Skin, 11;Soft_tissue, 12;Upper_aerodigestive_tract) |
| * From mRNA Sanger sequences, Chitars2.0 arranged chimeric transcripts. This table shows RPL9 related fusion information. |
| ID | Head Gene | Tail Gene | Accession | Gene_a | qStart_a | qEnd_a | Chromosome_a | tStart_a | tEnd_a | Gene_a | qStart_a | qEnd_a | Chromosome_a | tStart_a | tEnd_a |
| BF814523 | CNDP2 | 9 | 207 | 18 | 72163620 | 72167268 | RPL9 | 200 | 407 | 4 | 39455744 | 39456258 | |
| Top |
| Mutation type/ Tissue ID | brca | cns | cerv | endome | haematopo | kidn | Lintest | liver | lung | ns | ovary | pancre | prost | skin | stoma | thyro | urina | |||
| Total # sample | 1 | |||||||||||||||||||
| GAIN (# sample) | 1 | |||||||||||||||||||
| LOSS (# sample) |
| cf) Tissue ID; Tissue type (1; Breast, 2; Central_nervous_system, 3; Cervix, 4; Endometrium, 5; Haematopoietic_and_lymphoid_tissue, 6; Kidney, 7; Large_intestine, 8; Liver, 9; Lung, 10; NS, 11; Ovary, 12; Pancreas, 13; Prostate, 14; Skin, 15; Stomach, 16; Thyroid, 17; Urinary_tract) |
| Top |
|
 |
| Top |
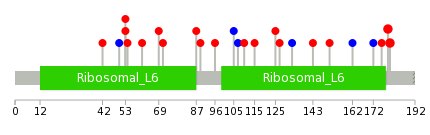
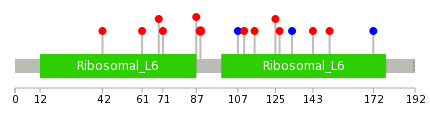
| Stat. for Non-Synonymous SNVs (# total SNVs=18) | (# total SNVs=3) |
 |  |
(# total SNVs=0) | (# total SNVs=0) |
| Top |
| * When you move the cursor on each content, you can see more deailed mutation information on the Tooltip. Those are primary_site,primary_histology,mutation(aa),pubmedID. |
| GRCh37 position | Mutation(aa) | Unique sampleID count |
| chr4:39456203-39456203 | p.Y180C | 2 |
| chr4:39456207-39456207 | p.I179F | 2 |
| chr4:39458073-39458073 | p.R115Q | 1 |
| chr4:39459817-39459817 | p.K53N | 1 |
| chr4:39458089-39458089 | p.S110P | 1 |
| chr4:39459818-39459818 | p.K53R | 1 |
| chr4:39458096-39458096 | p.E107E | 1 |
| chr4:39459826-39459826 | p.K50K | 1 |
| chr4:39456216-39456216 | p.L176V | 1 |
| chr4:39458102-39458102 | p.I105I | 1 |
| Top |
|
 |
| Point Mutation/ Tissue ID | 1 | 2 | 3 | 4 | 5 | 6 | 7 | 8 | 9 | 10 | 11 | 12 | 13 | 14 | 15 | 16 | 17 | 18 | 19 | 20 |
| # sample | 7 | 2 | 1 | 1 | 3 | 1 | ||||||||||||||
| # mutation | 6 | 2 | 1 | 1 | 3 | 2 | ||||||||||||||
| nonsynonymous SNV | 4 | 2 | 1 | 3 | 2 | |||||||||||||||
| synonymous SNV | 2 | 1 |
| cf) Tissue ID; Tissue type (1; BLCA[Bladder Urothelial Carcinoma], 2; BRCA[Breast invasive carcinoma], 3; CESC[Cervical squamous cell carcinoma and endocervical adenocarcinoma], 4; COAD[Colon adenocarcinoma], 5; GBM[Glioblastoma multiforme], 6; Glioma Low Grade, 7; HNSC[Head and Neck squamous cell carcinoma], 8; KICH[Kidney Chromophobe], 9; KIRC[Kidney renal clear cell carcinoma], 10; KIRP[Kidney renal papillary cell carcinoma], 11; LAML[Acute Myeloid Leukemia], 12; LUAD[Lung adenocarcinoma], 13; LUSC[Lung squamous cell carcinoma], 14; OV[Ovarian serous cystadenocarcinoma ], 15; PAAD[Pancreatic adenocarcinoma], 16; PRAD[Prostate adenocarcinoma], 17; SKCM[Skin Cutaneous Melanoma], 18:STAD[Stomach adenocarcinoma], 19:THCA[Thyroid carcinoma], 20:UCEC[Uterine Corpus Endometrial Carcinoma]) |
| Top |
| * We represented just top 10 SNVs. When you move the cursor on each content, you can see more deailed mutation information on the Tooltip. Those are primary_site, primary_histology, mutation(aa), pubmedID. |
| Genomic Position | Mutation(aa) | Unique sampleID count |
| chr4:39458151 | p.R89H,RPL9 | 2 |
| chr4:39458157 | p.I172I,RPL9 | 1 |
| chr4:39456226 | p.I151T,RPL9 | 1 |
| chr4:39459252 | p.E143D,RPL9 | 1 |
| chr4:39456504 | p.A133A,RPL9 | 1 |
| chr4:39459259 | p.R127G,RPL9 | 1 |
| chr4:39456527 | p.R125G,RPL9 | 1 |
| chr4:39459283 | p.R115Q,RPL9 | 1 |
| chr4:39456557 | p.S110P,RPL9 | 1 |
| chr4:39459852 | p.E107E,RPL9 | 1 |
| * Copy number data were extracted from TCGA using R package TCGA-Assembler. The URLs of all public data files on TCGA DCC data server were gathered on Jan-05-2015. Function ProcessCNAData in TCGA-Assembler package was used to obtain gene-level copy number value which is calculated as the average copy number of the genomic region of a gene. |
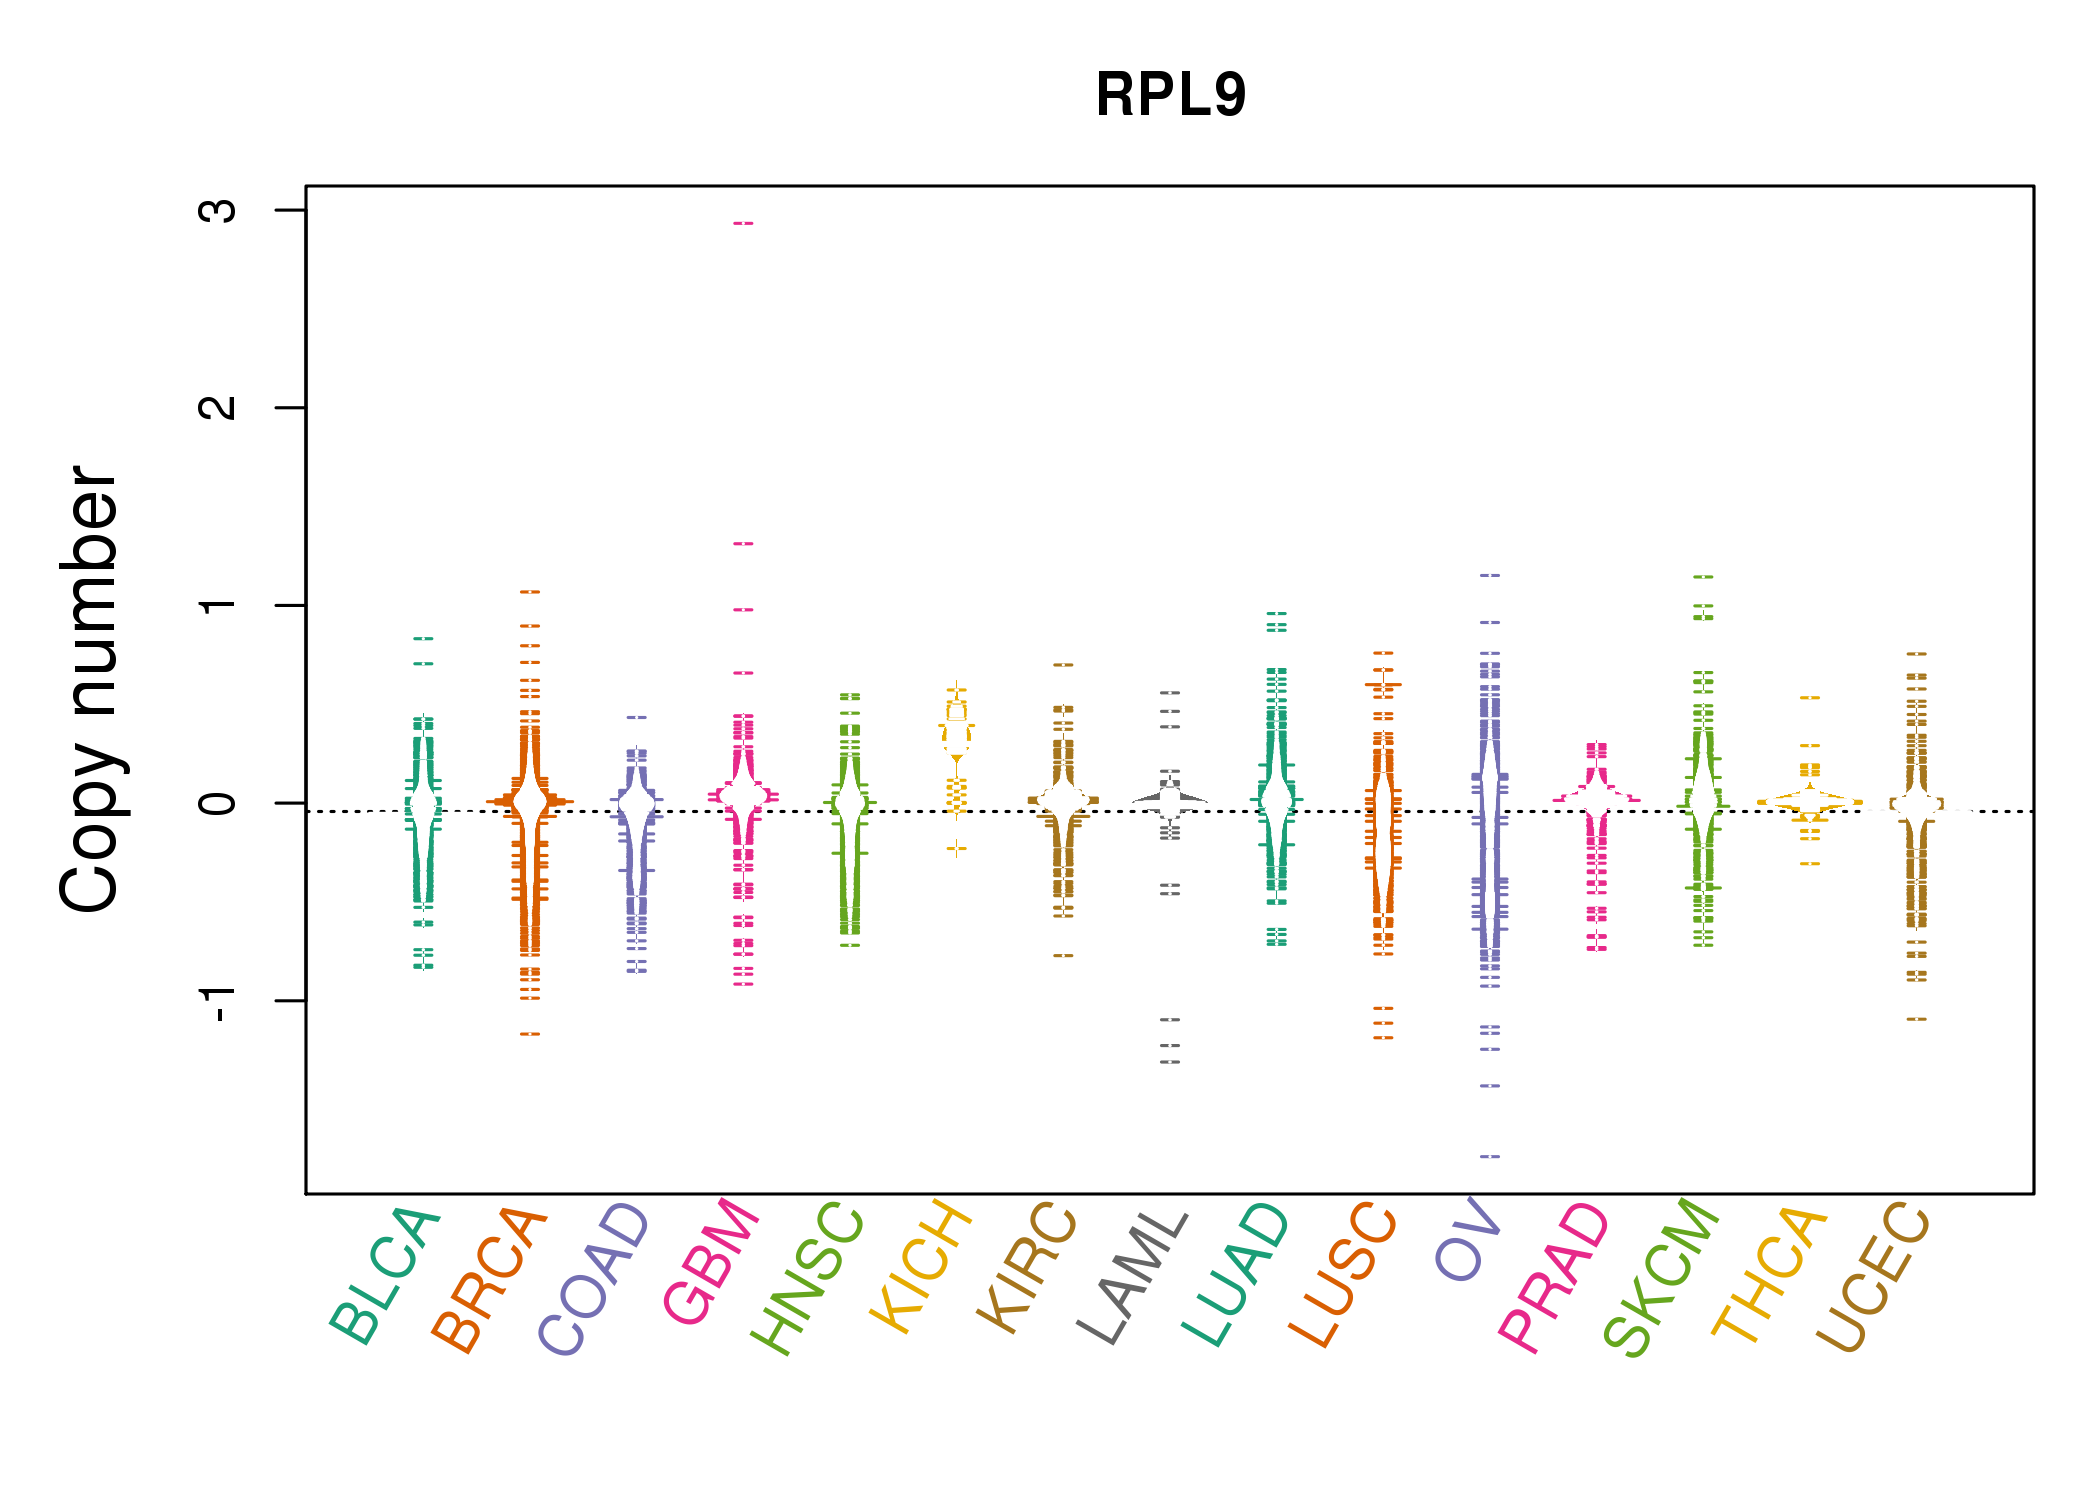 |
| cf) Tissue ID[Tissue type]: BLCA[Bladder Urothelial Carcinoma], BRCA[Breast invasive carcinoma], CESC[Cervical squamous cell carcinoma and endocervical adenocarcinoma], COAD[Colon adenocarcinoma], GBM[Glioblastoma multiforme], Glioma Low Grade, HNSC[Head and Neck squamous cell carcinoma], KICH[Kidney Chromophobe], KIRC[Kidney renal clear cell carcinoma], KIRP[Kidney renal papillary cell carcinoma], LAML[Acute Myeloid Leukemia], LUAD[Lung adenocarcinoma], LUSC[Lung squamous cell carcinoma], OV[Ovarian serous cystadenocarcinoma ], PAAD[Pancreatic adenocarcinoma], PRAD[Prostate adenocarcinoma], SKCM[Skin Cutaneous Melanoma], STAD[Stomach adenocarcinoma], THCA[Thyroid carcinoma], UCEC[Uterine Corpus Endometrial Carcinoma] |
| Top |
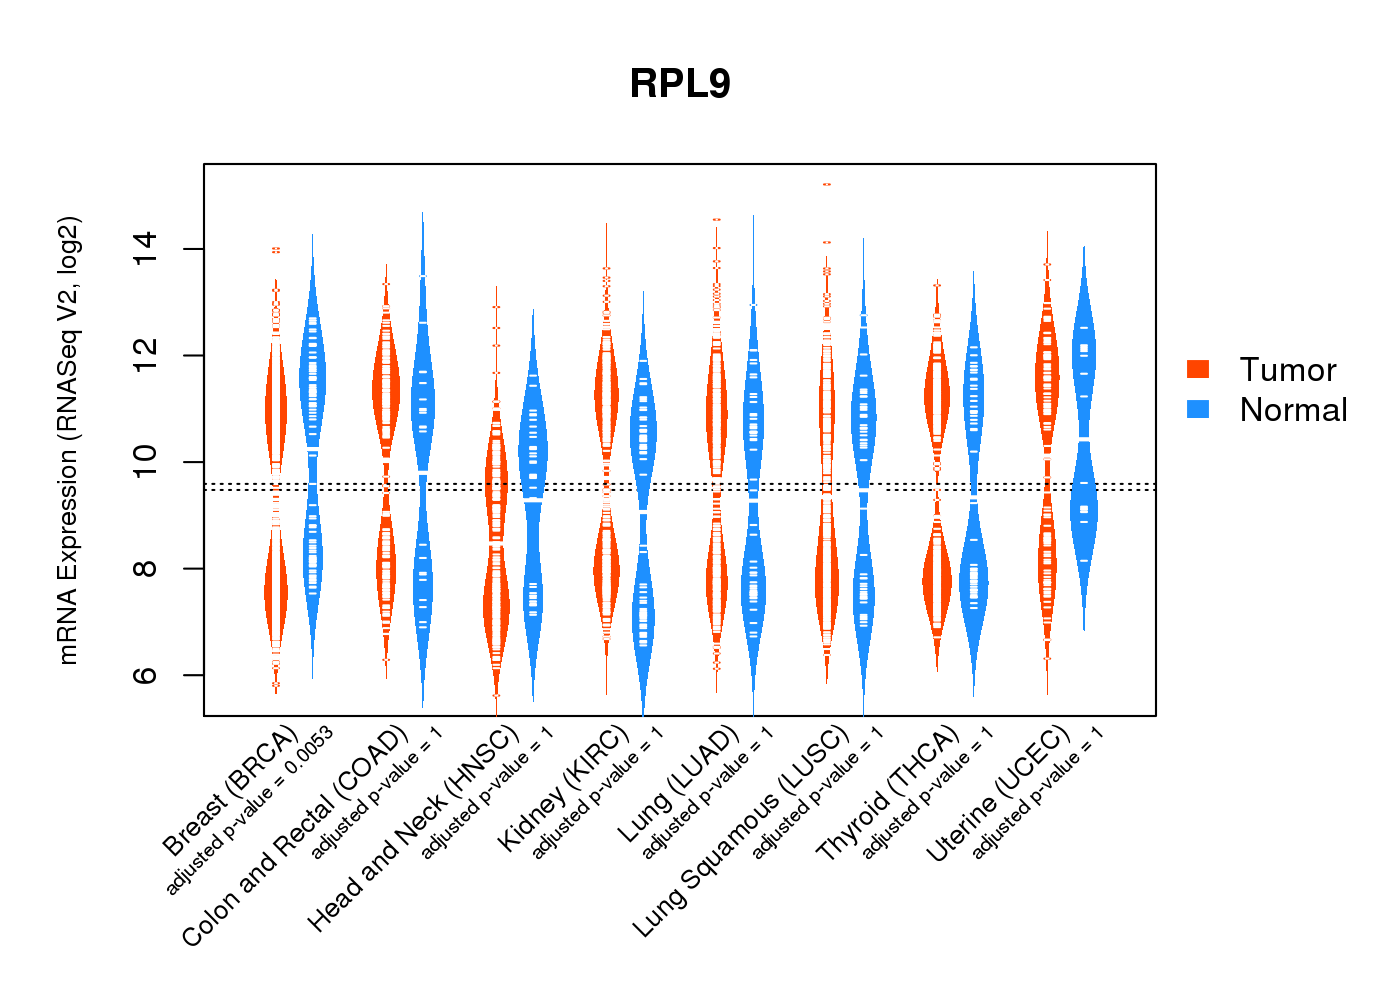
| Gene Expression for RPL9 |
| * CCLE gene expression data were extracted from CCLE_Expression_Entrez_2012-10-18.res: Gene-centric RMA-normalized mRNA expression data. |
 |
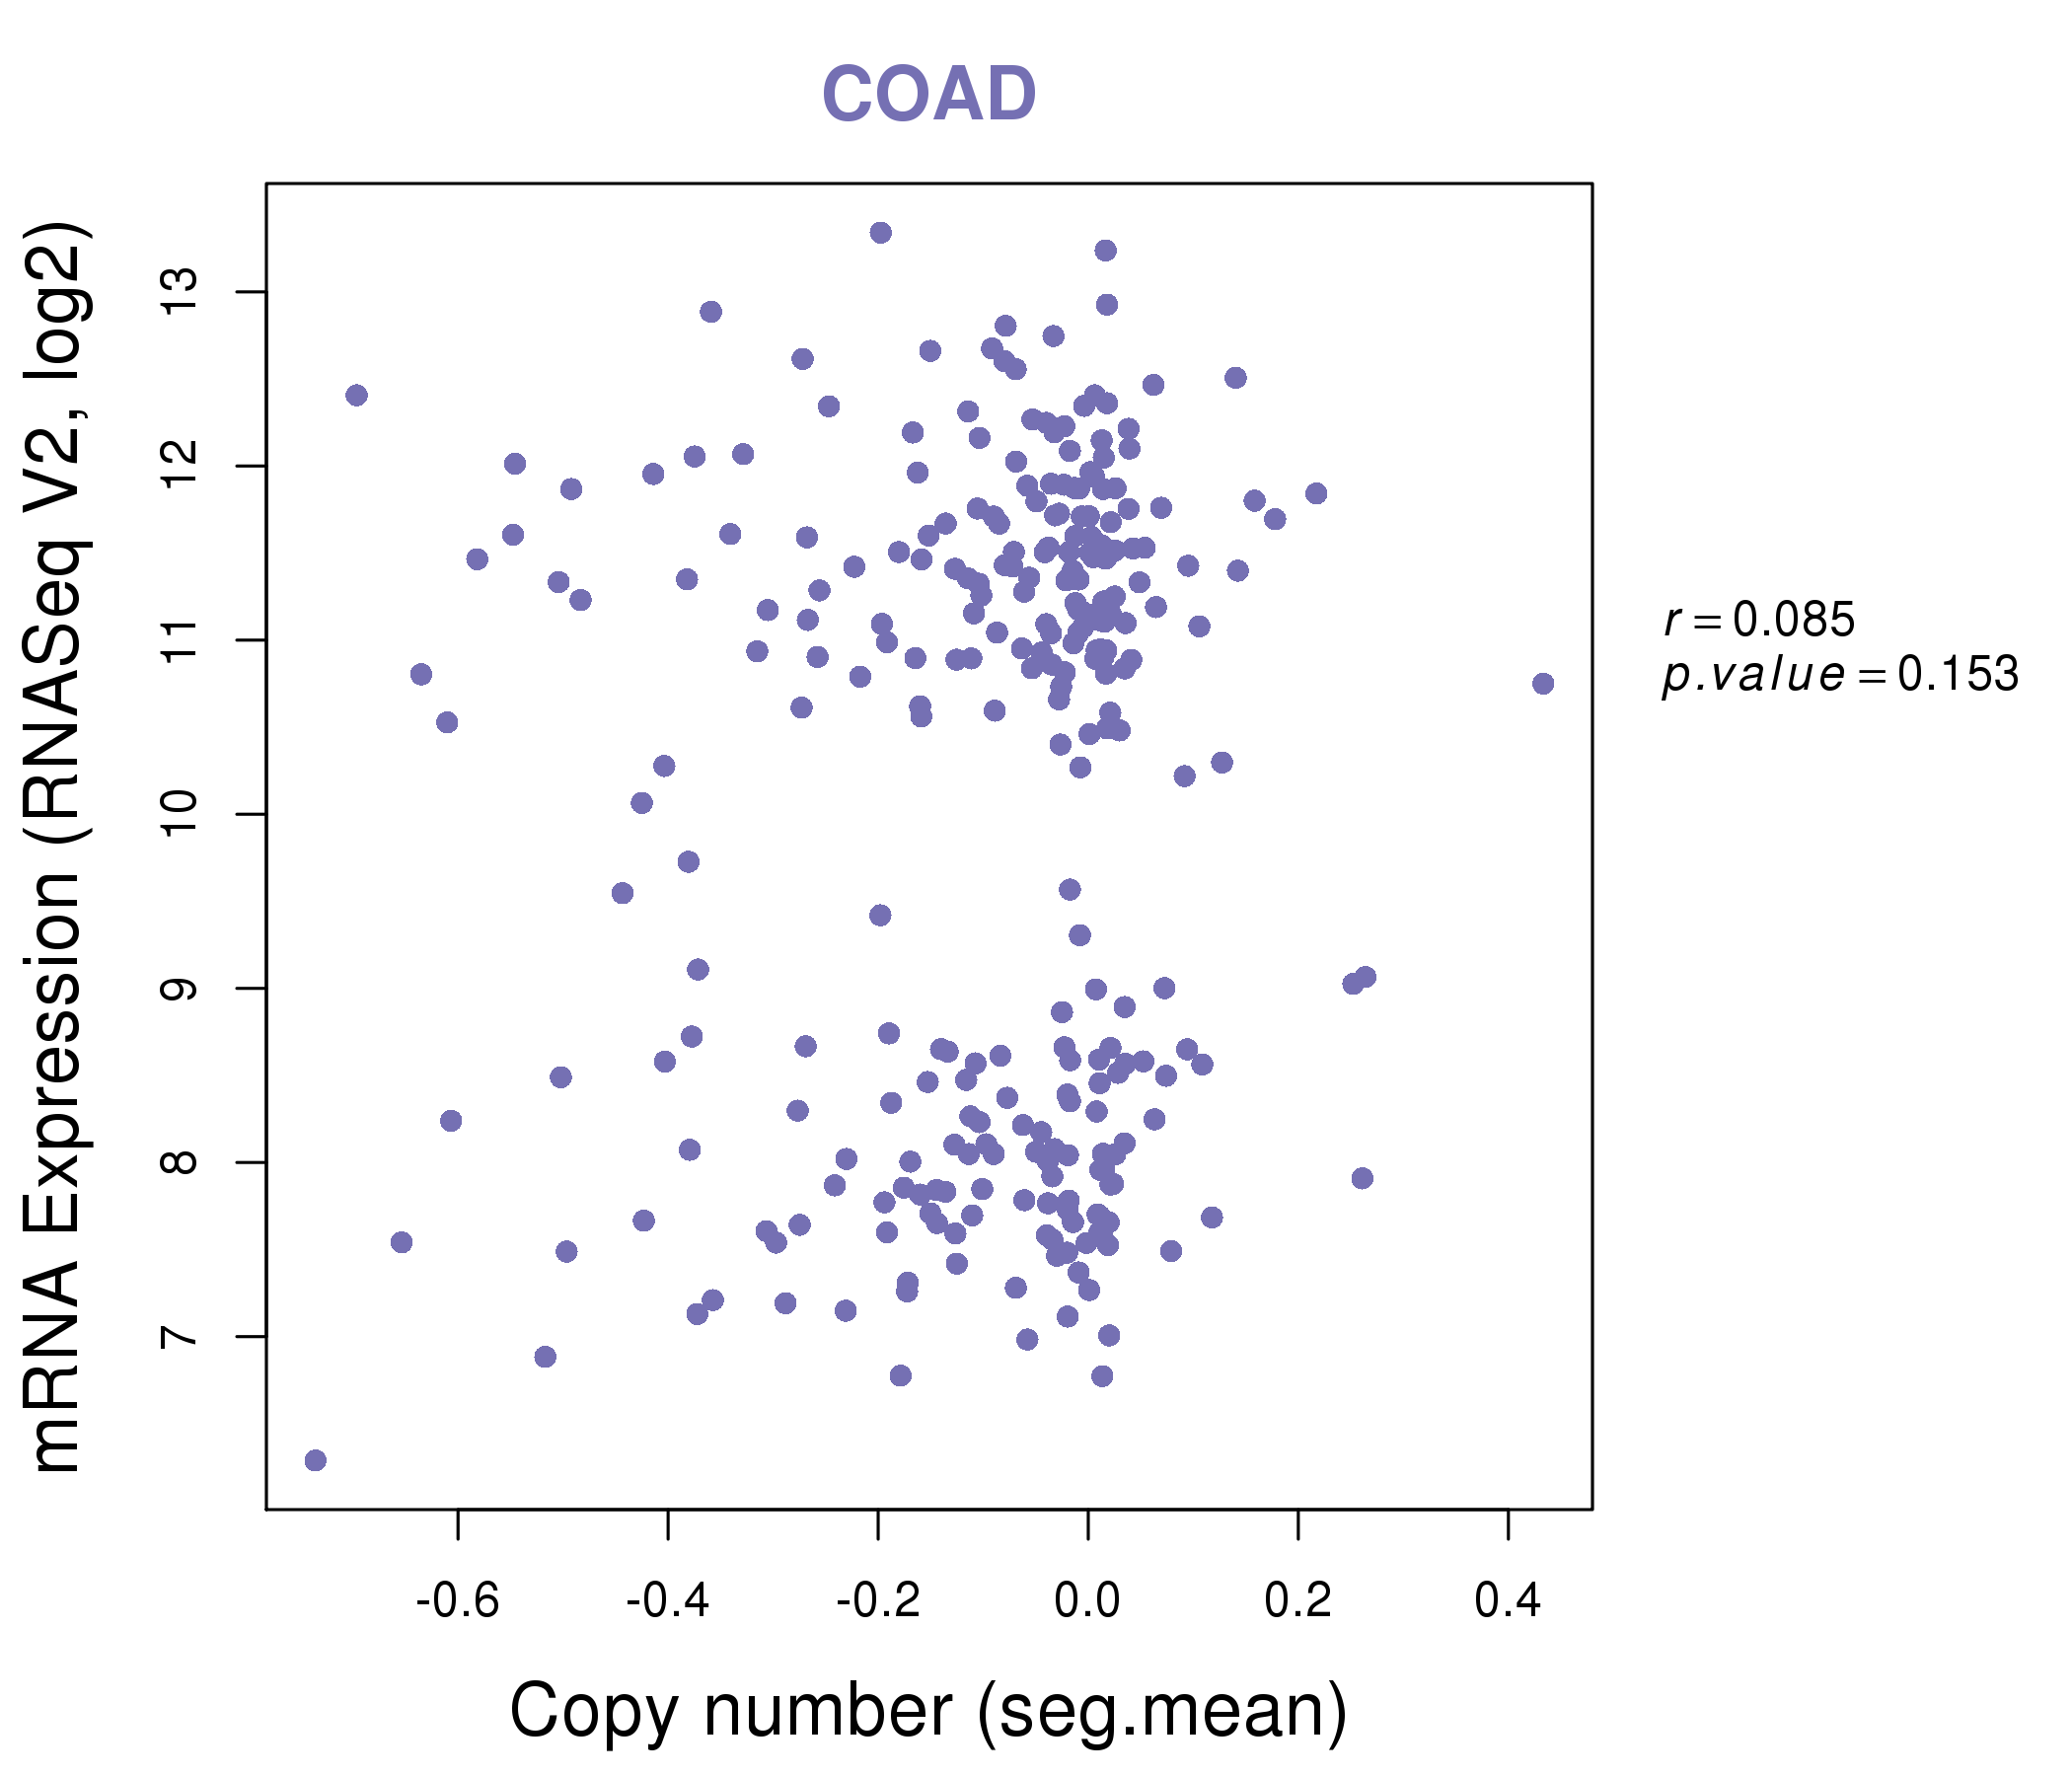
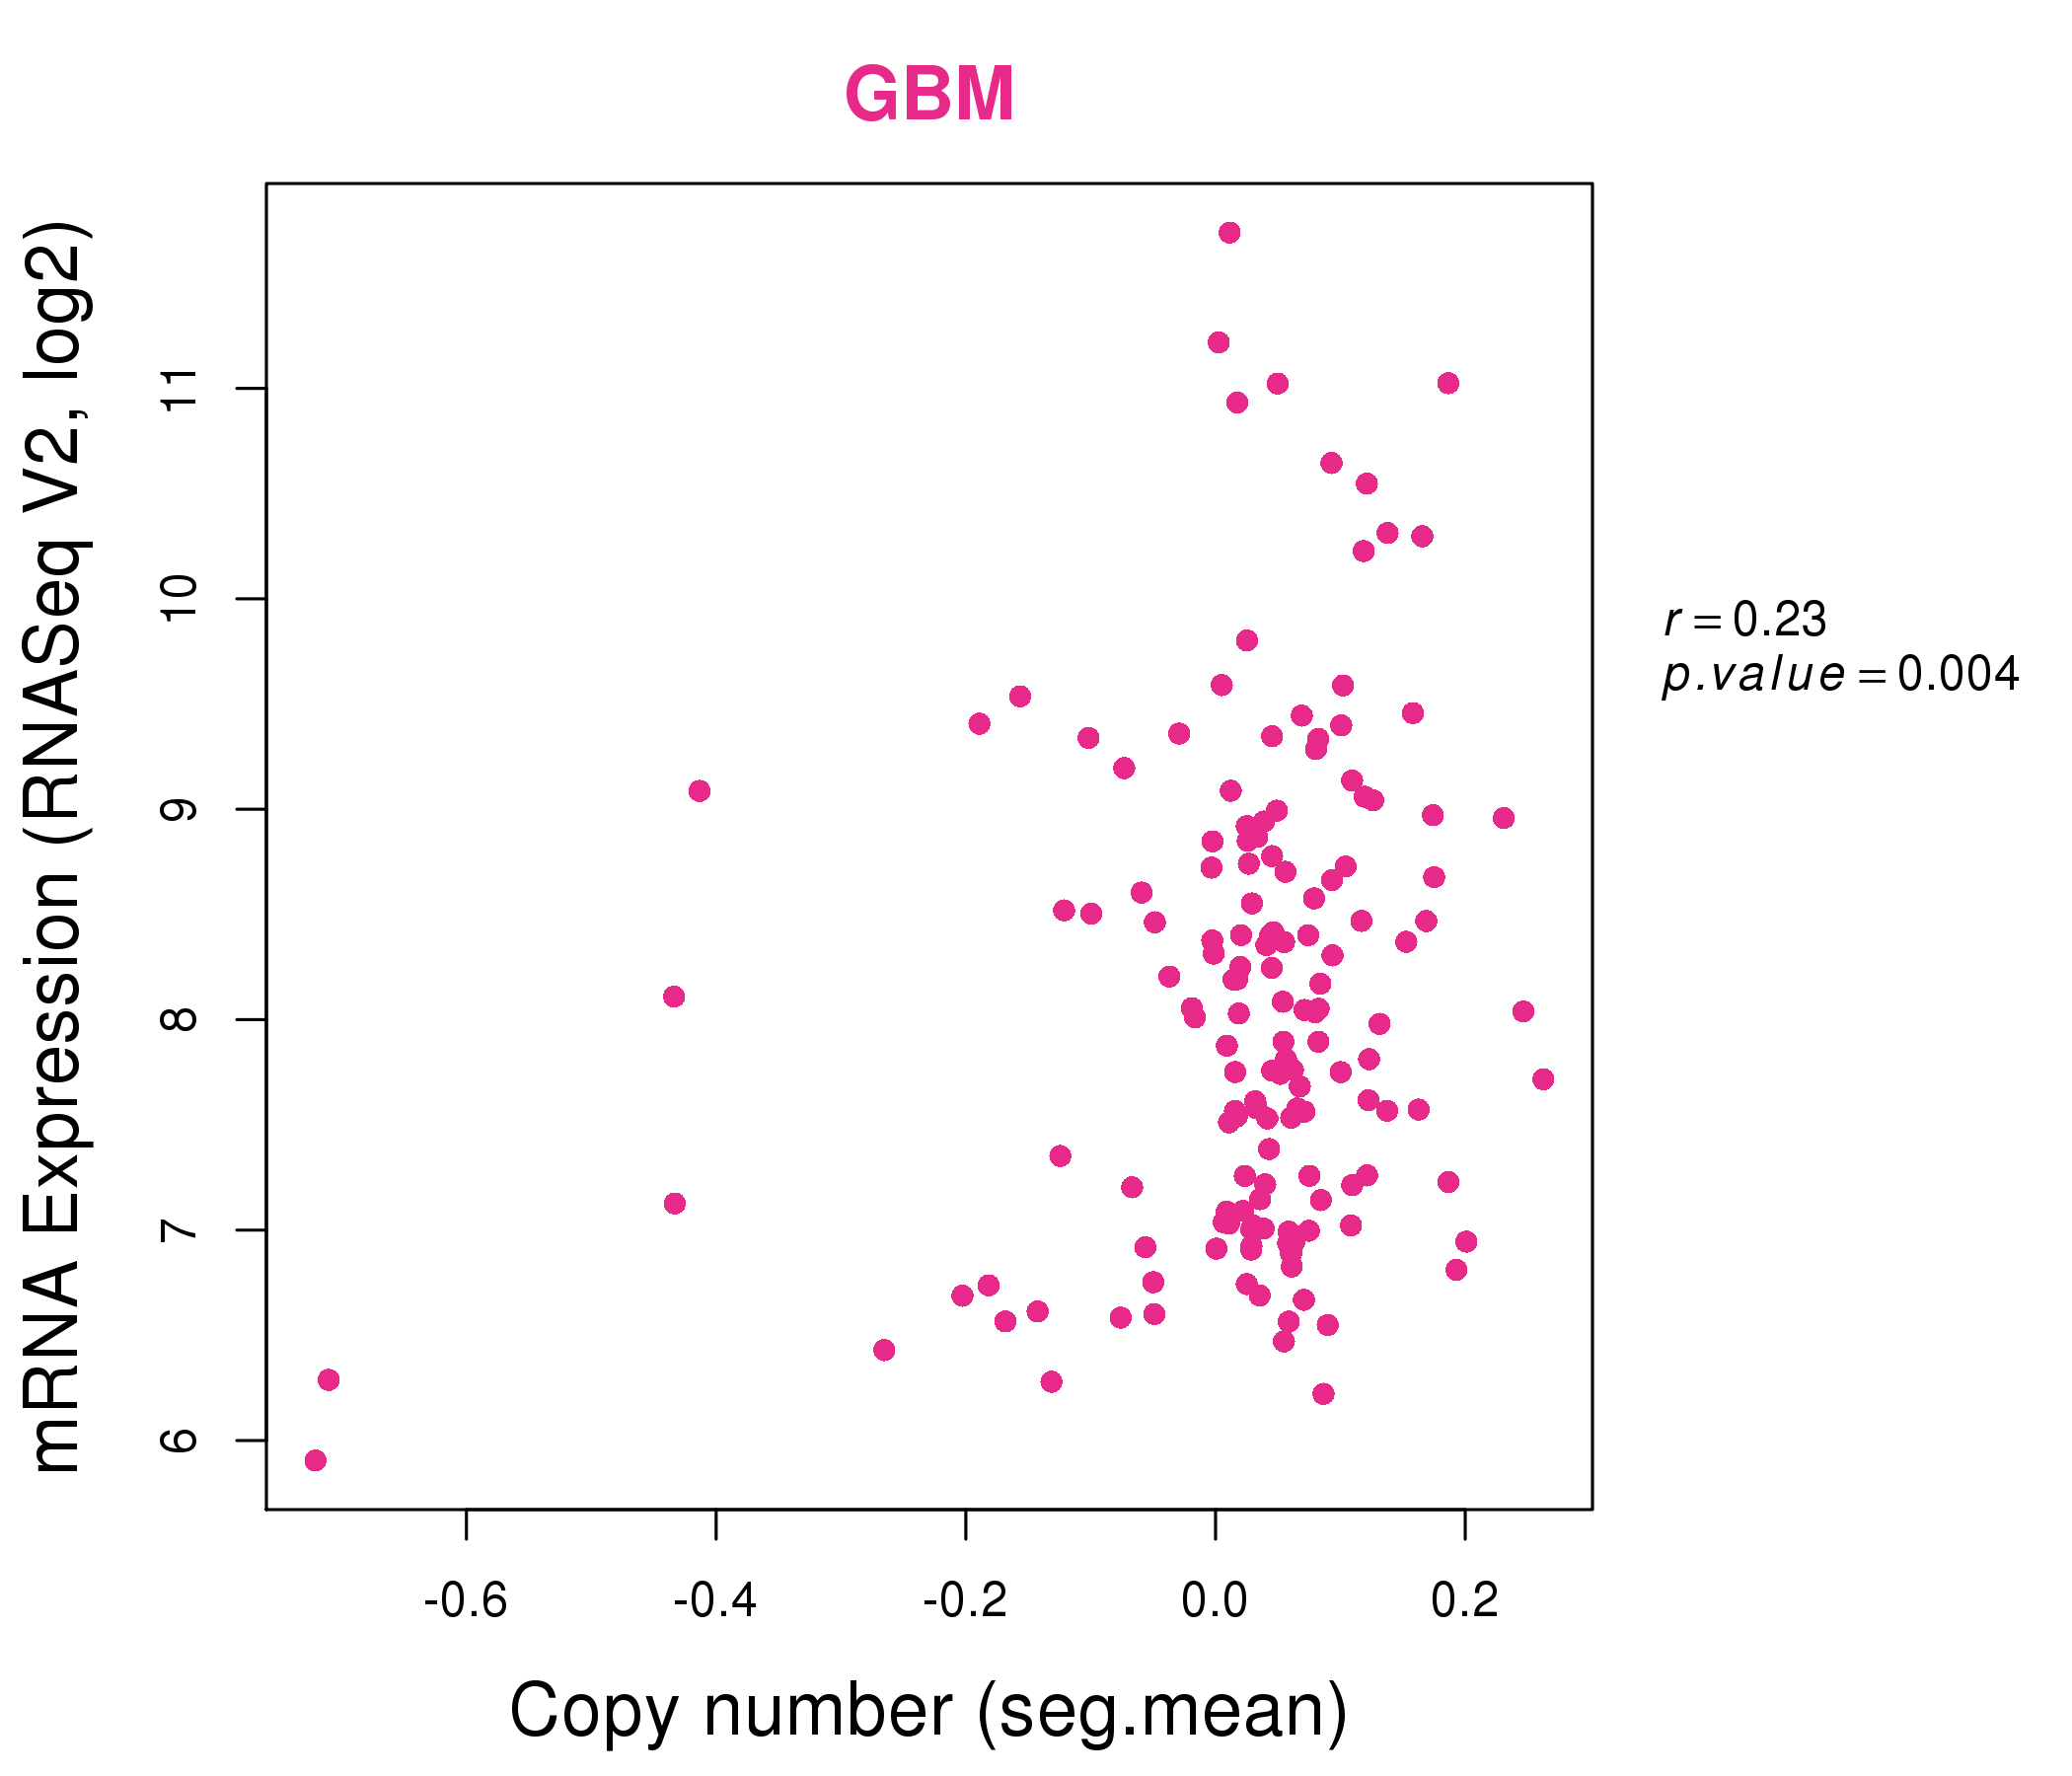
| * Normalized gene expression data of RNASeqV2 was extracted from TCGA using R package TCGA-Assembler. The URLs of all public data files on TCGA DCC data server were gathered at Jan-05-2015. Only eight cancer types have enough normal control samples for differential expression analysis. (t test, adjusted p<0.05 (using Benjamini-Hochberg FDR)) |
 |
| Top |
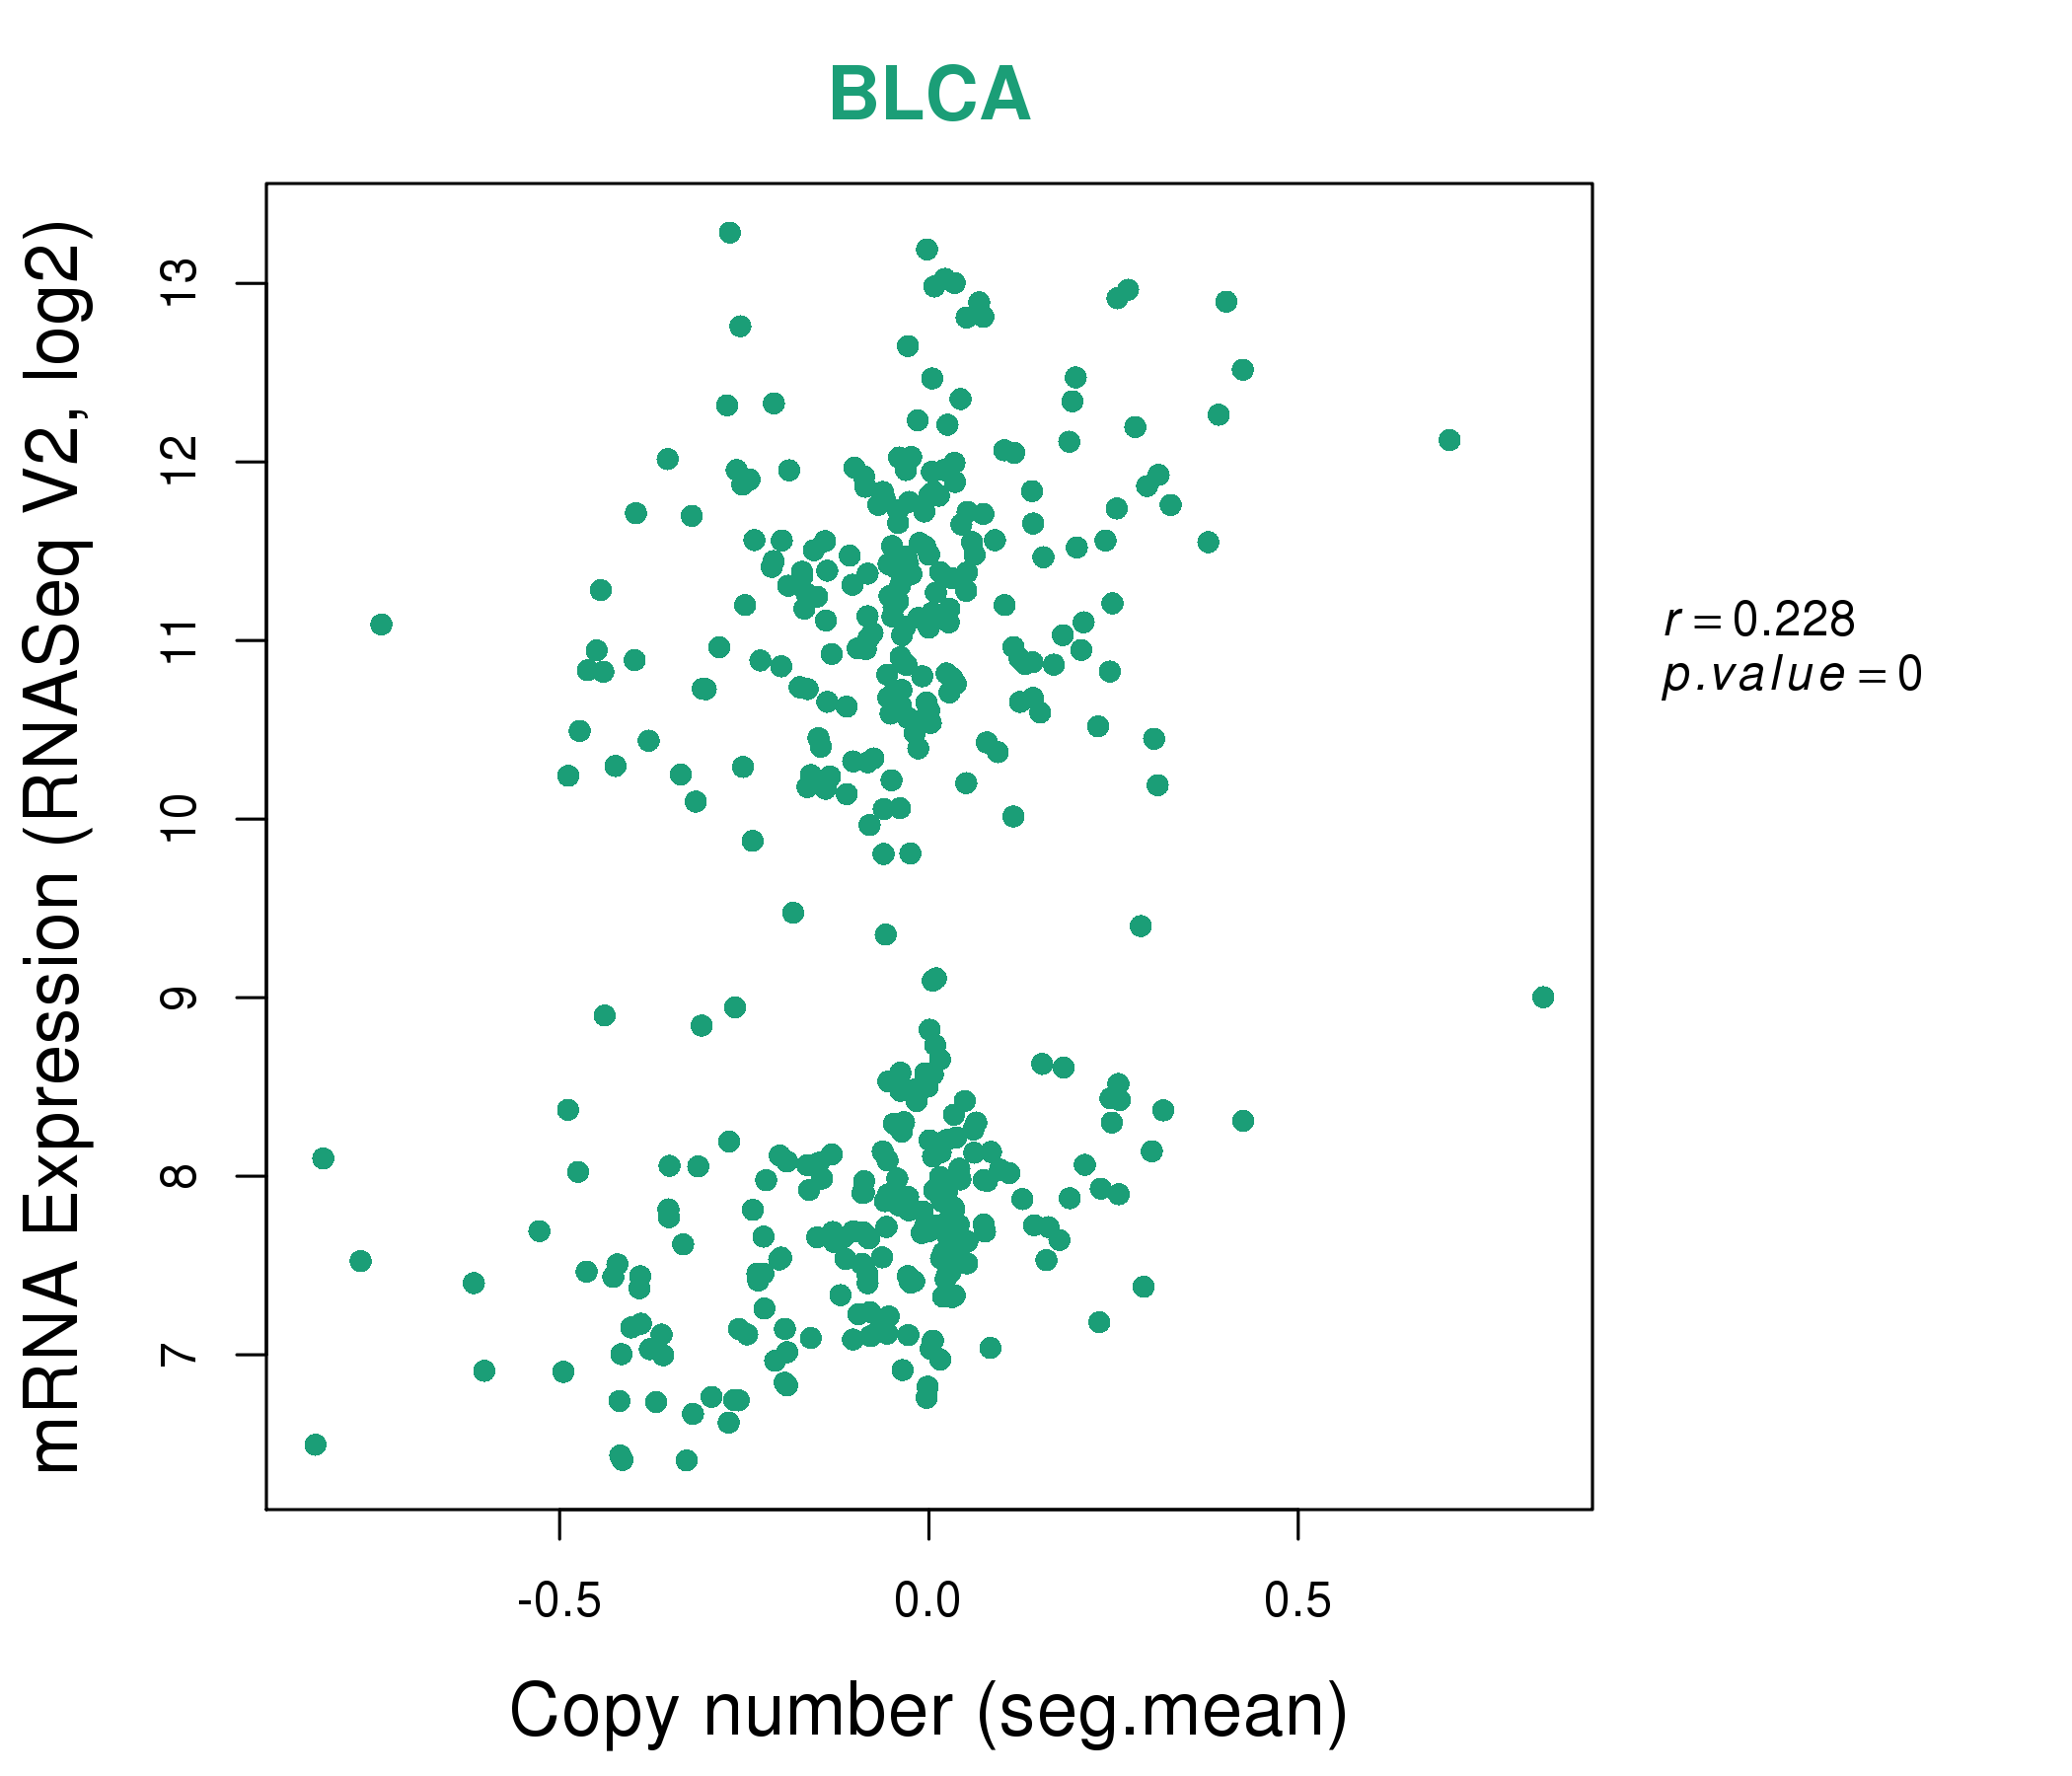
| * This plots show the correlation between CNV and gene expression. |
: Open all plots for all cancer types
 |
|
 |
|

| Top |
| Gene-Gene Network Information |
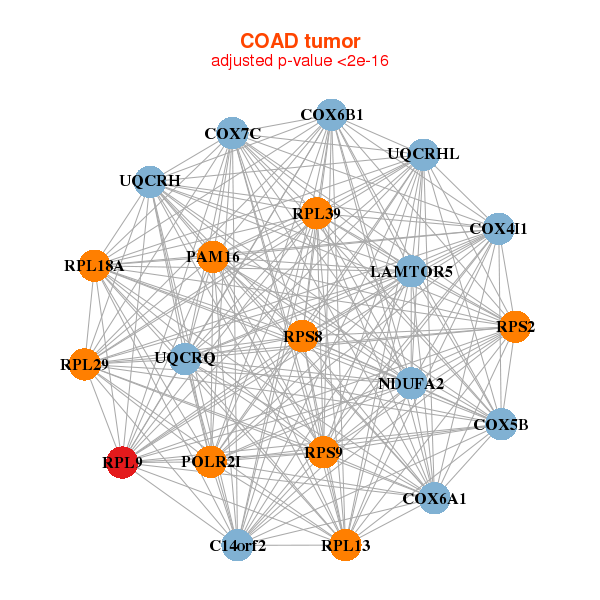
| * Co-Expression network figures were drawn using R package igraph. Only the top 20 genes with the highest correlations were shown. Red circle: input gene, orange circle: cell metabolism gene, sky circle: other gene |
: Open all plots for all cancer types
 |
|
| GLTSCR2,RPL13,RPL18,RPL28,RPL29,RPL31,RPL32, RPL34,RPL35,RPL36,RPL37,RPL37A,RPL9,RPLP2, RPS10,RPS11,RPS19,RPS20,RPS4X,RPS8,RPS9 | ABHD10,FOPNL,CHPT1,MROH2B,INTS8,MEAF6,NUP35, NUP54,PEX2,POC1B,PTGES3,PYROXD1,RAB5B,RPL9, RSL24D1,SNX4,SUPT3H,TATDN1,ZFAND1,ZNF595,ZNF658 |
 |
|
| C14orf2,COX4I1,COX5B,COX6A1,COX6B1,COX7C,LAMTOR5, NDUFA2,POLR2I,RPL13,RPL18A,RPL29,RPL39,RPL9, RPS2,RPS8,RPS9,PAM16,UQCRH,UQCRHL,UQCRQ | ANKRD49,APOC1,DNAAF2,NDUFAF5,PRADC1,CELA3A,IAPP, IQCB1,MEMO1,MRPL15,NEUROD4,ORC4,PSG1,PTRH2, RPL9,SDCCAG3,SFTA1P,SLC37A2,SSX8,VCY,WDR61 |
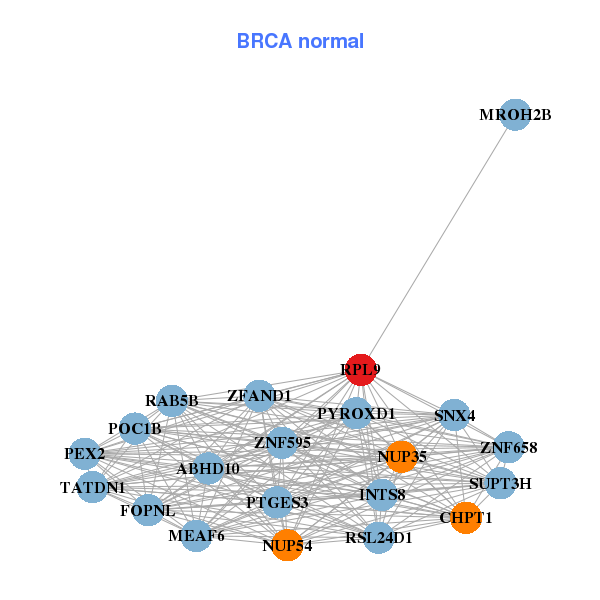
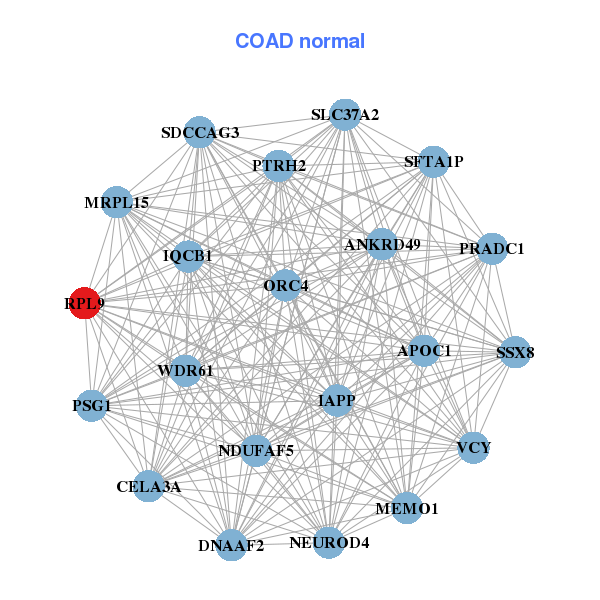
| * Co-Expression network figures were drawn using R package igraph. Only the top 20 genes with the highest correlations were shown. Red circle: input gene, orange circle: cell metabolism gene, sky circle: other gene |
: Open all plots for all cancer types
| Top |
: Open all interacting genes' information including KEGG pathway for all interacting genes from DAVID
| Top |
| Pharmacological Information for RPL9 |
| There's no related Drug. |
| Top |
| Cross referenced IDs for RPL9 |
| * We obtained these cross-references from Uniprot database. It covers 150 different DBs, 18 categories. http://www.uniprot.org/help/cross_references_section |
: Open all cross reference information
|
Copyright © 2016-Present - The Univsersity of Texas Health Science Center at Houston @ |