|
||||||||||||||||||||
| |
| Phenotypic Information (metabolism pathway, cancer, disease, phenome) |
| |
| |
| Gene-Gene Network Information: Co-Expression Network, Interacting Genes & KEGG |
| |
|


| Gene Summary for RPL10 |
| Top |
| Phenotypic Information for RPL10(metabolism pathway, cancer, disease, phenome) |
| Cancer | CGAP: RPL10 |
| Familial Cancer Database: RPL10 | |
| * This gene is included in those cancer gene databases. |
|
|
|
|
|
| . | ||||||||||||||
Oncogene 1 | Significant driver gene in | |||||||||||||||||||
| cf) number; DB name 1 Oncogene; http://nar.oxfordjournals.org/content/35/suppl_1/D721.long, 2 Tumor Suppressor gene; https://bioinfo.uth.edu/TSGene/, 3 Cancer Gene Census; http://www.nature.com/nrc/journal/v4/n3/abs/nrc1299.html, 4 CancerGenes; http://nar.oxfordjournals.org/content/35/suppl_1/D721.long, 5 Network of Cancer Gene; http://ncg.kcl.ac.uk/index.php, 1Therapeutic Vulnerabilities in Cancer; http://cbio.mskcc.org/cancergenomics/statius/ |
| REACTOME_METABOLISM_OF_PROTEINS REACTOME_METABOLISM_OF_MRNA REACTOME_METABOLISM_OF_RNA | |
| OMIM | 300847; phenotype. 312173; gene. |
| Orphanet | 106; Autism. |
| Disease | KEGG Disease: RPL10 |
| MedGen: RPL10 (Human Medical Genetics with Condition) | |
| ClinVar: RPL10 | |
| Phenotype | MGI: RPL10 (International Mouse Phenotyping Consortium) |
| PhenomicDB: RPL10 | |
| Mutations for RPL10 |
| * Under tables are showing count per each tissue to give us broad intuition about tissue specific mutation patterns.You can go to the detailed page for each mutation database's web site. |
| There's no structural variation information in COSMIC data for this gene. |
| * From mRNA Sanger sequences, Chitars2.0 arranged chimeric transcripts. This table shows RPL10 related fusion information. |
| ID | Head Gene | Tail Gene | Accession | Gene_a | qStart_a | qEnd_a | Chromosome_a | tStart_a | tEnd_a | Gene_a | qStart_a | qEnd_a | Chromosome_a | tStart_a | tEnd_a |
| AI698719 | RPL10 | 33 | 79 | X | 153629208 | 153629254 | MLL2 | 70 | 436 | 12 | 49435187 | 49435977 | |
| CB162793 | CYB5A | 1 | 305 | 18 | 71920789 | 71928412 | RPL10 | 301 | 555 | X | 153630508 | 153630762 | |
| DW421192 | RPL10 | 68 | 232 | X | 153627678 | 153627842 | POLA1 | 231 | 298 | X | 24806747 | 24806814 | |
| CB164490 | CYB5A | 1 | 305 | 18 | 71920789 | 71928412 | RPL10 | 301 | 592 | X | 153630471 | 153630762 | |
| AW581181 | RPL10 | 13 | 247 | X | 153628766 | 153629004 | RNF213 | 234 | 295 | 17 | 78318971 | 78319032 | |
| BQ771607 | RPL10 | 18 | 72 | X | 153629200 | 153629254 | CSNK2A2 | 67 | 548 | 16 | 58195561 | 58196042 | |
| BC015618 | RPL10 | 44 | 549 | X | 153628152 | 153629254 | POLA2 | 550 | 3007 | 11 | 65029451 | 65065088 | |
| AA813916 | RPL10 | 55 | 107 | X | 153629200 | 153629254 | SCLY | 92 | 241 | 2 | 239007418 | 239007567 | |
| AI499133 | RPL10 | 27 | 81 | X | 153629200 | 153629254 | IQGAP2 | 71 | 464 | 5 | 75715629 | 75716022 | |
| Top |
| There's no copy number variation information in COSMIC data for this gene. |
| Top |
|
 |
| Top |
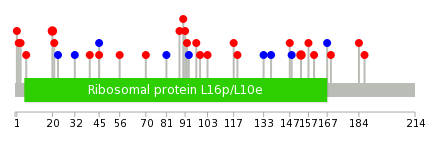
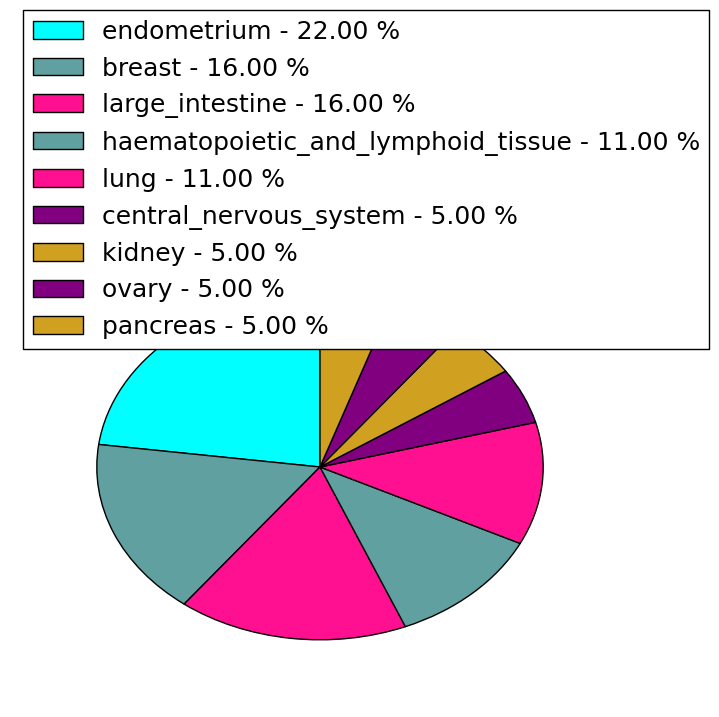
| Stat. for Non-Synonymous SNVs (# total SNVs=18) | (# total SNVs=7) |
 |  |
(# total SNVs=0) | (# total SNVs=0) |
| Top |
| * When you move the cursor on each content, you can see more deailed mutation information on the Tooltip. Those are primary_site,primary_histology,mutation(aa),pubmedID. |
| GRCh37 position | Mutation(aa) | Unique sampleID count |
| chr23:153627713-153627713 | p.S20P | 2 |
| chr23:153628932-153628932 | p.R153C | 2 |
| chr23:153628221-153628221 | p.R90W | 1 |
| chr23:153628915-153628915 | p.H147R | 1 |
| chr23:153627716-153627716 | p.R21C | 1 |
| chr23:153628224-153628224 | p.L91F | 1 |
| chr23:153628919-153628919 | p.V148V | 1 |
| chr23:153627724-153627724 | p.C23C | 1 |
| chr23:153628228-153628228 | p.H92P | 1 |
| chr23:153627841-153627841 | p.R32R | 1 |
| Top |
|
 |
| Point Mutation/ Tissue ID | 1 | 2 | 3 | 4 | 5 | 6 | 7 | 8 | 9 | 10 | 11 | 12 | 13 | 14 | 15 | 16 | 17 | 18 | 19 | 20 |
| # sample | 2 | 2 | 1 | 3 | 1 | 2 | 1 | 3 | 2 | 4 | 5 | 5 | ||||||||
| # mutation | 2 | 2 | 1 | 3 | 1 | 2 | 1 | 3 | 2 | 4 | 5 | 7 | ||||||||
| nonsynonymous SNV | 2 | 1 | 1 | 3 | 1 | 2 | 1 | 2 | 3 | 5 | 4 | |||||||||
| synonymous SNV | 1 | 1 | 2 | 1 | 3 |
| cf) Tissue ID; Tissue type (1; BLCA[Bladder Urothelial Carcinoma], 2; BRCA[Breast invasive carcinoma], 3; CESC[Cervical squamous cell carcinoma and endocervical adenocarcinoma], 4; COAD[Colon adenocarcinoma], 5; GBM[Glioblastoma multiforme], 6; Glioma Low Grade, 7; HNSC[Head and Neck squamous cell carcinoma], 8; KICH[Kidney Chromophobe], 9; KIRC[Kidney renal clear cell carcinoma], 10; KIRP[Kidney renal papillary cell carcinoma], 11; LAML[Acute Myeloid Leukemia], 12; LUAD[Lung adenocarcinoma], 13; LUSC[Lung squamous cell carcinoma], 14; OV[Ovarian serous cystadenocarcinoma ], 15; PAAD[Pancreatic adenocarcinoma], 16; PRAD[Prostate adenocarcinoma], 17; SKCM[Skin Cutaneous Melanoma], 18:STAD[Stomach adenocarcinoma], 19:THCA[Thyroid carcinoma], 20:UCEC[Uterine Corpus Endometrial Carcinoma]) |
| Top |
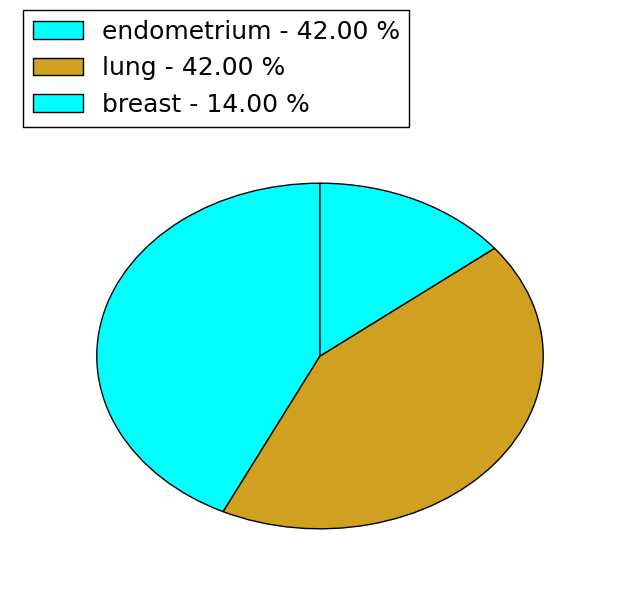
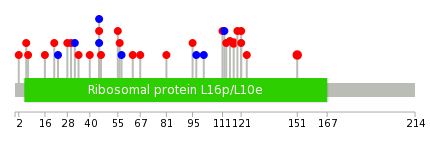
| * We represented just top 10 SNVs. When you move the cursor on each content, you can see more deailed mutation information on the Tooltip. Those are primary_site, primary_histology, mutation(aa), pubmedID. |
| Genomic Position | Mutation(aa) | Unique sampleID count |
| chrX:153628932 | p.R117C,RPL10 | 2 |
| chrX:153629109 | p.E151K,RPL10 | 2 |
| chrX:153627716 | p.Q97Q,RPL10 | 1 |
| chrX:153628196 | p.D28N,RPL10 | 1 |
| chrX:153627724 | p.S101S,RPL10 | 1 |
| chrX:153628224 | p.R32R,RPL10 | 1 |
| chrX:153628938 | p.H111R,RPL10 | 1 |
| chrX:153627737 | p.K40R,RPL10 | 1 |
| chrX:153628232 | p.V112V,RPL10 | 1 |
| chrX:153628945 | p.E45G,RPL10 | 1 |
| * Copy number data were extracted from TCGA using R package TCGA-Assembler. The URLs of all public data files on TCGA DCC data server were gathered on Jan-05-2015. Function ProcessCNAData in TCGA-Assembler package was used to obtain gene-level copy number value which is calculated as the average copy number of the genomic region of a gene. |
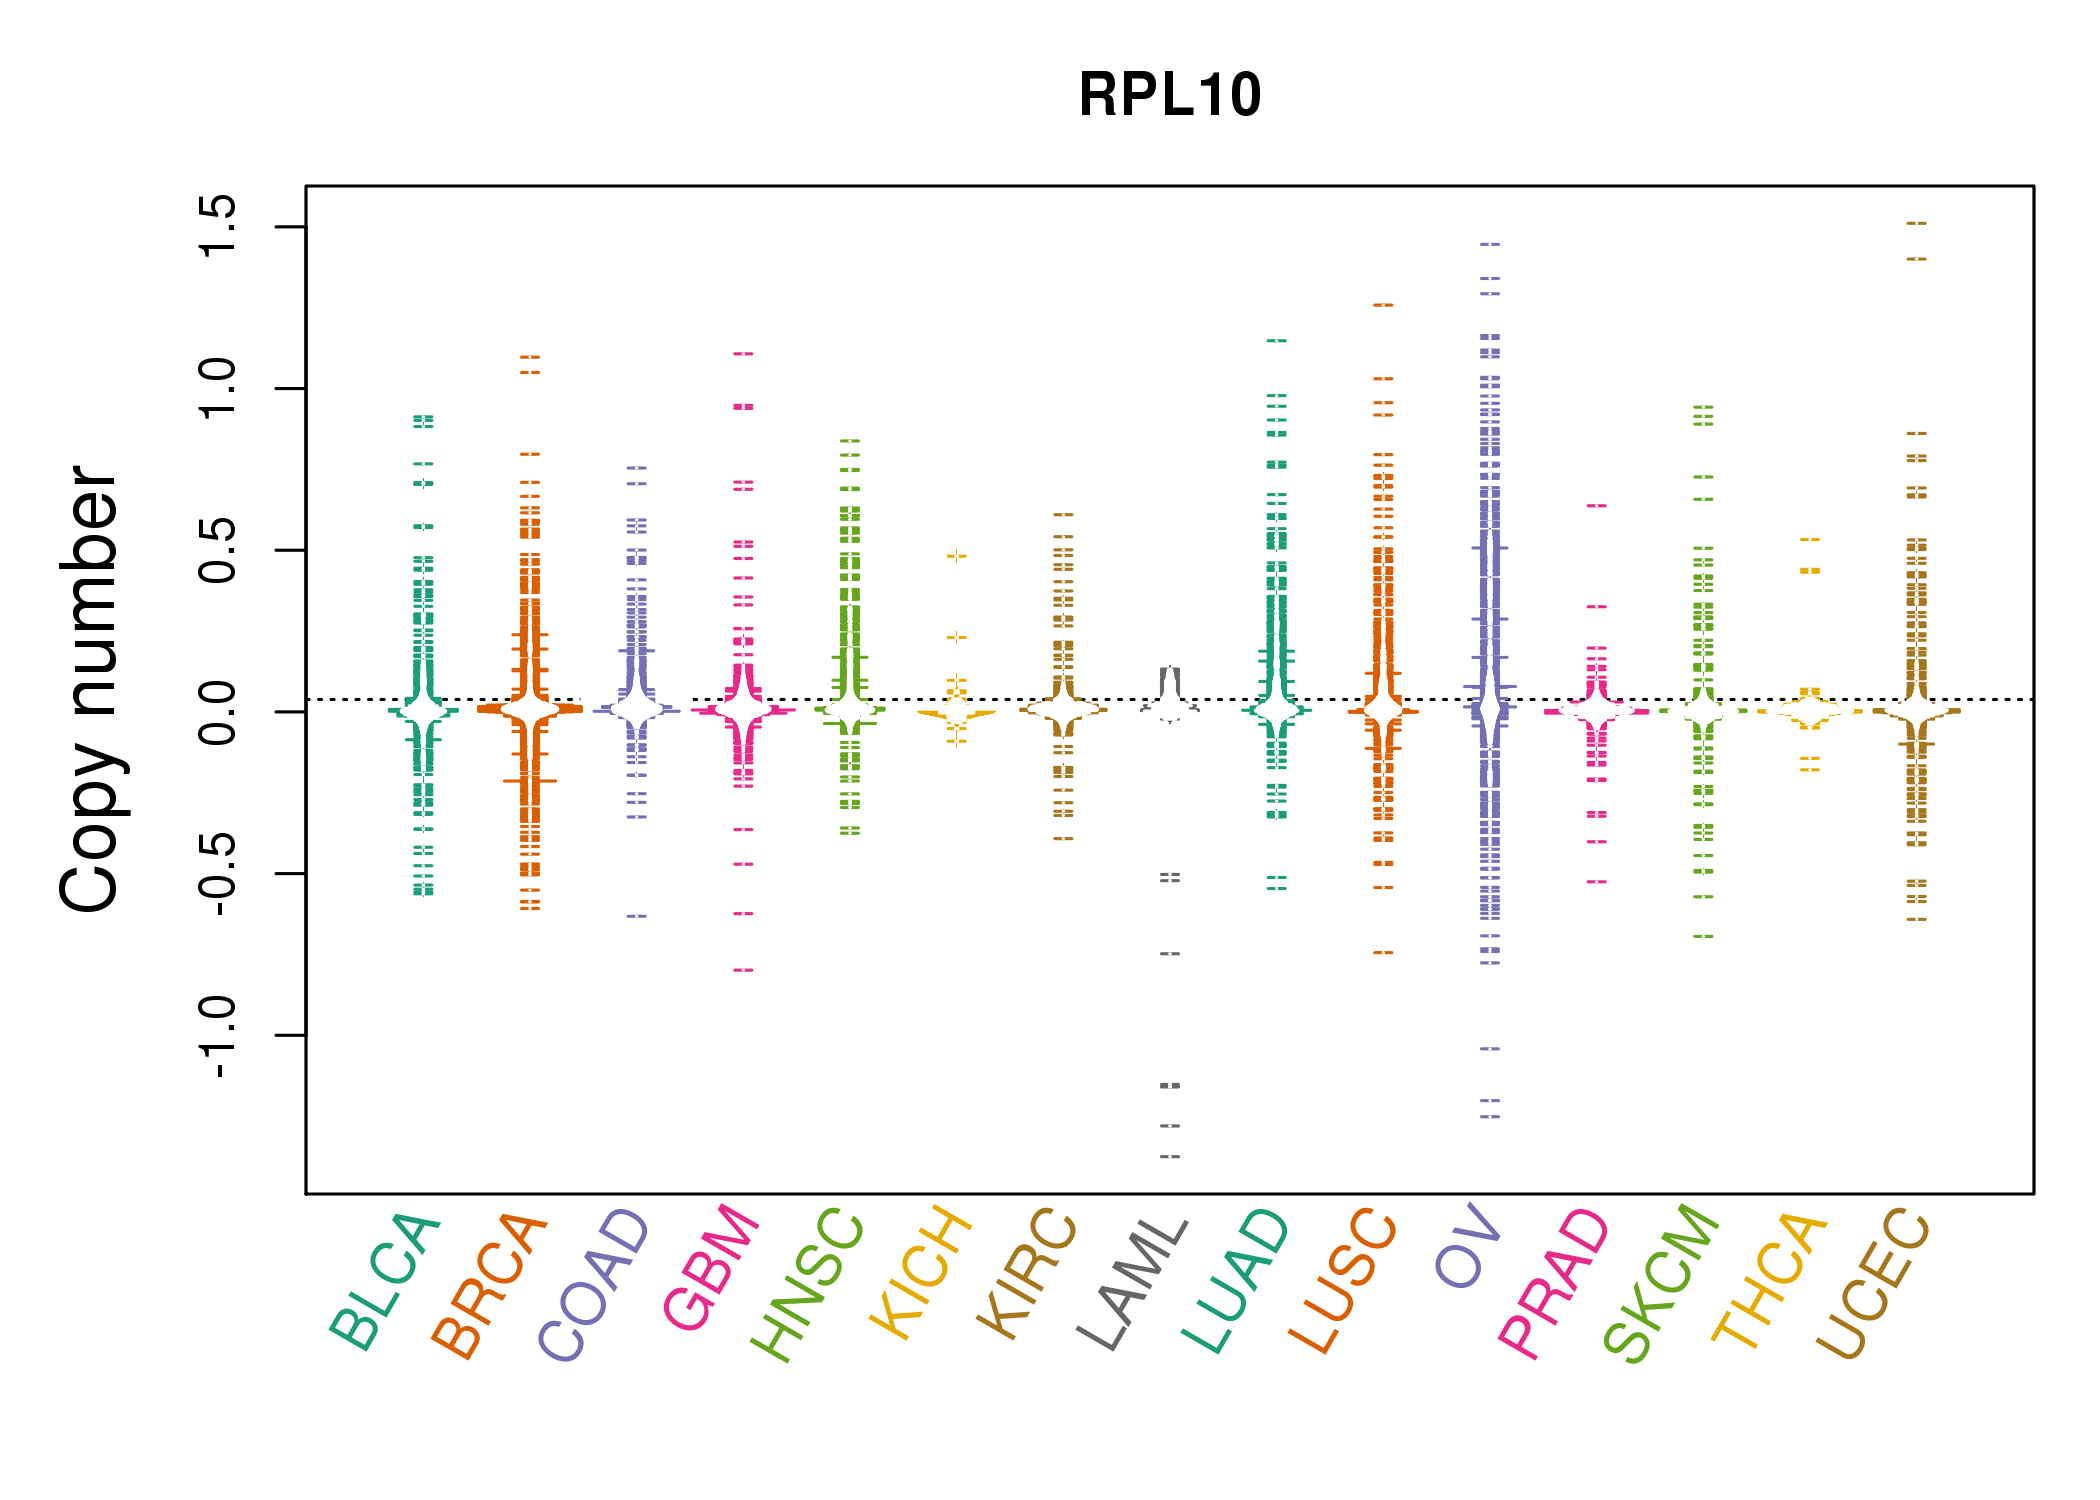 |
| cf) Tissue ID[Tissue type]: BLCA[Bladder Urothelial Carcinoma], BRCA[Breast invasive carcinoma], CESC[Cervical squamous cell carcinoma and endocervical adenocarcinoma], COAD[Colon adenocarcinoma], GBM[Glioblastoma multiforme], Glioma Low Grade, HNSC[Head and Neck squamous cell carcinoma], KICH[Kidney Chromophobe], KIRC[Kidney renal clear cell carcinoma], KIRP[Kidney renal papillary cell carcinoma], LAML[Acute Myeloid Leukemia], LUAD[Lung adenocarcinoma], LUSC[Lung squamous cell carcinoma], OV[Ovarian serous cystadenocarcinoma ], PAAD[Pancreatic adenocarcinoma], PRAD[Prostate adenocarcinoma], SKCM[Skin Cutaneous Melanoma], STAD[Stomach adenocarcinoma], THCA[Thyroid carcinoma], UCEC[Uterine Corpus Endometrial Carcinoma] |
| Top |
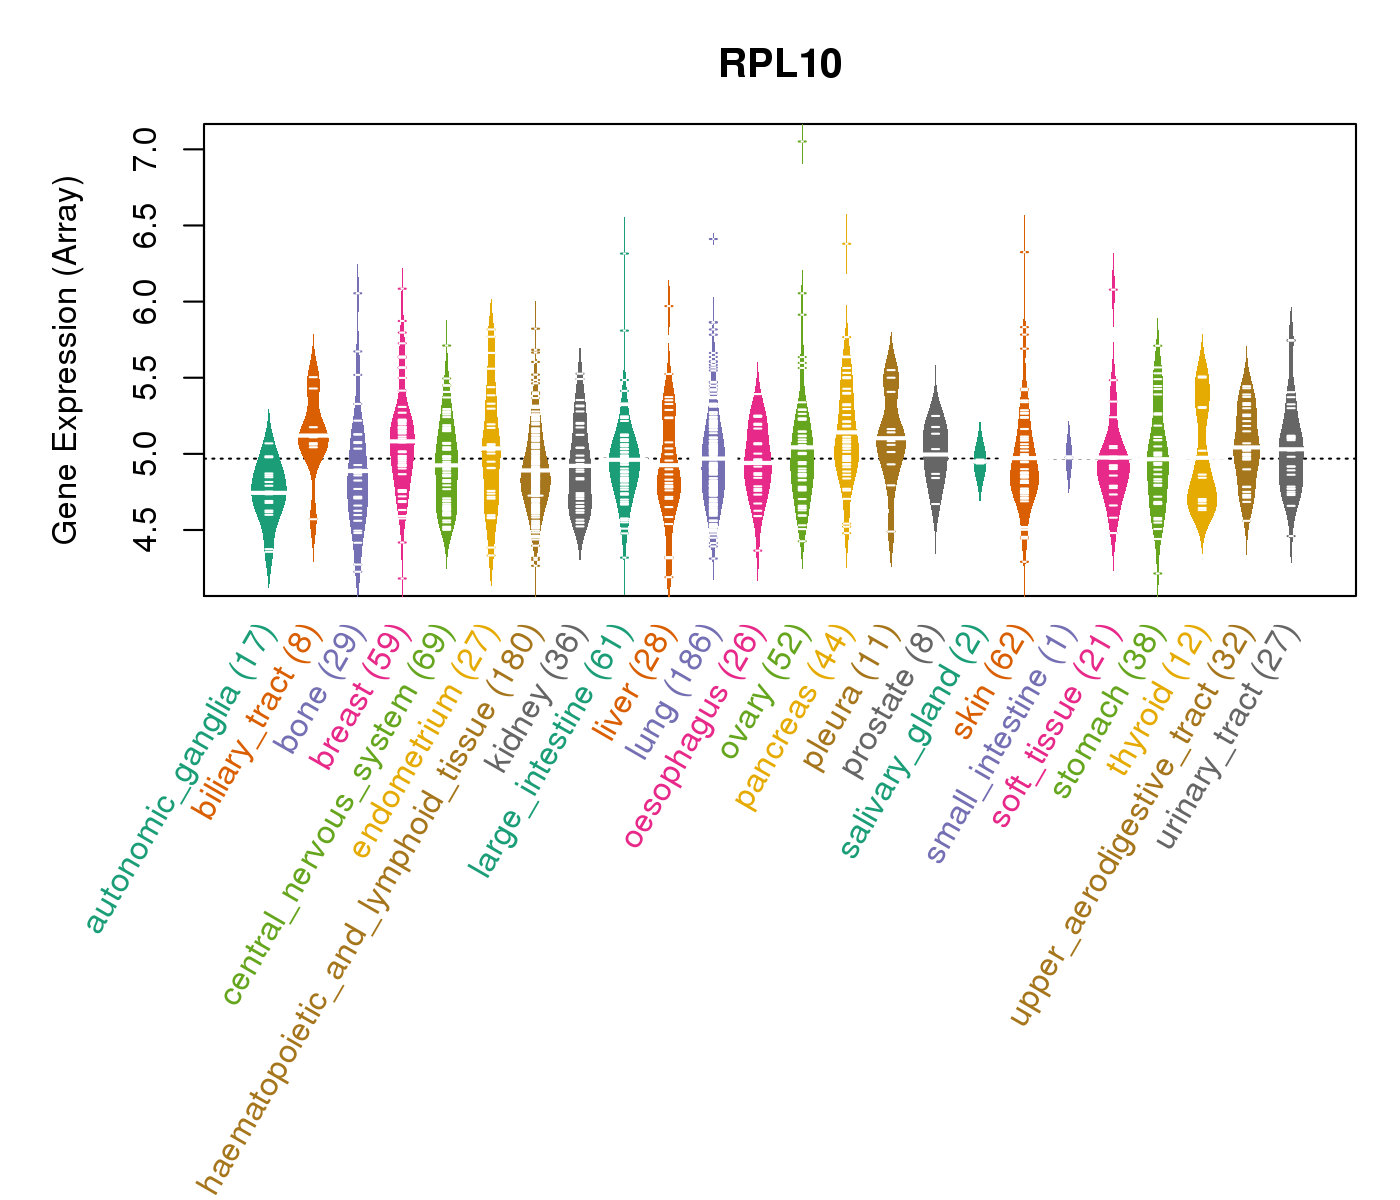
| Gene Expression for RPL10 |
| * CCLE gene expression data were extracted from CCLE_Expression_Entrez_2012-10-18.res: Gene-centric RMA-normalized mRNA expression data. |
 |
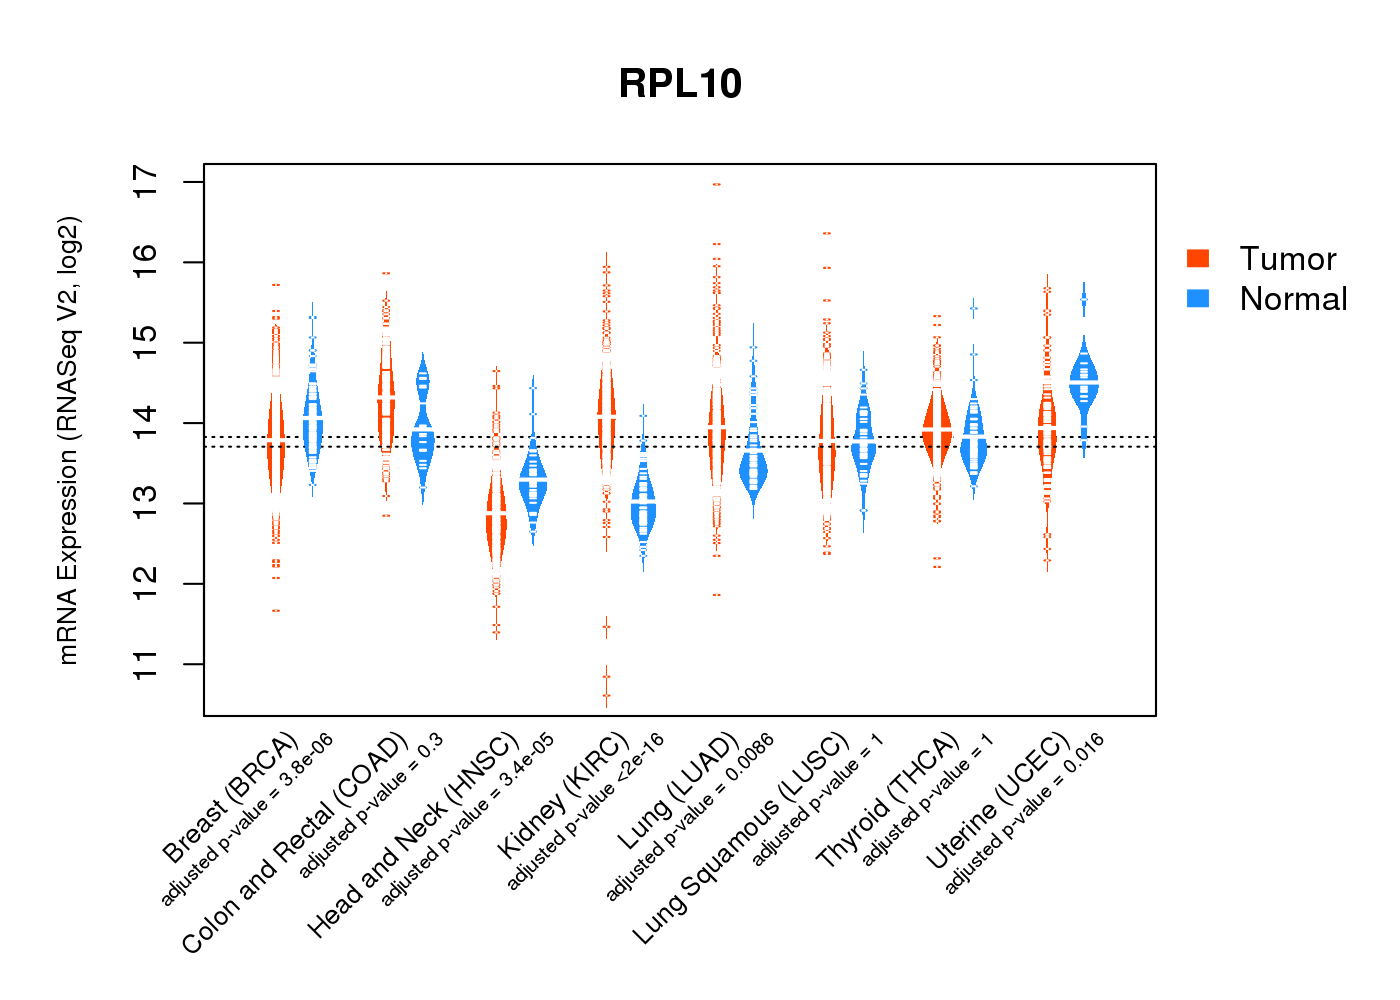
| * Normalized gene expression data of RNASeqV2 was extracted from TCGA using R package TCGA-Assembler. The URLs of all public data files on TCGA DCC data server were gathered at Jan-05-2015. Only eight cancer types have enough normal control samples for differential expression analysis. (t test, adjusted p<0.05 (using Benjamini-Hochberg FDR)) |
 |
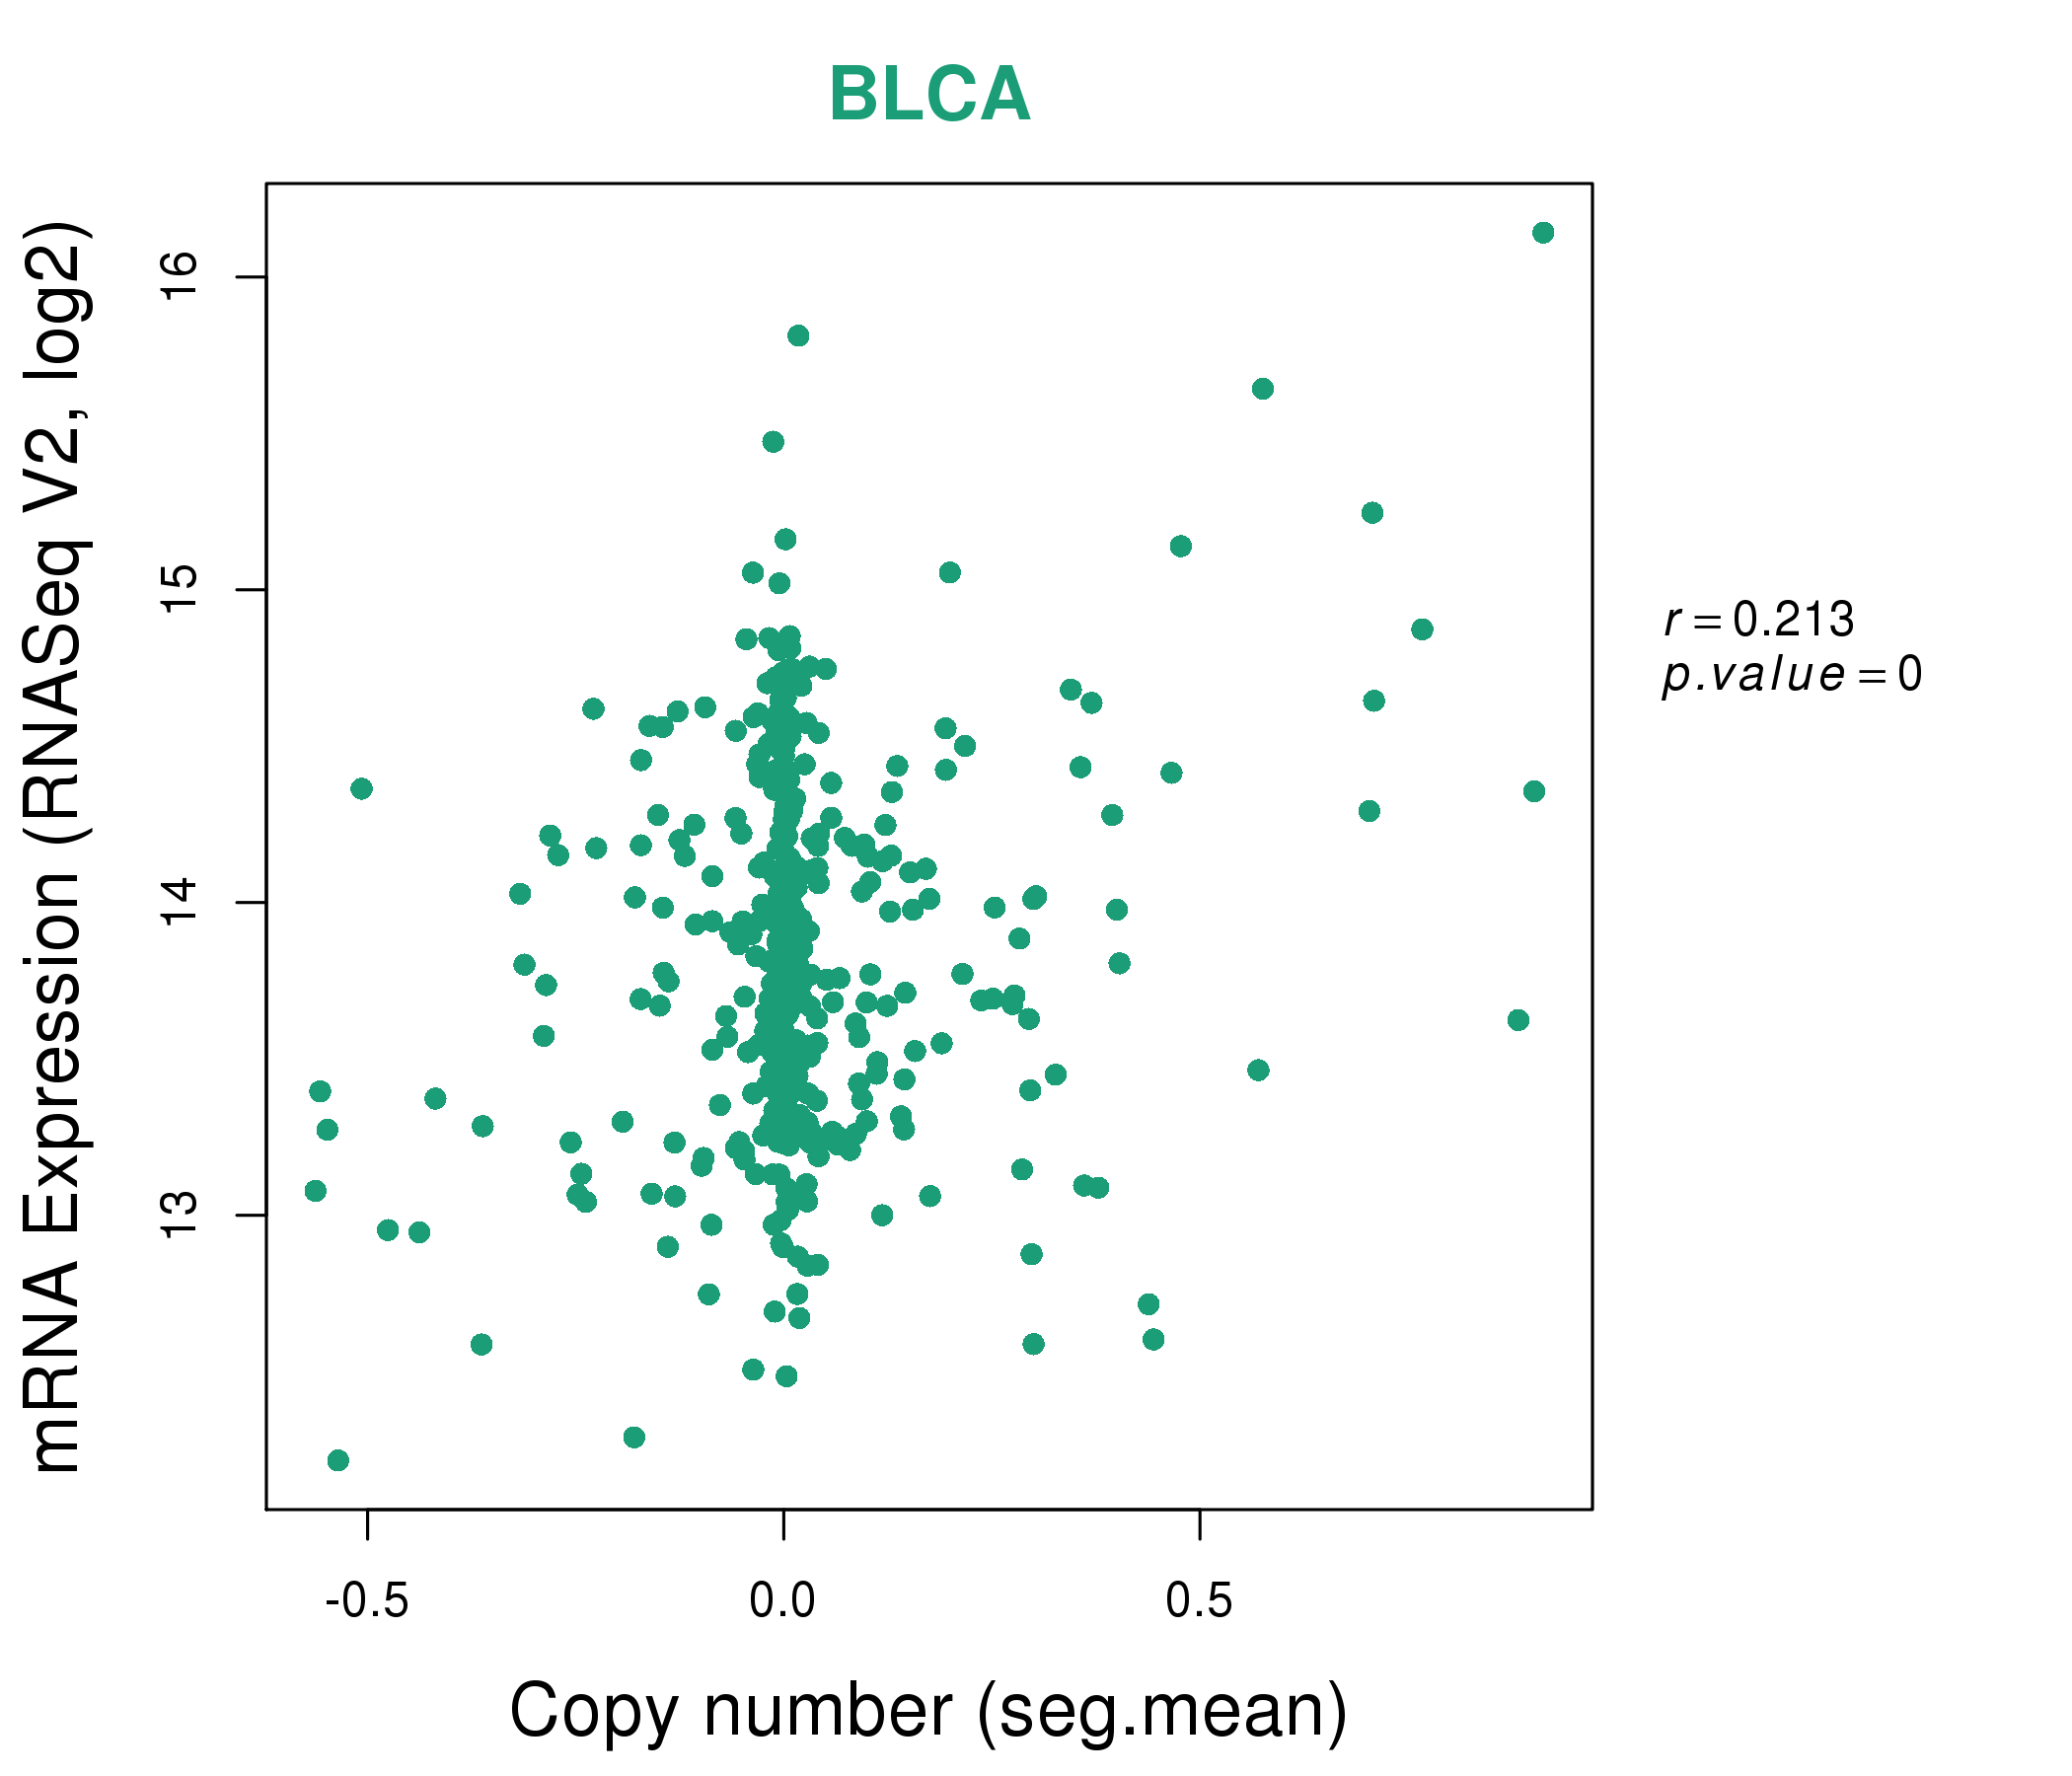
| Top |
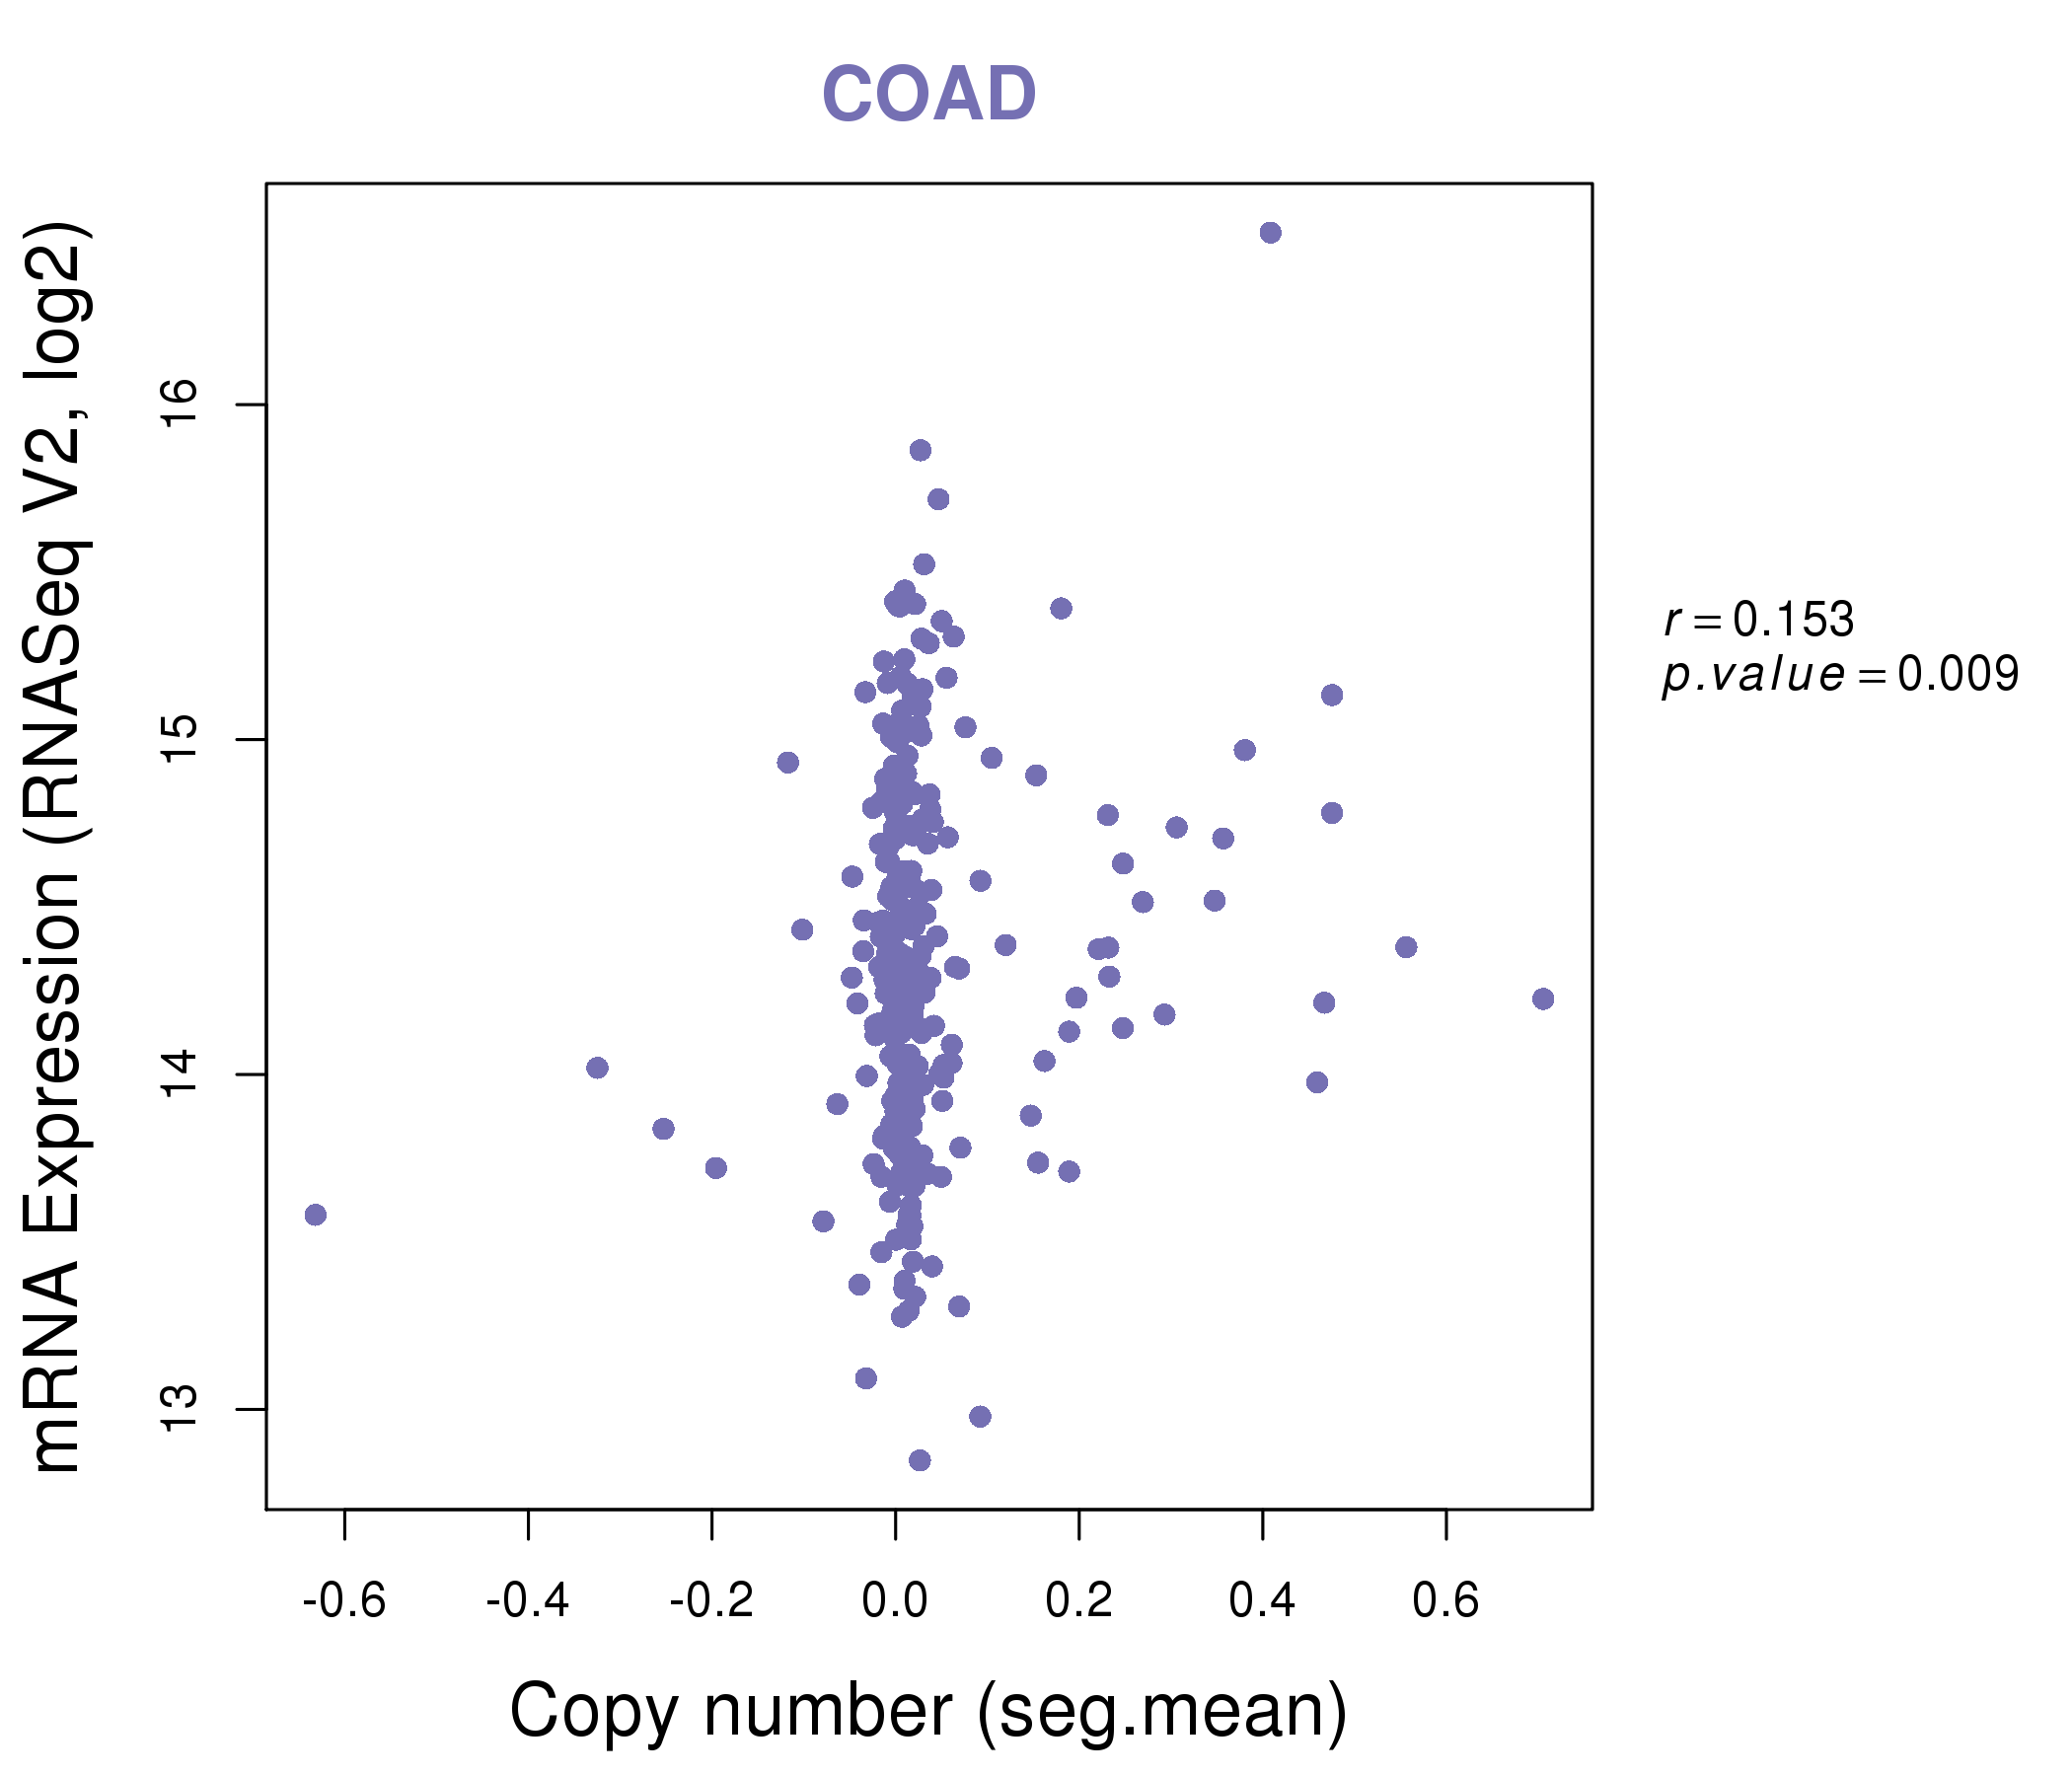
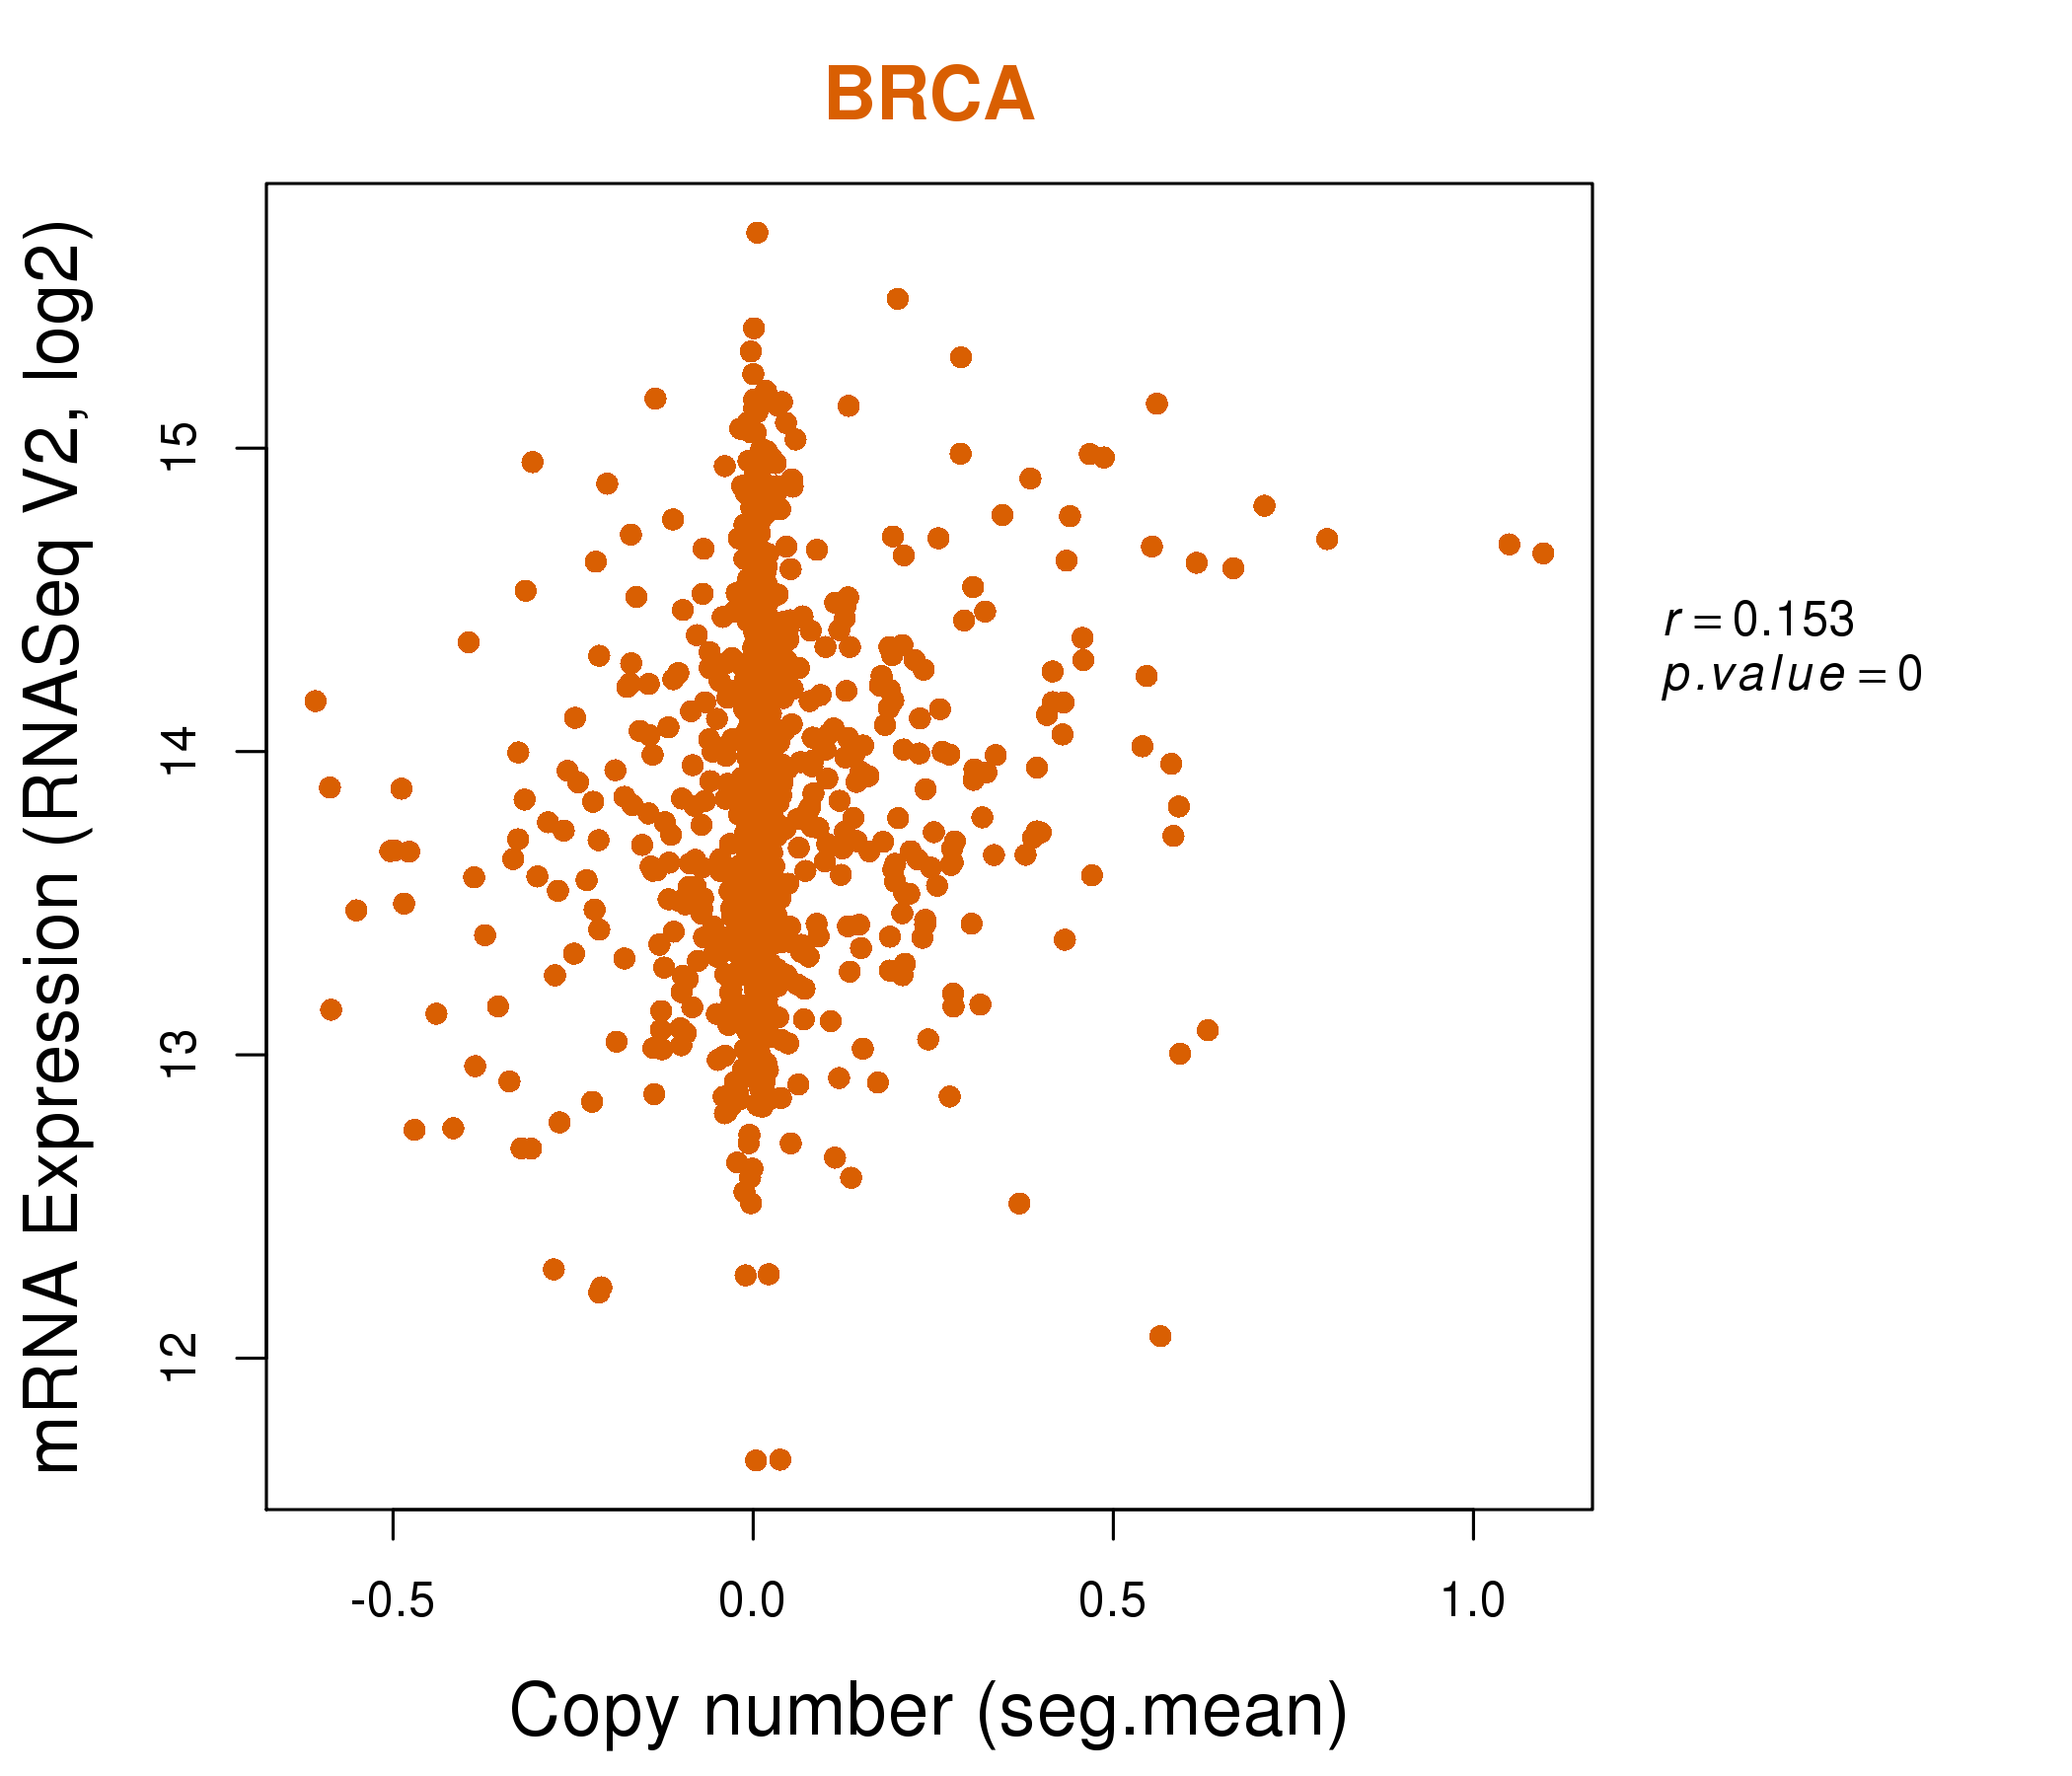
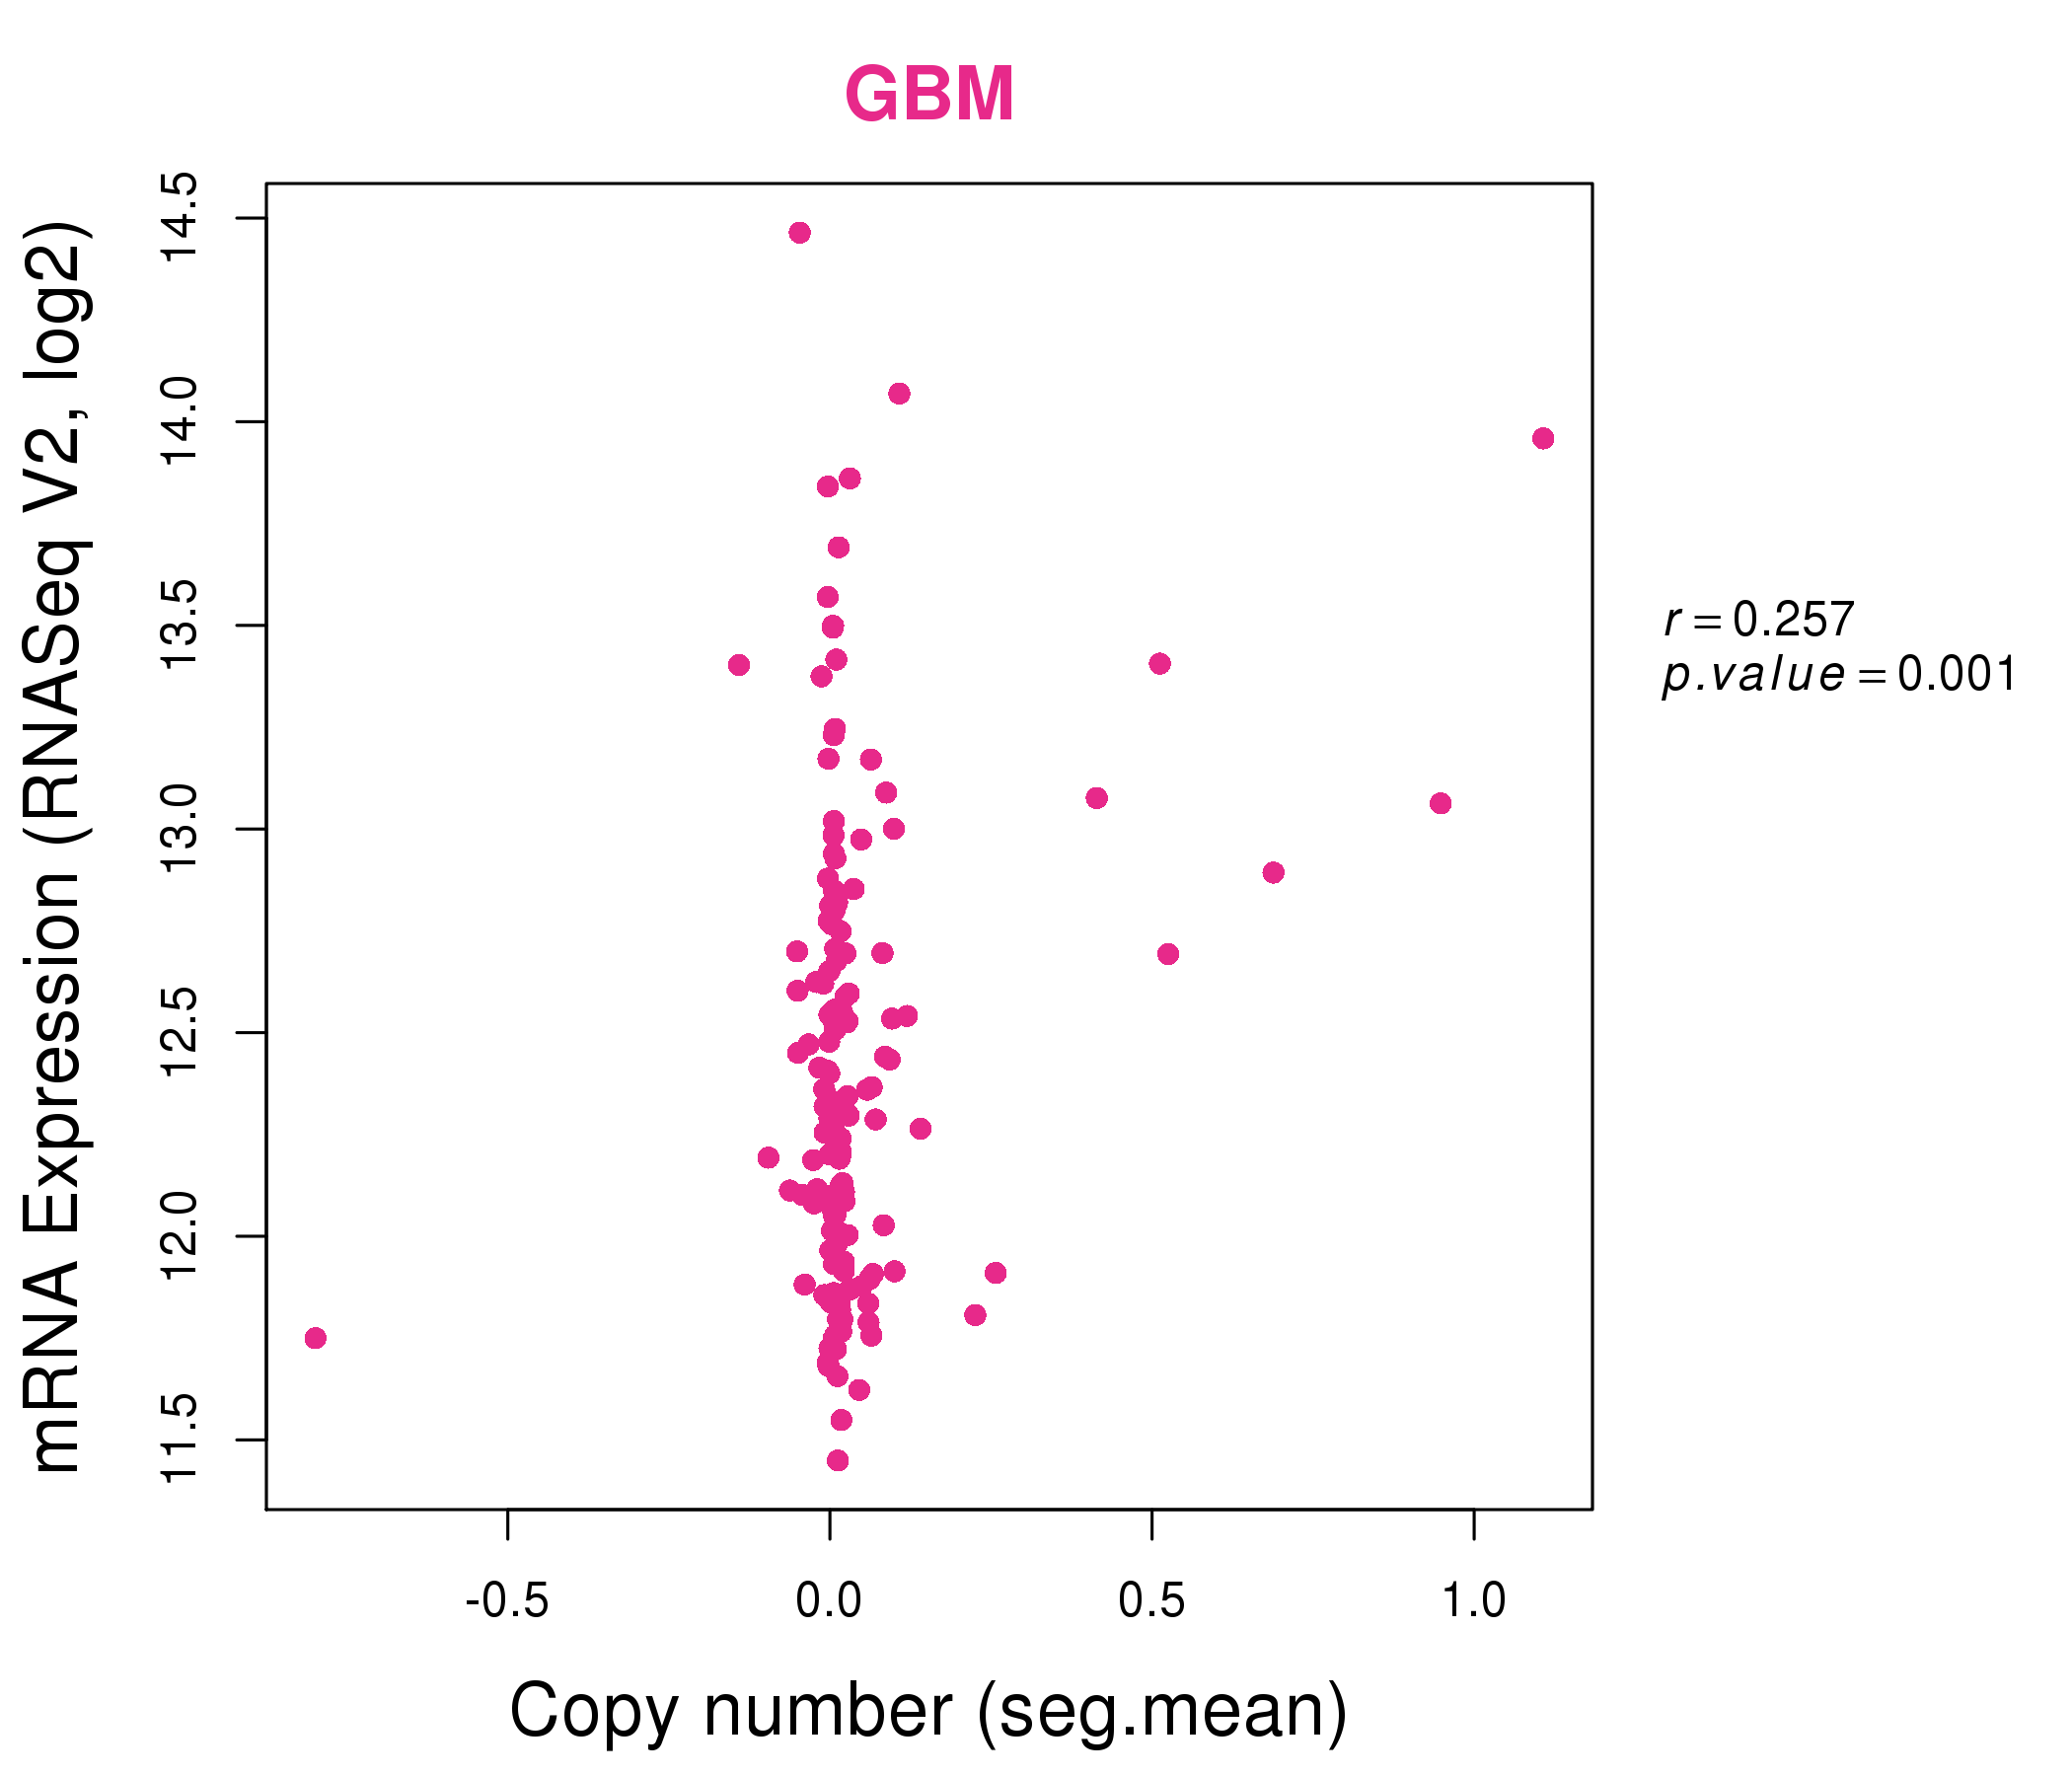
| * This plots show the correlation between CNV and gene expression. |
: Open all plots for all cancer types
 |
|
 |
|
| Top |
| Gene-Gene Network Information |
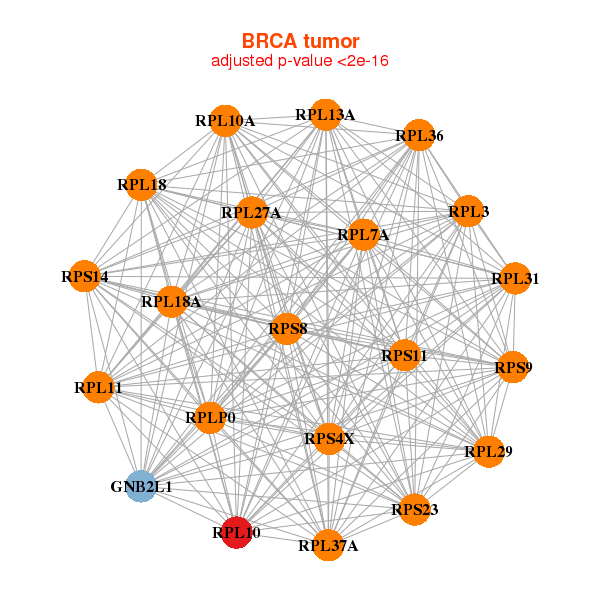
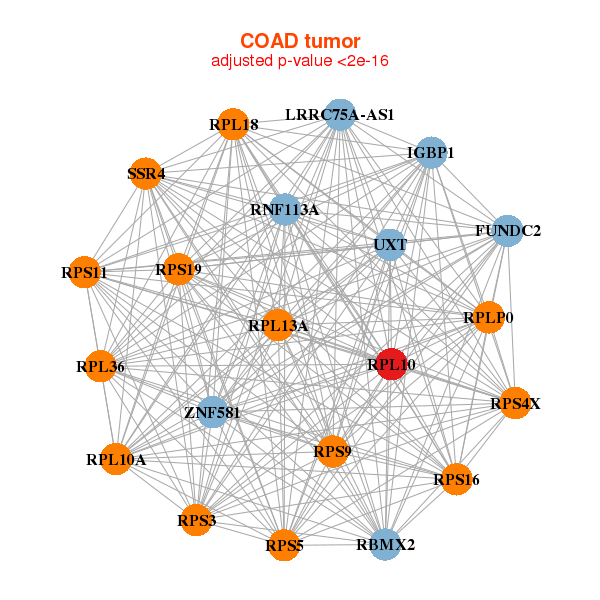
| * Co-Expression network figures were drawn using R package igraph. Only the top 20 genes with the highest correlations were shown. Red circle: input gene, orange circle: cell metabolism gene, sky circle: other gene |
: Open all plots for all cancer types
 |
|
| EEF1A1P9,EEF1B2,GNB2L1,RPL10,RPL10A,RPL11,RPL13A, RPL17,RPL31,RPL3,RPL37A,RPL41,RPL6,RPL7A, RPS10,RPS14,RPS18,RPS23,RPS4X,RPS8,RPS9 | EEF1B2,EEF1G,FBL,GNB2L1,RPL10,RPL10A,RPL12, RPL14,RPL5,RPL6,RPL7A,RPLP0,RPS14,RPS18, RPS2,RPS3,RPS4X,RPS5,RPS6,RPS8,RPSAP58 |
 |
|
| EEF1A1,EEF1B2,RPL10A,RPL12,RPL15,RPL32,RPL36, RPL5,RPL7A,RPS10,RPS11,RPS14,RPS15A,RPS18, RPS23,RPS29,RPS3,RPS3A,RPS6,RPS8,RPS9 | BOD1,C12orf57,DPH5,EEF1A1P9,RPL10,RPL10A,RPL15, RPL24,RPL29,RPL32,RPL35A,RPL41,RPL5,RPL7A, RPS11,RPS13,RPS14,RPS3A,RPS5,RPS6,RPS8 |
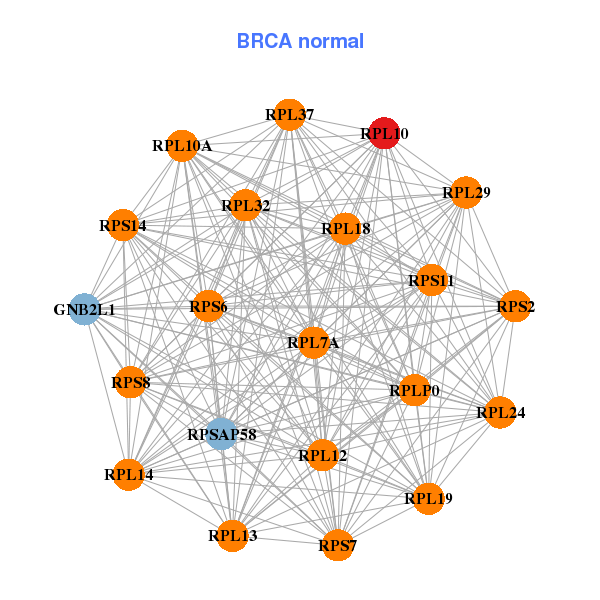
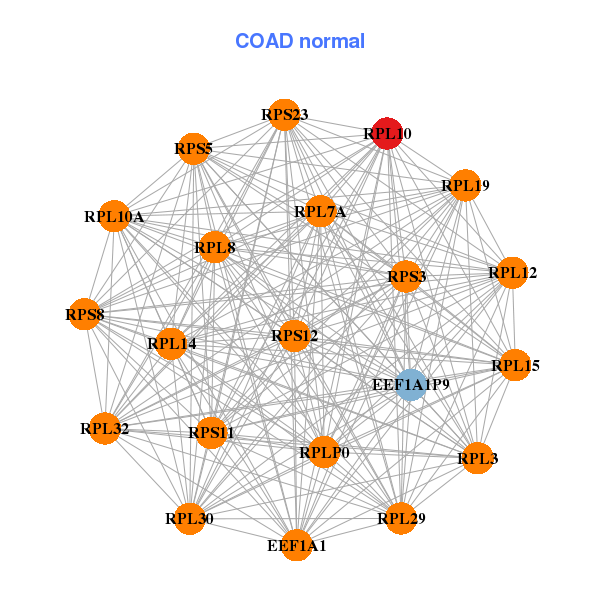
| * Co-Expression network figures were drawn using R package igraph. Only the top 20 genes with the highest correlations were shown. Red circle: input gene, orange circle: cell metabolism gene, sky circle: other gene |
: Open all plots for all cancer types
| Top |
: Open all interacting genes' information including KEGG pathway for all interacting genes from DAVID
| Top |
| Pharmacological Information for RPL10 |
| There's no related Drug. |
| Top |
| Cross referenced IDs for RPL10 |
| * We obtained these cross-references from Uniprot database. It covers 150 different DBs, 18 categories. http://www.uniprot.org/help/cross_references_section |
: Open all cross reference information
|
Copyright © 2016-Present - The Univsersity of Texas Health Science Center at Houston @ |