|
||||||||||||||||||||
| |
| Phenotypic Information (metabolism pathway, cancer, disease, phenome) |
| |
| |
| Gene-Gene Network Information: Co-Expression Network, Interacting Genes & KEGG |
| |
|


| Gene Summary for RPL13 |
| Top |
| Phenotypic Information for RPL13(metabolism pathway, cancer, disease, phenome) |
| Cancer | CGAP: RPL13 |
| Familial Cancer Database: RPL13 | |
| * This gene is included in those cancer gene databases. |
|
|
|
|
|
| . | ||||||||||||||
Oncogene 1 | Significant driver gene in | |||||||||||||||||||
| cf) number; DB name 1 Oncogene; http://nar.oxfordjournals.org/content/35/suppl_1/D721.long, 2 Tumor Suppressor gene; https://bioinfo.uth.edu/TSGene/, 3 Cancer Gene Census; http://www.nature.com/nrc/journal/v4/n3/abs/nrc1299.html, 4 CancerGenes; http://nar.oxfordjournals.org/content/35/suppl_1/D721.long, 5 Network of Cancer Gene; http://ncg.kcl.ac.uk/index.php, 1Therapeutic Vulnerabilities in Cancer; http://cbio.mskcc.org/cancergenomics/statius/ |
| REACTOME_METABOLISM_OF_PROTEINS REACTOME_METABOLISM_OF_MRNA REACTOME_METABOLISM_OF_RNA | |
| OMIM | |
| Orphanet | |
| Disease | KEGG Disease: RPL13 |
| MedGen: RPL13 (Human Medical Genetics with Condition) | |
| ClinVar: RPL13 | |
| Phenotype | MGI: RPL13 (International Mouse Phenotyping Consortium) |
| PhenomicDB: RPL13 | |
| Mutations for RPL13 |
| * Under tables are showing count per each tissue to give us broad intuition about tissue specific mutation patterns.You can go to the detailed page for each mutation database's web site. |
| There's no structural variation information in COSMIC data for this gene. |
| * From mRNA Sanger sequences, Chitars2.0 arranged chimeric transcripts. This table shows RPL13 related fusion information. |
| ID | Head Gene | Tail Gene | Accession | Gene_a | qStart_a | qEnd_a | Chromosome_a | tStart_a | tEnd_a | Gene_a | qStart_a | qEnd_a | Chromosome_a | tStart_a | tEnd_a |
| BE933378 | CLPTM1 | 13 | 315 | 19 | 45493770 | 45494627 | RPL13 | 306 | 467 | 16 | 89628766 | 89629419 | |
| AA063629 | RPL13 | 23 | 106 | 16 | 89629402 | 89629485 | MALAT1 | 99 | 439 | 11 | 65267662 | 65268002 | |
| BG331404 | RPL13 | 380 | 802 | 16 | 89627346 | 89628148 | MASP1 | 786 | 805 | 3 | 186994622 | 186994641 | |
| DW426670 | ARID5B | 17 | 154 | 10 | 63853954 | 63854091 | RPL13 | 153 | 281 | 16 | 89629340 | 89629468 | |
| DB231778 | RPL13 | 1 | 274 | 16 | 89627090 | 89627753 | TNFRSF21 | 270 | 574 | 6 | 47254163 | 47277287 | |
| CR748210 | MALAT1 | 1 | 341 | 11 | 65267662 | 65268002 | RPL13 | 334 | 417 | 16 | 89629402 | 89629485 | |
| DB270526 | RPL13 | 1 | 68 | 16 | 89627841 | 89627908 | PTRF | 69 | 543 | 17 | 40574800 | 40575274 | |
| AA524181 | RPL13 | 2 | 57 | 16 | 89629431 | 89629486 | MAPKAPK3 | 54 | 517 | 3 | 50677805 | 50683209 | |
| BE796741 | ENTPD1 | 102 | 125 | 10 | 97485323 | 97485346 | RPL13 | 120 | 751 | 16 | 89627137 | 89628145 | |
| DA534037 | DDX5 | 4 | 366 | 17 | 62500802 | 62502397 | RPL13 | 366 | 540 | 16 | 89630778 | 89630952 | |
| BG423236 | AGRN | 2 | 68 | 1 | 991423 | 991489 | RPL13 | 61 | 291 | 16 | 89628763 | 89629485 | |
| BC080536 | MRP63 | 729 | 1371 | 13 | 21750816 | 21751651 | RPL13 | 1372 | 2068 | 16 | 89627104 | 89629474 | |
| Top |
| There's no copy number variation information in COSMIC data for this gene. |
| Top |
|
 |
| Top |
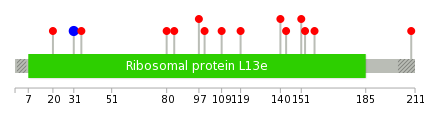
| Stat. for Non-Synonymous SNVs (# total SNVs=9) | (# total SNVs=1) |
 |  |
(# total SNVs=0) | (# total SNVs=0) |
| Top |
| * When you move the cursor on each content, you can see more deailed mutation information on the Tooltip. Those are primary_site,primary_histology,mutation(aa),pubmedID. |
| GRCh37 position | Mutation(aa) | Unique sampleID count |
| chr16:89627460-89627460 | p.R31R | 3 |
| chr16:89627425-89627425 | p.R20W | 1 |
| chr16:89628774-89628774 | p.T151S | 1 |
| chr16:89628779-89628779 | p.P153S | 1 |
| chr16:89627471-89627471 | p.R35I | 1 |
| chr16:89628795-89628795 | p.R158Q | 1 |
| chr16:89627768-89627768 | p.E80K | 1 |
| chr16:89629441-89629441 | p.K209N | 1 |
| chr16:89627990-89627990 | p.A84G | 1 |
| chr16:89628029-89628029 | p.S97Y | 1 |
| Top |
|
 |
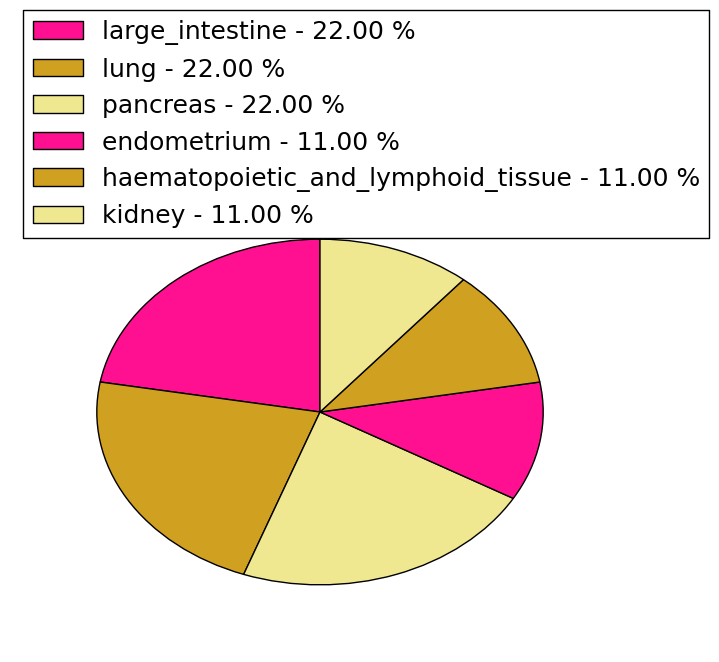
| Point Mutation/ Tissue ID | 1 | 2 | 3 | 4 | 5 | 6 | 7 | 8 | 9 | 10 | 11 | 12 | 13 | 14 | 15 | 16 | 17 | 18 | 19 | 20 |
| # sample | 1 | 1 | 1 | 2 | 1 | |||||||||||||||
| # mutation | 1 | 1 | 1 | 2 | 1 | |||||||||||||||
| nonsynonymous SNV | 1 | 1 | 1 | 1 | 1 | |||||||||||||||
| synonymous SNV | 1 |
| cf) Tissue ID; Tissue type (1; BLCA[Bladder Urothelial Carcinoma], 2; BRCA[Breast invasive carcinoma], 3; CESC[Cervical squamous cell carcinoma and endocervical adenocarcinoma], 4; COAD[Colon adenocarcinoma], 5; GBM[Glioblastoma multiforme], 6; Glioma Low Grade, 7; HNSC[Head and Neck squamous cell carcinoma], 8; KICH[Kidney Chromophobe], 9; KIRC[Kidney renal clear cell carcinoma], 10; KIRP[Kidney renal papillary cell carcinoma], 11; LAML[Acute Myeloid Leukemia], 12; LUAD[Lung adenocarcinoma], 13; LUSC[Lung squamous cell carcinoma], 14; OV[Ovarian serous cystadenocarcinoma ], 15; PAAD[Pancreatic adenocarcinoma], 16; PRAD[Prostate adenocarcinoma], 17; SKCM[Skin Cutaneous Melanoma], 18:STAD[Stomach adenocarcinoma], 19:THCA[Thyroid carcinoma], 20:UCEC[Uterine Corpus Endometrial Carcinoma]) |
| Top |
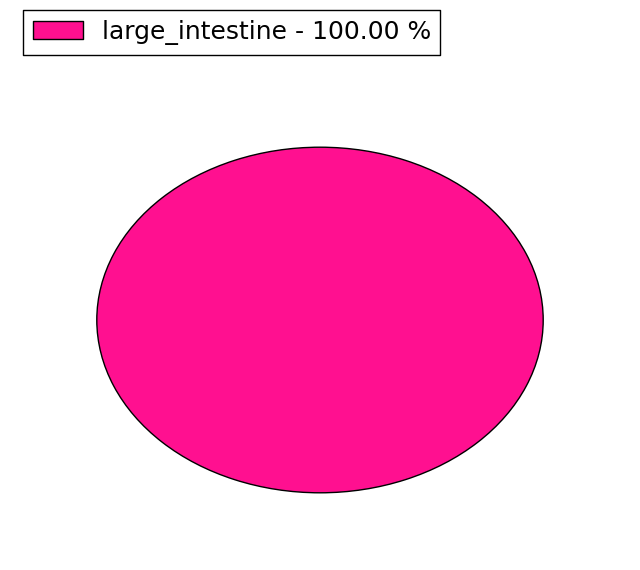
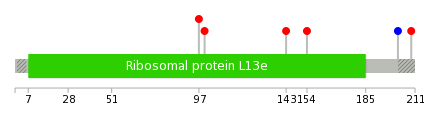
| * We represented just top 10 SNVs. When you move the cursor on each content, you can see more deailed mutation information on the Tooltip. Those are primary_site, primary_histology, mutation(aa), pubmedID. |
| Genomic Position | Mutation(aa) | Unique sampleID count |
| chr16:89628029 | p.S97Y,RPL13 | 1 |
| chr16:89628037 | p.P100T,RPL13 | 1 |
| chr16:89628749 | p.E143K,RPL13 | 1 |
| chr16:89628783 | p.V154A,RPL13 | 1 |
| chr16:89629420 | p.A202A,RPL13 | 1 |
| chr16:89629441 | p.K209N,RPL13 | 1 |
| * Copy number data were extracted from TCGA using R package TCGA-Assembler. The URLs of all public data files on TCGA DCC data server were gathered on Jan-05-2015. Function ProcessCNAData in TCGA-Assembler package was used to obtain gene-level copy number value which is calculated as the average copy number of the genomic region of a gene. |
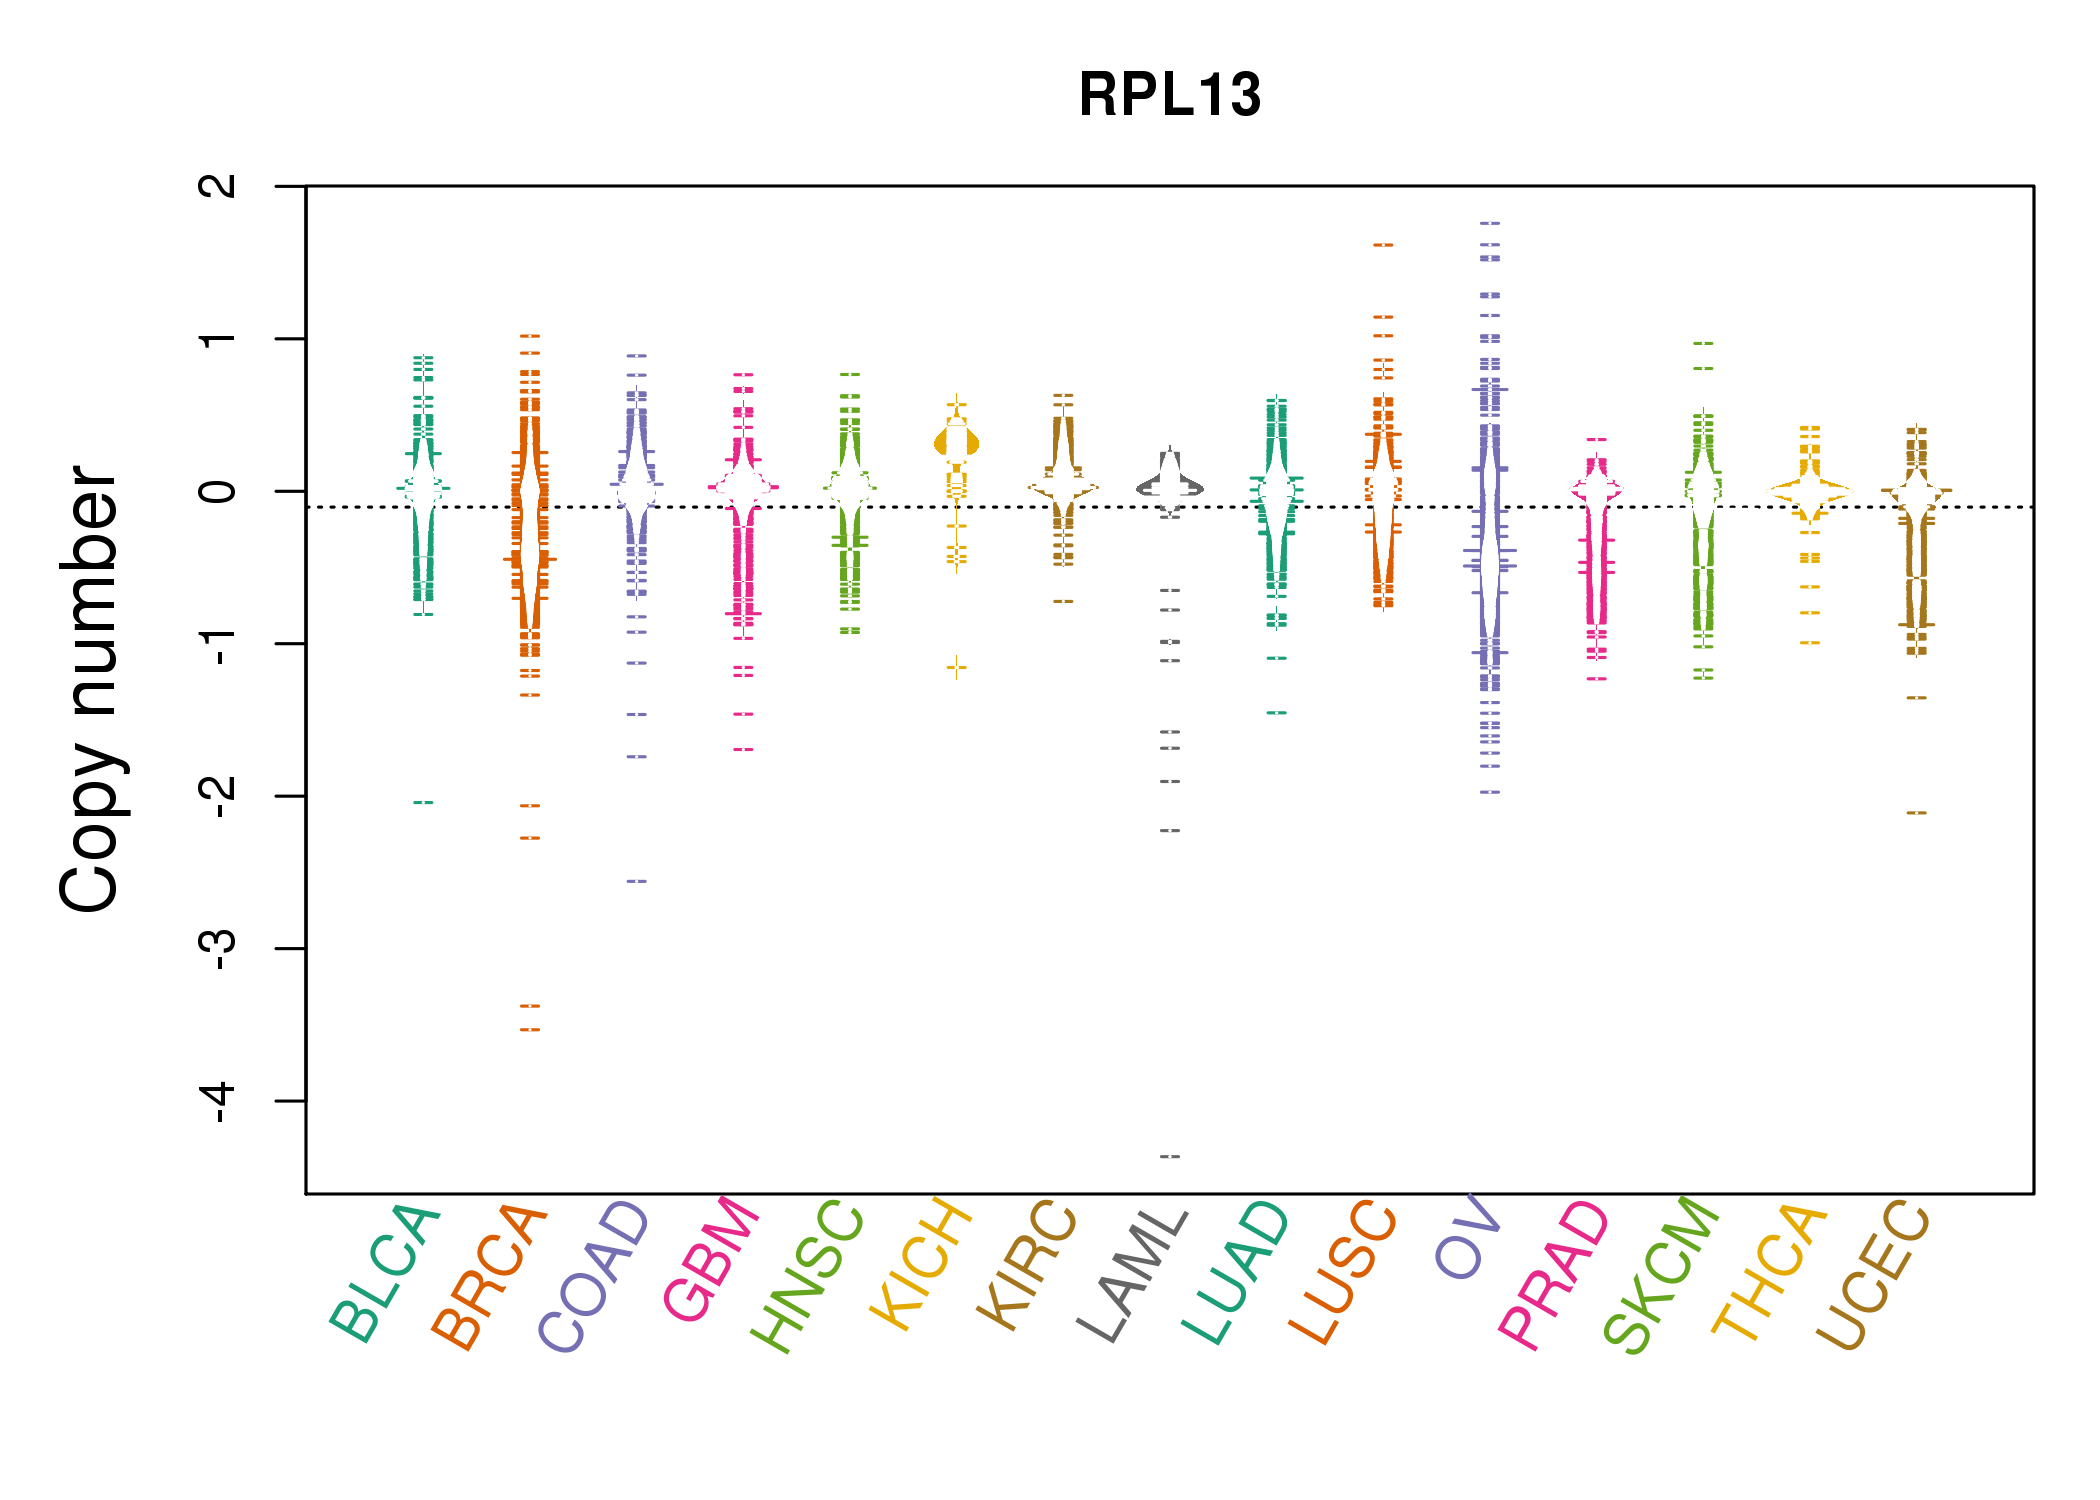 |
| cf) Tissue ID[Tissue type]: BLCA[Bladder Urothelial Carcinoma], BRCA[Breast invasive carcinoma], CESC[Cervical squamous cell carcinoma and endocervical adenocarcinoma], COAD[Colon adenocarcinoma], GBM[Glioblastoma multiforme], Glioma Low Grade, HNSC[Head and Neck squamous cell carcinoma], KICH[Kidney Chromophobe], KIRC[Kidney renal clear cell carcinoma], KIRP[Kidney renal papillary cell carcinoma], LAML[Acute Myeloid Leukemia], LUAD[Lung adenocarcinoma], LUSC[Lung squamous cell carcinoma], OV[Ovarian serous cystadenocarcinoma ], PAAD[Pancreatic adenocarcinoma], PRAD[Prostate adenocarcinoma], SKCM[Skin Cutaneous Melanoma], STAD[Stomach adenocarcinoma], THCA[Thyroid carcinoma], UCEC[Uterine Corpus Endometrial Carcinoma] |
| Top |
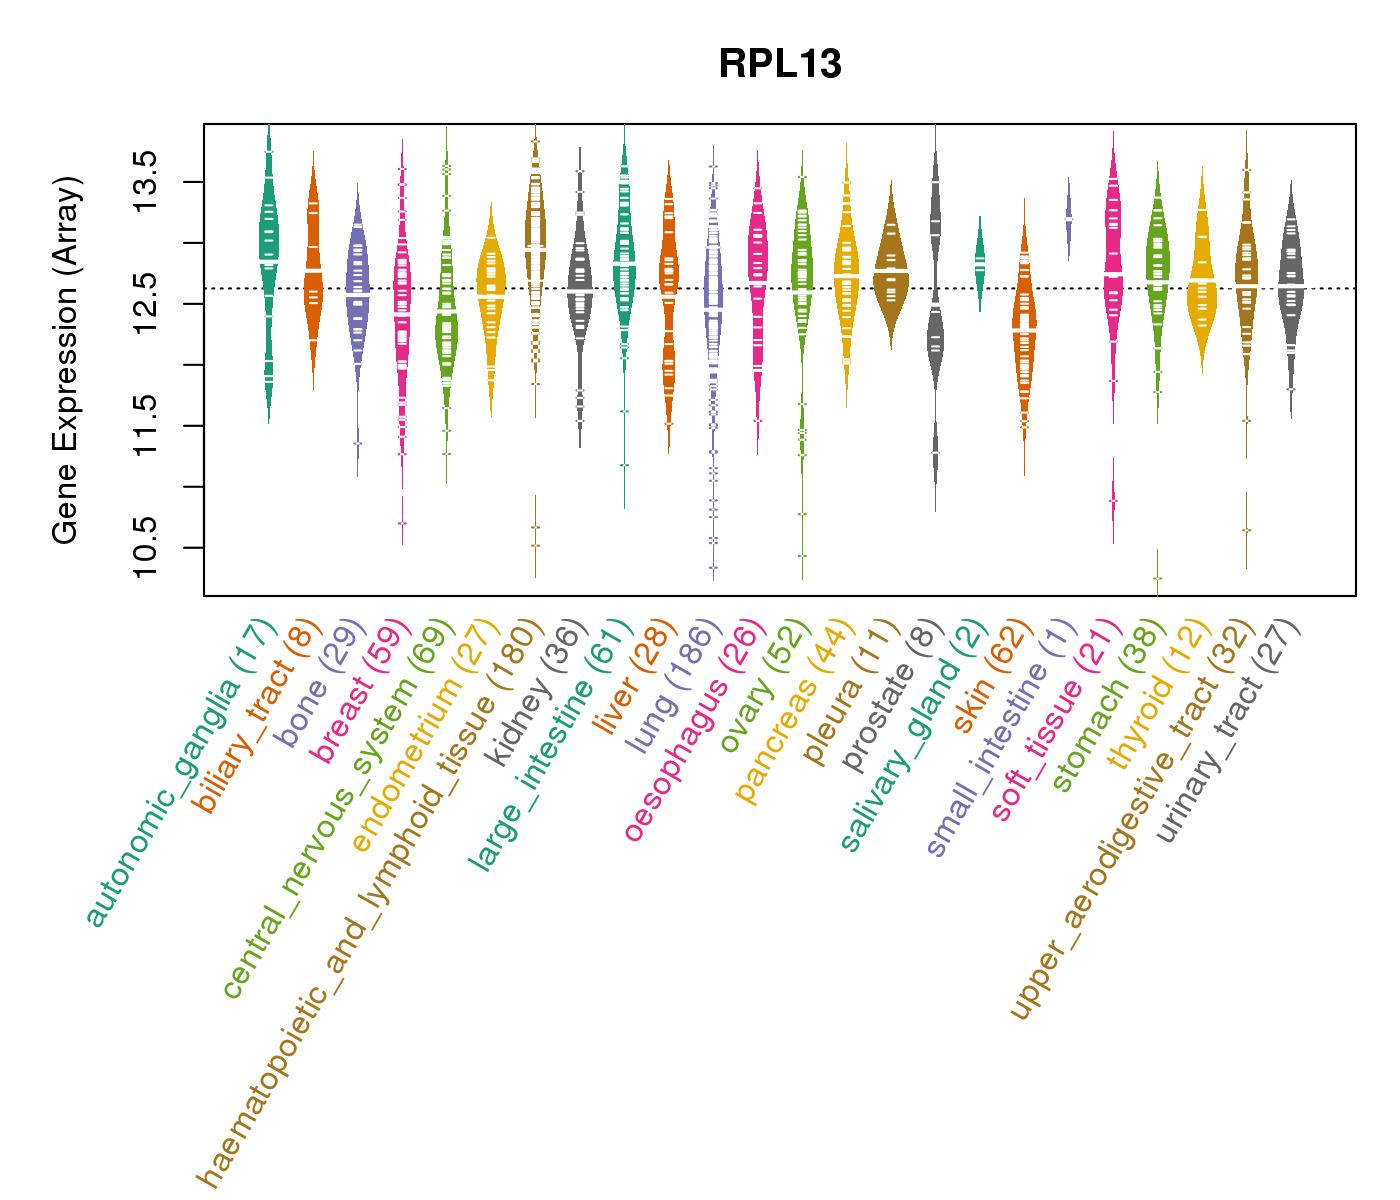
| Gene Expression for RPL13 |
| * CCLE gene expression data were extracted from CCLE_Expression_Entrez_2012-10-18.res: Gene-centric RMA-normalized mRNA expression data. |
 |
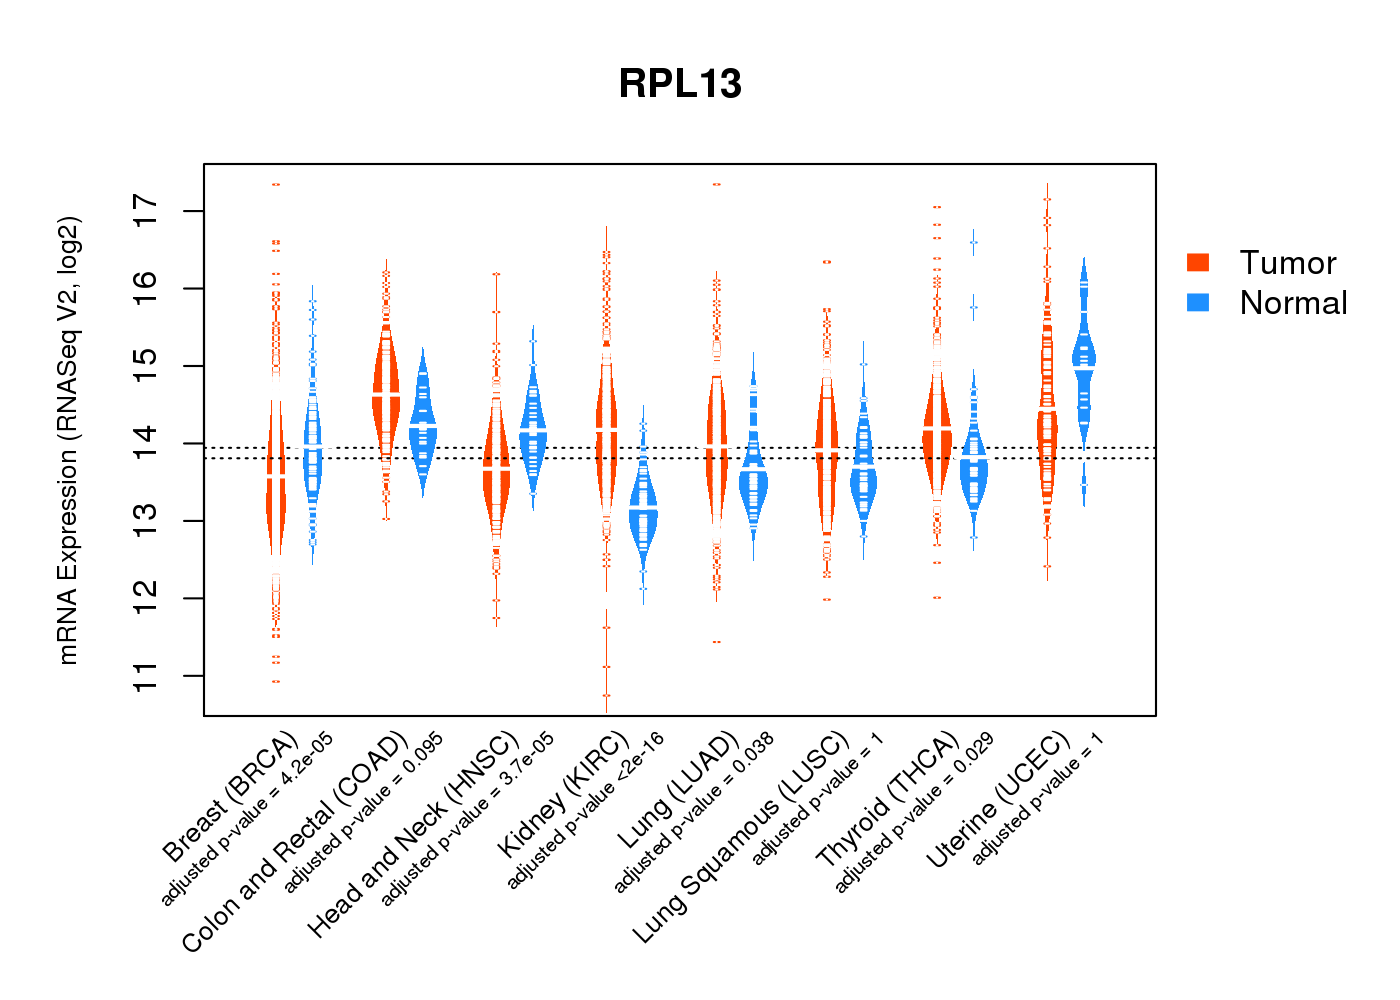
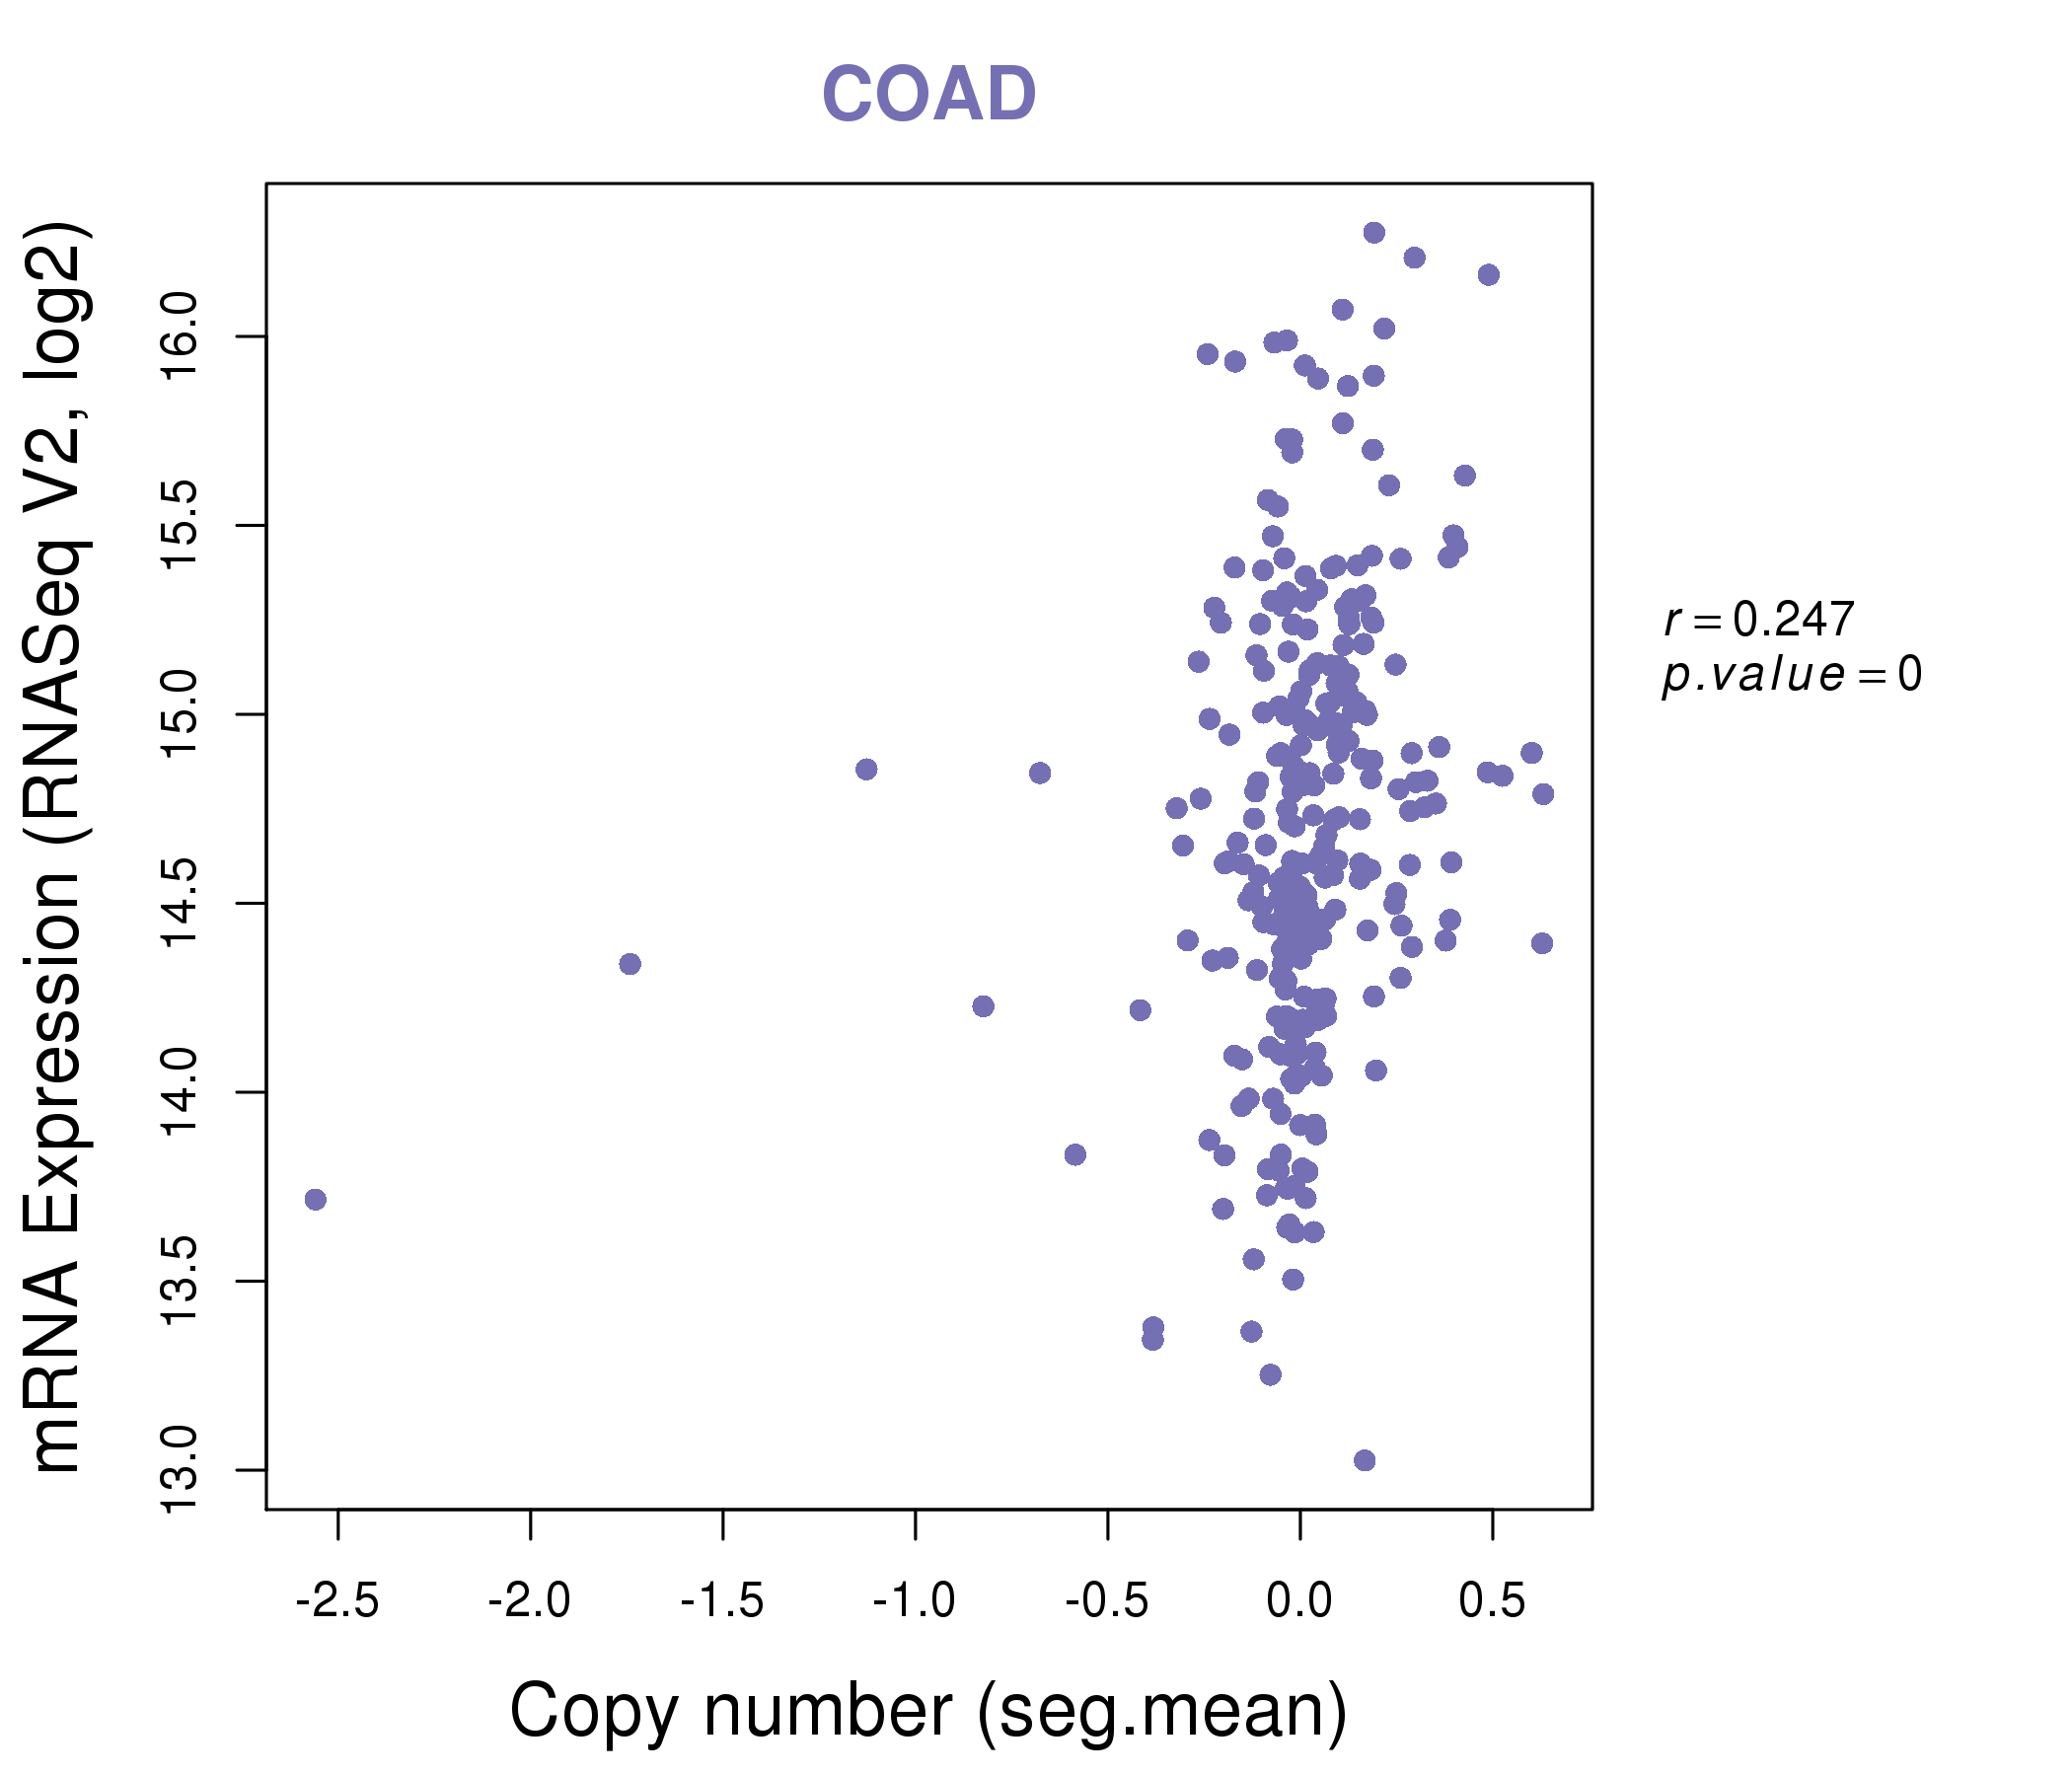
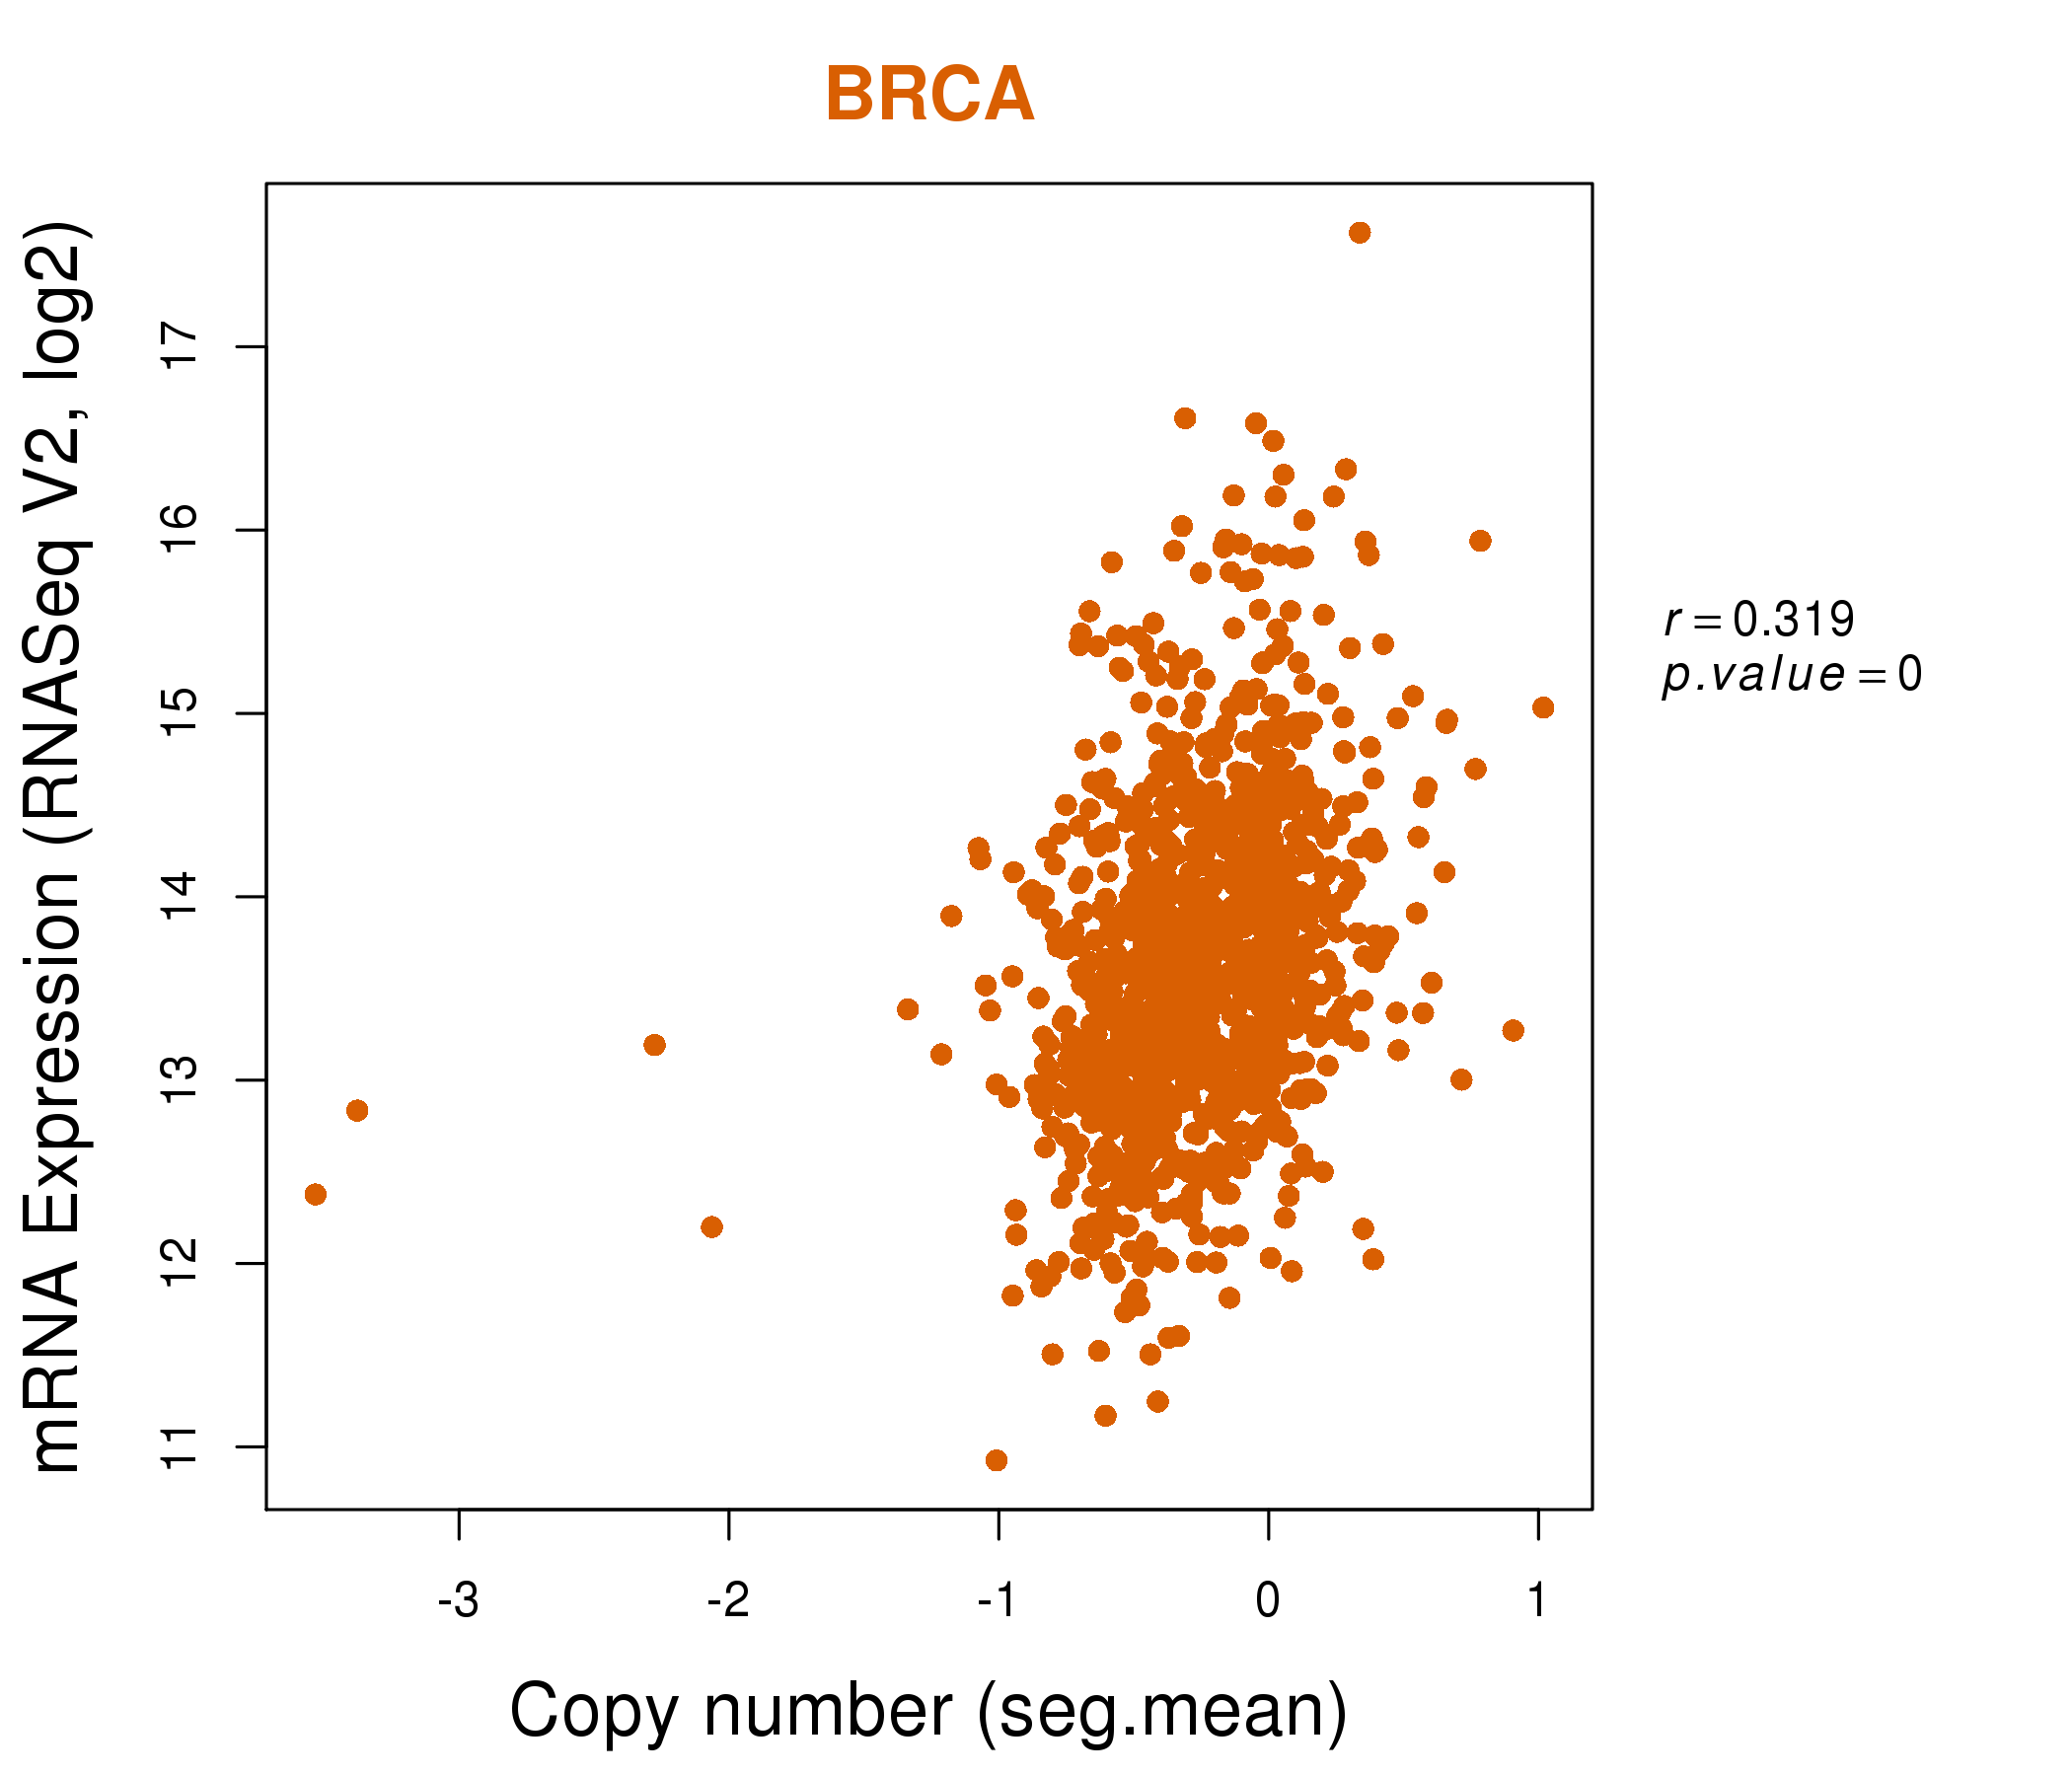
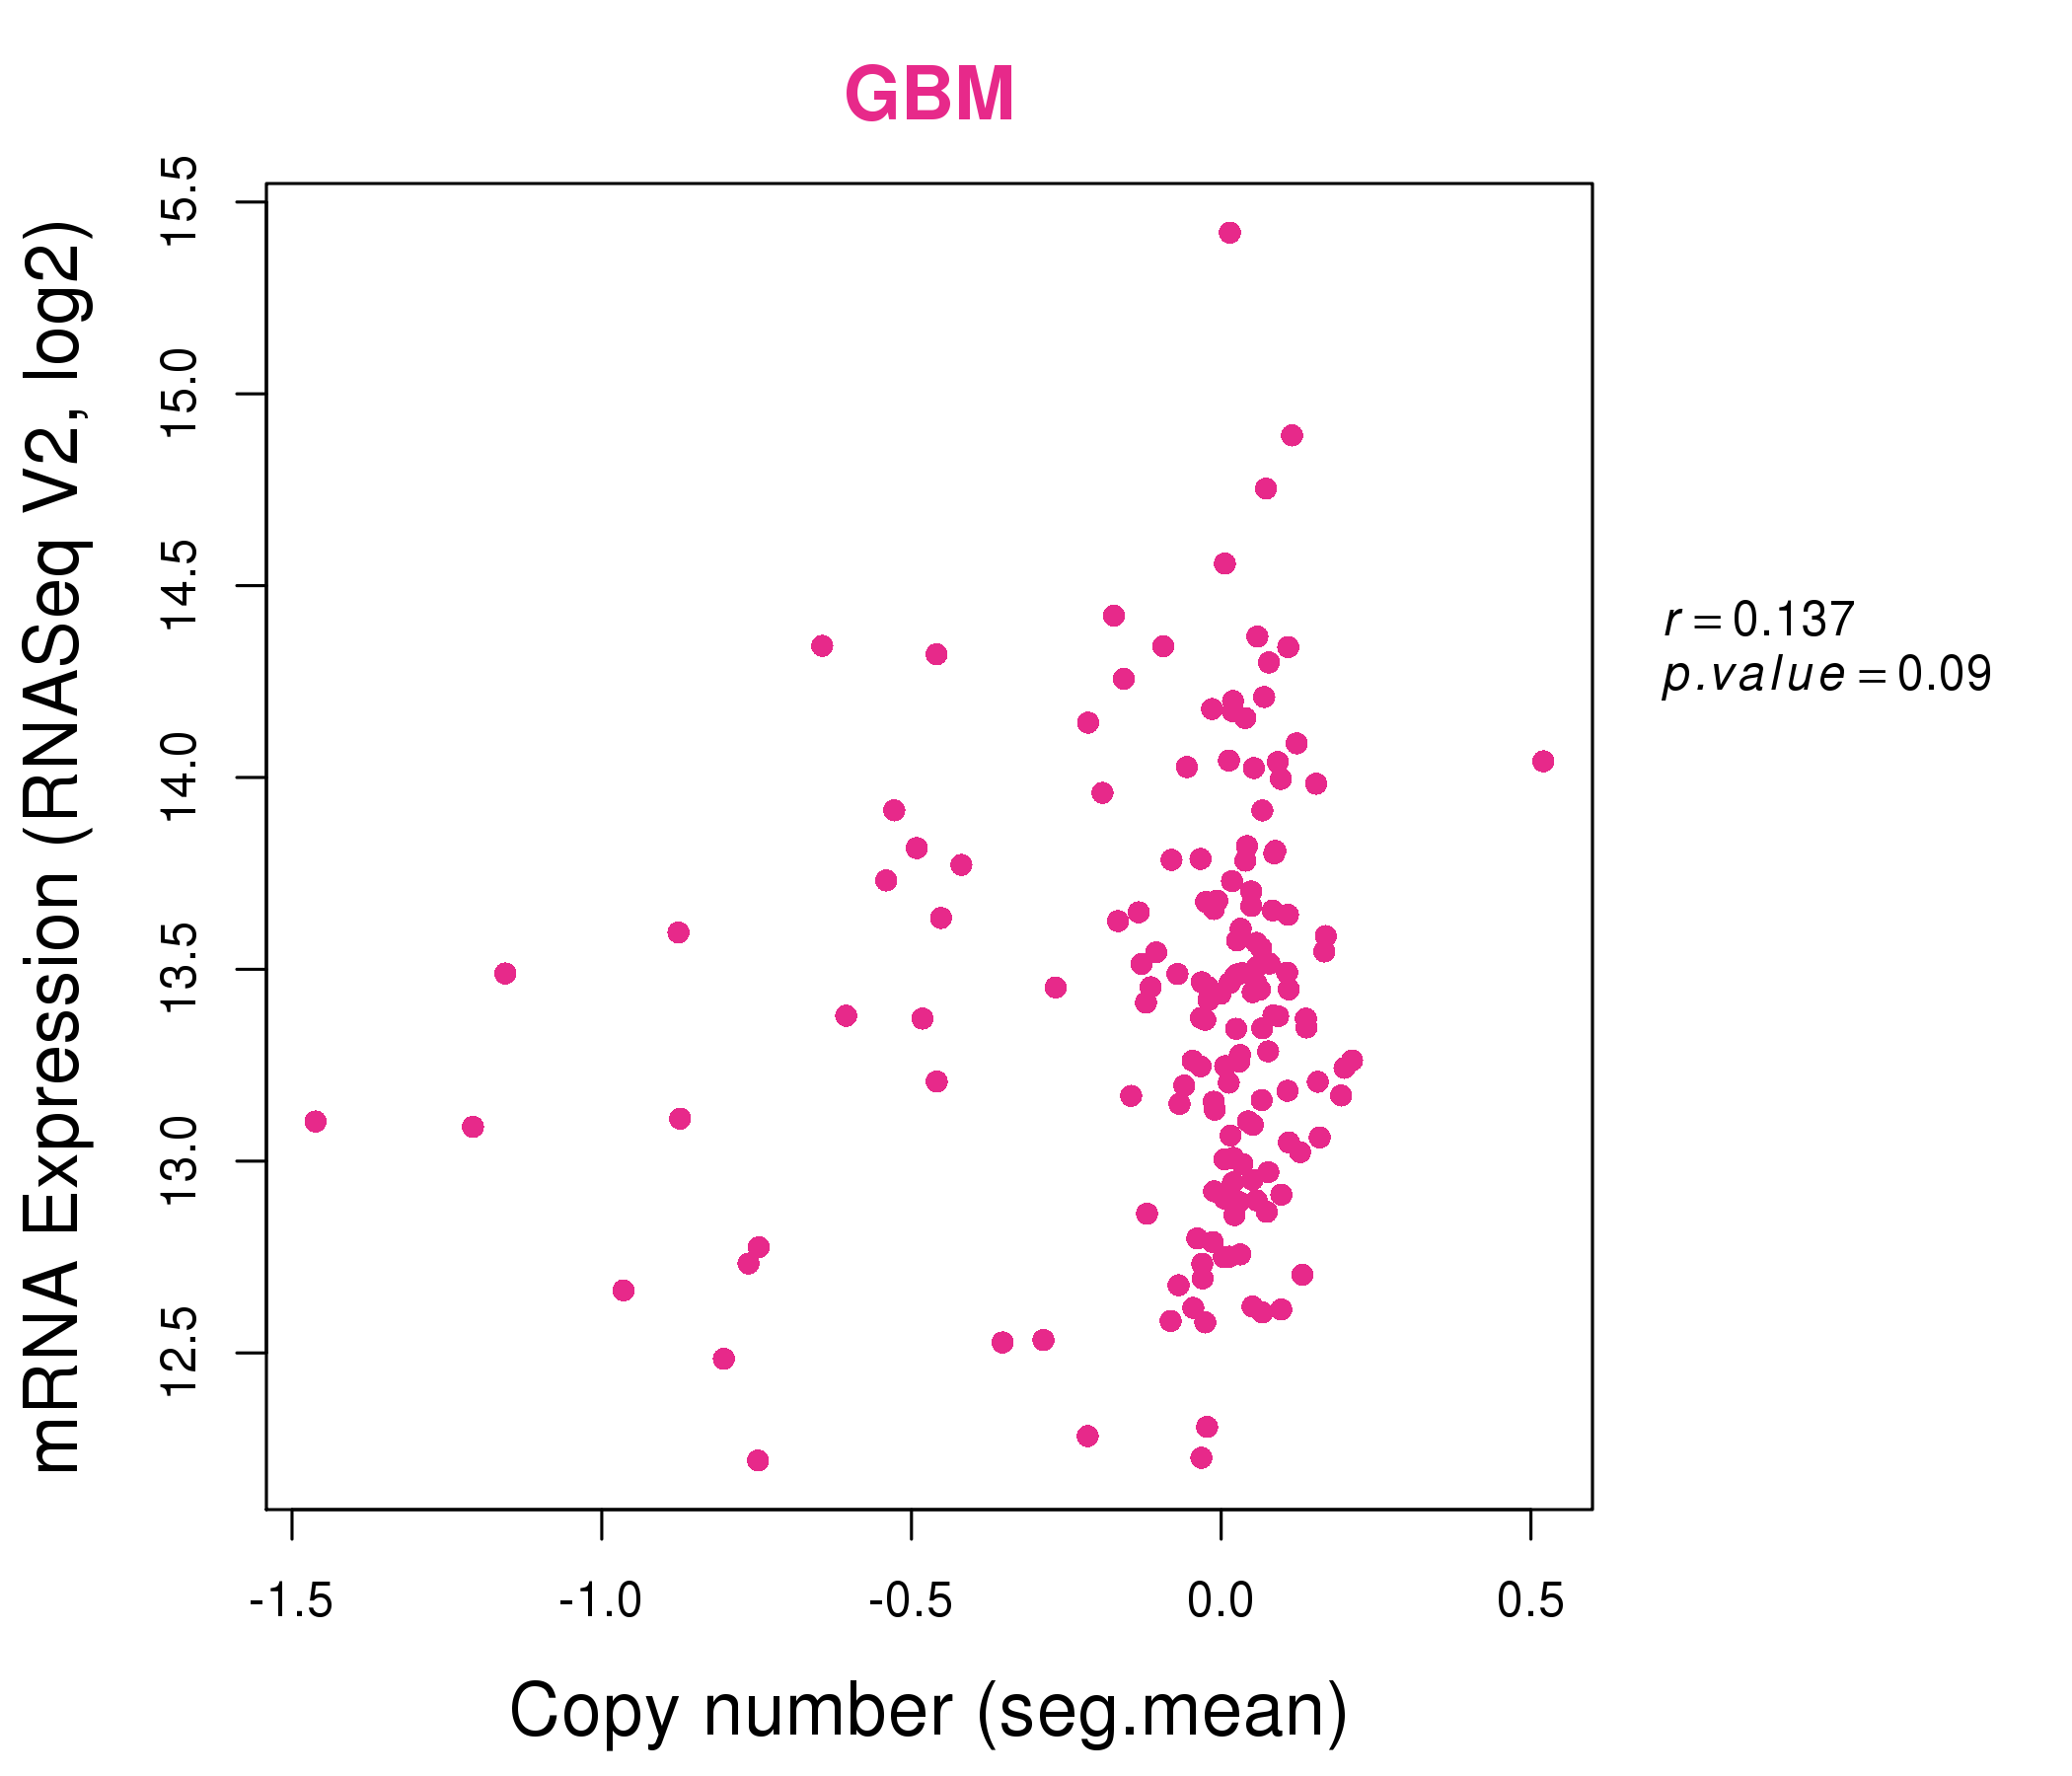
| * Normalized gene expression data of RNASeqV2 was extracted from TCGA using R package TCGA-Assembler. The URLs of all public data files on TCGA DCC data server were gathered at Jan-05-2015. Only eight cancer types have enough normal control samples for differential expression analysis. (t test, adjusted p<0.05 (using Benjamini-Hochberg FDR)) |
 |
| Top |
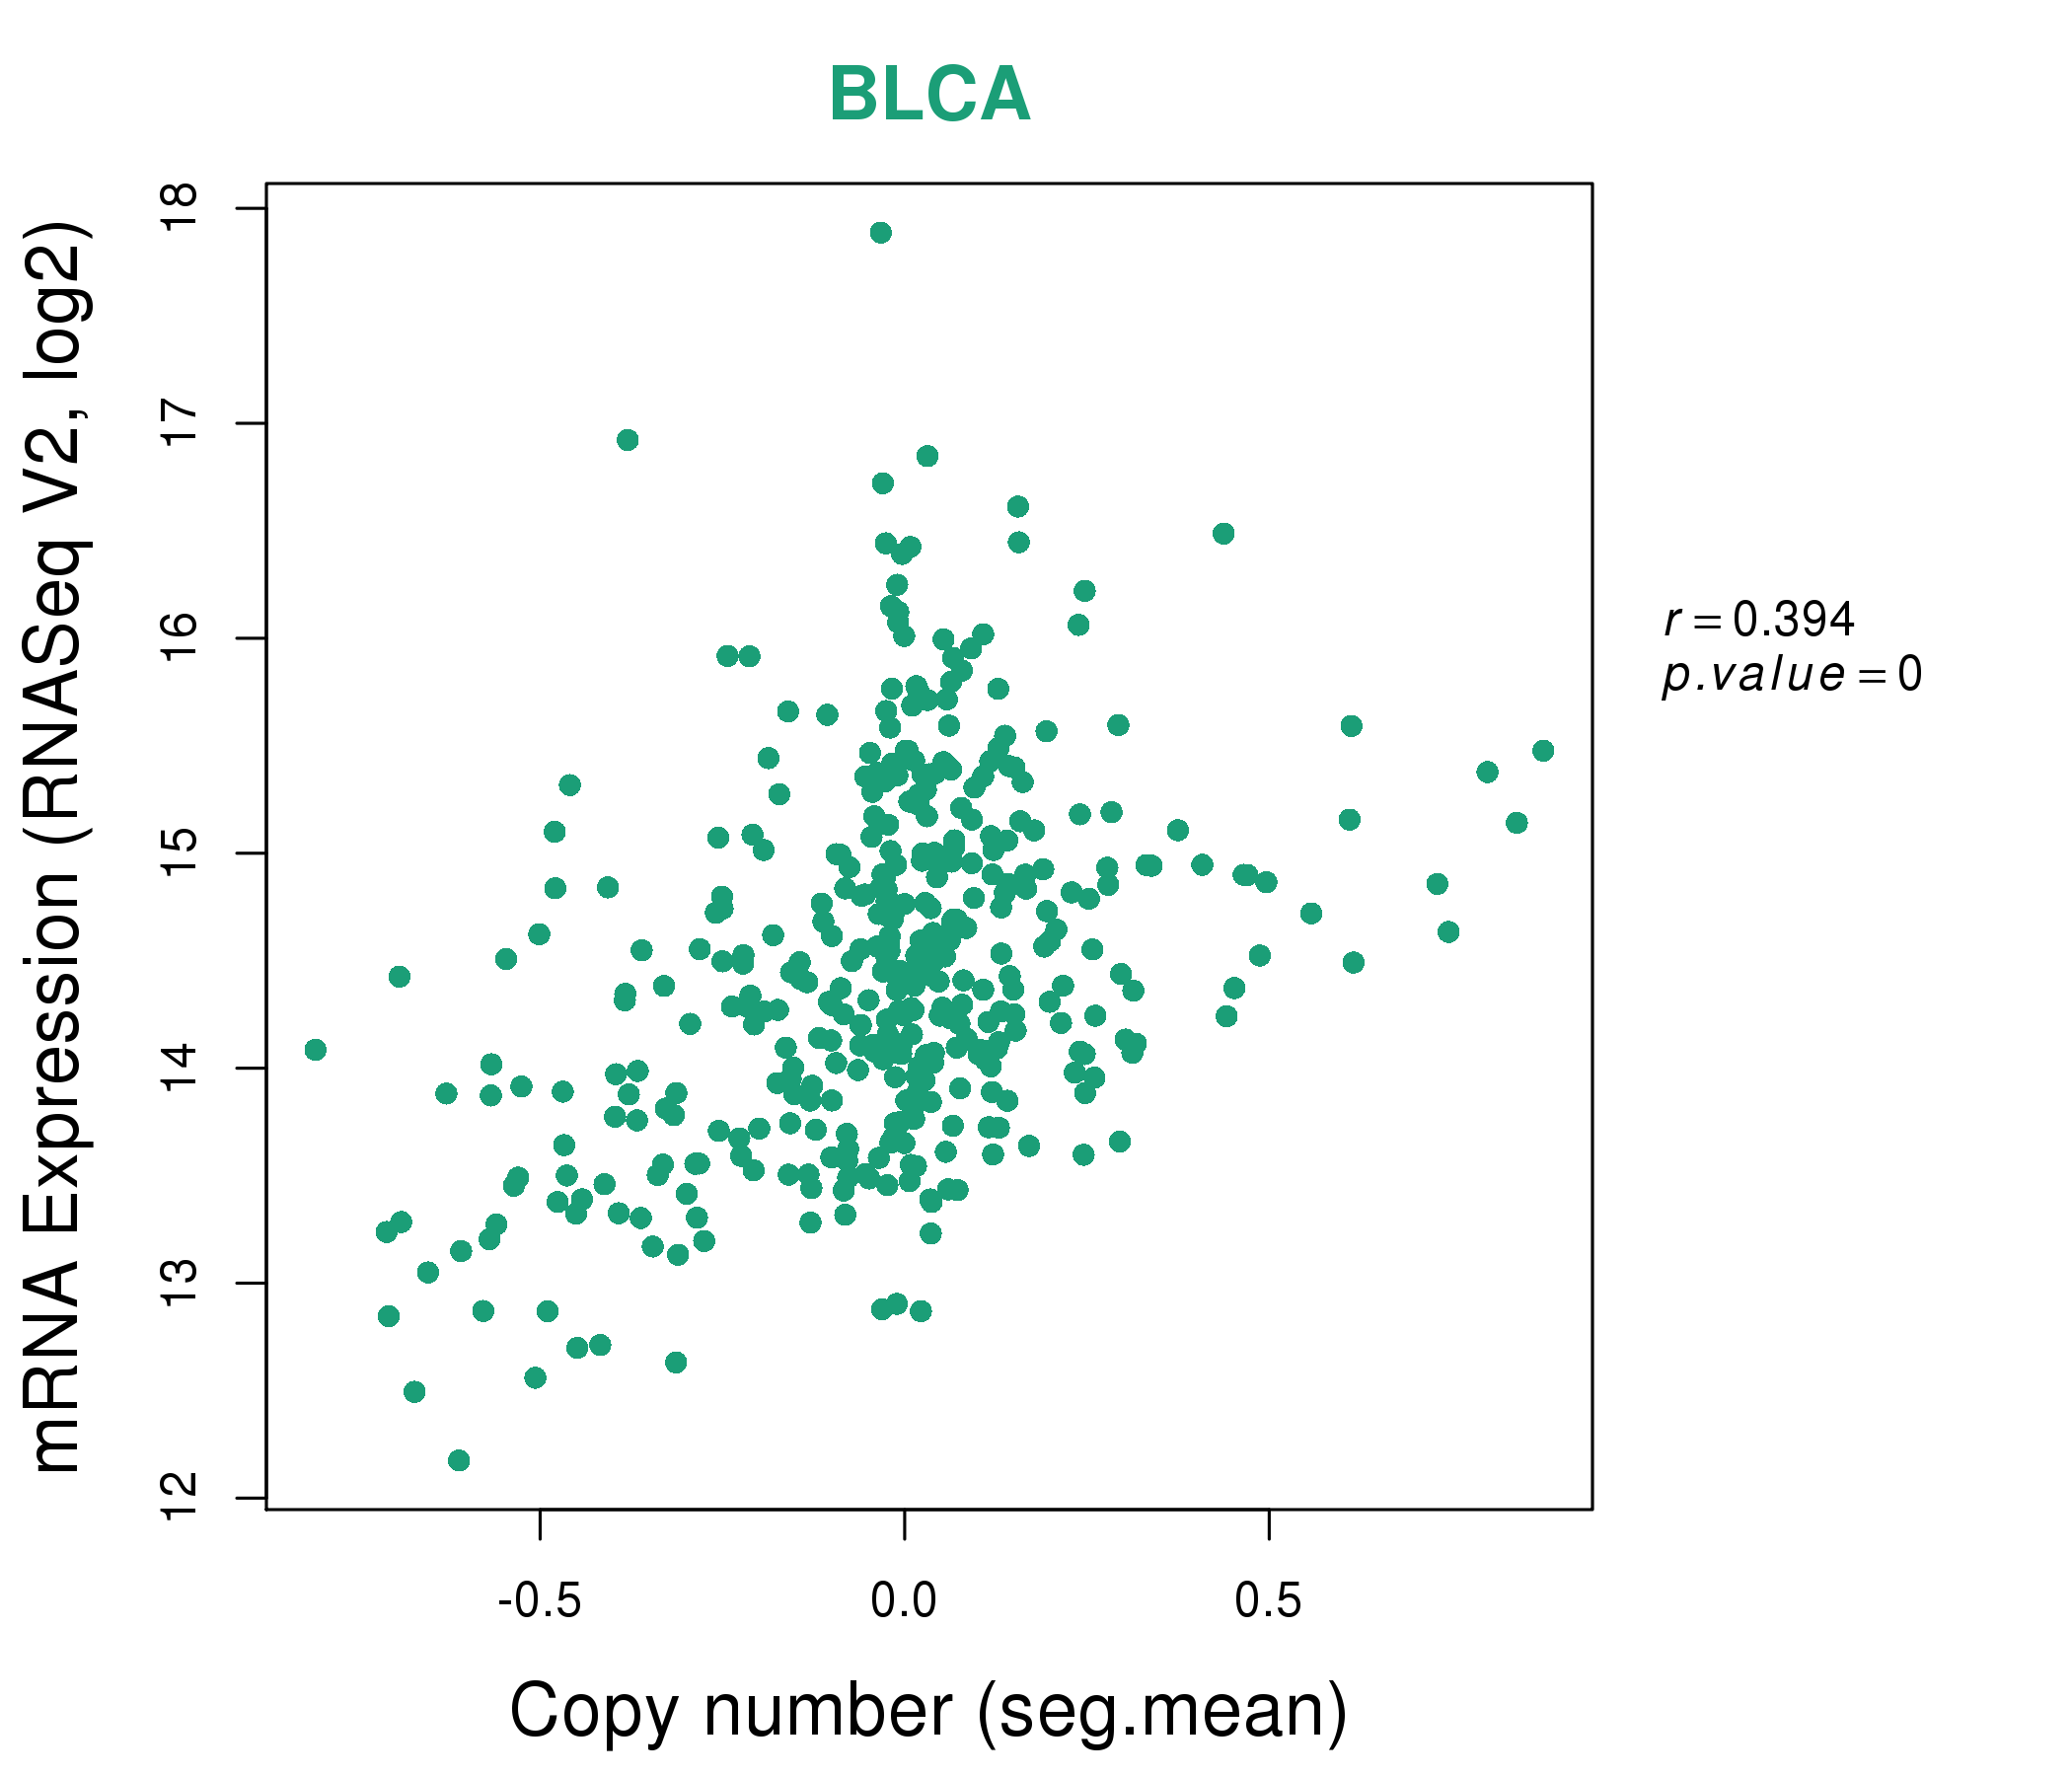
| * This plots show the correlation between CNV and gene expression. |
: Open all plots for all cancer types
 |
|
 |
|
| Top |
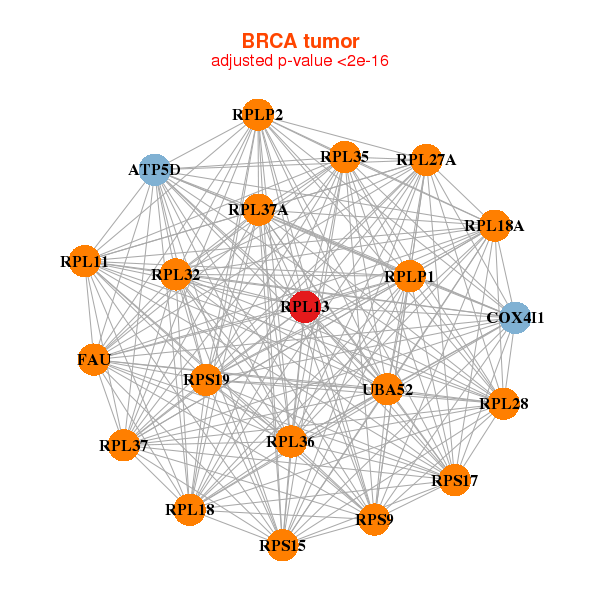
| Gene-Gene Network Information |
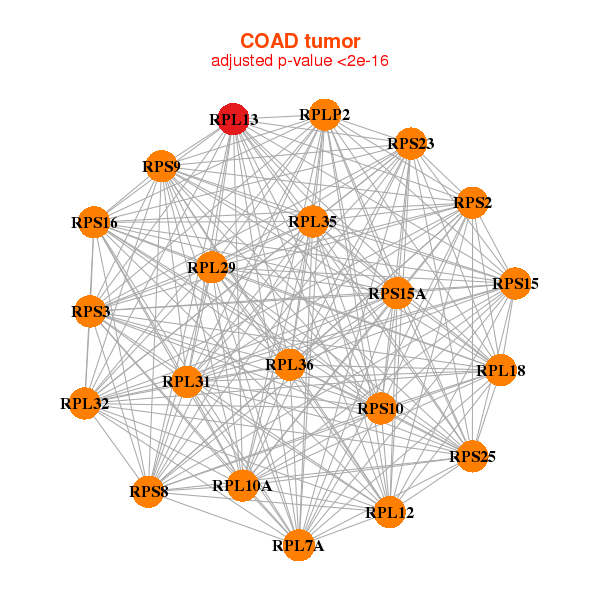
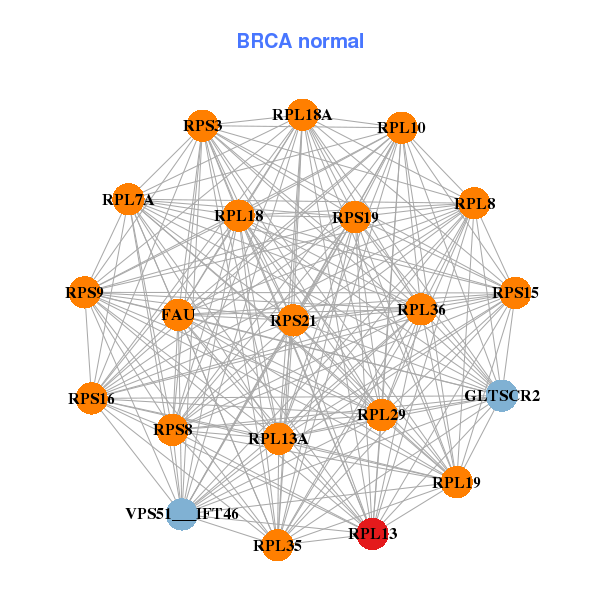
| * Co-Expression network figures were drawn using R package igraph. Only the top 20 genes with the highest correlations were shown. Red circle: input gene, orange circle: cell metabolism gene, sky circle: other gene |
: Open all plots for all cancer types
 |
| ||||
| GLTSCR2,RPL10,RPL10A,RPL11,RPL13A,RPL13AP20,RPL13AP3, RPL18,RPL28,RPL29,RPL3,RPL37A,RPL7A,RPLP0, RPS11,RPS14,RPS19,RPS23,RPS5,RPS8,RPS9 | FBL,GNB2L1,RPL10,RPL10A,RPL13,RPL13A,RPL18, RPL18A,RPL19,RPL29,RPL3,RPL36,RPL7A,RPL8, RPS14,RPS19,RPS21,RPS2,RPS3,RPS5,RPS8 | ||||
 |
| ||||
| LRRC75A-AS1,RPL10A,RPL12,RPL13A,RPL13AP3,RPL18,RPL28, RPL3,RPL41,RPL7A,RPLP0,RPS11,RPS15,RPS16, RPS19,RPS3,RPS5,RPS8,RPS9,SNRPD2,ZNF581 | ATP5G2,RPL10,RPL13A,RPL14,RPL18,RPL18A,RPL19, RPL29,RPL32,RPL3,RPL36,RPL7A,RPL8,RPLP0, RPLP1,RPS11,RPS12,RPS3,RPS5,RPS8,RPS9 |
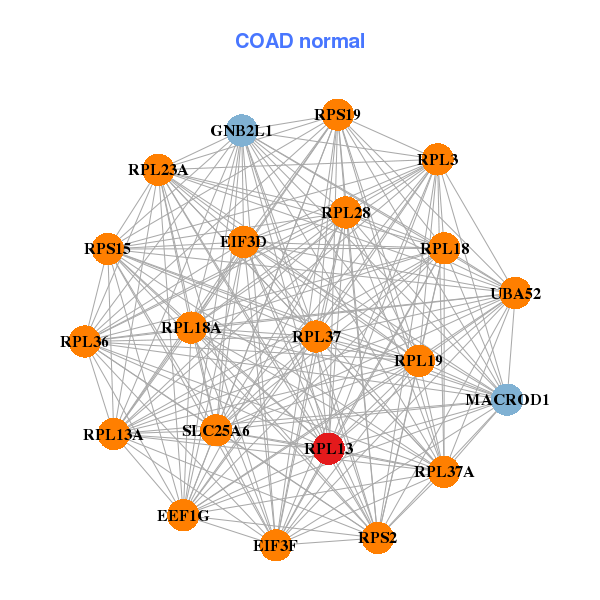
| * Co-Expression network figures were drawn using R package igraph. Only the top 20 genes with the highest correlations were shown. Red circle: input gene, orange circle: cell metabolism gene, sky circle: other gene |
: Open all plots for all cancer types
| Top |
: Open all interacting genes' information including KEGG pathway for all interacting genes from DAVID
| Top |
| Pharmacological Information for RPL13 |
| DB Category | DB Name | DB's ID and Url link |
| * Gene Centered Interaction Network. |
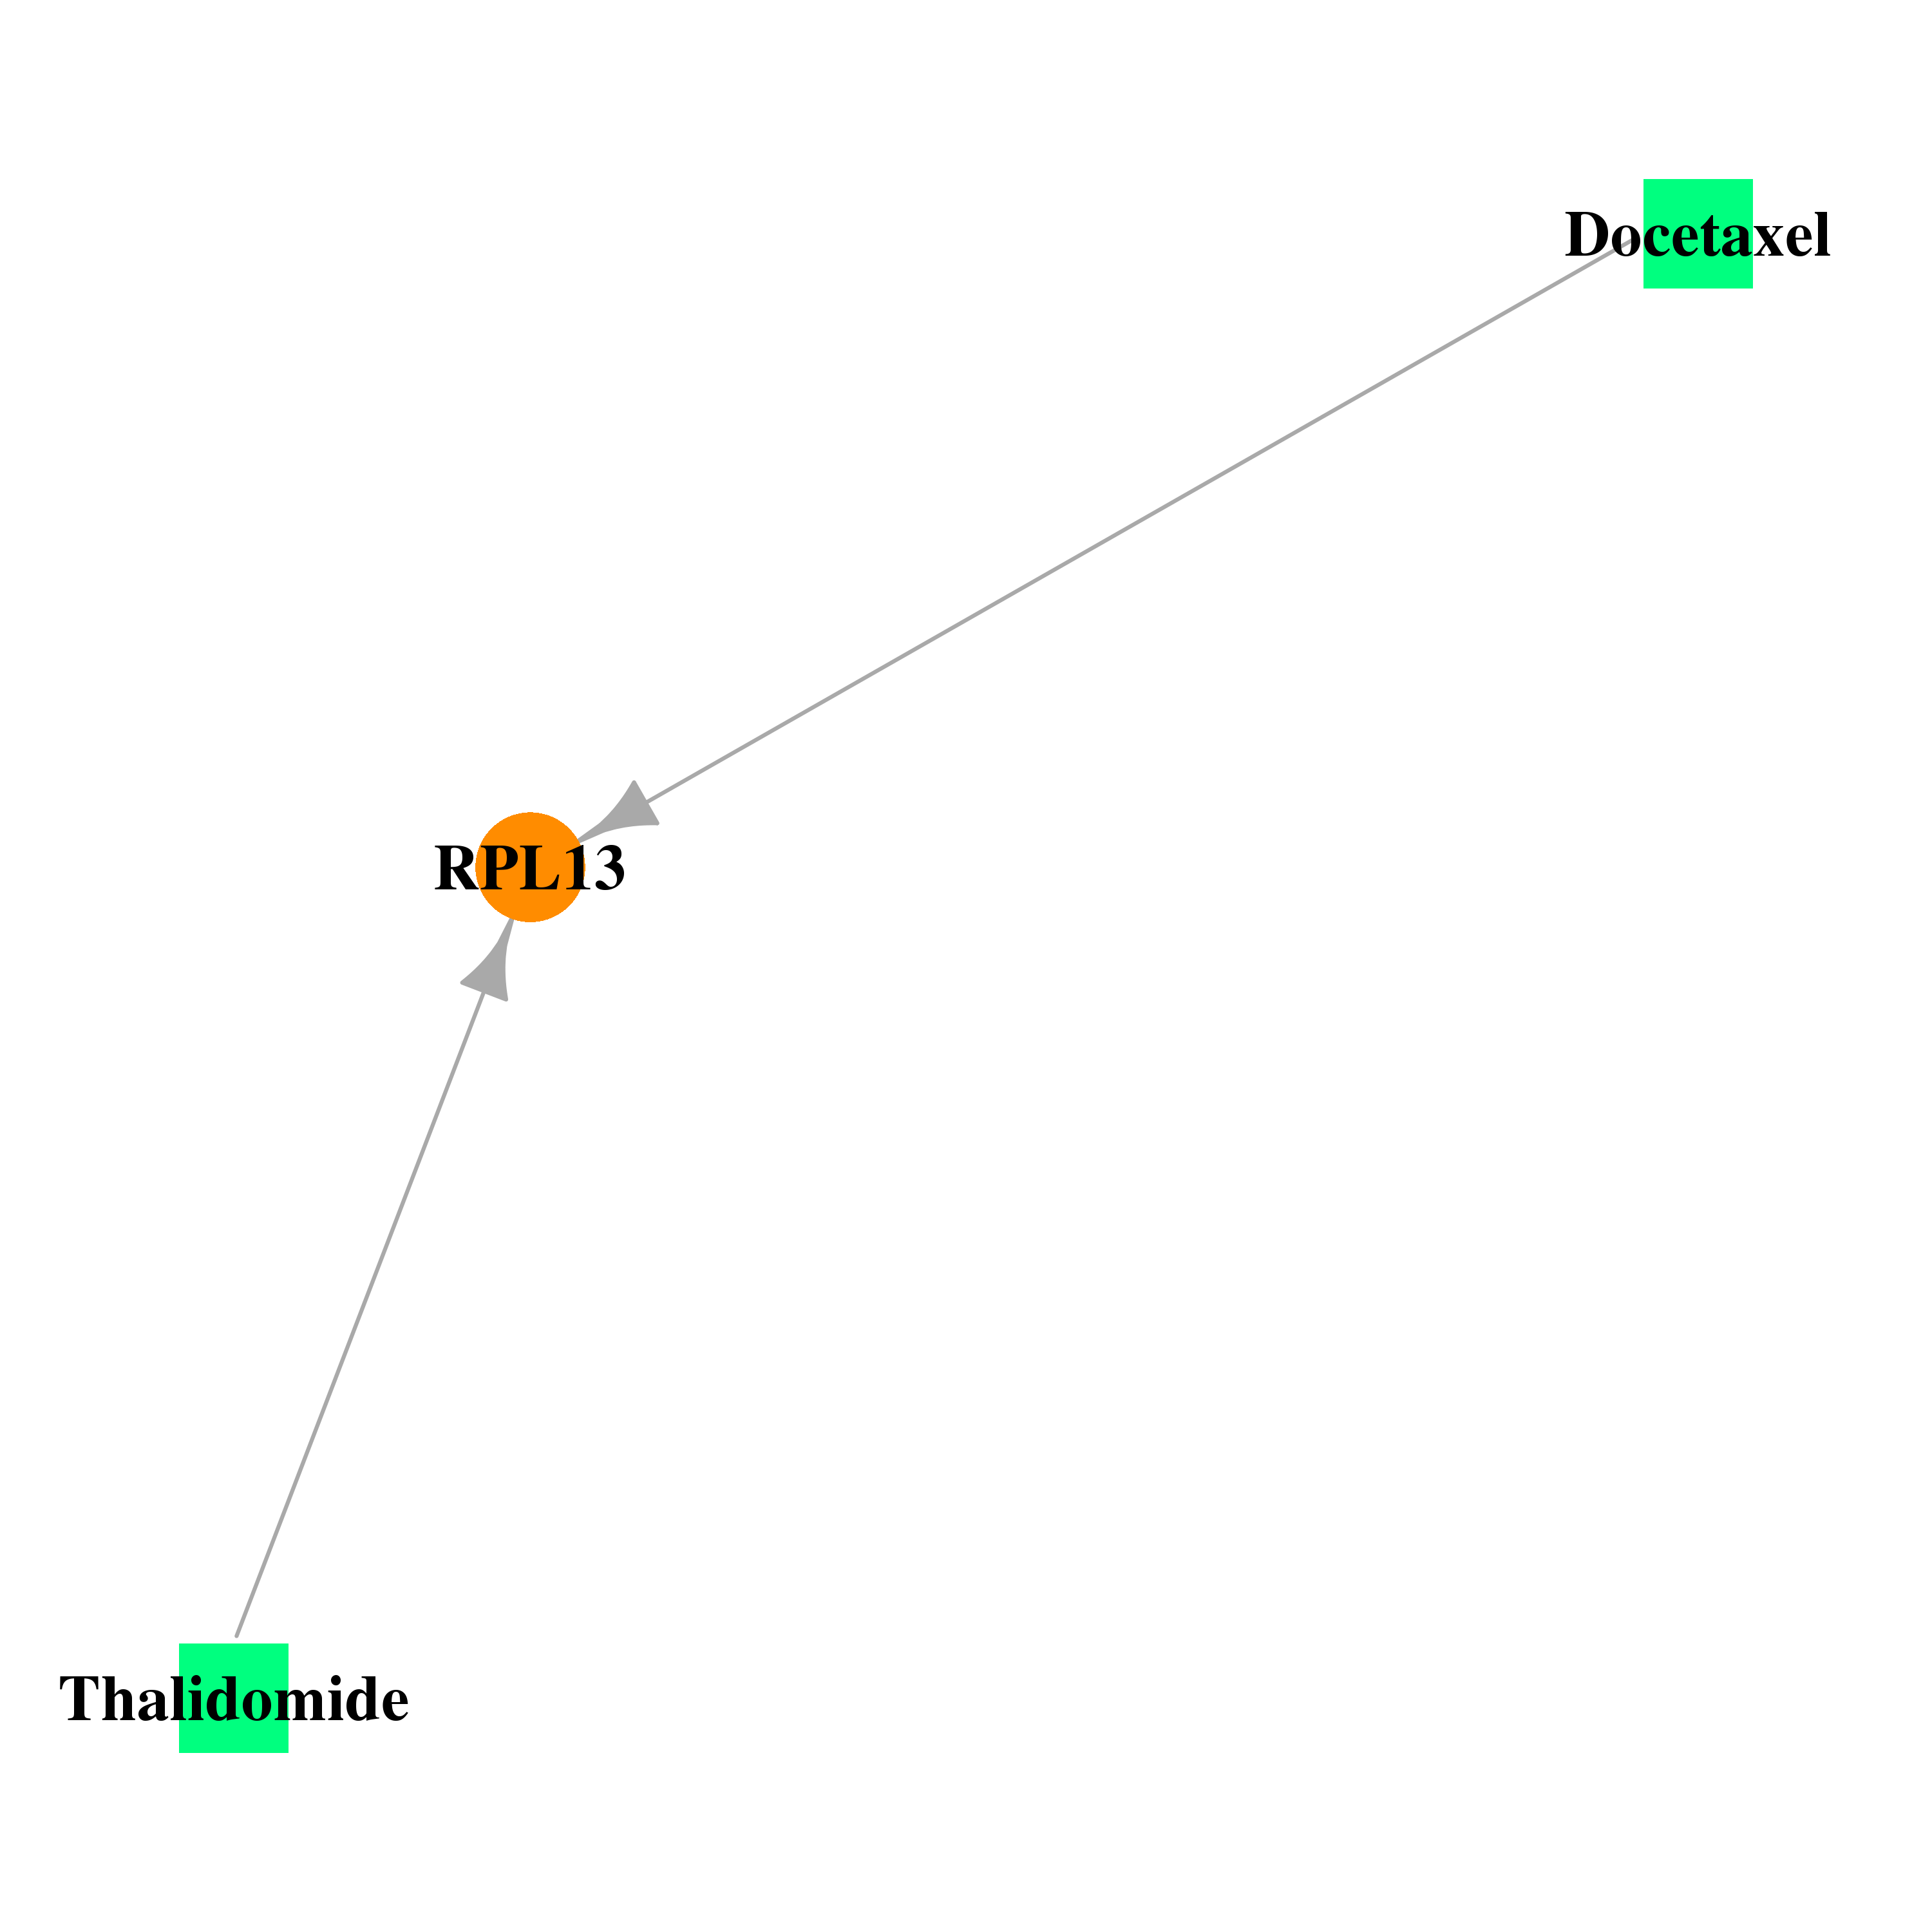 |
| * Drug Centered Interaction Network. |
| DrugBank ID | Target Name | Drug Groups | Generic Name | Drug Centered Network | Drug Structure |
| DB01248 | ribosomal protein L13 | approved; investigational | Docetaxel | 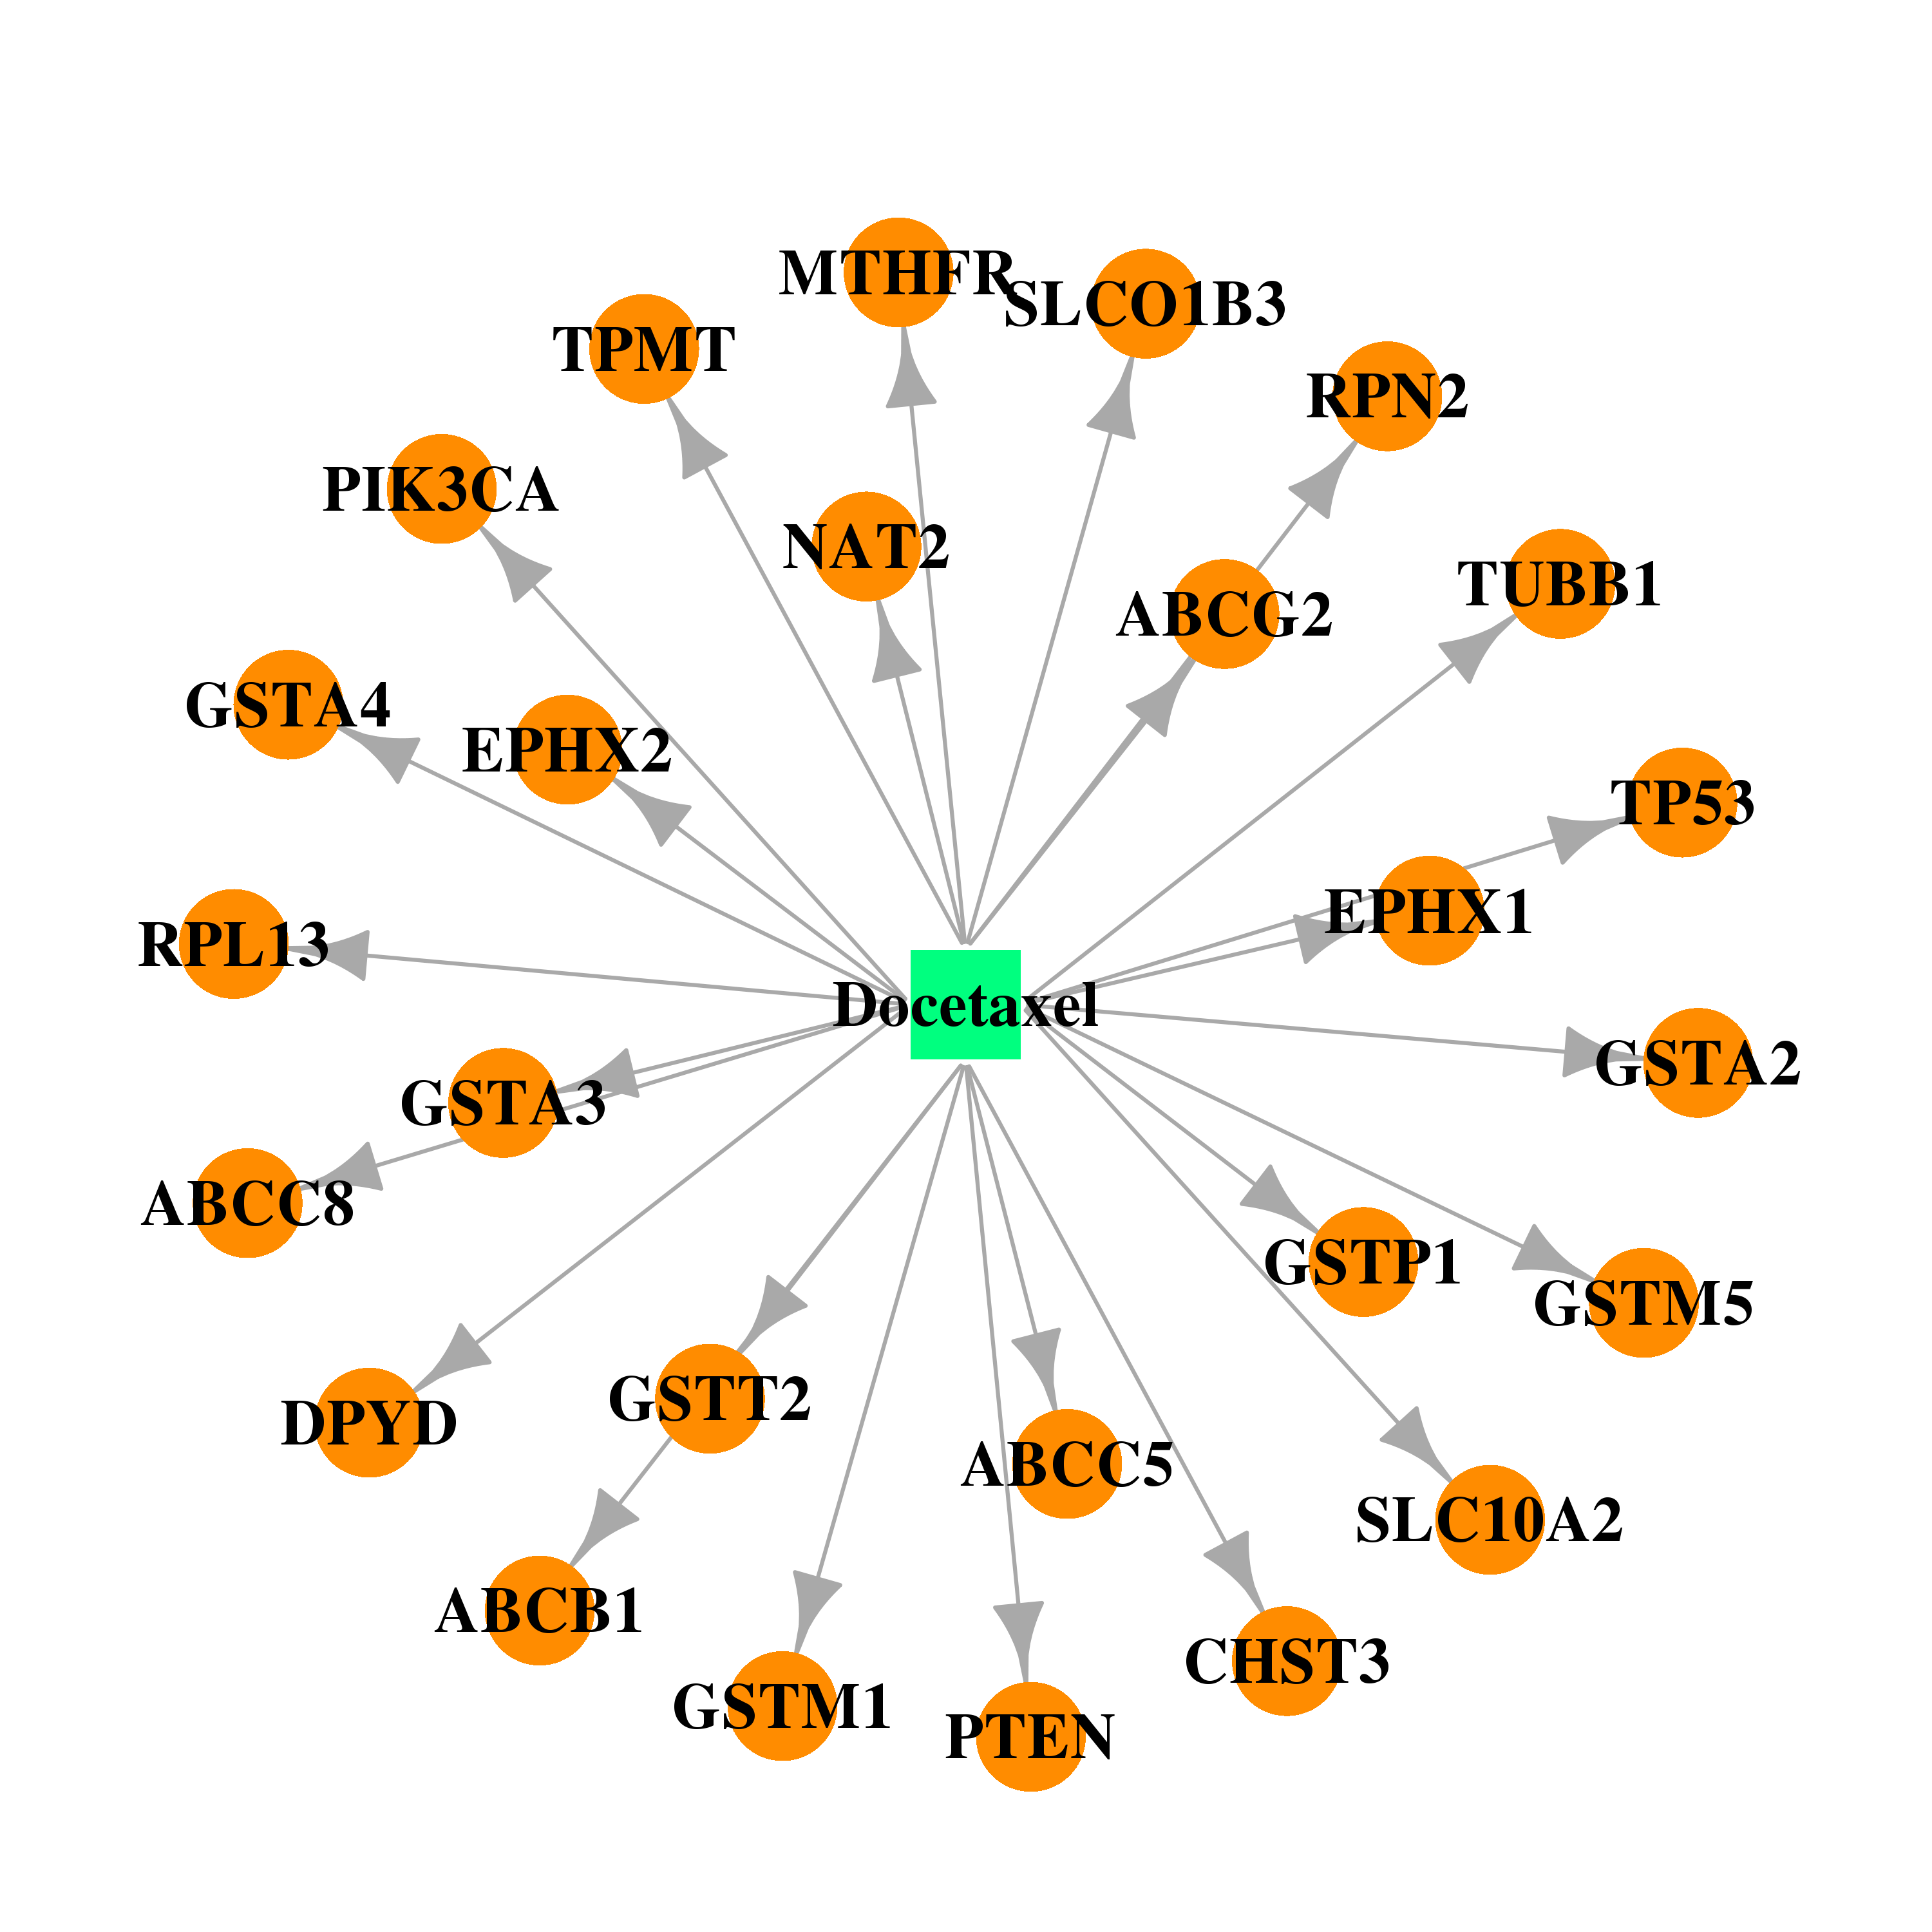 | 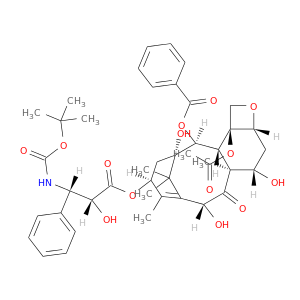 |
| DB01041 | ribosomal protein L13 | approved; withdrawn; investigational | Thalidomide | 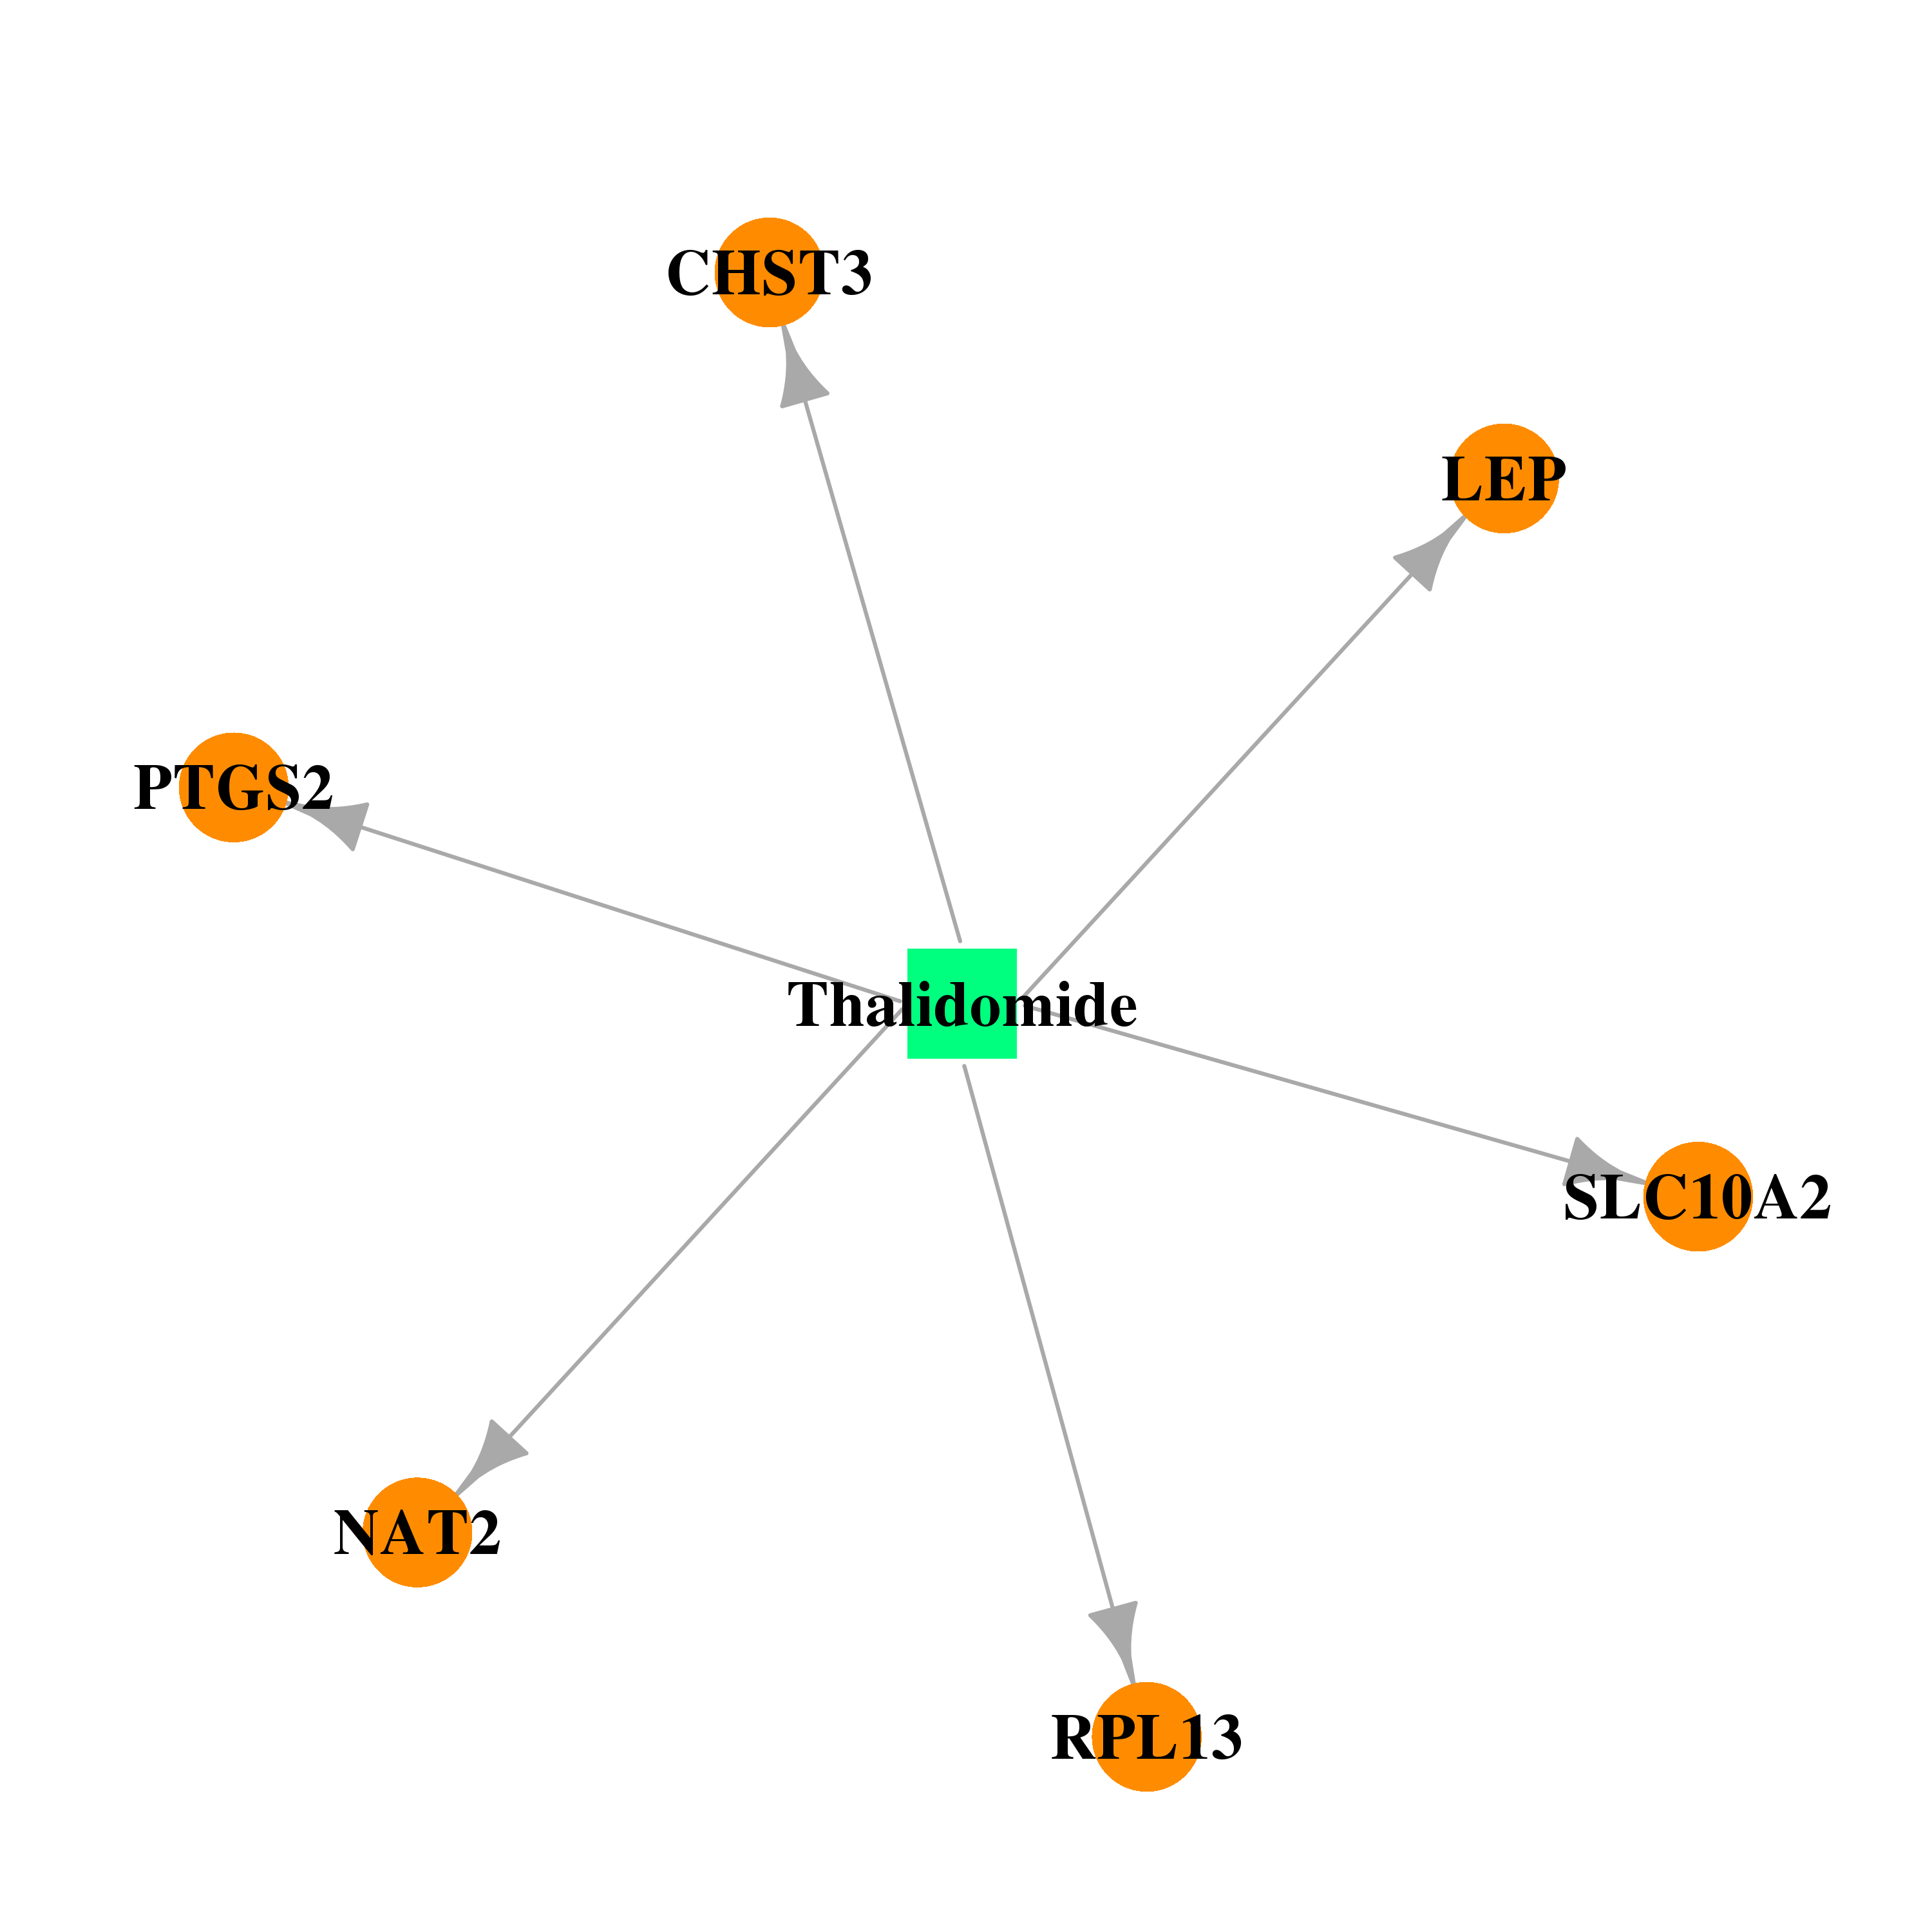 | 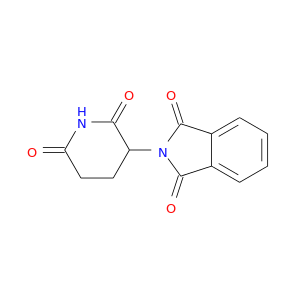 |
| Top |
| Cross referenced IDs for RPL13 |
| * We obtained these cross-references from Uniprot database. It covers 150 different DBs, 18 categories. http://www.uniprot.org/help/cross_references_section |
: Open all cross reference information
|
Copyright © 2016-Present - The Univsersity of Texas Health Science Center at Houston @ |