|
||||||||||||||||||||
| |
| Phenotypic Information (metabolism pathway, cancer, disease, phenome) |
| |
| |
| Gene-Gene Network Information: Co-Expression Network, Interacting Genes & KEGG |
| |
|


| Gene Summary for RPL21 |
| Basic gene info. | Gene symbol | RPL21 |
| Gene name | ribosomal protein L21 | |
| Synonyms | HYPT12|L21 | |
| Cytomap | UCSC genome browser: 13q12.2 | |
| Genomic location | chr13 :27825691-27830702 | |
| Type of gene | protein-coding | |
| RefGenes | NM_000982.3, | |
| Ensembl id | ENSG00000122026 | |
| Description | 60S ribosomal protein L21 | |
| Modification date | 20141207 | |
| dbXrefs | MIM : 603636 | |
| HGNC : HGNC | ||
| Ensembl : ENSG00000122026 | ||
| HPRD : 04700 | ||
| Vega : OTTHUMG00000016630 | ||
| Protein | UniProt: go to UniProt's Cross Reference DB Table | |
| Expression | CleanEX: HS_RPL21 | |
| BioGPS: 6144 | ||
| Gene Expression Atlas: ENSG00000122026 | ||
| The Human Protein Atlas: ENSG00000122026 | ||
| Pathway | NCI Pathway Interaction Database: RPL21 | |
| KEGG: RPL21 | ||
| REACTOME: RPL21 | ||
| ConsensusPathDB | ||
| Pathway Commons: RPL21 | ||
| Metabolism | MetaCyc: RPL21 | |
| HUMANCyc: RPL21 | ||
| Regulation | Ensembl's Regulation: ENSG00000122026 | |
| miRBase: chr13 :27,825,691-27,830,702 | ||
| TargetScan: NM_000982 | ||
| cisRED: ENSG00000122026 | ||
| Context | iHOP: RPL21 | |
| cancer metabolism search in PubMed: RPL21 | ||
| UCL Cancer Institute: RPL21 | ||
| Assigned class in ccmGDB | C | |
| Top |
| Phenotypic Information for RPL21(metabolism pathway, cancer, disease, phenome) |
| Cancer | CGAP: RPL21 |
| Familial Cancer Database: RPL21 | |
| * This gene is included in those cancer gene databases. |
|
|
|
|
|
| . | ||||||||||||||
Oncogene 1 | Significant driver gene in | |||||||||||||||||||
| cf) number; DB name 1 Oncogene; http://nar.oxfordjournals.org/content/35/suppl_1/D721.long, 2 Tumor Suppressor gene; https://bioinfo.uth.edu/TSGene/, 3 Cancer Gene Census; http://www.nature.com/nrc/journal/v4/n3/abs/nrc1299.html, 4 CancerGenes; http://nar.oxfordjournals.org/content/35/suppl_1/D721.long, 5 Network of Cancer Gene; http://ncg.kcl.ac.uk/index.php, 1Therapeutic Vulnerabilities in Cancer; http://cbio.mskcc.org/cancergenomics/statius/ |
| REACTOME_METABOLISM_OF_PROTEINS REACTOME_METABOLISM_OF_MRNA REACTOME_METABOLISM_OF_RNA | |
| OMIM | |
| Orphanet | |
| Disease | KEGG Disease: RPL21 |
| MedGen: RPL21 (Human Medical Genetics with Condition) | |
| ClinVar: RPL21 | |
| Phenotype | MGI: RPL21 (International Mouse Phenotyping Consortium) |
| PhenomicDB: RPL21 | |
| Mutations for RPL21 |
| * Under tables are showing count per each tissue to give us broad intuition about tissue specific mutation patterns.You can go to the detailed page for each mutation database's web site. |
| There's no structural variation information in COSMIC data for this gene. |
| * From mRNA Sanger sequences, Chitars2.0 arranged chimeric transcripts. This table shows RPL21 related fusion information. |
| ID | Head Gene | Tail Gene | Accession | Gene_a | qStart_a | qEnd_a | Chromosome_a | tStart_a | tEnd_a | Gene_a | qStart_a | qEnd_a | Chromosome_a | tStart_a | tEnd_a |
| DA999428 | RPL21 | 1 | 61 | 13 | 27829209 | 27829269 | ELF3 | 62 | 538 | 1 | 201979753 | 201981308 | |
| AW084964 | RPL21 | 1 | 87 | 13 | 27830614 | 27830700 | AHNAK | 76 | 531 | 11 | 62293445 | 62293899 | |
| Top |
| There's no copy number variation information in COSMIC data for this gene. |
| Top |
|
 |
| Top |
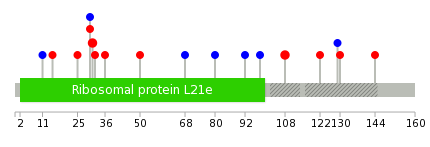
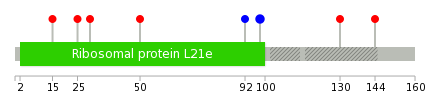
| Stat. for Non-Synonymous SNVs (# total SNVs=10) | (# total SNVs=6) |
 |  |
(# total SNVs=0) | (# total SNVs=0) |
| Top |
| * When you move the cursor on each content, you can see more deailed mutation information on the Tooltip. Those are primary_site,primary_histology,mutation(aa),pubmedID. |
| GRCh37 position | Mutation(aa) | Unique sampleID count |
| chr13:27830400-27830400 | p.R108S | 2 |
| chr13:27828382-27828382 | p.M31I | 2 |
| chr13:27828384-27828384 | p.R32Q | 1 |
| chr13:27830466-27830466 | p.R130C | 1 |
| chr13:27828396-27828396 | p.K36T | 1 |
| chr13:27830610-27830610 | p.N144T | 1 |
| chr13:27829397-27829397 | p.K50Q | 1 |
| chr13:27829453-27829453 | p.T68T | 1 |
| chr13:27829489-27829489 | p.V80V | 1 |
| chr13:27827946-27827946 | p.T11T | 1 |
| Top |
|
 |
| Point Mutation/ Tissue ID | 1 | 2 | 3 | 4 | 5 | 6 | 7 | 8 | 9 | 10 | 11 | 12 | 13 | 14 | 15 | 16 | 17 | 18 | 19 | 20 |
| # sample | 2 | 1 | 1 | 1 | 4 | |||||||||||||||
| # mutation | 2 | 1 | 1 | 1 | 4 | |||||||||||||||
| nonsynonymous SNV | 1 | 1 | 1 | 3 | ||||||||||||||||
| synonymous SNV | 1 | 1 | 1 |
| cf) Tissue ID; Tissue type (1; BLCA[Bladder Urothelial Carcinoma], 2; BRCA[Breast invasive carcinoma], 3; CESC[Cervical squamous cell carcinoma and endocervical adenocarcinoma], 4; COAD[Colon adenocarcinoma], 5; GBM[Glioblastoma multiforme], 6; Glioma Low Grade, 7; HNSC[Head and Neck squamous cell carcinoma], 8; KICH[Kidney Chromophobe], 9; KIRC[Kidney renal clear cell carcinoma], 10; KIRP[Kidney renal papillary cell carcinoma], 11; LAML[Acute Myeloid Leukemia], 12; LUAD[Lung adenocarcinoma], 13; LUSC[Lung squamous cell carcinoma], 14; OV[Ovarian serous cystadenocarcinoma ], 15; PAAD[Pancreatic adenocarcinoma], 16; PRAD[Prostate adenocarcinoma], 17; SKCM[Skin Cutaneous Melanoma], 18:STAD[Stomach adenocarcinoma], 19:THCA[Thyroid carcinoma], 20:UCEC[Uterine Corpus Endometrial Carcinoma]) |
| Top |
| * We represented just top 10 SNVs. When you move the cursor on each content, you can see more deailed mutation information on the Tooltip. Those are primary_site, primary_histology, mutation(aa), pubmedID. |
| Genomic Position | Mutation(aa) | Unique sampleID count |
| chr13:27830372 | p.H98H | 2 |
| chr13:27830466 | p.R130C | 1 |
| chr13:27830610 | p.N144T | 1 |
| chr13:27827958 | p.F15L | 1 |
| chr13:27828363 | p.V25A | 1 |
| chr13:27828378 | p.Y30F | 1 |
| chr13:27829397 | p.K50Q | 1 |
| chr13:27830354 | p.R92R | 1 |
| * Copy number data were extracted from TCGA using R package TCGA-Assembler. The URLs of all public data files on TCGA DCC data server were gathered on Jan-05-2015. Function ProcessCNAData in TCGA-Assembler package was used to obtain gene-level copy number value which is calculated as the average copy number of the genomic region of a gene. |
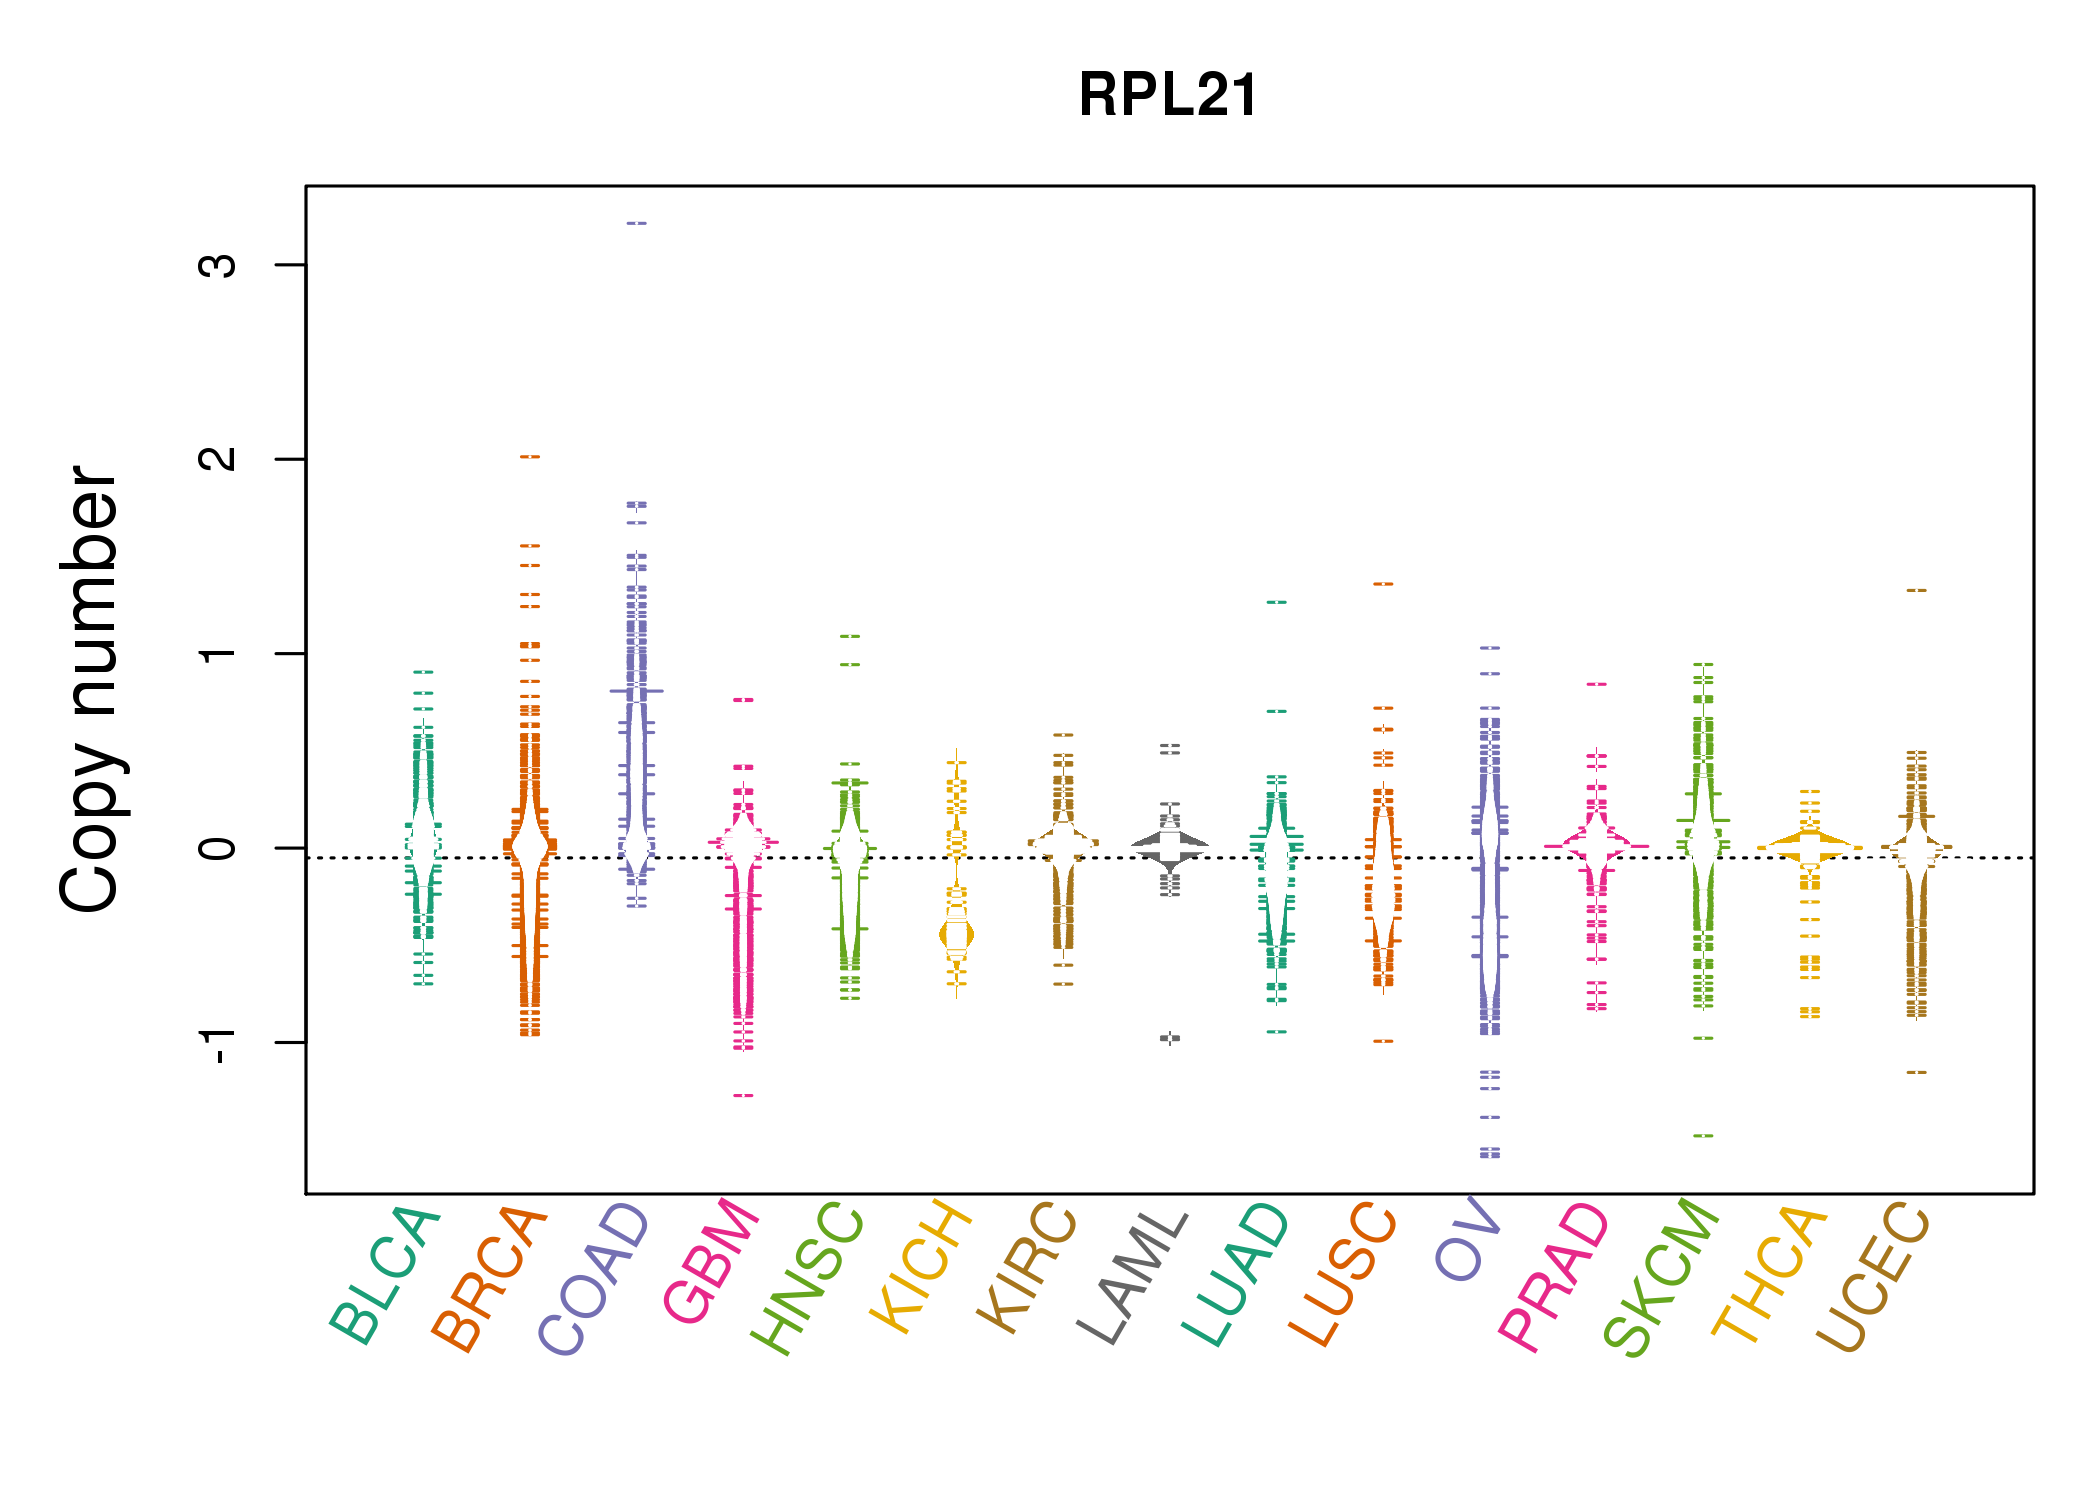 |
| cf) Tissue ID[Tissue type]: BLCA[Bladder Urothelial Carcinoma], BRCA[Breast invasive carcinoma], CESC[Cervical squamous cell carcinoma and endocervical adenocarcinoma], COAD[Colon adenocarcinoma], GBM[Glioblastoma multiforme], Glioma Low Grade, HNSC[Head and Neck squamous cell carcinoma], KICH[Kidney Chromophobe], KIRC[Kidney renal clear cell carcinoma], KIRP[Kidney renal papillary cell carcinoma], LAML[Acute Myeloid Leukemia], LUAD[Lung adenocarcinoma], LUSC[Lung squamous cell carcinoma], OV[Ovarian serous cystadenocarcinoma ], PAAD[Pancreatic adenocarcinoma], PRAD[Prostate adenocarcinoma], SKCM[Skin Cutaneous Melanoma], STAD[Stomach adenocarcinoma], THCA[Thyroid carcinoma], UCEC[Uterine Corpus Endometrial Carcinoma] |
| Top |
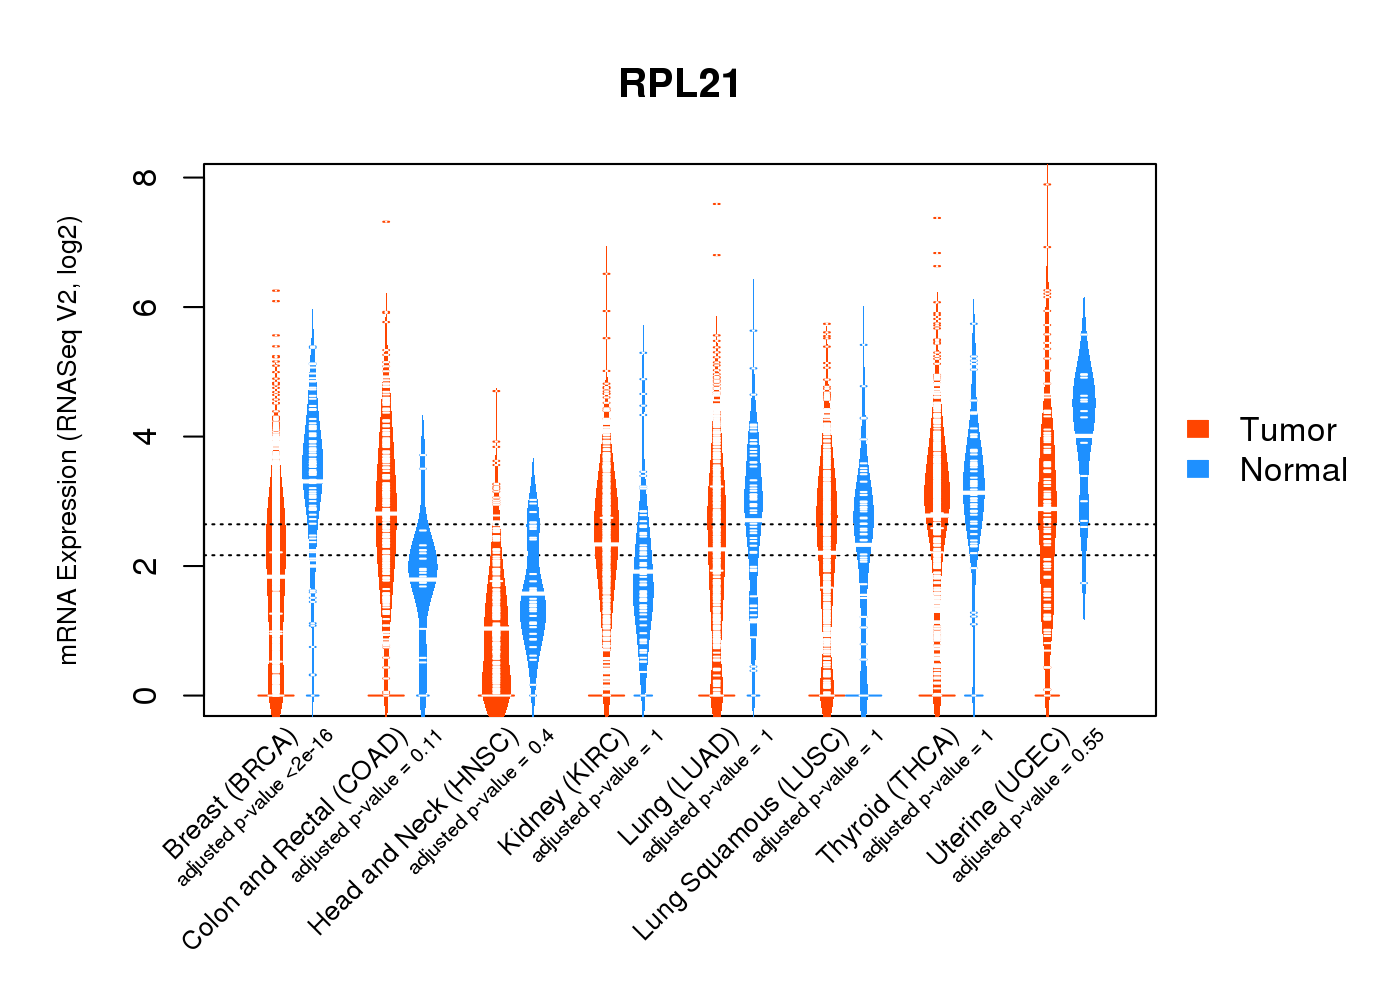
| Gene Expression for RPL21 |
| * CCLE gene expression data were extracted from CCLE_Expression_Entrez_2012-10-18.res: Gene-centric RMA-normalized mRNA expression data. |
 |
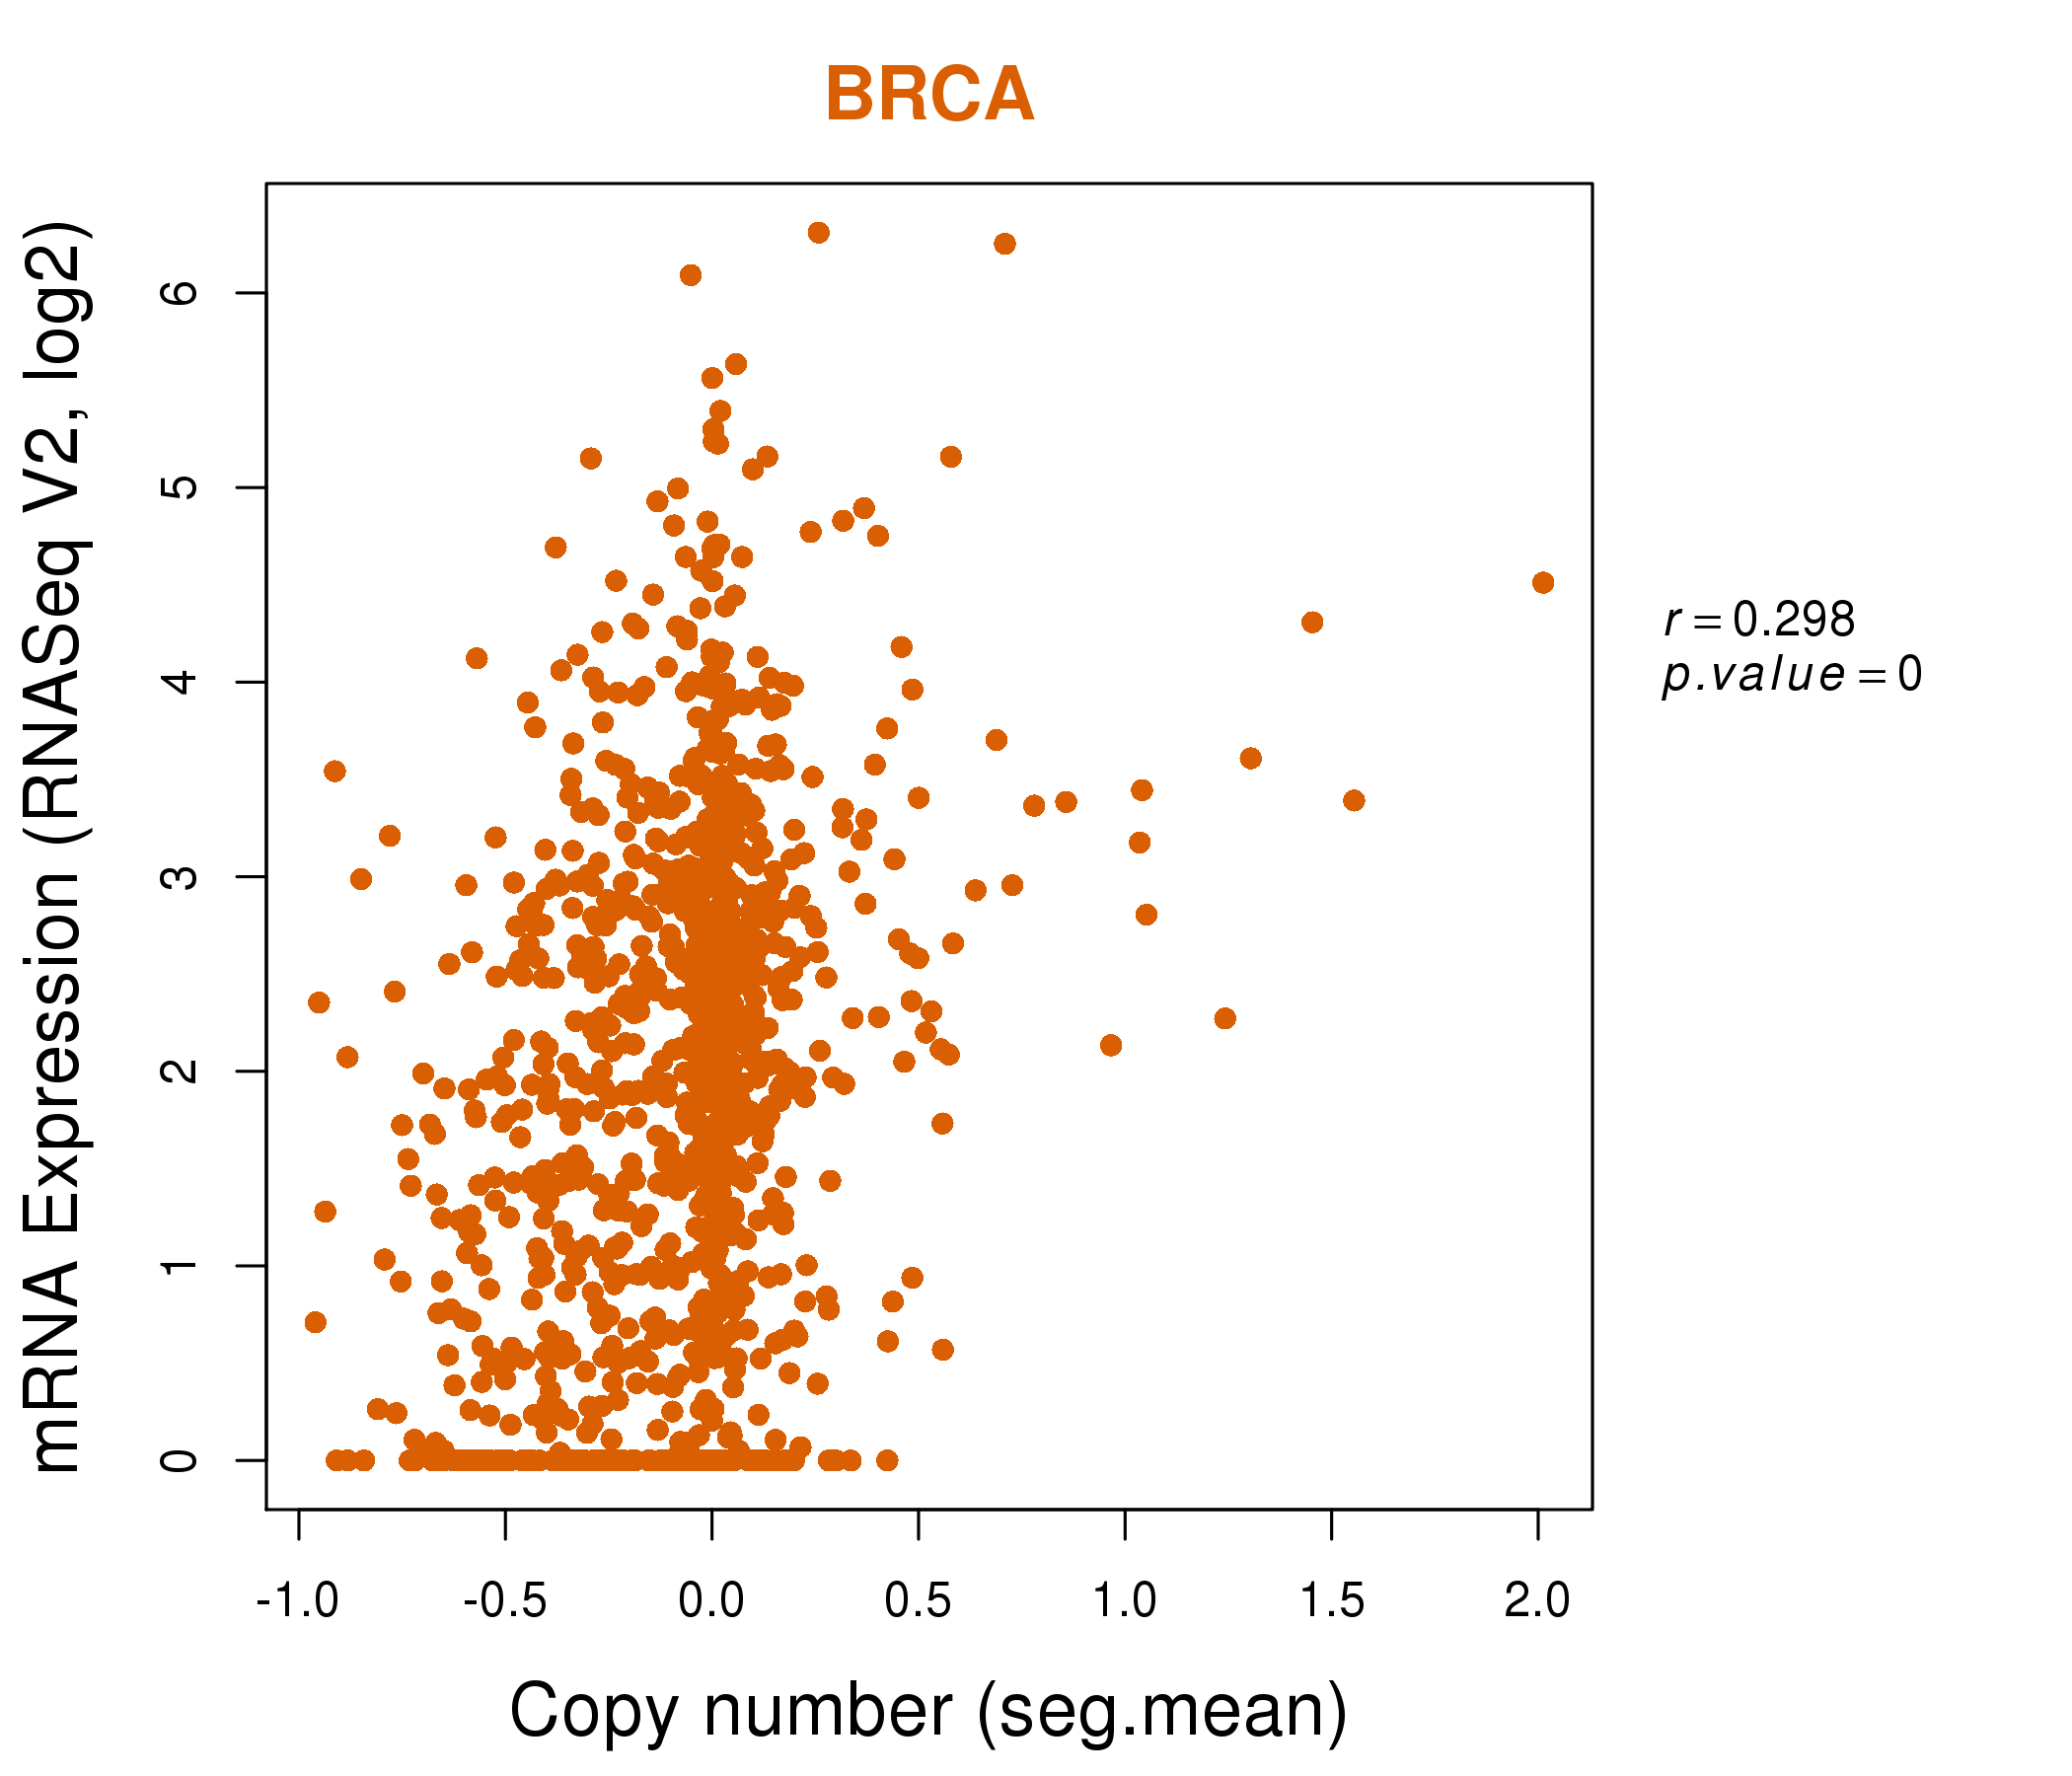
| * Normalized gene expression data of RNASeqV2 was extracted from TCGA using R package TCGA-Assembler. The URLs of all public data files on TCGA DCC data server were gathered at Jan-05-2015. Only eight cancer types have enough normal control samples for differential expression analysis. (t test, adjusted p<0.05 (using Benjamini-Hochberg FDR)) |
 |
| Top |
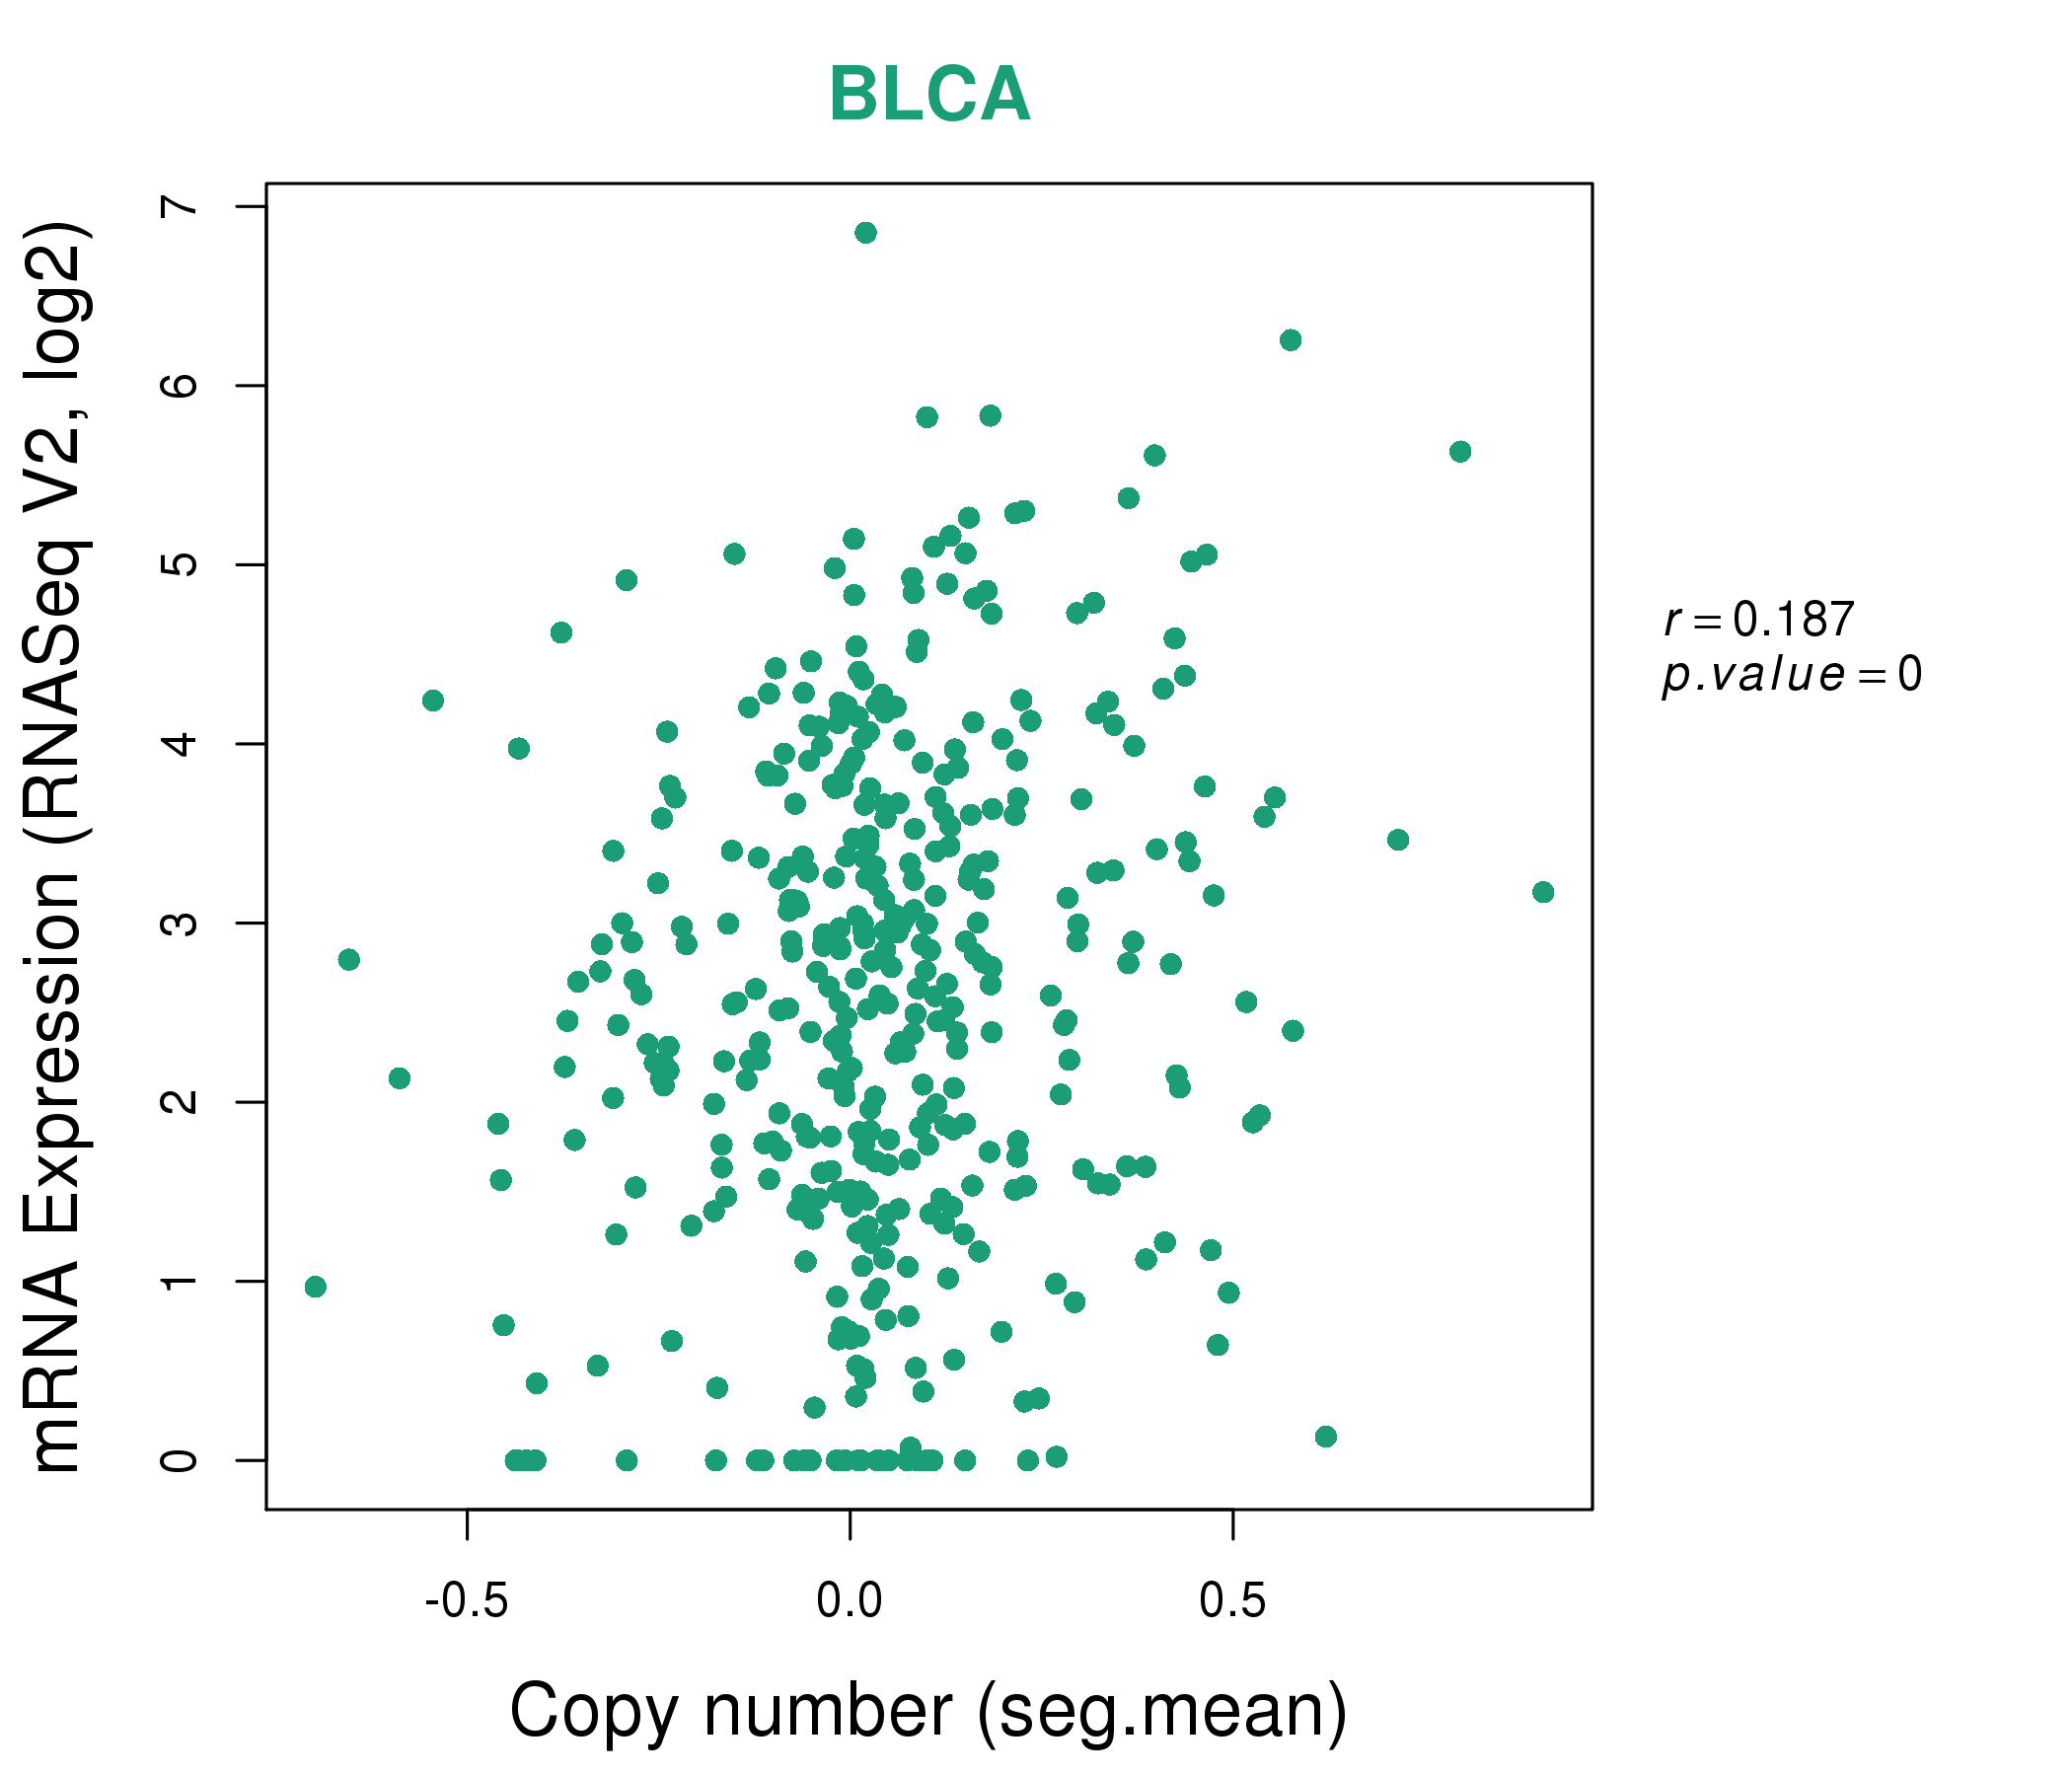
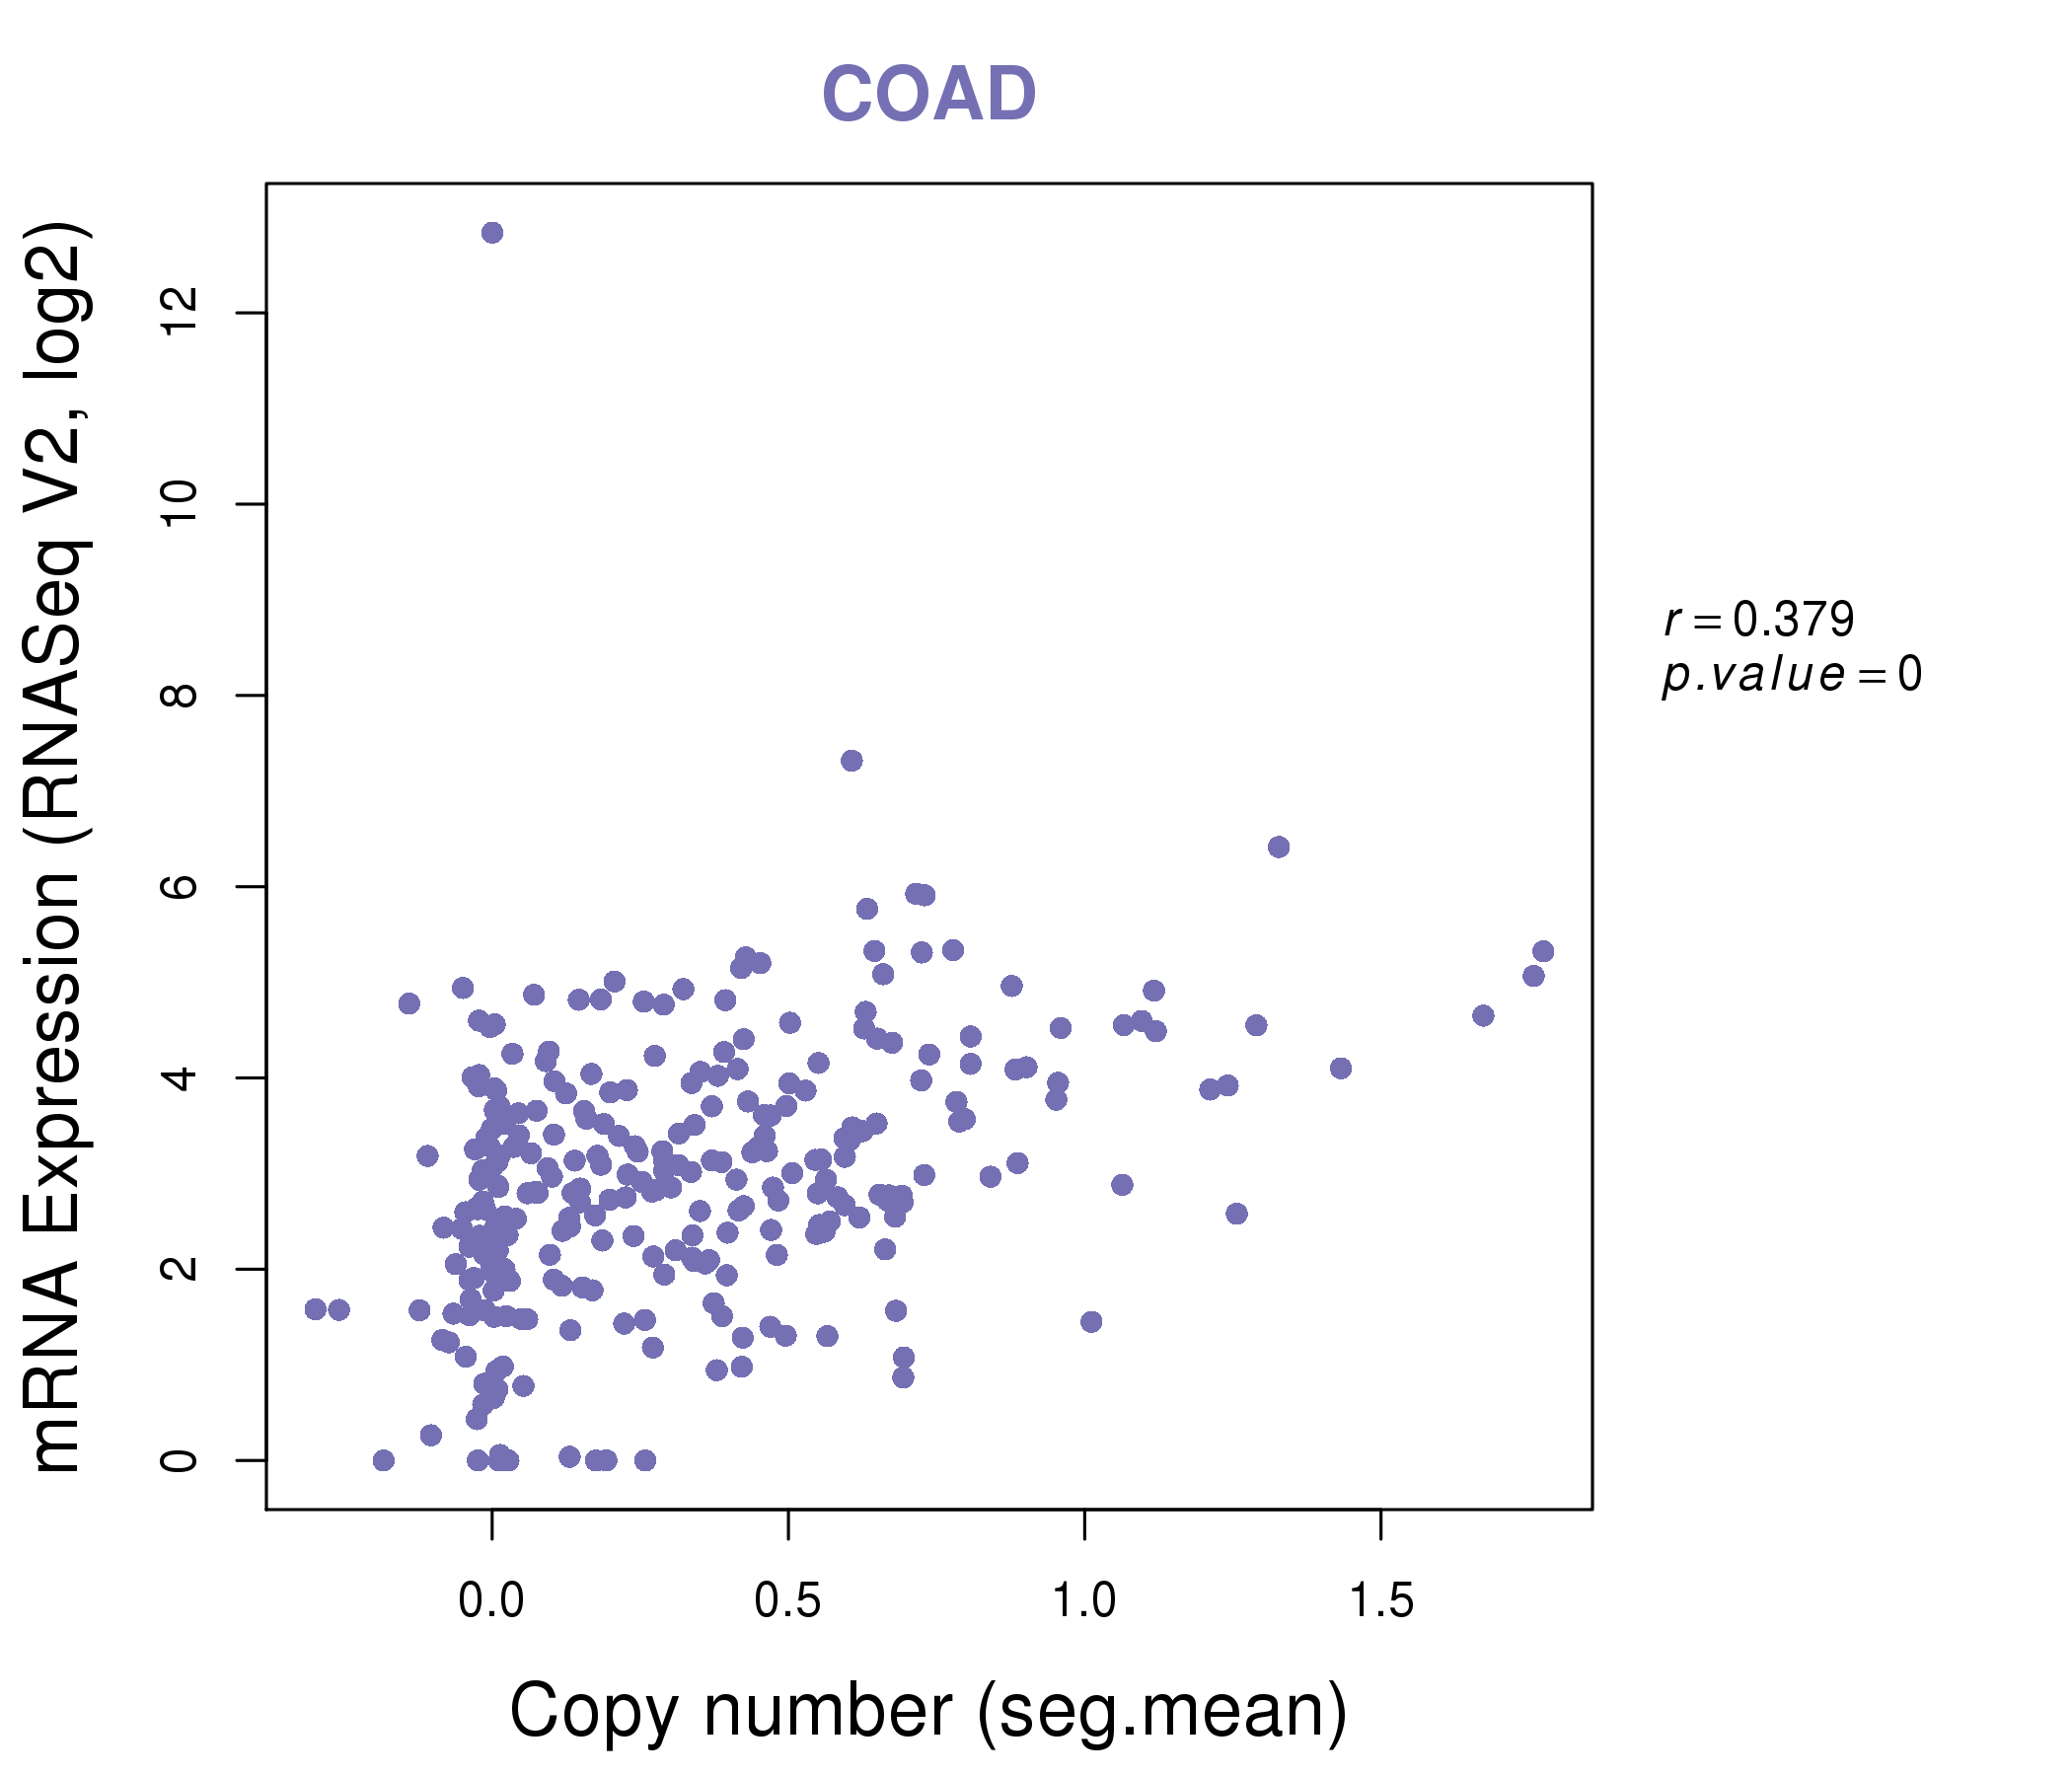
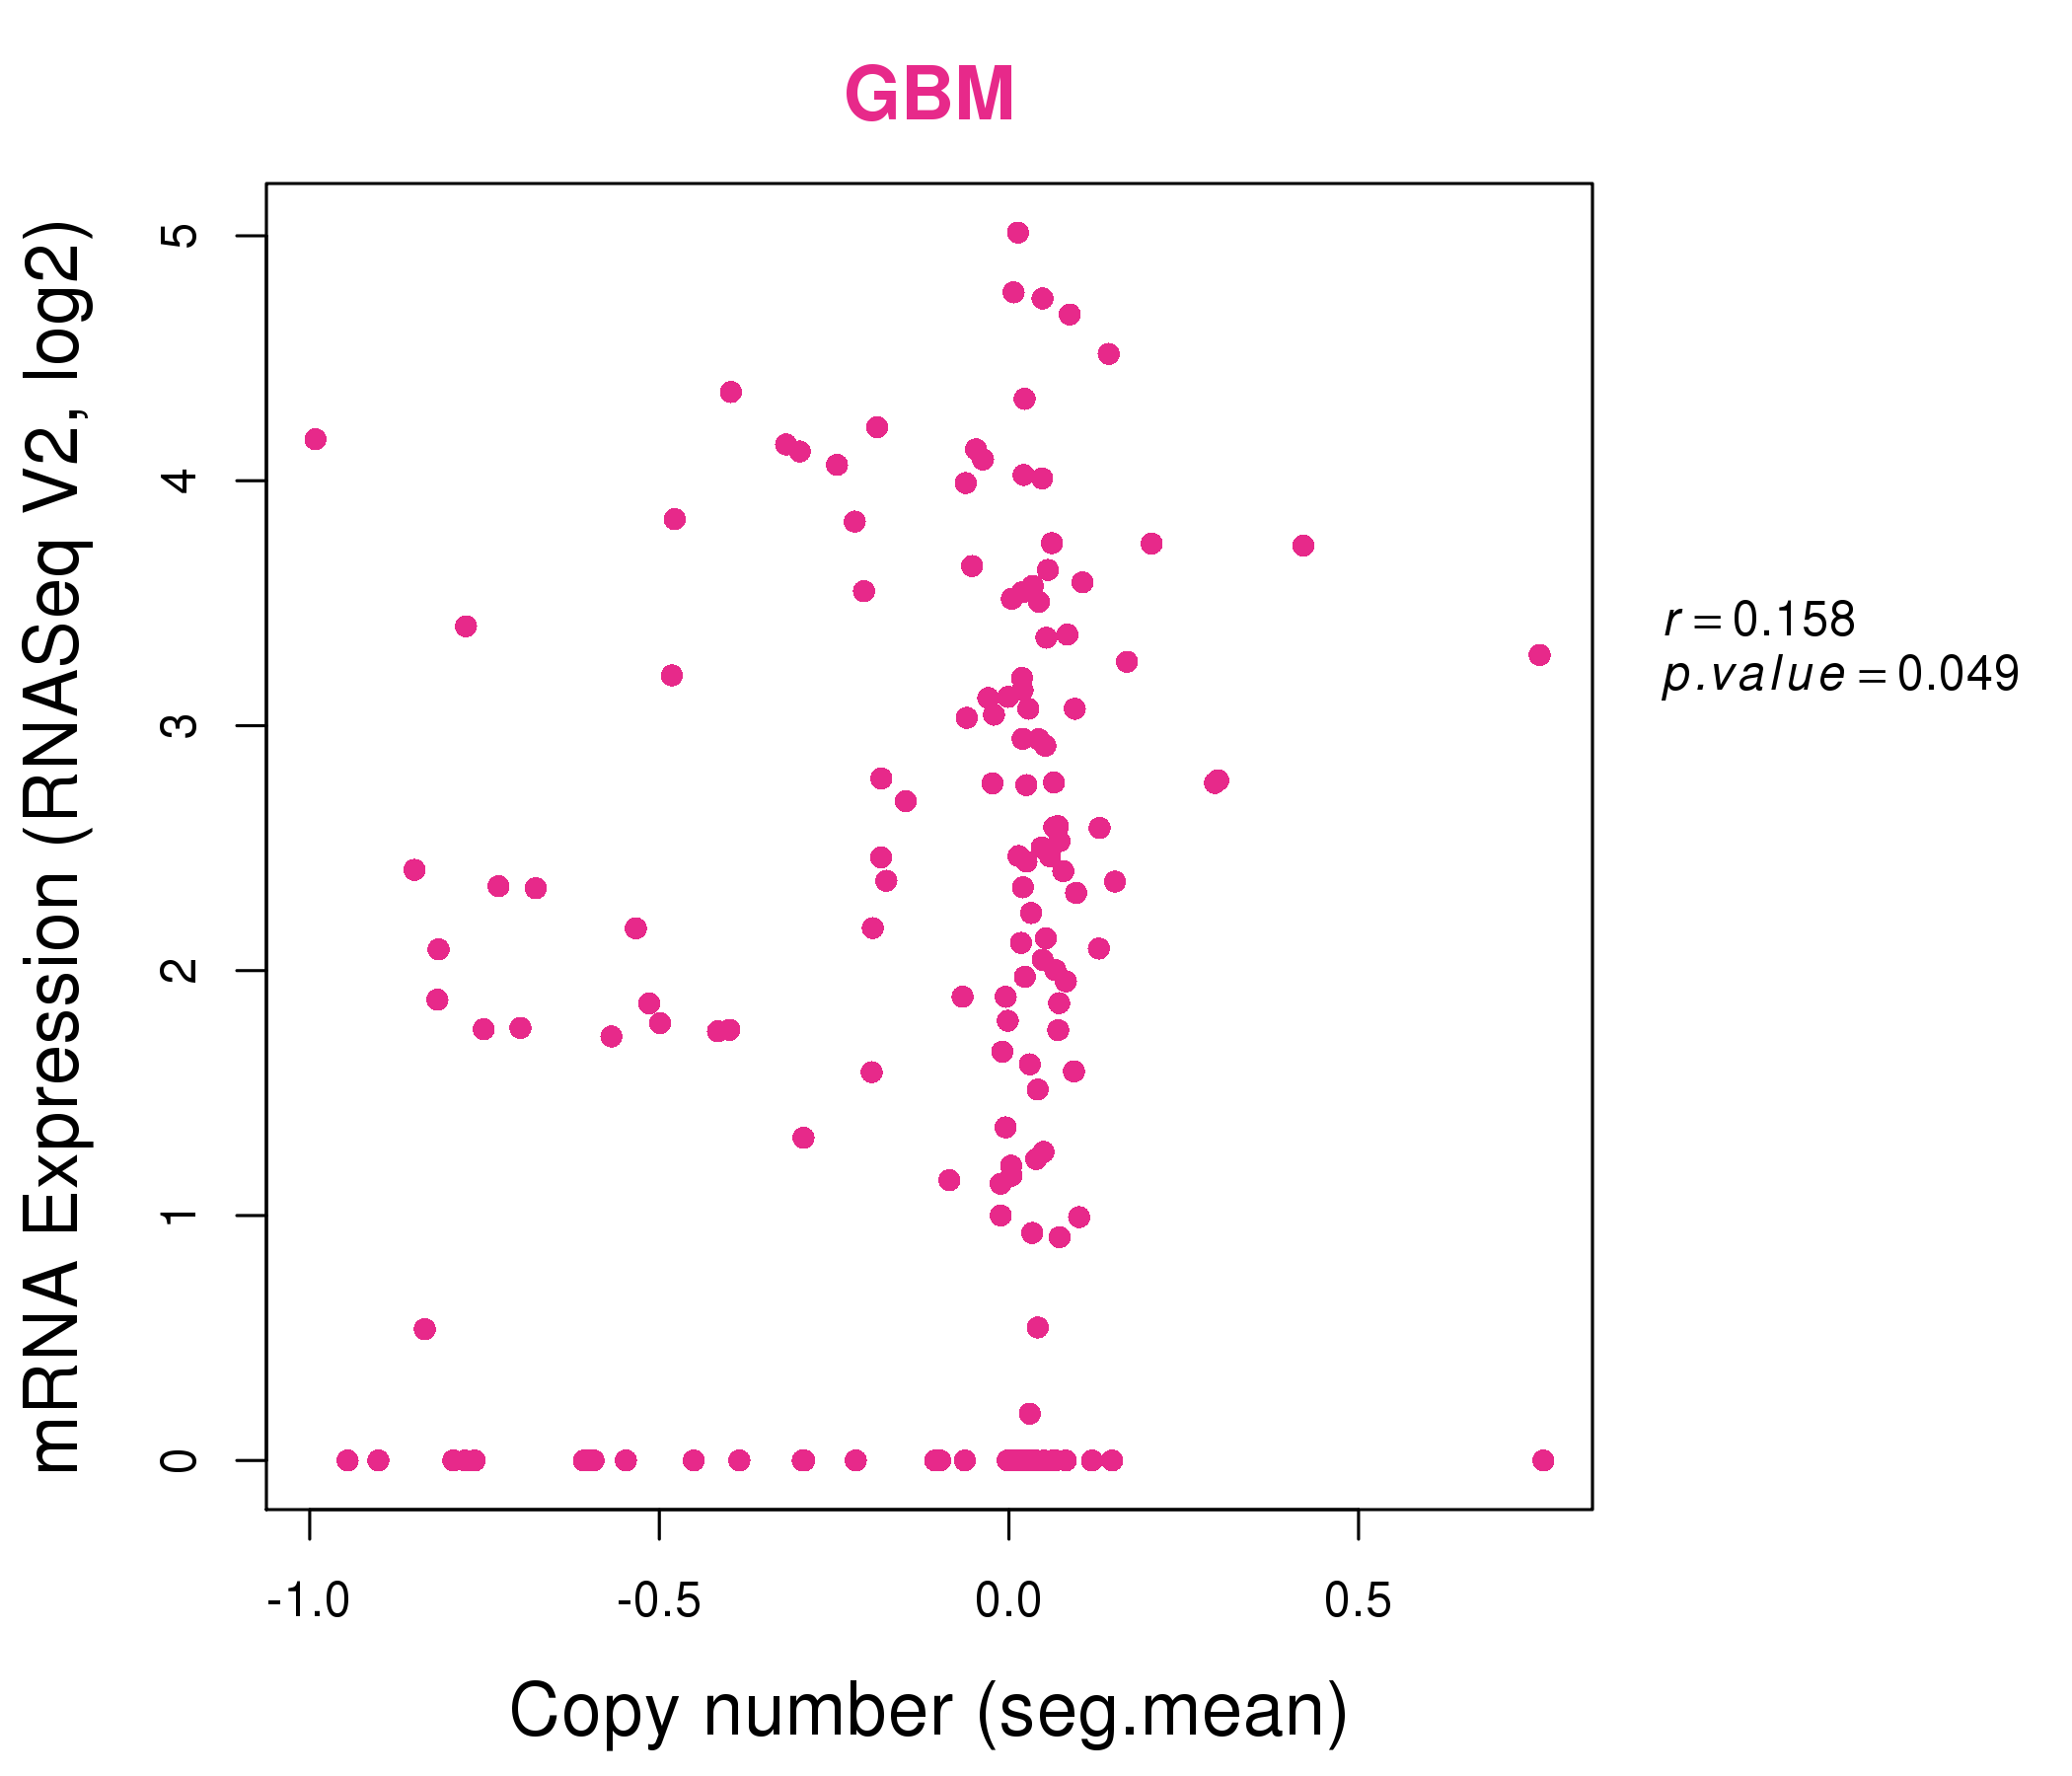
| * This plots show the correlation between CNV and gene expression. |
: Open all plots for all cancer types
 |
|
 |
|
| Top |
| Gene-Gene Network Information |
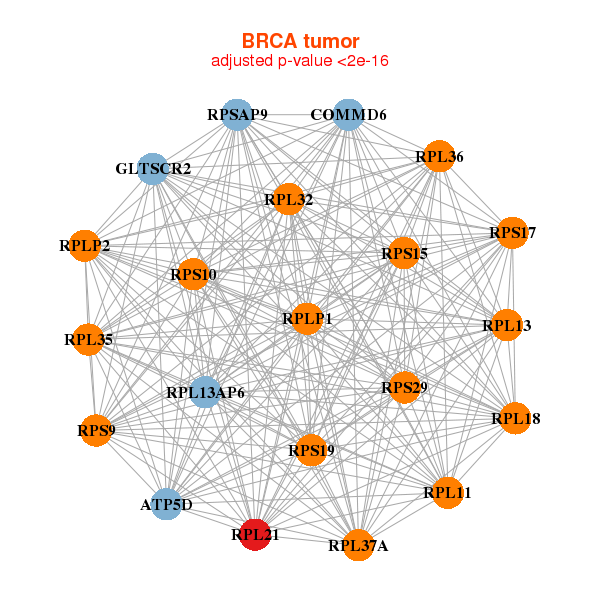
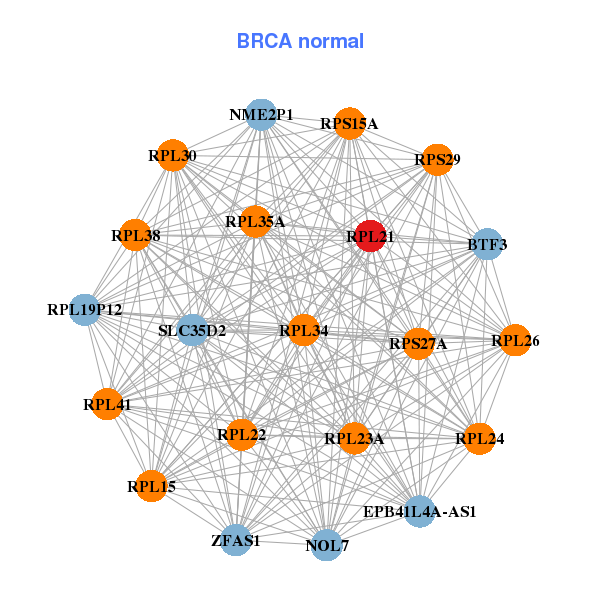
| * Co-Expression network figures were drawn using R package igraph. Only the top 20 genes with the highest correlations were shown. Red circle: input gene, orange circle: cell metabolism gene, sky circle: other gene |
: Open all plots for all cancer types
 |
|
| ATP5D,COMMD6,GLTSCR2,RPL11,RPL13,RPL13AP6,RPL18, RPL21,RPL32,RPL35,RPL36,RPL37A,RPLP1,RPLP2, RPS10,RPS15,RPS17,RPS19,RPS29,RPS9,RPSAP9 | BTF3,ZFAS1,EPB41L4A-AS1,NME2P1,NOL7,RPL15,RPL19P12, RPL21,RPL22,RPL23A,RPL24,RPL26,RPL30,RPL34, RPL35A,RPL38,RPL41,RPS15A,RPS27A,RPS29,SLC35D2 |
 |
|
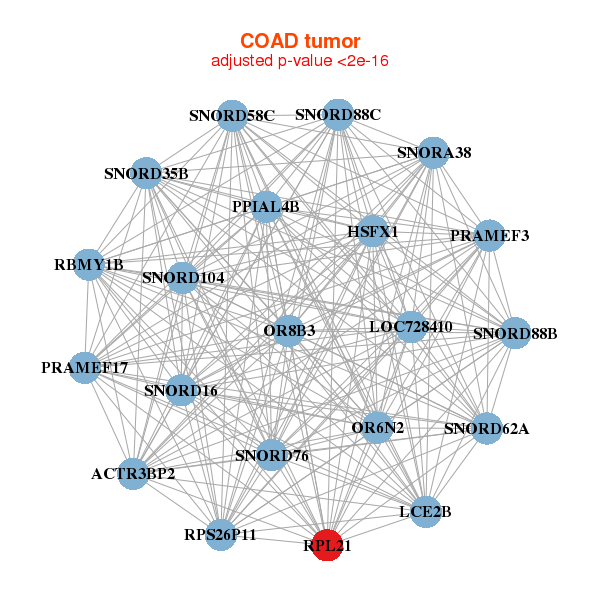
| ACTR3BP2,HSFX1,LCE2B,LOC728410,OR6N2,OR8B3,PPIAL4B, PRAMEF17,PRAMEF3,RBMY1B,RPL21,RPS26P11,SNORA38,SNORD104, SNORD16,SNORD35B,SNORD58C,SNORD62A,SNORD76,SNORD88B,SNORD88C | ANKRD19P,ANXA2P1,BCAS4,IGBP1P1,HMGN2P46,EDARADD,LOC100130331, LOC100133957,LOC407835,LOC649330,LYPLA2P1,NACA2,NME2P1,PGAM4, PIN1P1,POTEF,RPL13AP6,RPL19P12,RPL21,RPL31P11,UBE2NL |
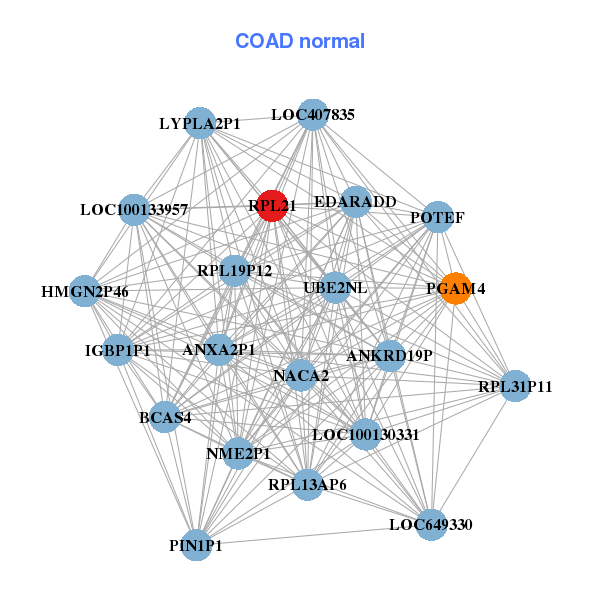
| * Co-Expression network figures were drawn using R package igraph. Only the top 20 genes with the highest correlations were shown. Red circle: input gene, orange circle: cell metabolism gene, sky circle: other gene |
: Open all plots for all cancer types
| Top |
: Open all interacting genes' information including KEGG pathway for all interacting genes from DAVID
| Top |
| Pharmacological Information for RPL21 |
| There's no related Drug. |
| Top |
| Cross referenced IDs for RPL21 |
| * We obtained these cross-references from Uniprot database. It covers 150 different DBs, 18 categories. http://www.uniprot.org/help/cross_references_section |
: Open all cross reference information
|
Copyright © 2016-Present - The Univsersity of Texas Health Science Center at Houston @ |