|
||||||||||||||||||||
| |
| Phenotypic Information (metabolism pathway, cancer, disease, phenome) |
| |
| |
| Gene-Gene Network Information: Co-Expression Network, Interacting Genes & KEGG |
| |
|


| Gene Summary for RPL27 |
| Basic gene info. | Gene symbol | RPL27 |
| Gene name | ribosomal protein L27 | |
| Synonyms | L27 | |
| Cytomap | UCSC genome browser: 17q21 | |
| Genomic location | chr17 :41150445-41154971 | |
| Type of gene | protein-coding | |
| RefGenes | NM_000988.3, | |
| Ensembl id | ENSG00000131469 | |
| Description | 60S ribosomal protein L27 | |
| Modification date | 20141207 | |
| dbXrefs | MIM : 607526 | |
| HGNC : HGNC | ||
| Ensembl : ENSG00000131469 | ||
| HPRD : 09602 | ||
| Vega : OTTHUMG00000180660 | ||
| Protein | UniProt: go to UniProt's Cross Reference DB Table | |
| Expression | CleanEX: HS_RPL27 | |
| BioGPS: 6155 | ||
| Gene Expression Atlas: ENSG00000131469 | ||
| The Human Protein Atlas: ENSG00000131469 | ||
| Pathway | NCI Pathway Interaction Database: RPL27 | |
| KEGG: RPL27 | ||
| REACTOME: RPL27 | ||
| ConsensusPathDB | ||
| Pathway Commons: RPL27 | ||
| Metabolism | MetaCyc: RPL27 | |
| HUMANCyc: RPL27 | ||
| Regulation | Ensembl's Regulation: ENSG00000131469 | |
| miRBase: chr17 :41,150,445-41,154,971 | ||
| TargetScan: NM_000988 | ||
| cisRED: ENSG00000131469 | ||
| Context | iHOP: RPL27 | |
| cancer metabolism search in PubMed: RPL27 | ||
| UCL Cancer Institute: RPL27 | ||
| Assigned class in ccmGDB | C | |
| Top |
| Phenotypic Information for RPL27(metabolism pathway, cancer, disease, phenome) |
| Cancer | CGAP: RPL27 |
| Familial Cancer Database: RPL27 | |
| * This gene is included in those cancer gene databases. |
|
|
|
|
|
| . | ||||||||||||||
Oncogene 1 | Significant driver gene in | |||||||||||||||||||
| cf) number; DB name 1 Oncogene; http://nar.oxfordjournals.org/content/35/suppl_1/D721.long, 2 Tumor Suppressor gene; https://bioinfo.uth.edu/TSGene/, 3 Cancer Gene Census; http://www.nature.com/nrc/journal/v4/n3/abs/nrc1299.html, 4 CancerGenes; http://nar.oxfordjournals.org/content/35/suppl_1/D721.long, 5 Network of Cancer Gene; http://ncg.kcl.ac.uk/index.php, 1Therapeutic Vulnerabilities in Cancer; http://cbio.mskcc.org/cancergenomics/statius/ |
| REACTOME_METABOLISM_OF_PROTEINS REACTOME_METABOLISM_OF_MRNA REACTOME_METABOLISM_OF_RNA | |
| OMIM | |
| Orphanet | |
| Disease | KEGG Disease: RPL27 |
| MedGen: RPL27 (Human Medical Genetics with Condition) | |
| ClinVar: RPL27 | |
| Phenotype | MGI: RPL27 (International Mouse Phenotyping Consortium) |
| PhenomicDB: RPL27 | |
| Mutations for RPL27 |
| * Under tables are showing count per each tissue to give us broad intuition about tissue specific mutation patterns.You can go to the detailed page for each mutation database's web site. |
| There's no structural variation information in COSMIC data for this gene. |
| * From mRNA Sanger sequences, Chitars2.0 arranged chimeric transcripts. This table shows RPL27 related fusion information. |
| ID | Head Gene | Tail Gene | Accession | Gene_a | qStart_a | qEnd_a | Chromosome_a | tStart_a | tEnd_a | Gene_a | qStart_a | qEnd_a | Chromosome_a | tStart_a | tEnd_a |
| EC440105 | RPL27 | 1 | 48 | 17 | 41150801 | 41150848 | NME2 | 44 | 96 | 17 | 49245608 | 49245660 | |
| EC572330 | RPL27 | 5 | 51 | 17 | 41150802 | 41150848 | NME2 | 47 | 99 | 17 | 49245608 | 49245660 | |
| DB013482 | RPL27 | 1 | 450 | 17 | 41150452 | 41154938 | KRT13 | 451 | 576 | 17 | 39661739 | 39661864 | |
| EC578828 | RPL27 | 1 | 49 | 17 | 41150800 | 41150848 | CASP12 | 37 | 58 | 11 | 104761981 | 104762002 | |
| BU674462 | RPL27 | 8 | 456 | 17 | 41150769 | 41154976 | C1orf210 | 453 | 640 | 1 | 43747912 | 43748098 | |
| AA503644 | OXA1L | 1 | 273 | 14 | 23240714 | 23240992 | RPL27 | 272 | 485 | 17 | 41150760 | 41152074 | |
| CV327307 | RPL27 | 1 | 339 | 17 | 41150760 | 41154769 | RASIP1 | 334 | 401 | 19 | 49228152 | 49228219 | |
| CV327308 | RPL27 | 1 | 339 | 17 | 41150760 | 41154769 | RASIP1 | 334 | 401 | 19 | 49228152 | 49228219 | |
| BC021886 | RPL27 | 1 | 70 | 17 | 41154906 | 41154975 | RPL27 | 66 | 482 | 17 | 41150801 | 41154976 | |
| CV327306 | RPL27 | 1 | 339 | 17 | 41150760 | 41154769 | RASIP1 | 334 | 542 | 19 | 49228152 | 49230303 | |
| BU685466 | RPL27 | 1 | 69 | 17 | 41154913 | 41155331 | RPL27 | 65 | 393 | 17 | 41151948 | 41154934 | |
| T59674 | RPS6 | 1 | 150 | 9 | 19376253 | 19376507 | RPL27 | 150 | 432 | 17 | 41150472 | 41152121 | |
| FJ655906 | RPL27 | 11 | 345 | 17 | 41150760 | 41154765 | NME2 | 345 | 395 | 17 | 49248882 | 49248932 | |
| Top |
| There's no copy number variation information in COSMIC data for this gene. |
| Top |
|
 |
| Top |
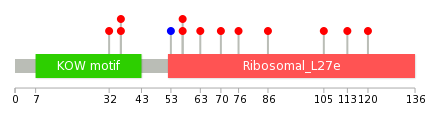
| Stat. for Non-Synonymous SNVs (# total SNVs=8) | (# total SNVs=1) |
 |  |
(# total SNVs=0) | (# total SNVs=0) |
| Top |
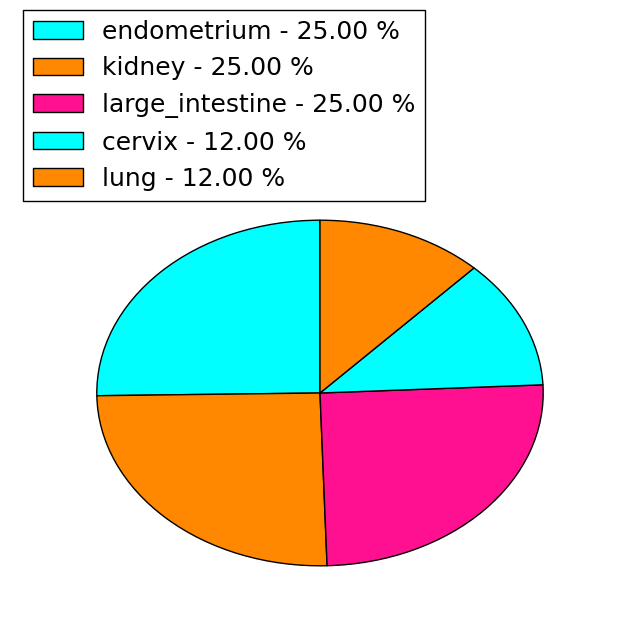
| * When you move the cursor on each content, you can see more deailed mutation information on the Tooltip. Those are primary_site,primary_histology,mutation(aa),pubmedID. |
| GRCh37 position | Mutation(aa) | Unique sampleID count |
| chr17:41152038-41152038 | p.M57K | 2 |
| chr17:41151975-41151975 | p.R36H | 1 |
| chr17:41152027-41152027 | p.V53V | 1 |
| chr17:41152055-41152055 | p.A63S | 1 |
| chr17:41152077-41152077 | p.S70F | 1 |
| chr17:41152095-41152095 | p.N76S | 1 |
| chr17:41154694-41154694 | p.S86T | 1 |
| chr17:41154751-41154751 | p.A105S | 1 |
| chr17:41154776-41154776 | p.E113G | 1 |
| chr17:41151963-41151963 | p.G32D | 1 |
| Top |
|
 |
| Point Mutation/ Tissue ID | 1 | 2 | 3 | 4 | 5 | 6 | 7 | 8 | 9 | 10 | 11 | 12 | 13 | 14 | 15 | 16 | 17 | 18 | 19 | 20 |
| # sample | 1 | 1 | 2 | 3 | 2 | |||||||||||||||
| # mutation | 1 | 1 | 2 | 3 | 2 | |||||||||||||||
| nonsynonymous SNV | 1 | 1 | 2 | 3 | 2 | |||||||||||||||
| synonymous SNV |
| cf) Tissue ID; Tissue type (1; BLCA[Bladder Urothelial Carcinoma], 2; BRCA[Breast invasive carcinoma], 3; CESC[Cervical squamous cell carcinoma and endocervical adenocarcinoma], 4; COAD[Colon adenocarcinoma], 5; GBM[Glioblastoma multiforme], 6; Glioma Low Grade, 7; HNSC[Head and Neck squamous cell carcinoma], 8; KICH[Kidney Chromophobe], 9; KIRC[Kidney renal clear cell carcinoma], 10; KIRP[Kidney renal papillary cell carcinoma], 11; LAML[Acute Myeloid Leukemia], 12; LUAD[Lung adenocarcinoma], 13; LUSC[Lung squamous cell carcinoma], 14; OV[Ovarian serous cystadenocarcinoma ], 15; PAAD[Pancreatic adenocarcinoma], 16; PRAD[Prostate adenocarcinoma], 17; SKCM[Skin Cutaneous Melanoma], 18:STAD[Stomach adenocarcinoma], 19:THCA[Thyroid carcinoma], 20:UCEC[Uterine Corpus Endometrial Carcinoma]) |
| Top |
| * We represented just top 10 SNVs. When you move the cursor on each content, you can see more deailed mutation information on the Tooltip. Those are primary_site, primary_histology, mutation(aa), pubmedID. |
| Genomic Position | Mutation(aa) | Unique sampleID count |
| chr17:41152038 | p.M57T | 2 |
| chr17:41152077 | p.S86T | 1 |
| chr17:41154694 | p.A105S | 1 |
| chr17:41154751 | p.E113G | 1 |
| chr17:41154776 | p.E120D | 1 |
| chr17:41154798 | p.R36C | 1 |
| chr17:41151974 | p.R36H | 1 |
| chr17:41151975 | p.S70F | 1 |
| * Copy number data were extracted from TCGA using R package TCGA-Assembler. The URLs of all public data files on TCGA DCC data server were gathered on Jan-05-2015. Function ProcessCNAData in TCGA-Assembler package was used to obtain gene-level copy number value which is calculated as the average copy number of the genomic region of a gene. |
 |
| cf) Tissue ID[Tissue type]: BLCA[Bladder Urothelial Carcinoma], BRCA[Breast invasive carcinoma], CESC[Cervical squamous cell carcinoma and endocervical adenocarcinoma], COAD[Colon adenocarcinoma], GBM[Glioblastoma multiforme], Glioma Low Grade, HNSC[Head and Neck squamous cell carcinoma], KICH[Kidney Chromophobe], KIRC[Kidney renal clear cell carcinoma], KIRP[Kidney renal papillary cell carcinoma], LAML[Acute Myeloid Leukemia], LUAD[Lung adenocarcinoma], LUSC[Lung squamous cell carcinoma], OV[Ovarian serous cystadenocarcinoma ], PAAD[Pancreatic adenocarcinoma], PRAD[Prostate adenocarcinoma], SKCM[Skin Cutaneous Melanoma], STAD[Stomach adenocarcinoma], THCA[Thyroid carcinoma], UCEC[Uterine Corpus Endometrial Carcinoma] |
| Top |
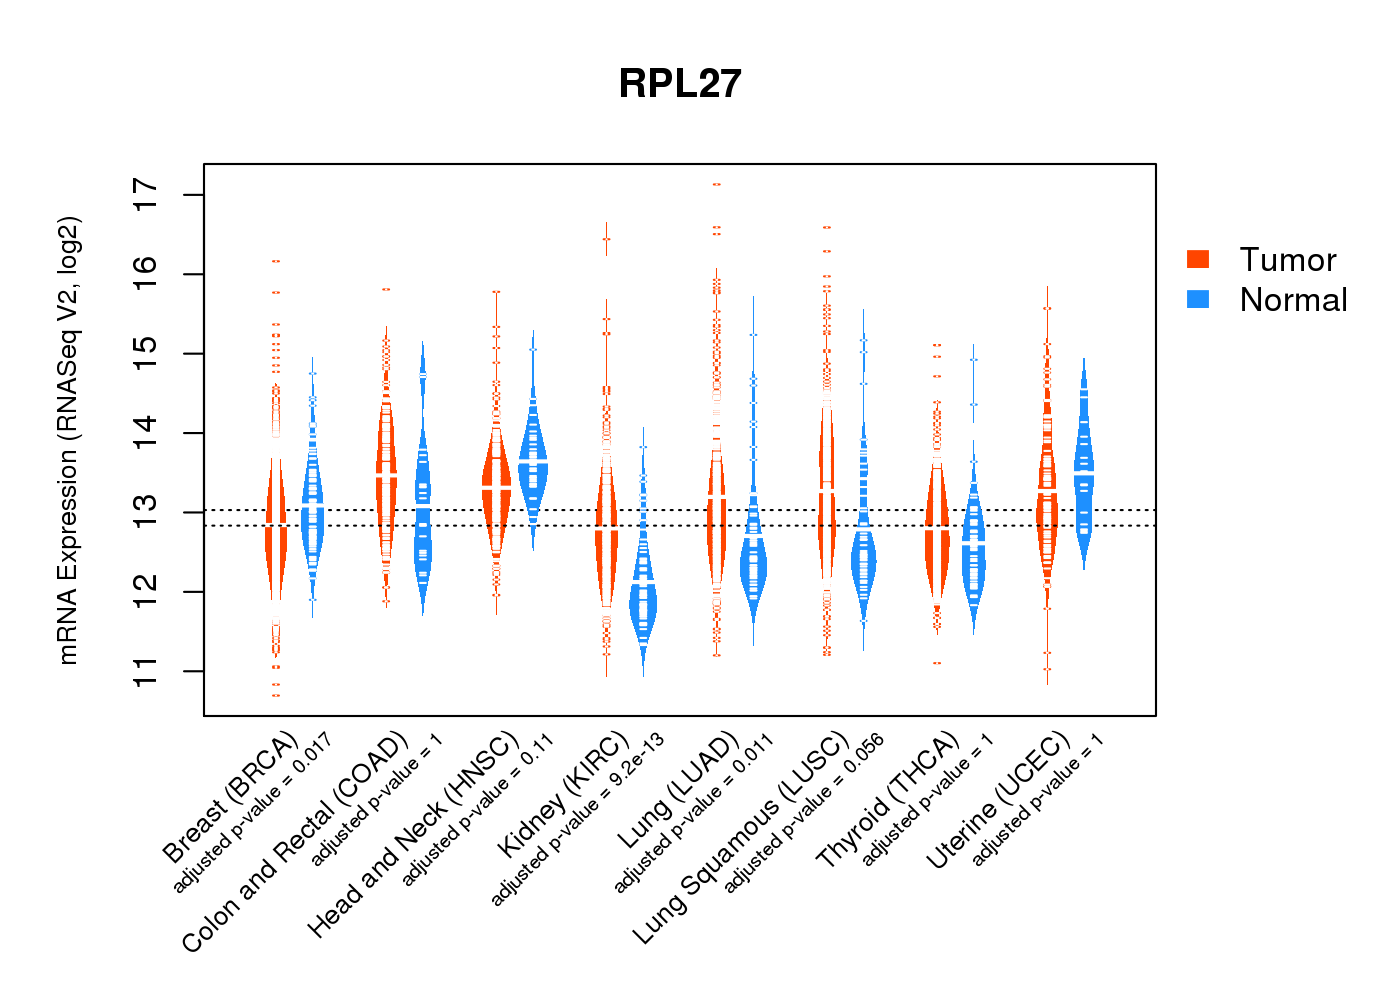
| Gene Expression for RPL27 |
| * CCLE gene expression data were extracted from CCLE_Expression_Entrez_2012-10-18.res: Gene-centric RMA-normalized mRNA expression data. |
 |
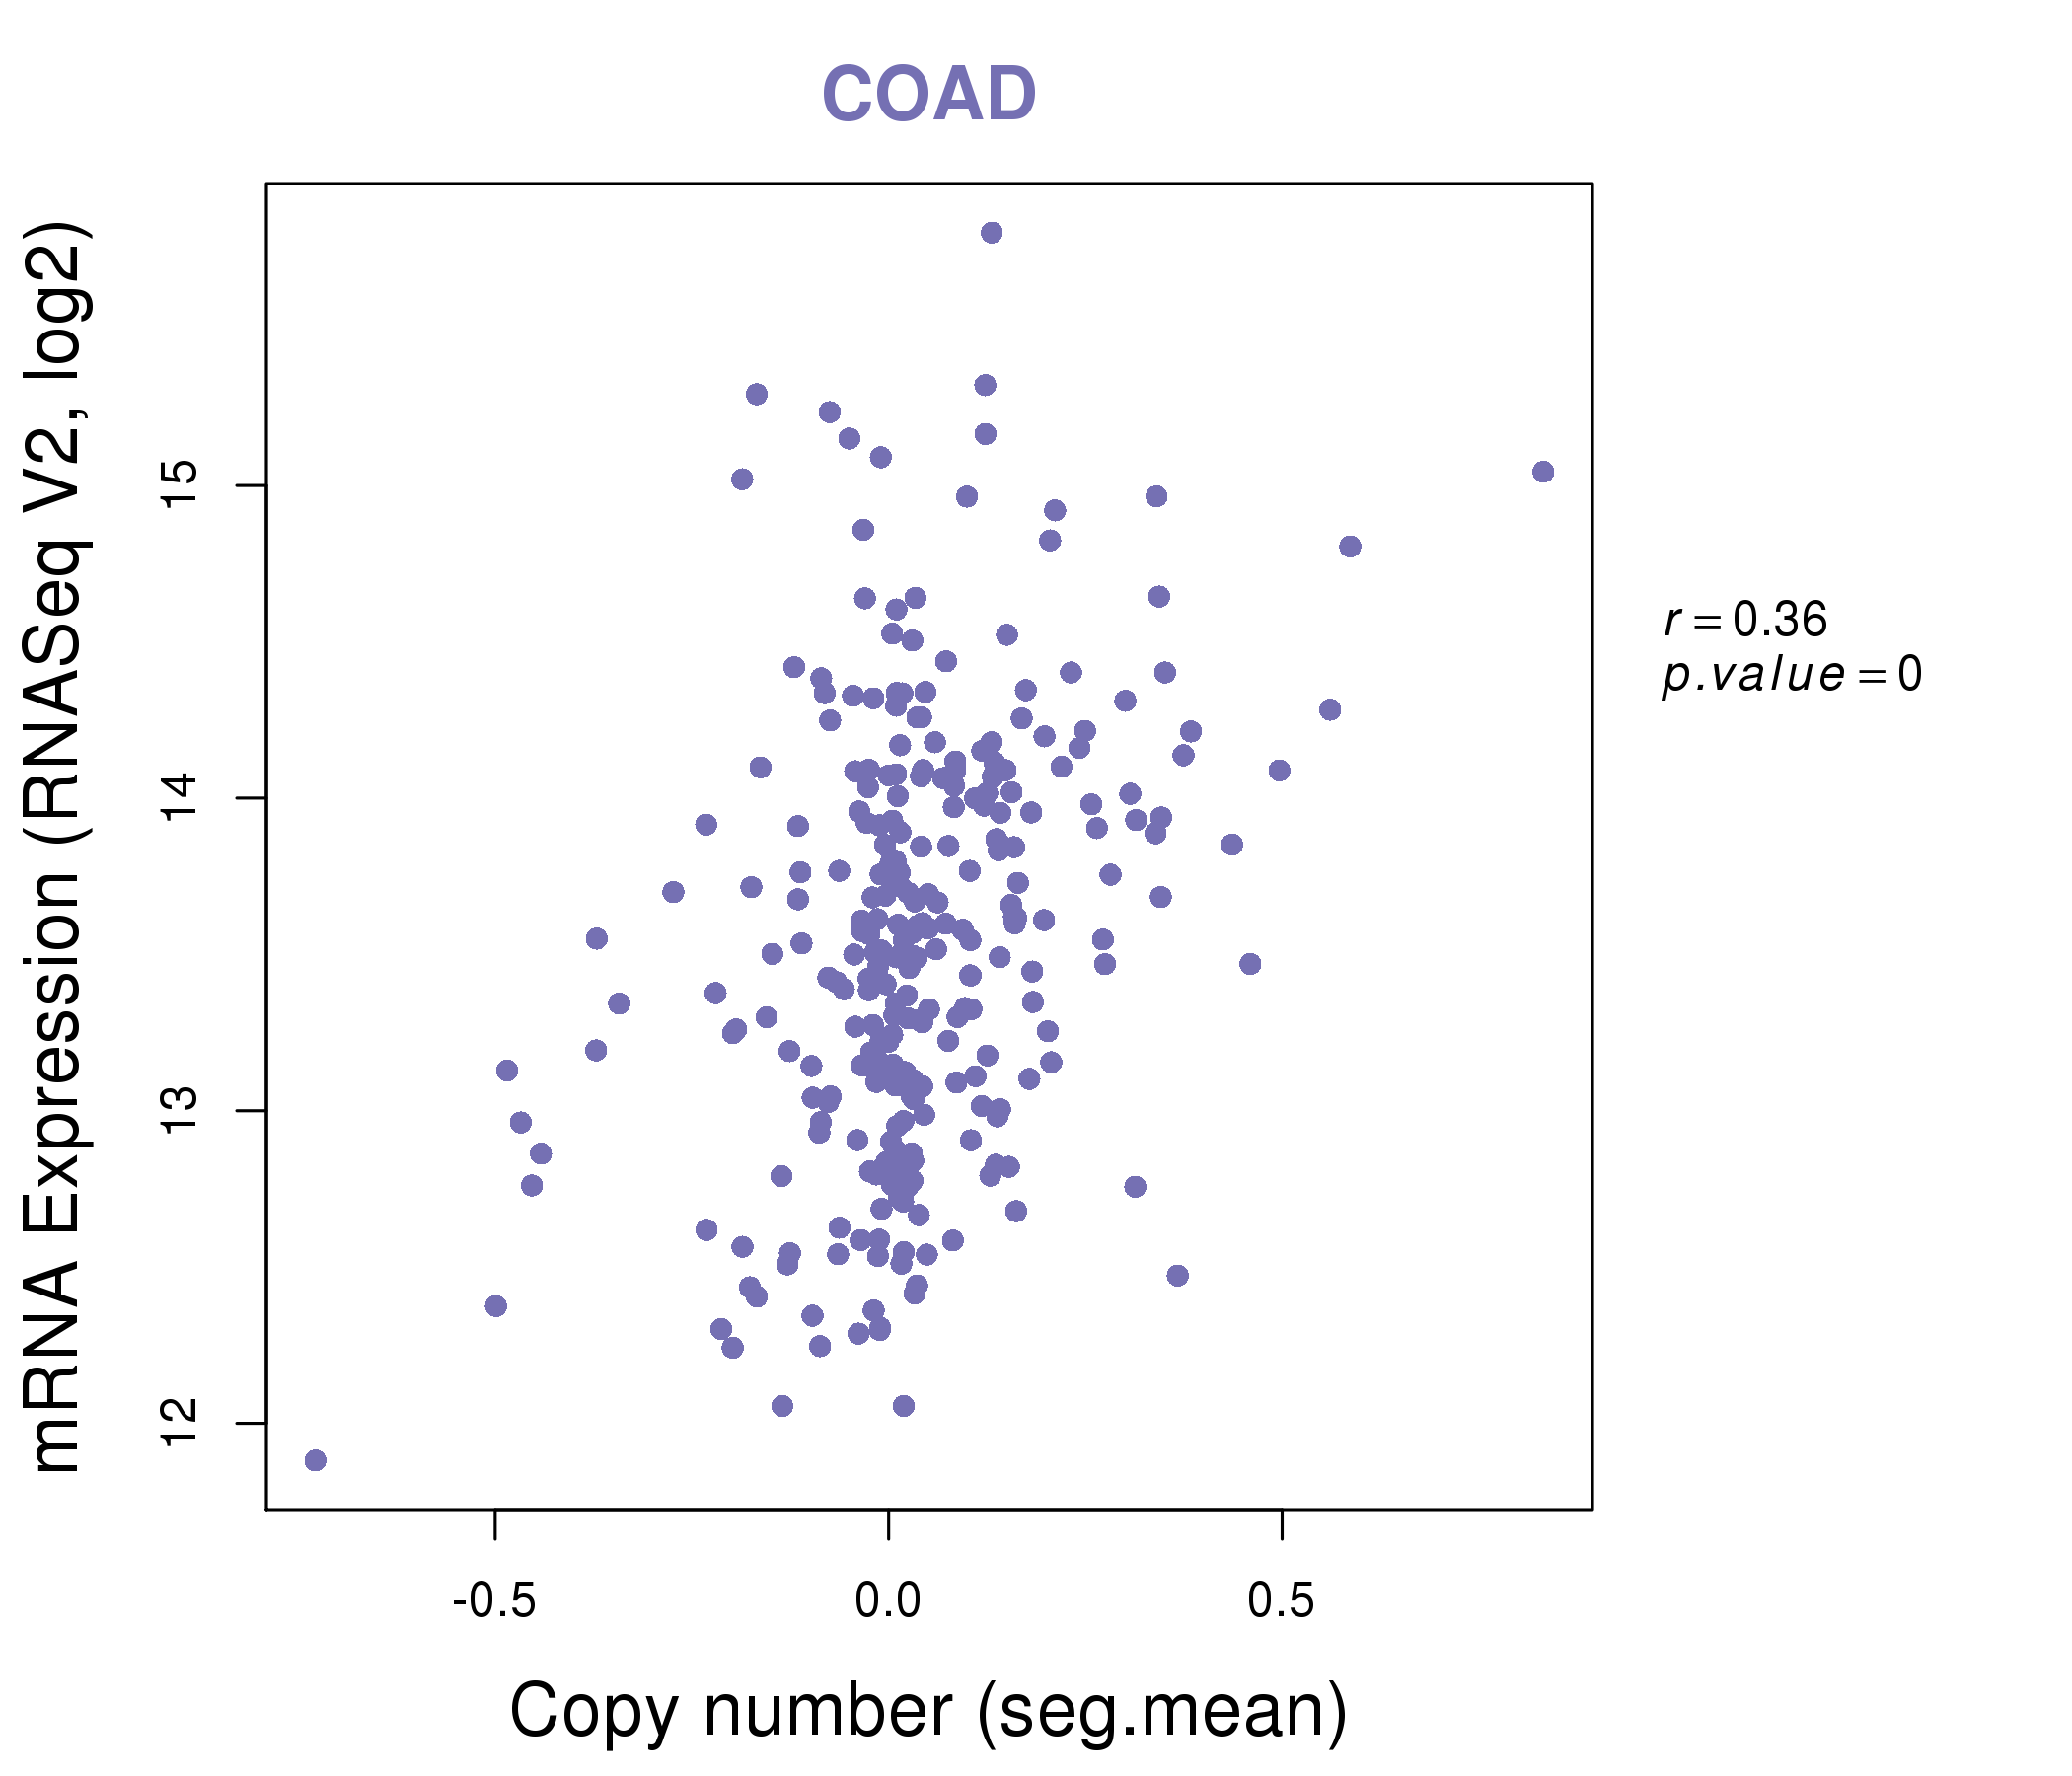
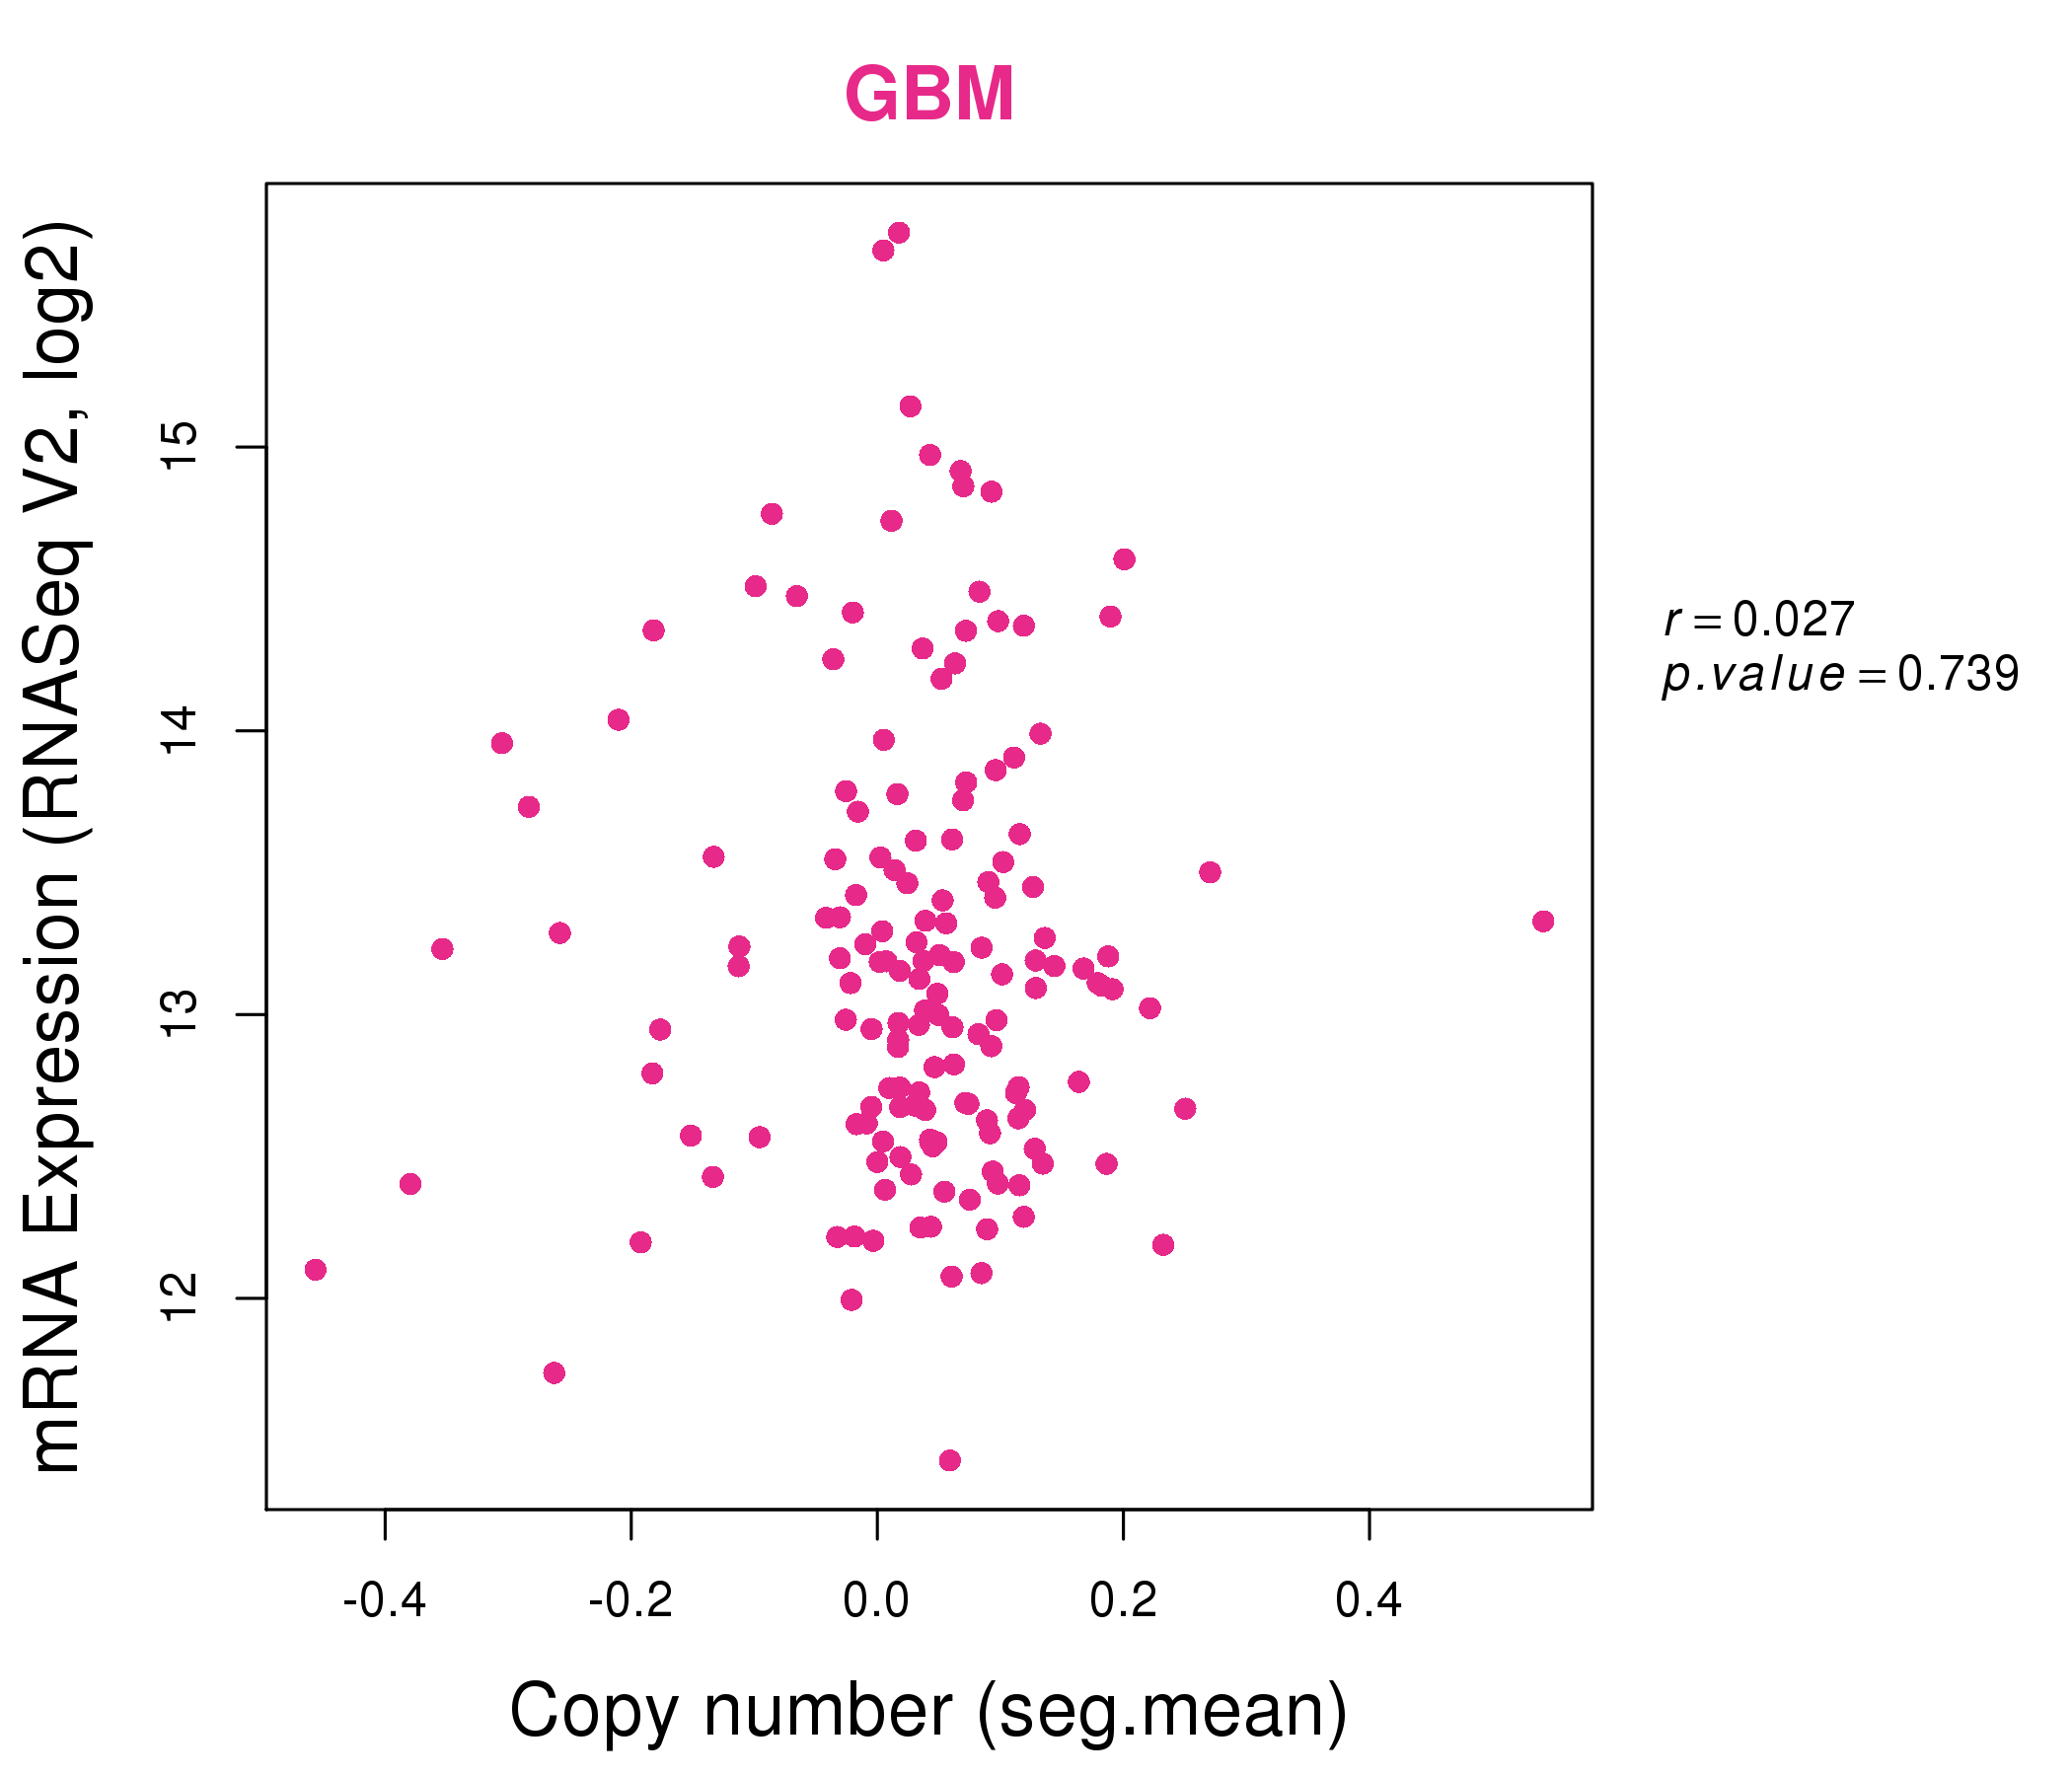
| * Normalized gene expression data of RNASeqV2 was extracted from TCGA using R package TCGA-Assembler. The URLs of all public data files on TCGA DCC data server were gathered at Jan-05-2015. Only eight cancer types have enough normal control samples for differential expression analysis. (t test, adjusted p<0.05 (using Benjamini-Hochberg FDR)) |
 |
| Top |
| * This plots show the correlation between CNV and gene expression. |
: Open all plots for all cancer types
 |
|
 |
|

| Top |
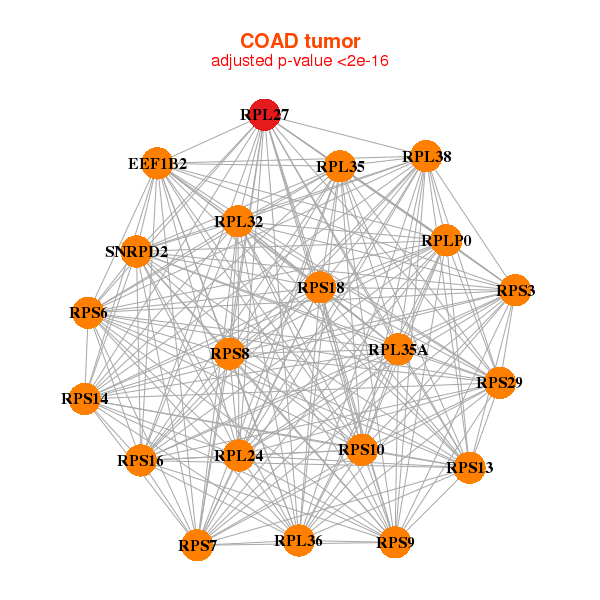
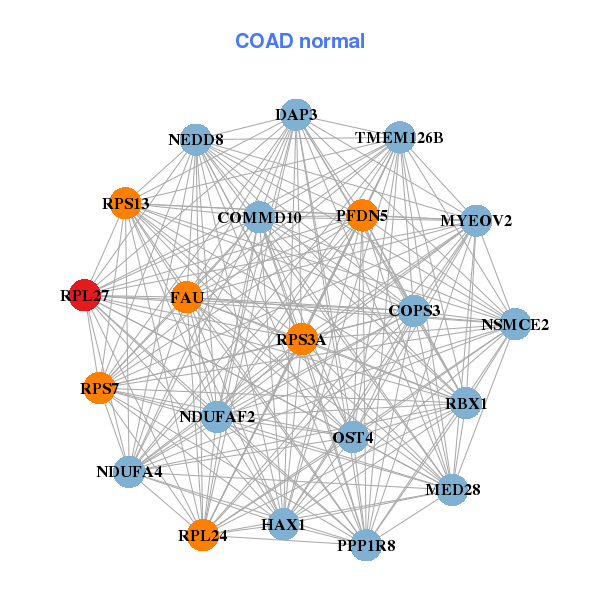
| Gene-Gene Network Information |
| * Co-Expression network figures were drawn using R package igraph. Only the top 20 genes with the highest correlations were shown. Red circle: input gene, orange circle: cell metabolism gene, sky circle: other gene |
: Open all plots for all cancer types
 |
|
| EIF3F,RPL11,RPL13,RPL14,RPL18,RPL24,RPL27A, RPL31,RPL32,RPL36,RPL37,RPL37A,RPLP2,RPS10, RPS11,RPS13,RPS18,RPS19,RPS2,RPS8,RPS9 | NME2,PFDN5,RPL10,RPL11,RPL12,RPL13,RPL18, RPL24,RPL27A,RPL36,RPL38,RPL7A,RPL8,RPLP1, RPS11,RPS14,RPS24,RPS3,RPS8,SNRPD2,SNRPF |
 |
|
| AKIP1,LCN15,RPL14,RPL24,RPL27A,RPL29,RPL32, RPL35A,RPL7A,RPS11,RPS13,RPS14,RPS15A,RPS18, RPS25,RPS3,RPS9,RPSA,RPSAP58,TMEM9B,TSSC4 | TMEM261,DPY30,EEF1B2,HSCB,LSM2,RPL24,RPL27A, RPL35,RPL35A,RPL41,RPS10,RPS11,RPS13,RPS14, RPS18,RPS3A,RPS5,RPS6,RPS7,RPS8,SNRPD2 |
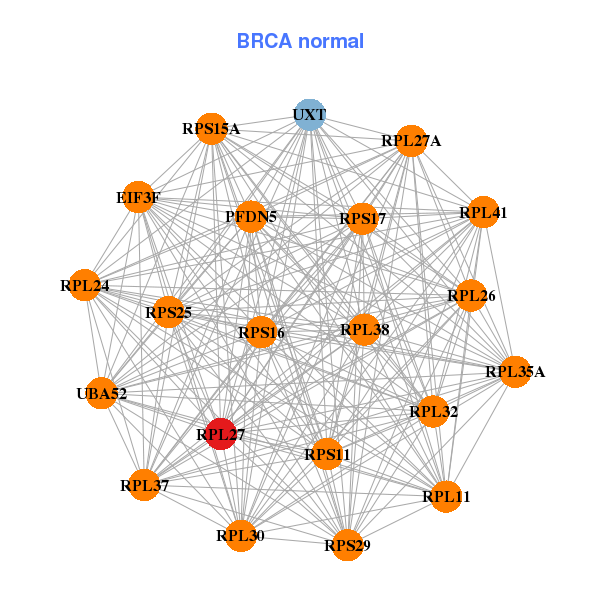
| * Co-Expression network figures were drawn using R package igraph. Only the top 20 genes with the highest correlations were shown. Red circle: input gene, orange circle: cell metabolism gene, sky circle: other gene |
: Open all plots for all cancer types
| Top |
: Open all interacting genes' information including KEGG pathway for all interacting genes from DAVID
| Top |
| Pharmacological Information for RPL27 |
| There's no related Drug. |
| Top |
| Cross referenced IDs for RPL27 |
| * We obtained these cross-references from Uniprot database. It covers 150 different DBs, 18 categories. http://www.uniprot.org/help/cross_references_section |
: Open all cross reference information
|
Copyright © 2016-Present - The Univsersity of Texas Health Science Center at Houston @ |