|
||||||||||||||||||||
| |
| Phenotypic Information (metabolism pathway, cancer, disease, phenome) |
| |
| |
| Gene-Gene Network Information: Co-Expression Network, Interacting Genes & KEGG |
| |
|


| Gene Summary for RPL30 |
| Basic gene info. | Gene symbol | RPL30 |
| Gene name | ribosomal protein L30 | |
| Synonyms | L30 | |
| Cytomap | UCSC genome browser: 8q22 | |
| Genomic location | chr8 :99053937-99057818 | |
| Type of gene | protein-coding | |
| RefGenes | NM_000989.3, | |
| Ensembl id | ENSG00000156482 | |
| Description | 60S ribosomal protein L30 | |
| Modification date | 20141207 | |
| dbXrefs | MIM : 180467 | |
| HGNC : HGNC | ||
| Ensembl : ENSG00000156482 | ||
| HPRD : 01595 | ||
| Vega : OTTHUMG00000164796 | ||
| Protein | UniProt: P62888 go to UniProt's Cross Reference DB Table | |
| Expression | CleanEX: HS_RPL30 | |
| BioGPS: 6156 | ||
| Gene Expression Atlas: ENSG00000156482 | ||
| The Human Protein Atlas: ENSG00000156482 | ||
| Pathway | NCI Pathway Interaction Database: RPL30 | |
| KEGG: RPL30 | ||
| REACTOME: RPL30 | ||
| ConsensusPathDB | ||
| Pathway Commons: RPL30 | ||
| Metabolism | MetaCyc: RPL30 | |
| HUMANCyc: RPL30 | ||
| Regulation | Ensembl's Regulation: ENSG00000156482 | |
| miRBase: chr8 :99,053,937-99,057,818 | ||
| TargetScan: NM_000989 | ||
| cisRED: ENSG00000156482 | ||
| Context | iHOP: RPL30 | |
| cancer metabolism search in PubMed: RPL30 | ||
| UCL Cancer Institute: RPL30 | ||
| Assigned class in ccmGDB | B - This gene belongs to cancer gene. | |
| Top |
| Phenotypic Information for RPL30(metabolism pathway, cancer, disease, phenome) |
| Cancer | CGAP: RPL30 |
| Familial Cancer Database: RPL30 | |
| * This gene is included in those cancer gene databases. |
|
|
|
|
|
| . | ||||||||||||||
Oncogene 1 | Significant driver gene in | |||||||||||||||||||
| cf) number; DB name 1 Oncogene; http://nar.oxfordjournals.org/content/35/suppl_1/D721.long, 2 Tumor Suppressor gene; https://bioinfo.uth.edu/TSGene/, 3 Cancer Gene Census; http://www.nature.com/nrc/journal/v4/n3/abs/nrc1299.html, 4 CancerGenes; http://nar.oxfordjournals.org/content/35/suppl_1/D721.long, 5 Network of Cancer Gene; http://ncg.kcl.ac.uk/index.php, 1Therapeutic Vulnerabilities in Cancer; http://cbio.mskcc.org/cancergenomics/statius/ |
| REACTOME_METABOLISM_OF_PROTEINS REACTOME_METABOLISM_OF_MRNA REACTOME_METABOLISM_OF_RNA | |
| OMIM | 180467; gene. |
| Orphanet | |
| Disease | KEGG Disease: RPL30 |
| MedGen: RPL30 (Human Medical Genetics with Condition) | |
| ClinVar: RPL30 | |
| Phenotype | MGI: RPL30 (International Mouse Phenotyping Consortium) |
| PhenomicDB: RPL30 | |
| Mutations for RPL30 |
| * Under tables are showing count per each tissue to give us broad intuition about tissue specific mutation patterns.You can go to the detailed page for each mutation database's web site. |
| There's no structural variation information in COSMIC data for this gene. |
| * From mRNA Sanger sequences, Chitars2.0 arranged chimeric transcripts. This table shows RPL30 related fusion information. |
| ID | Head Gene | Tail Gene | Accession | Gene_a | qStart_a | qEnd_a | Chromosome_a | tStart_a | tEnd_a | Gene_a | qStart_a | qEnd_a | Chromosome_a | tStart_a | tEnd_a |
| CD389544 | CACNA1E | 238 | 257 | 1 | 181611728 | 181611747 | RPL30 | 256 | 516 | 8 | 99053949 | 99055003 | |
| BU526643 | RPL30 | 1 | 461 | 8 | 99053947 | 99057626 | PRKCZ | 442 | 461 | 1 | 2065738 | 2065757 | |
| BU526580 | RPL30 | 1 | 461 | 8 | 99053947 | 99057626 | PRKCZ | 442 | 461 | 1 | 2065738 | 2065757 | |
| DB125840 | RPL30 | 1 | 91 | 8 | 99057575 | 99057773 | TBC1D5 | 91 | 530 | 3 | 17279809 | 17349627 | |
| AW662691 | TP53BP2 | 8 | 295 | 1 | 223967790 | 223968077 | RPL30 | 295 | 508 | 8 | 99057180 | 99057760 | |
| BC008012 | RPL30 | 43 | 415 | 8 | 99053949 | 99057600 | EEF1D | 407 | 1377 | 8 | 144661898 | 144679574 | |
| AA315842 | RPL30 | 4 | 65 | 8 | 99054032 | 99054887 | REG4 | 66 | 462 | 1 | 120342385 | 120354068 | |
| BI334582 | NOP58 | 1 | 380 | 2 | 203149104 | 203155926 | RPL30 | 380 | 735 | 8 | 99054882 | 99057760 | |
| BG180512 | TTC37 | 1 | 89 | 5 | 94861108 | 94861196 | RPL30 | 79 | 473 | 8 | 99053569 | 99057248 | |
| BU608418 | RPL30 | 1 | 76 | 8 | 99053569 | 99054011 | RPL30 | 74 | 219 | 8 | 99054000 | 99054939 | |
| BF923959 | MEGF11 | 8 | 152 | 15 | 66459159 | 66459306 | RPL30 | 139 | 437 | 8 | 99054942 | 99057773 | |
| BQ221159 | RPL30 | 1 | 56 | 8 | 99054945 | 99055000 | KCTD18 | 52 | 217 | 2 | 201353675 | 201353840 | |
| Top |
| There's no copy number variation information in COSMIC data for this gene. |
| Top |
|
 |
| Top |
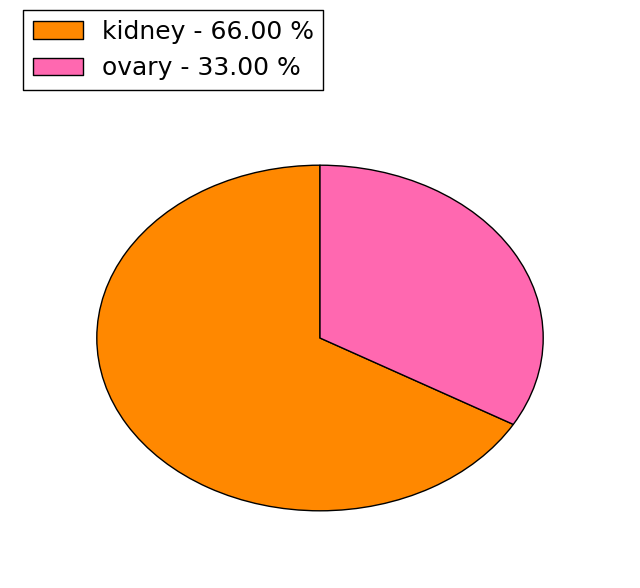
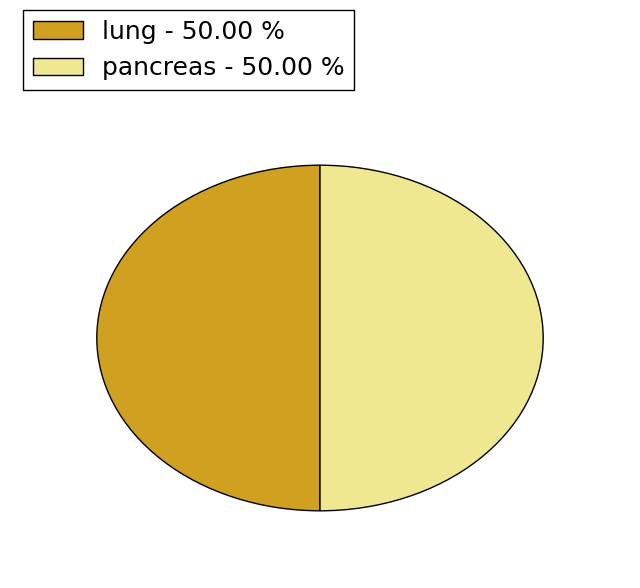
| Stat. for Non-Synonymous SNVs (# total SNVs=3) | (# total SNVs=2) |
 |  |
(# total SNVs=0) | (# total SNVs=0) |
| Top |
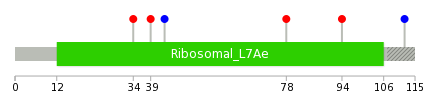
| * When you move the cursor on each content, you can see more deailed mutation information on the Tooltip. Those are primary_site,primary_histology,mutation(aa),pubmedID. |
| GRCh37 position | Mutation(aa) | Unique sampleID count |
| chr8:99057237-99057237 | p.T34I | 1 |
| chr8:99057245-99057245 | p.Y31* | 1 |
| chr8:99054041-99054041 | p.T112T | 1 |
| chr8:99054891-99054891 | p.L94V | 1 |
| chr8:99054939-99054939 | p.N78D | 1 |
| chr8:99057209-99057209 | p.A43A | 1 |
| chr8:99057222-99057222 | p.R39K | 1 |
| Top |
|
 |
| Point Mutation/ Tissue ID | 1 | 2 | 3 | 4 | 5 | 6 | 7 | 8 | 9 | 10 | 11 | 12 | 13 | 14 | 15 | 16 | 17 | 18 | 19 | 20 |
| # sample | 2 | 2 | 2 | 1 | ||||||||||||||||
| # mutation | 2 | 3 | 2 | 1 | ||||||||||||||||
| nonsynonymous SNV | 2 | 3 | 1 | 1 | ||||||||||||||||
| synonymous SNV | 1 |
| cf) Tissue ID; Tissue type (1; BLCA[Bladder Urothelial Carcinoma], 2; BRCA[Breast invasive carcinoma], 3; CESC[Cervical squamous cell carcinoma and endocervical adenocarcinoma], 4; COAD[Colon adenocarcinoma], 5; GBM[Glioblastoma multiforme], 6; Glioma Low Grade, 7; HNSC[Head and Neck squamous cell carcinoma], 8; KICH[Kidney Chromophobe], 9; KIRC[Kidney renal clear cell carcinoma], 10; KIRP[Kidney renal papillary cell carcinoma], 11; LAML[Acute Myeloid Leukemia], 12; LUAD[Lung adenocarcinoma], 13; LUSC[Lung squamous cell carcinoma], 14; OV[Ovarian serous cystadenocarcinoma ], 15; PAAD[Pancreatic adenocarcinoma], 16; PRAD[Prostate adenocarcinoma], 17; SKCM[Skin Cutaneous Melanoma], 18:STAD[Stomach adenocarcinoma], 19:THCA[Thyroid carcinoma], 20:UCEC[Uterine Corpus Endometrial Carcinoma]) |
| Top |
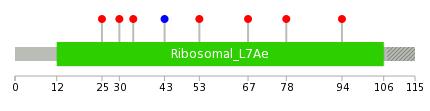
| * We represented just top 10 SNVs. When you move the cursor on each content, you can see more deailed mutation information on the Tooltip. Those are primary_site, primary_histology, mutation(aa), pubmedID. |
| Genomic Position | Mutation(aa) | Unique sampleID count |
| chr8:99057209 | p.A43A | 1 |
| chr8:99057237 | p.T34I | 1 |
| chr8:99057250 | p.G30W | 1 |
| chr8:99057265 | p.G25W | 1 |
| chr8:99054891 | p.L94V | 1 |
| chr8:99054939 | p.N78D | 1 |
| chr8:99054972 | p.A67S | 1 |
| chr8:99057180 | p.P53Q | 1 |
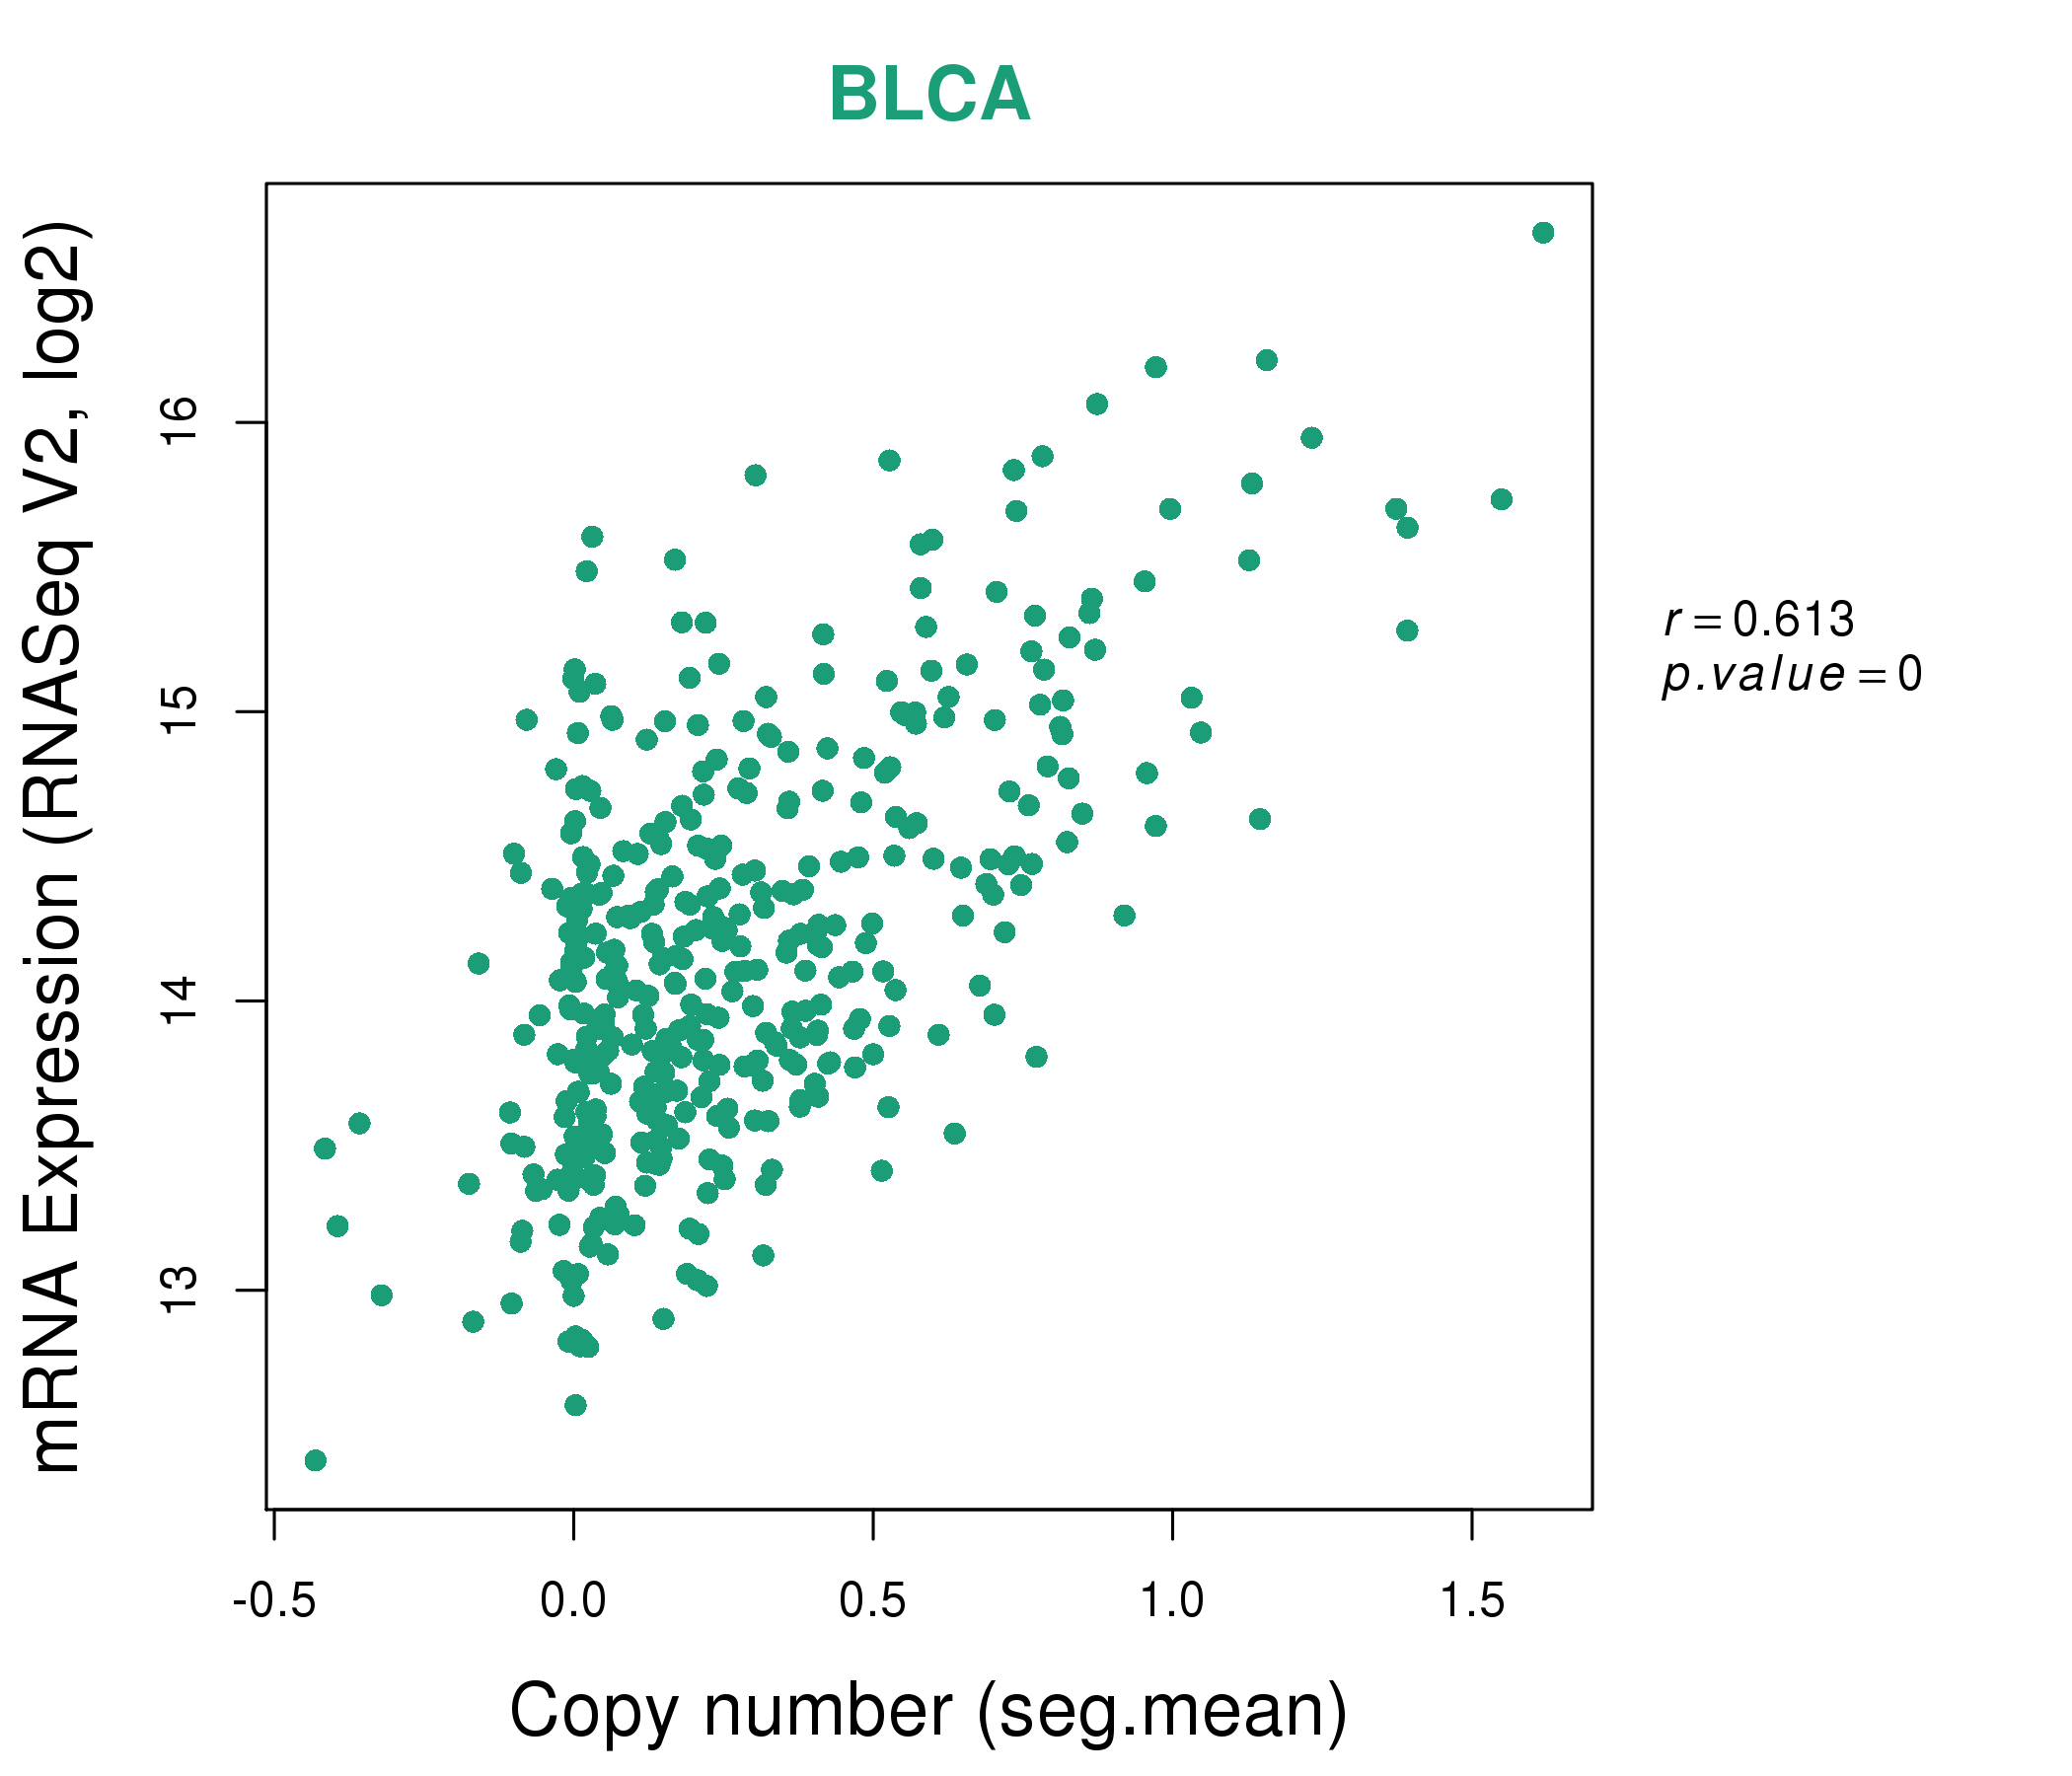
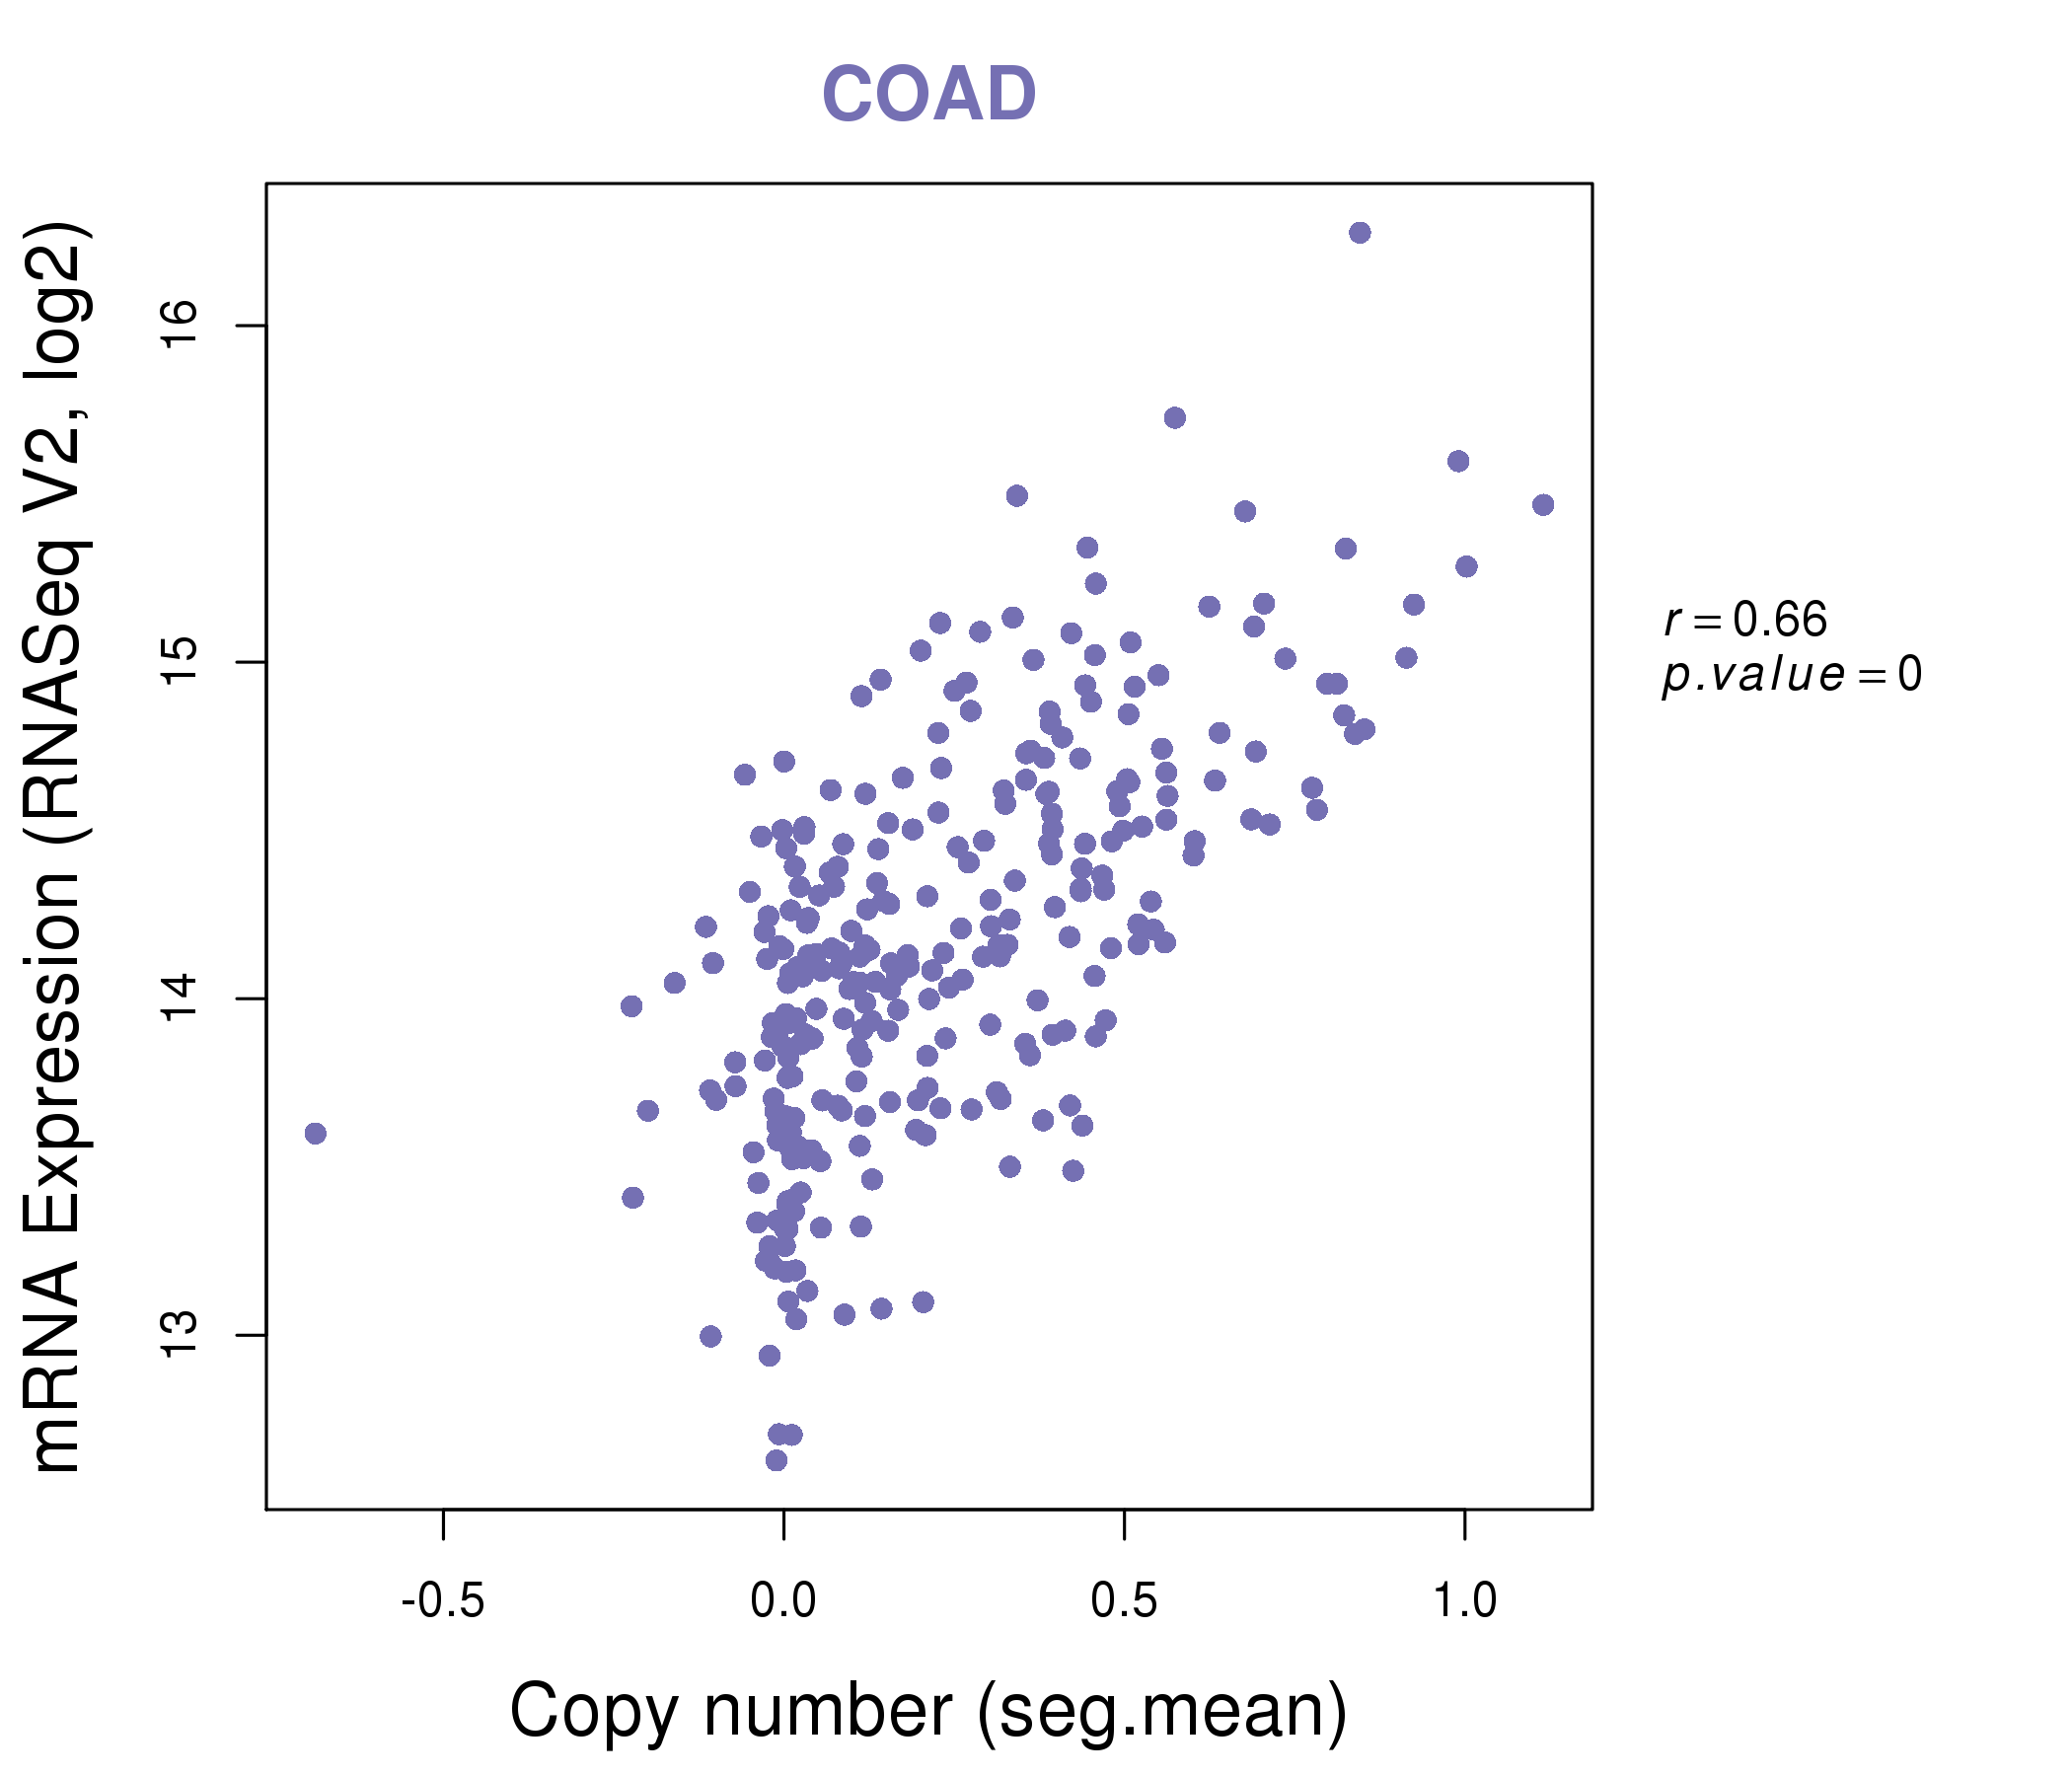
| * Copy number data were extracted from TCGA using R package TCGA-Assembler. The URLs of all public data files on TCGA DCC data server were gathered on Jan-05-2015. Function ProcessCNAData in TCGA-Assembler package was used to obtain gene-level copy number value which is calculated as the average copy number of the genomic region of a gene. |
 |
| cf) Tissue ID[Tissue type]: BLCA[Bladder Urothelial Carcinoma], BRCA[Breast invasive carcinoma], CESC[Cervical squamous cell carcinoma and endocervical adenocarcinoma], COAD[Colon adenocarcinoma], GBM[Glioblastoma multiforme], Glioma Low Grade, HNSC[Head and Neck squamous cell carcinoma], KICH[Kidney Chromophobe], KIRC[Kidney renal clear cell carcinoma], KIRP[Kidney renal papillary cell carcinoma], LAML[Acute Myeloid Leukemia], LUAD[Lung adenocarcinoma], LUSC[Lung squamous cell carcinoma], OV[Ovarian serous cystadenocarcinoma ], PAAD[Pancreatic adenocarcinoma], PRAD[Prostate adenocarcinoma], SKCM[Skin Cutaneous Melanoma], STAD[Stomach adenocarcinoma], THCA[Thyroid carcinoma], UCEC[Uterine Corpus Endometrial Carcinoma] |
| Top |
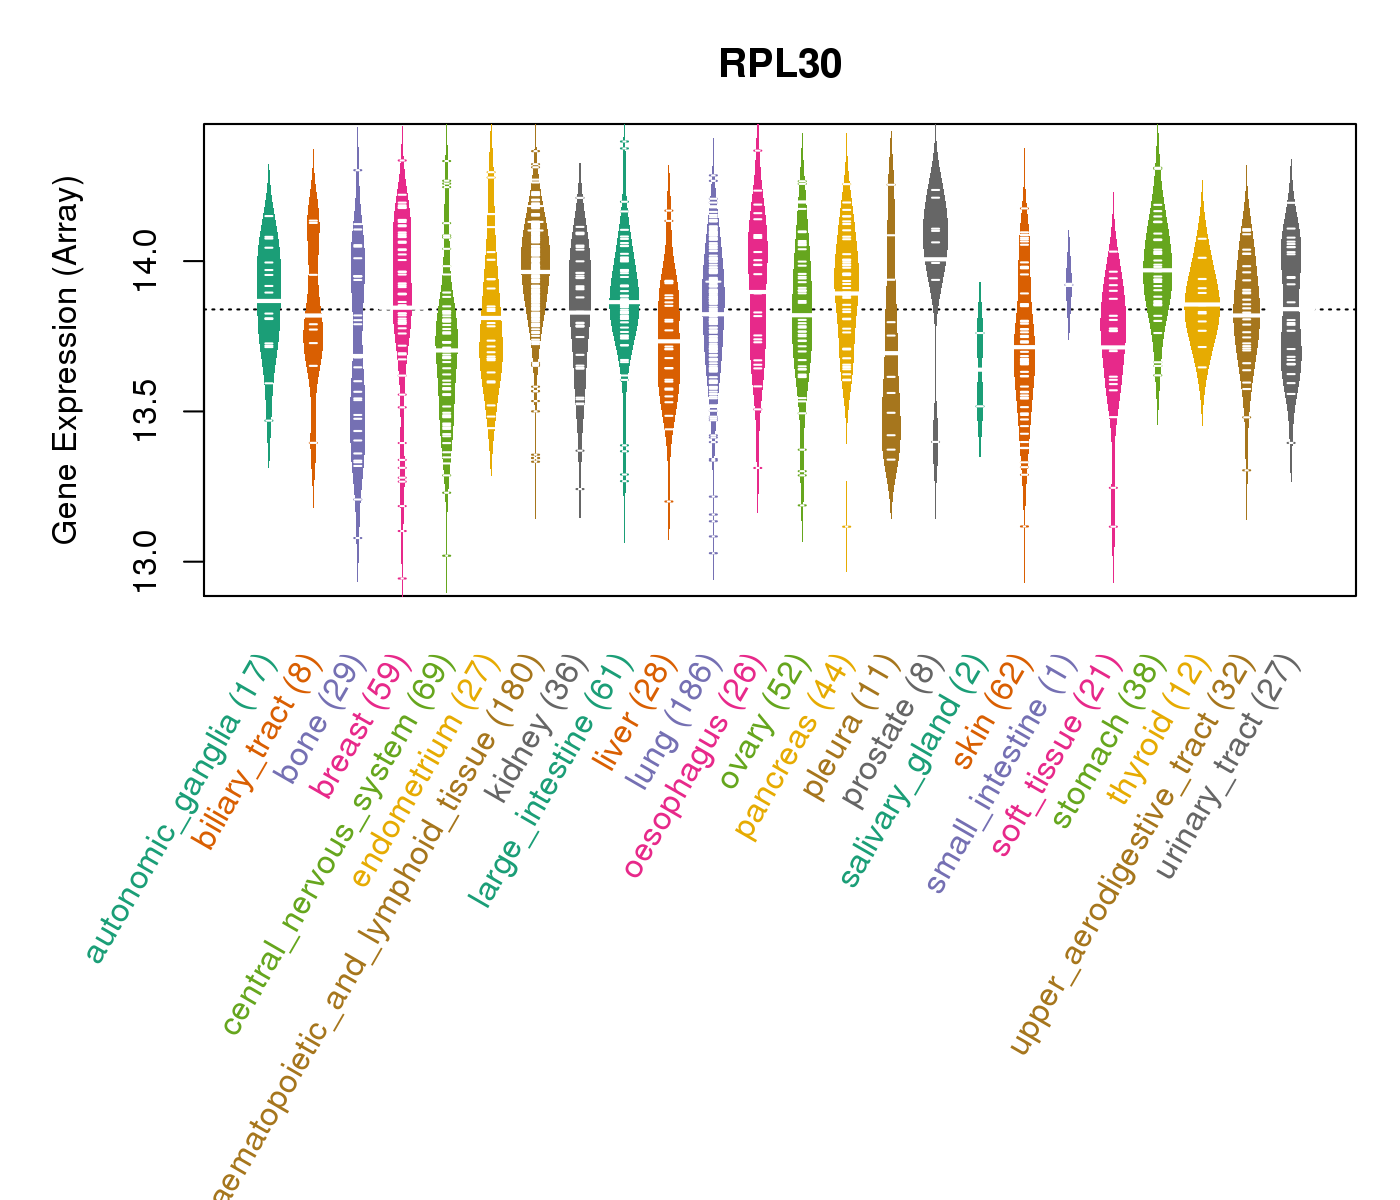
| Gene Expression for RPL30 |
| * CCLE gene expression data were extracted from CCLE_Expression_Entrez_2012-10-18.res: Gene-centric RMA-normalized mRNA expression data. |
 |
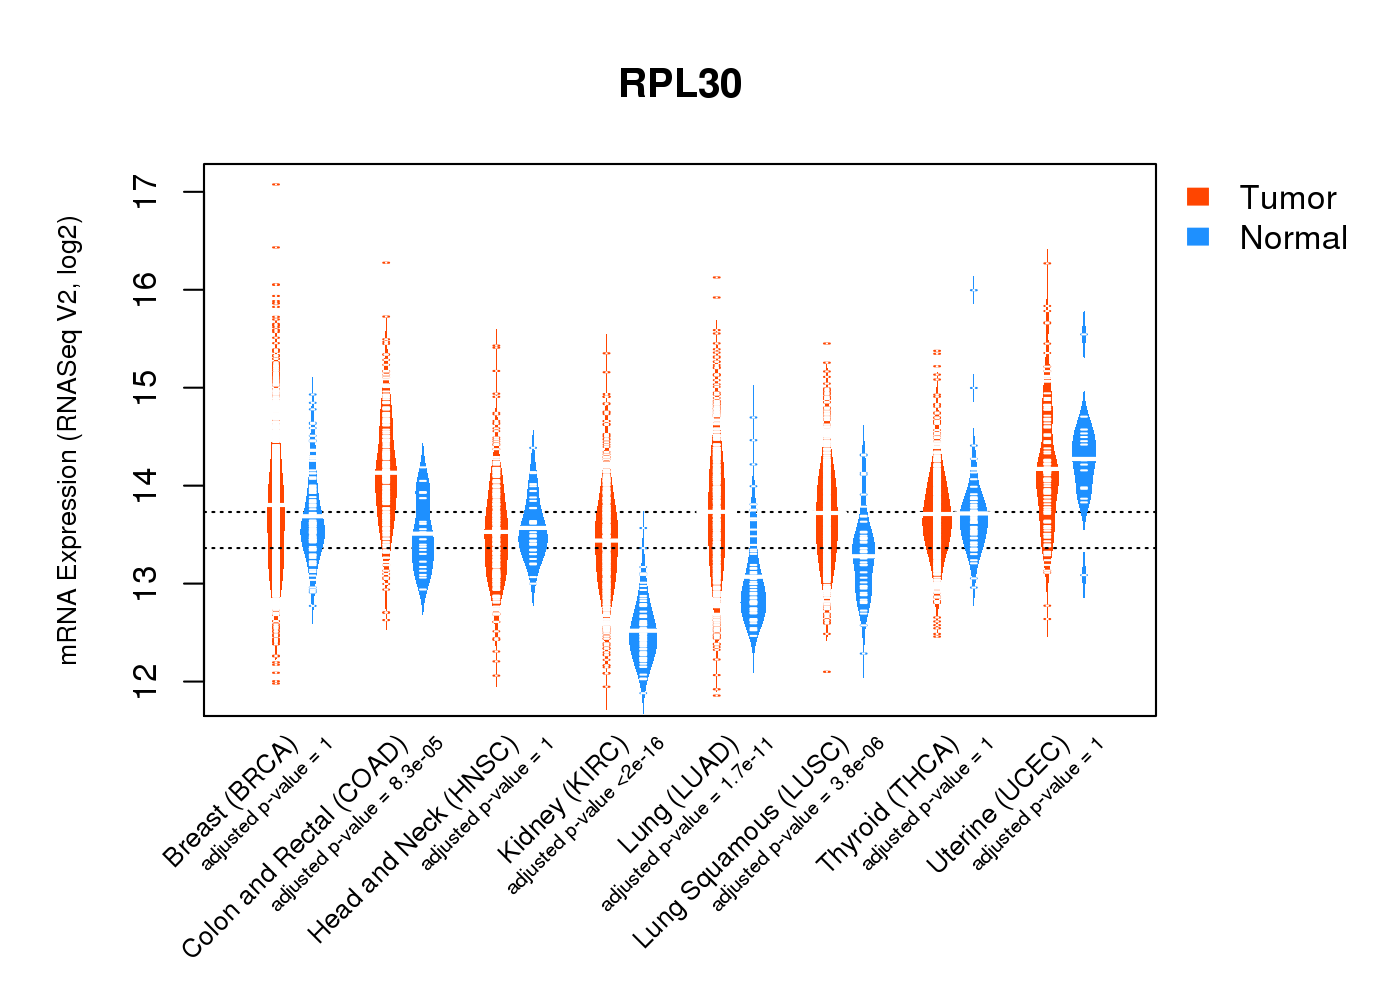
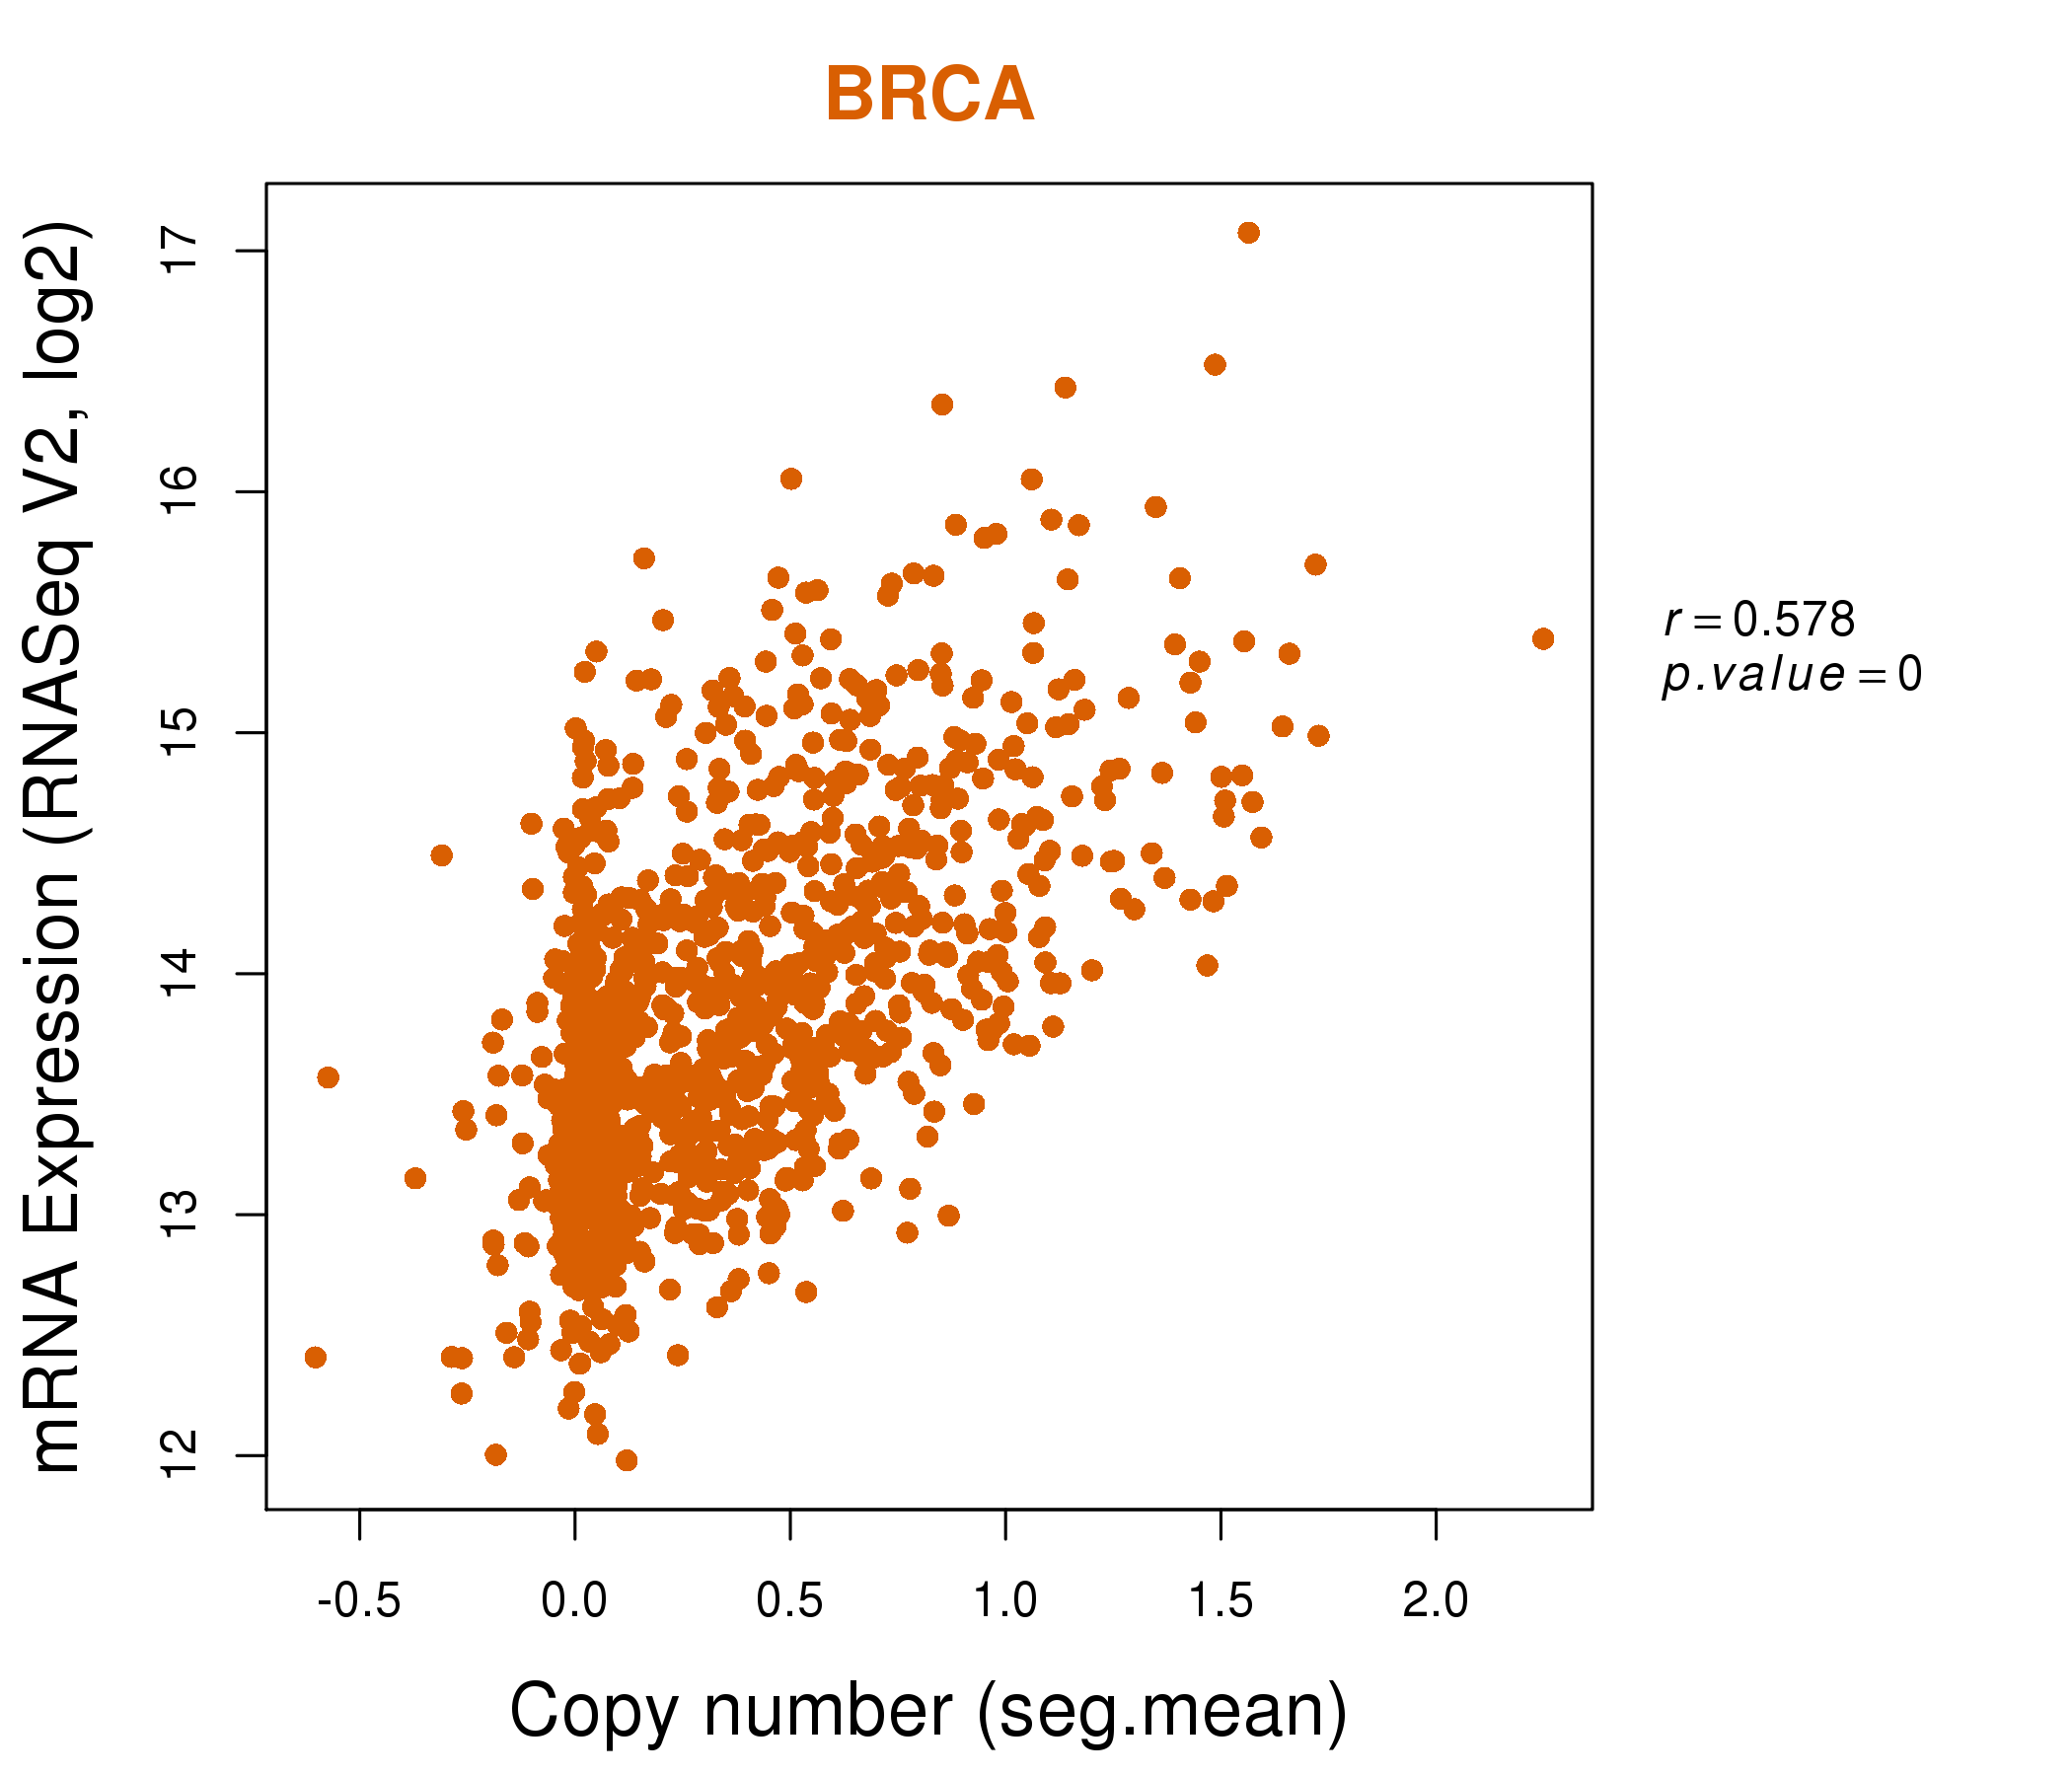
| * Normalized gene expression data of RNASeqV2 was extracted from TCGA using R package TCGA-Assembler. The URLs of all public data files on TCGA DCC data server were gathered at Jan-05-2015. Only eight cancer types have enough normal control samples for differential expression analysis. (t test, adjusted p<0.05 (using Benjamini-Hochberg FDR)) |
 |
| Top |
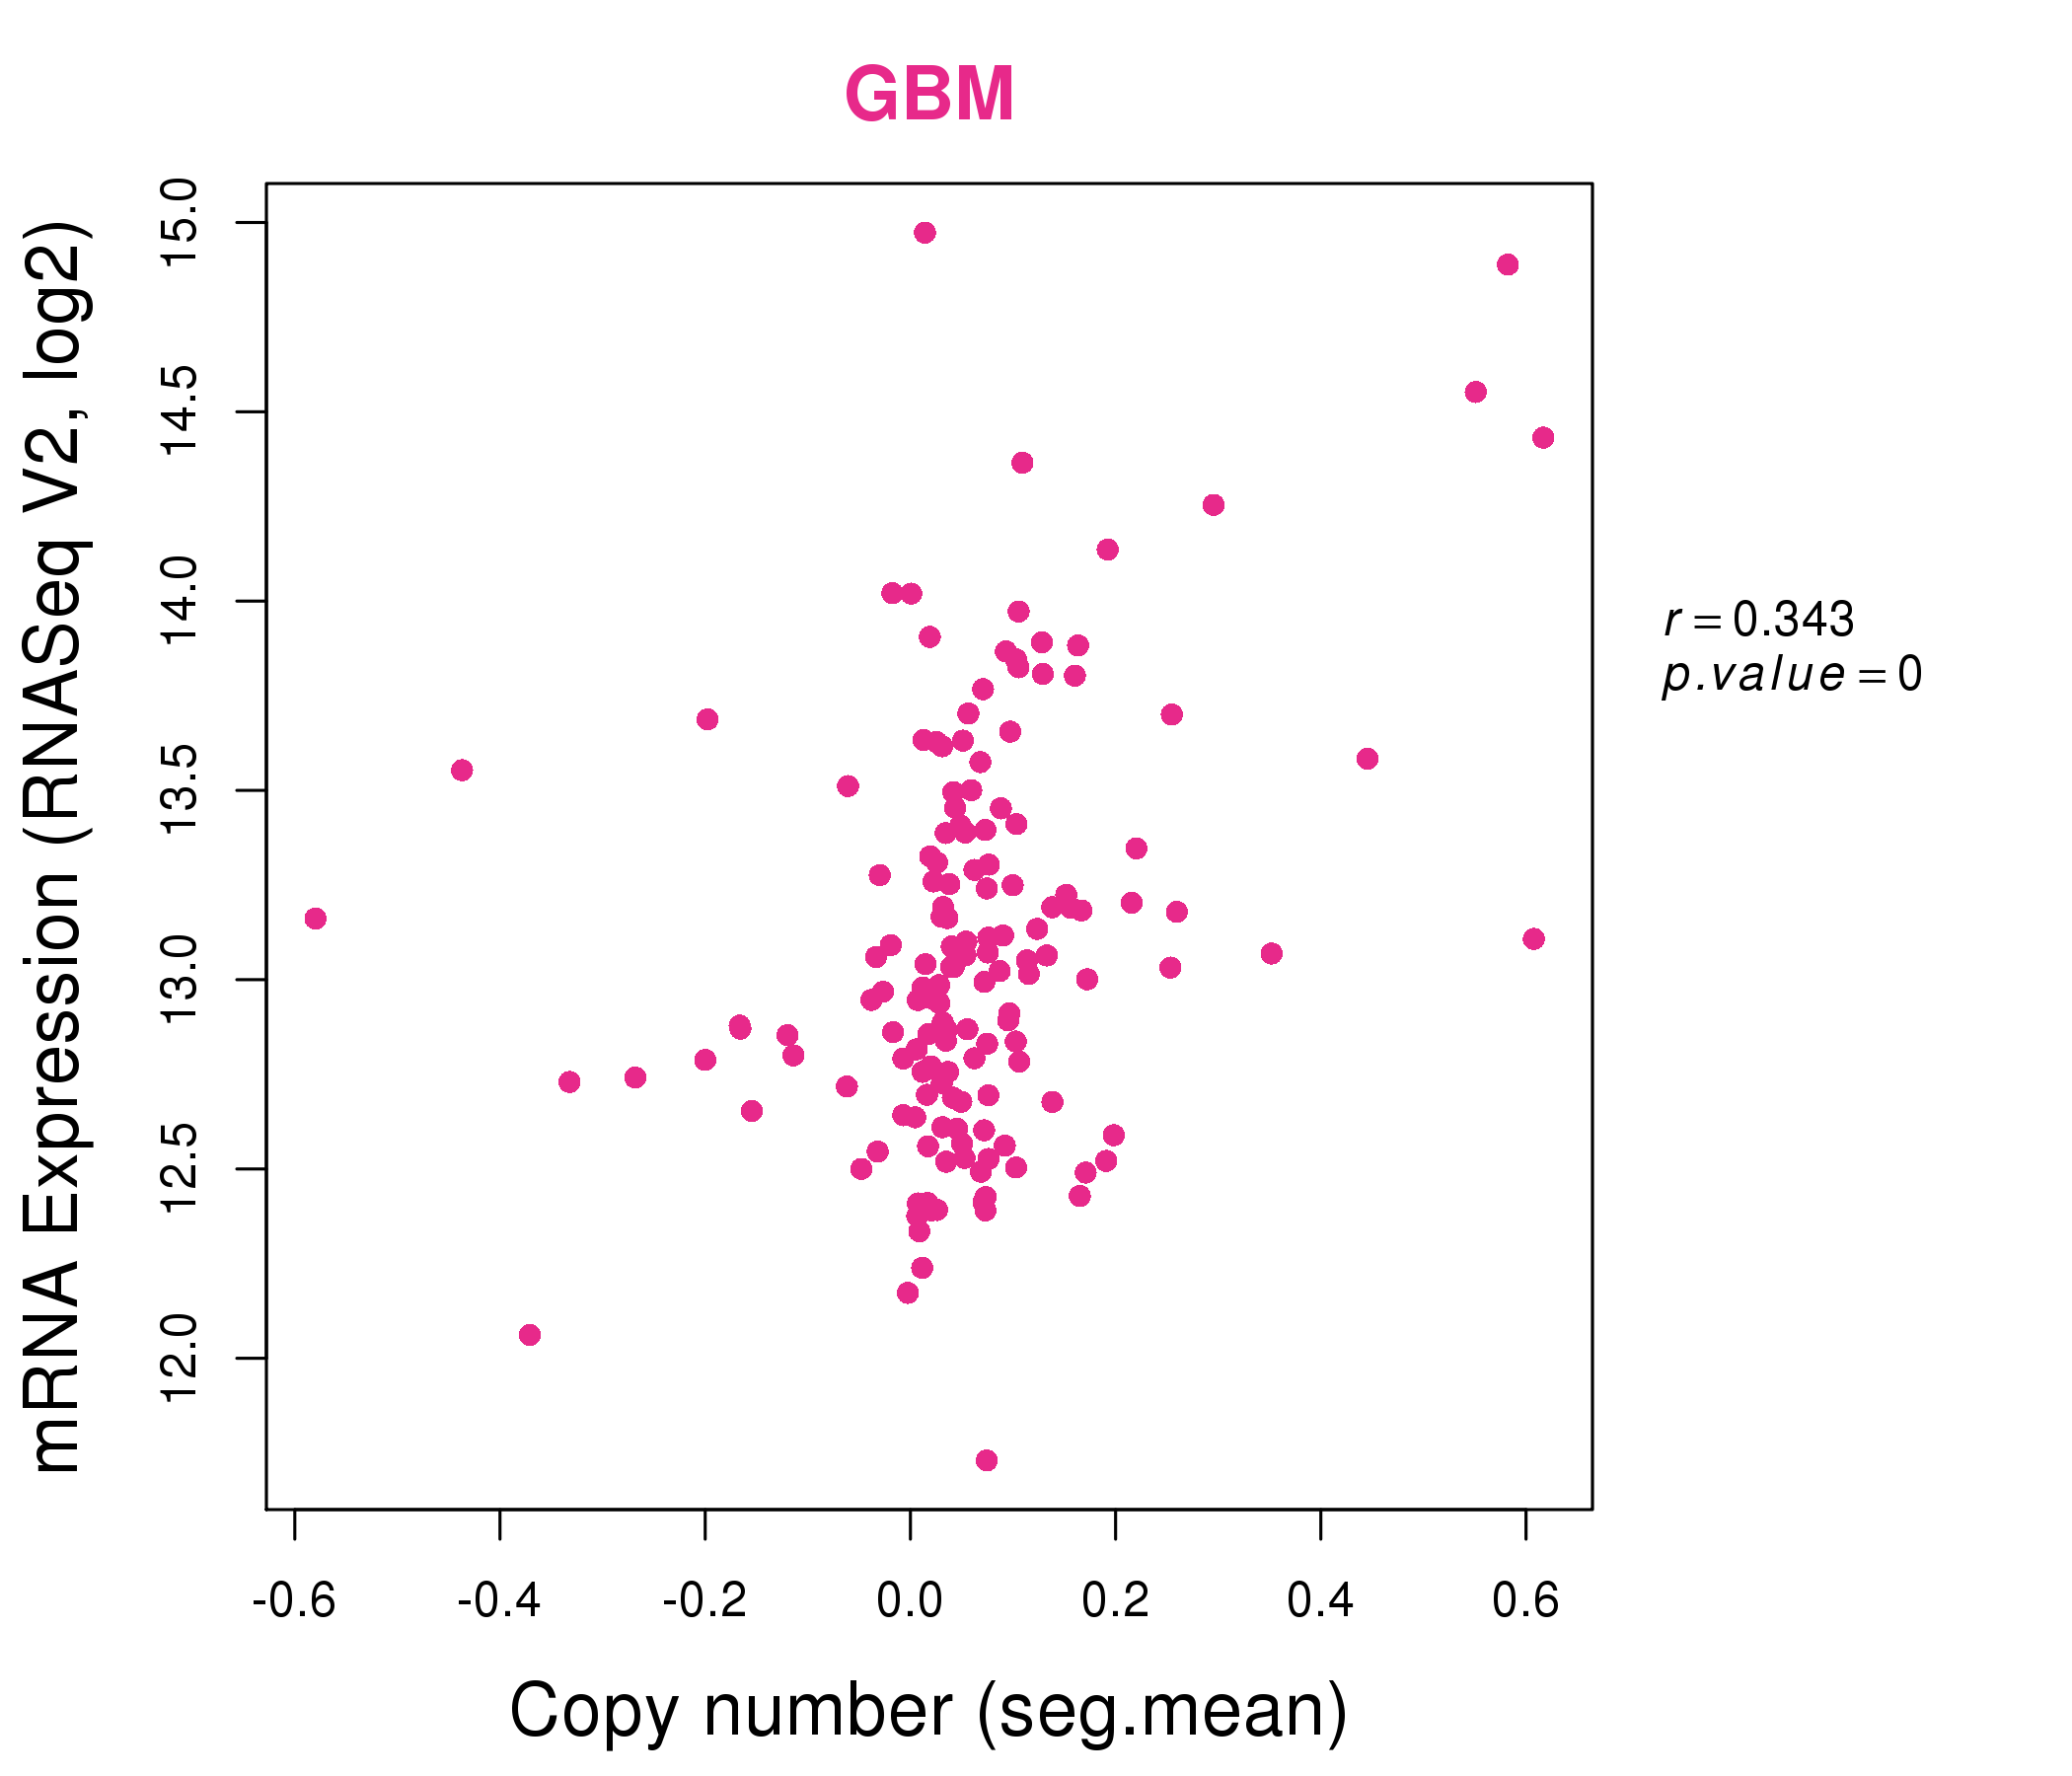
| * This plots show the correlation between CNV and gene expression. |
: Open all plots for all cancer types
 |
|
 |
|
| Top |
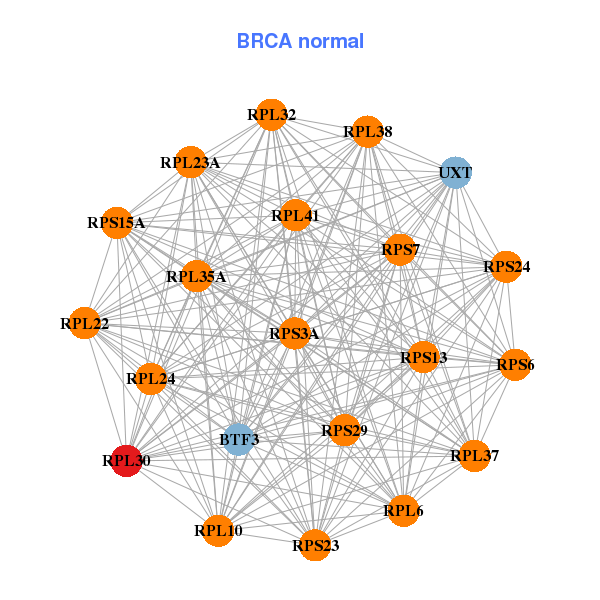
| Gene-Gene Network Information |
| * Co-Expression network figures were drawn using R package igraph. Only the top 20 genes with the highest correlations were shown. Red circle: input gene, orange circle: cell metabolism gene, sky circle: other gene |
: Open all plots for all cancer types
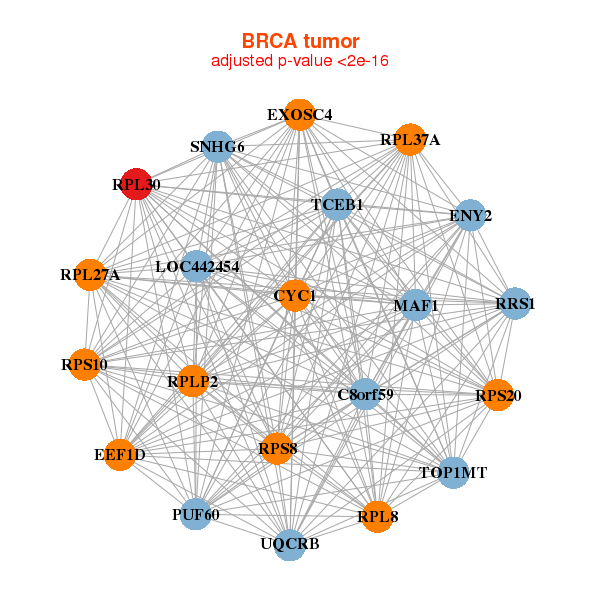 |
|
| C8orf59,CYC1,EEF1D,ENY2,EXOSC4,LOC442454,MAF1, PUF60,RPL27A,RPL30,RPL37A,RPL8,RPLP2,RPS10, RPS20,RPS8,RRS1,SNHG6,TCEB1,TOP1MT,UQCRB | BTF3,RPL10,RPL22,RPL23A,RPL24,RPL30,RPL32, RPL35A,RPL37,RPL38,RPL41,RPL6,RPS13,RPS15A, RPS23,RPS24,RPS29,RPS3A,RPS6,RPS7,UXT |
 |
|
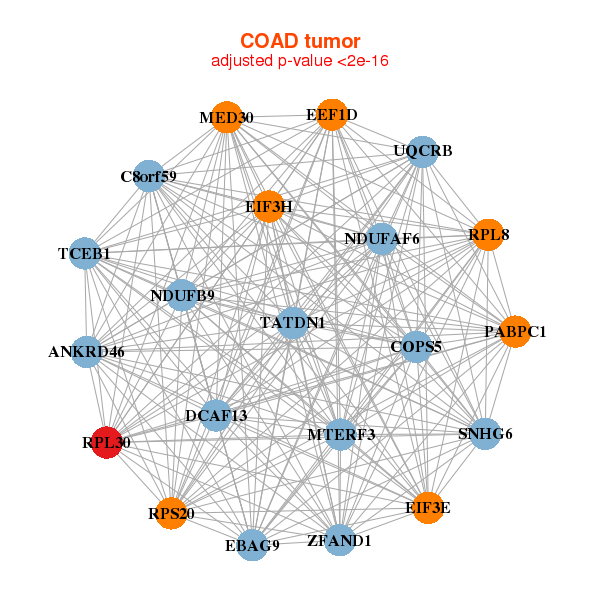
| ANKRD46,NDUFAF6,C8orf59,COPS5,DCAF13,EBAG9,EEF1D, EIF3E,EIF3H,MED30,MTERF3,NDUFB9,PABPC1,RPL30, RPL8,RPS20,SNHG6,TATDN1,TCEB1,UQCRB,ZFAND1 | EEF1A1,RPL10,RPL12,RPL14,RPL15,RPL19,RPL23A, RPL30,RPL31,RPL32,RPL35A,RPL3,RPL38,RPL6, RPL7A,RPS11,RPS12,RPS13,RPS23,RPS25,RPS9 |
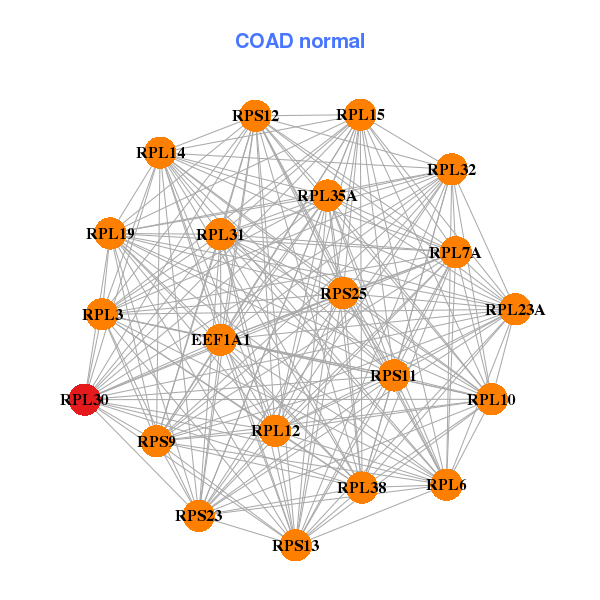
| * Co-Expression network figures were drawn using R package igraph. Only the top 20 genes with the highest correlations were shown. Red circle: input gene, orange circle: cell metabolism gene, sky circle: other gene |
: Open all plots for all cancer types
| Top |
: Open all interacting genes' information including KEGG pathway for all interacting genes from DAVID
| Top |
| Pharmacological Information for RPL30 |
| There's no related Drug. |
| Top |
| Cross referenced IDs for RPL30 |
| * We obtained these cross-references from Uniprot database. It covers 150 different DBs, 18 categories. http://www.uniprot.org/help/cross_references_section |
: Open all cross reference information
|
Copyright © 2016-Present - The Univsersity of Texas Health Science Center at Houston @ |