|
||||||||||||||||||||
| |
| Phenotypic Information (metabolism pathway, cancer, disease, phenome) |
| |
| |
| Gene-Gene Network Information: Co-Expression Network, Interacting Genes & KEGG |
| |
|


| Gene Summary for RPL28 |
| Top |
| Phenotypic Information for RPL28(metabolism pathway, cancer, disease, phenome) |
| Cancer | CGAP: RPL28 |
| Familial Cancer Database: RPL28 | |
| * This gene is included in those cancer gene databases. |
|
|
|
|
|
| . | ||||||||||||||
Oncogene 1 | Significant driver gene in | |||||||||||||||||||
| cf) number; DB name 1 Oncogene; http://nar.oxfordjournals.org/content/35/suppl_1/D721.long, 2 Tumor Suppressor gene; https://bioinfo.uth.edu/TSGene/, 3 Cancer Gene Census; http://www.nature.com/nrc/journal/v4/n3/abs/nrc1299.html, 4 CancerGenes; http://nar.oxfordjournals.org/content/35/suppl_1/D721.long, 5 Network of Cancer Gene; http://ncg.kcl.ac.uk/index.php, 1Therapeutic Vulnerabilities in Cancer; http://cbio.mskcc.org/cancergenomics/statius/ |
| REACTOME_METABOLISM_OF_PROTEINS REACTOME_METABOLISM_OF_MRNA REACTOME_METABOLISM_OF_RNA | |
| OMIM | |
| Orphanet | |
| Disease | KEGG Disease: RPL28 |
| MedGen: RPL28 (Human Medical Genetics with Condition) | |
| ClinVar: RPL28 | |
| Phenotype | MGI: RPL28 (International Mouse Phenotyping Consortium) |
| PhenomicDB: RPL28 | |
| Mutations for RPL28 |
| * Under tables are showing count per each tissue to give us broad intuition about tissue specific mutation patterns.You can go to the detailed page for each mutation database's web site. |
| There's no structural variation information in COSMIC data for this gene. |
| * From mRNA Sanger sequences, Chitars2.0 arranged chimeric transcripts. This table shows RPL28 related fusion information. |
| ID | Head Gene | Tail Gene | Accession | Gene_a | qStart_a | qEnd_a | Chromosome_a | tStart_a | tEnd_a | Gene_a | qStart_a | qEnd_a | Chromosome_a | tStart_a | tEnd_a |
| DA524376 | RPL28 | 1 | 366 | 19 | 55897300 | 55899416 | GLB1 | 366 | 510 | 3 | 33114063 | 33114206 | |
| BE388585 | RPL28 | 4 | 57 | 19 | 55897722 | 55897775 | LASP1 | 53 | 366 | 17 | 37076280 | 37076593 | |
| BE387849 | RPL28 | 3 | 56 | 19 | 55897722 | 55897775 | LASP1 | 52 | 366 | 17 | 37076280 | 37076593 | |
| BG748632 | RPL28 | 1 | 601 | 19 | 55897314 | 55899746 | ZNF804B | 590 | 611 | 7 | 88482050 | 88482071 | |
| AW498880 | RPL28 | 1 | 160 | 19 | 55899375 | 55899730 | GAPDH | 161 | 391 | 12 | 6644002 | 6645955 | |
| BQ653766 | BCYRN1 | 1 | 643 | X | 70514085 | 70517282 | RPL28 | 636 | 690 | 19 | 55899686 | 55899740 | |
| BC004230 | RPL28 | 44 | 532 | 19 | 55897311 | 55899744 | TPI1 | 529 | 1753 | 12 | 6976702 | 6979993 | |
| AA776201 | RPL28 | 1 | 106 | 19 | 55899611 | 55899717 | EPB41L1 | 106 | 374 | 20 | 34773218 | 34776411 | |
| BQ648662 | CBWD2 | 21 | 56 | 2 | 114223330 | 114223370 | RPL28 | 39 | 504 | 19 | 55897717 | 55899743 | |
| BC009885 | RPL28 | 44 | 532 | 19 | 55897311 | 55899744 | TPI1 | 529 | 1753 | 12 | 6976702 | 6979993 | |
| BQ645838 | CBWD2 | 21 | 56 | 2 | 114223330 | 114223370 | RPL28 | 39 | 504 | 19 | 55897717 | 55899743 | |
| BU543829 | ANGPTL4 | 40 | 767 | 19 | 8436347 | 8439255 | RPL28 | 768 | 885 | 19 | 55897312 | 55897809 | |
| BG473709 | DDX1 | 17 | 290 | 2 | 15760492 | 15767242 | RPL28 | 272 | 739 | 19 | 55897300 | 55899708 | |
| BQ646046 | CBWD2 | 22 | 57 | 2 | 114223330 | 114223370 | RPL28 | 40 | 505 | 19 | 55897717 | 55899743 | |
| AI907286 | RPL28 | 12 | 158 | 19 | 55897736 | 55898013 | RPL28 | 150 | 247 | 19 | 55898027 | 55899360 | |
| DB253394 | RPL28 | 33 | 360 | 19 | 55897716 | 55899410 | C22orf23 | 357 | 559 | 22 | 38340103 | 38340305 | |
| BQ649823 | CBWD2 | 22 | 57 | 2 | 114223330 | 114223370 | RPL28 | 40 | 505 | 19 | 55897717 | 55899743 | |
| Top |
| There's no copy number variation information in COSMIC data for this gene. |
| Top |
|
 |
| Top |
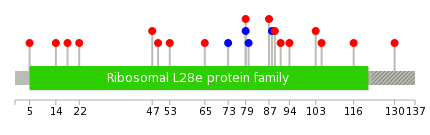
| Stat. for Non-Synonymous SNVs (# total SNVs=12) | (# total SNVs=2) |
 |  |
(# total SNVs=0) | (# total SNVs=0) |
| Top |
| * When you move the cursor on each content, you can see more deailed mutation information on the Tooltip. Those are primary_site,primary_histology,mutation(aa),pubmedID. |
| GRCh37 position | Mutation(aa) | Unique sampleID count |
| chr19:55897738-55897738 | p.L5V | 1 |
| chr19:55899332-55899332 | p.T80T | 1 |
| chr19:55897765-55897765 | p.S14P | 1 |
| chr19:55899351-55899351 | p.R87S | 1 |
| chr19:55897779-55897779 | p.I18M | 1 |
| chr19:55899356-55899356 | p.A88A | 1 |
| chr19:55897789-55897789 | p.K22E | 1 |
| chr19:55899358-55899358 | p.T89R | 1 |
| chr19:55897997-55897997 | p.K47N | 1 |
| chr19:55899365-55899365 | p.S91R | 1 |
| Top |
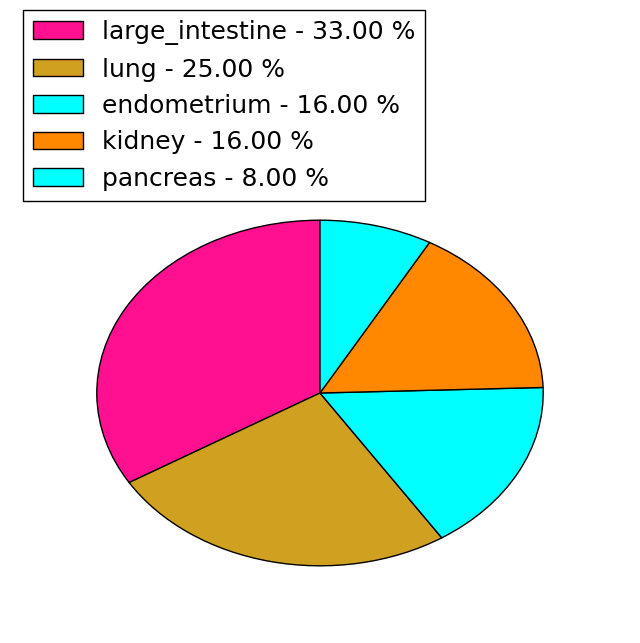
|
 |
| Point Mutation/ Tissue ID | 1 | 2 | 3 | 4 | 5 | 6 | 7 | 8 | 9 | 10 | 11 | 12 | 13 | 14 | 15 | 16 | 17 | 18 | 19 | 20 |
| # sample | 1 | 3 | 2 | 2 | 3 | 1 | 1 | 1 | 1 | 4 | ||||||||||
| # mutation | 1 | 3 | 2 | 2 | 3 | 1 | 1 | 1 | 1 | 4 | ||||||||||
| nonsynonymous SNV | 1 | 3 | 1 | 2 | 2 | 1 | 1 | 1 | 3 | |||||||||||
| synonymous SNV | 1 | 1 | 1 | 1 |
| cf) Tissue ID; Tissue type (1; BLCA[Bladder Urothelial Carcinoma], 2; BRCA[Breast invasive carcinoma], 3; CESC[Cervical squamous cell carcinoma and endocervical adenocarcinoma], 4; COAD[Colon adenocarcinoma], 5; GBM[Glioblastoma multiforme], 6; Glioma Low Grade, 7; HNSC[Head and Neck squamous cell carcinoma], 8; KICH[Kidney Chromophobe], 9; KIRC[Kidney renal clear cell carcinoma], 10; KIRP[Kidney renal papillary cell carcinoma], 11; LAML[Acute Myeloid Leukemia], 12; LUAD[Lung adenocarcinoma], 13; LUSC[Lung squamous cell carcinoma], 14; OV[Ovarian serous cystadenocarcinoma ], 15; PAAD[Pancreatic adenocarcinoma], 16; PRAD[Prostate adenocarcinoma], 17; SKCM[Skin Cutaneous Melanoma], 18:STAD[Stomach adenocarcinoma], 19:THCA[Thyroid carcinoma], 20:UCEC[Uterine Corpus Endometrial Carcinoma]) |
| Top |
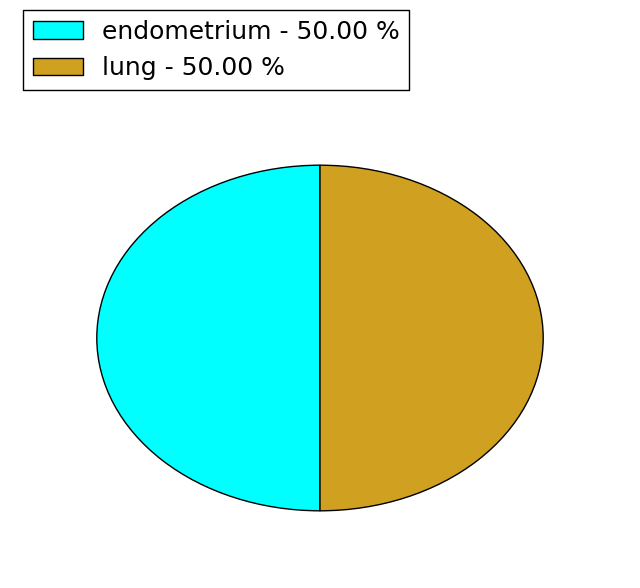
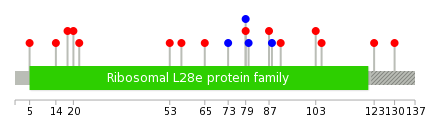
| * We represented just top 10 SNVs. When you move the cursor on each content, you can see more deailed mutation information on the Tooltip. Those are primary_site, primary_histology, mutation(aa), pubmedID. |
| Genomic Position | Mutation(aa) | Unique sampleID count |
| chr19:55897738 | p.R87S,RPL28 | 1 |
| chr19:55899332 | p.A88A,RPL28 | 1 |
| chr19:55897765 | p.S91R,RPL28 | 1 |
| chr19:55899351 | p.R103H,RPL28 | 1 |
| chr19:55897779 | p.L5V,RPL28 | 1 |
| chr19:55899356 | p.D105N,RPL28 | 1 |
| chr19:55897785 | p.S14P,RPL28 | 1 |
| chr19:55899365 | p.R130Q | 1 |
| chr19:55897789 | p.I18M,RPL28 | 1 |
| chr19:55899400 | p.A123V | 1 |
| * Copy number data were extracted from TCGA using R package TCGA-Assembler. The URLs of all public data files on TCGA DCC data server were gathered on Jan-05-2015. Function ProcessCNAData in TCGA-Assembler package was used to obtain gene-level copy number value which is calculated as the average copy number of the genomic region of a gene. |
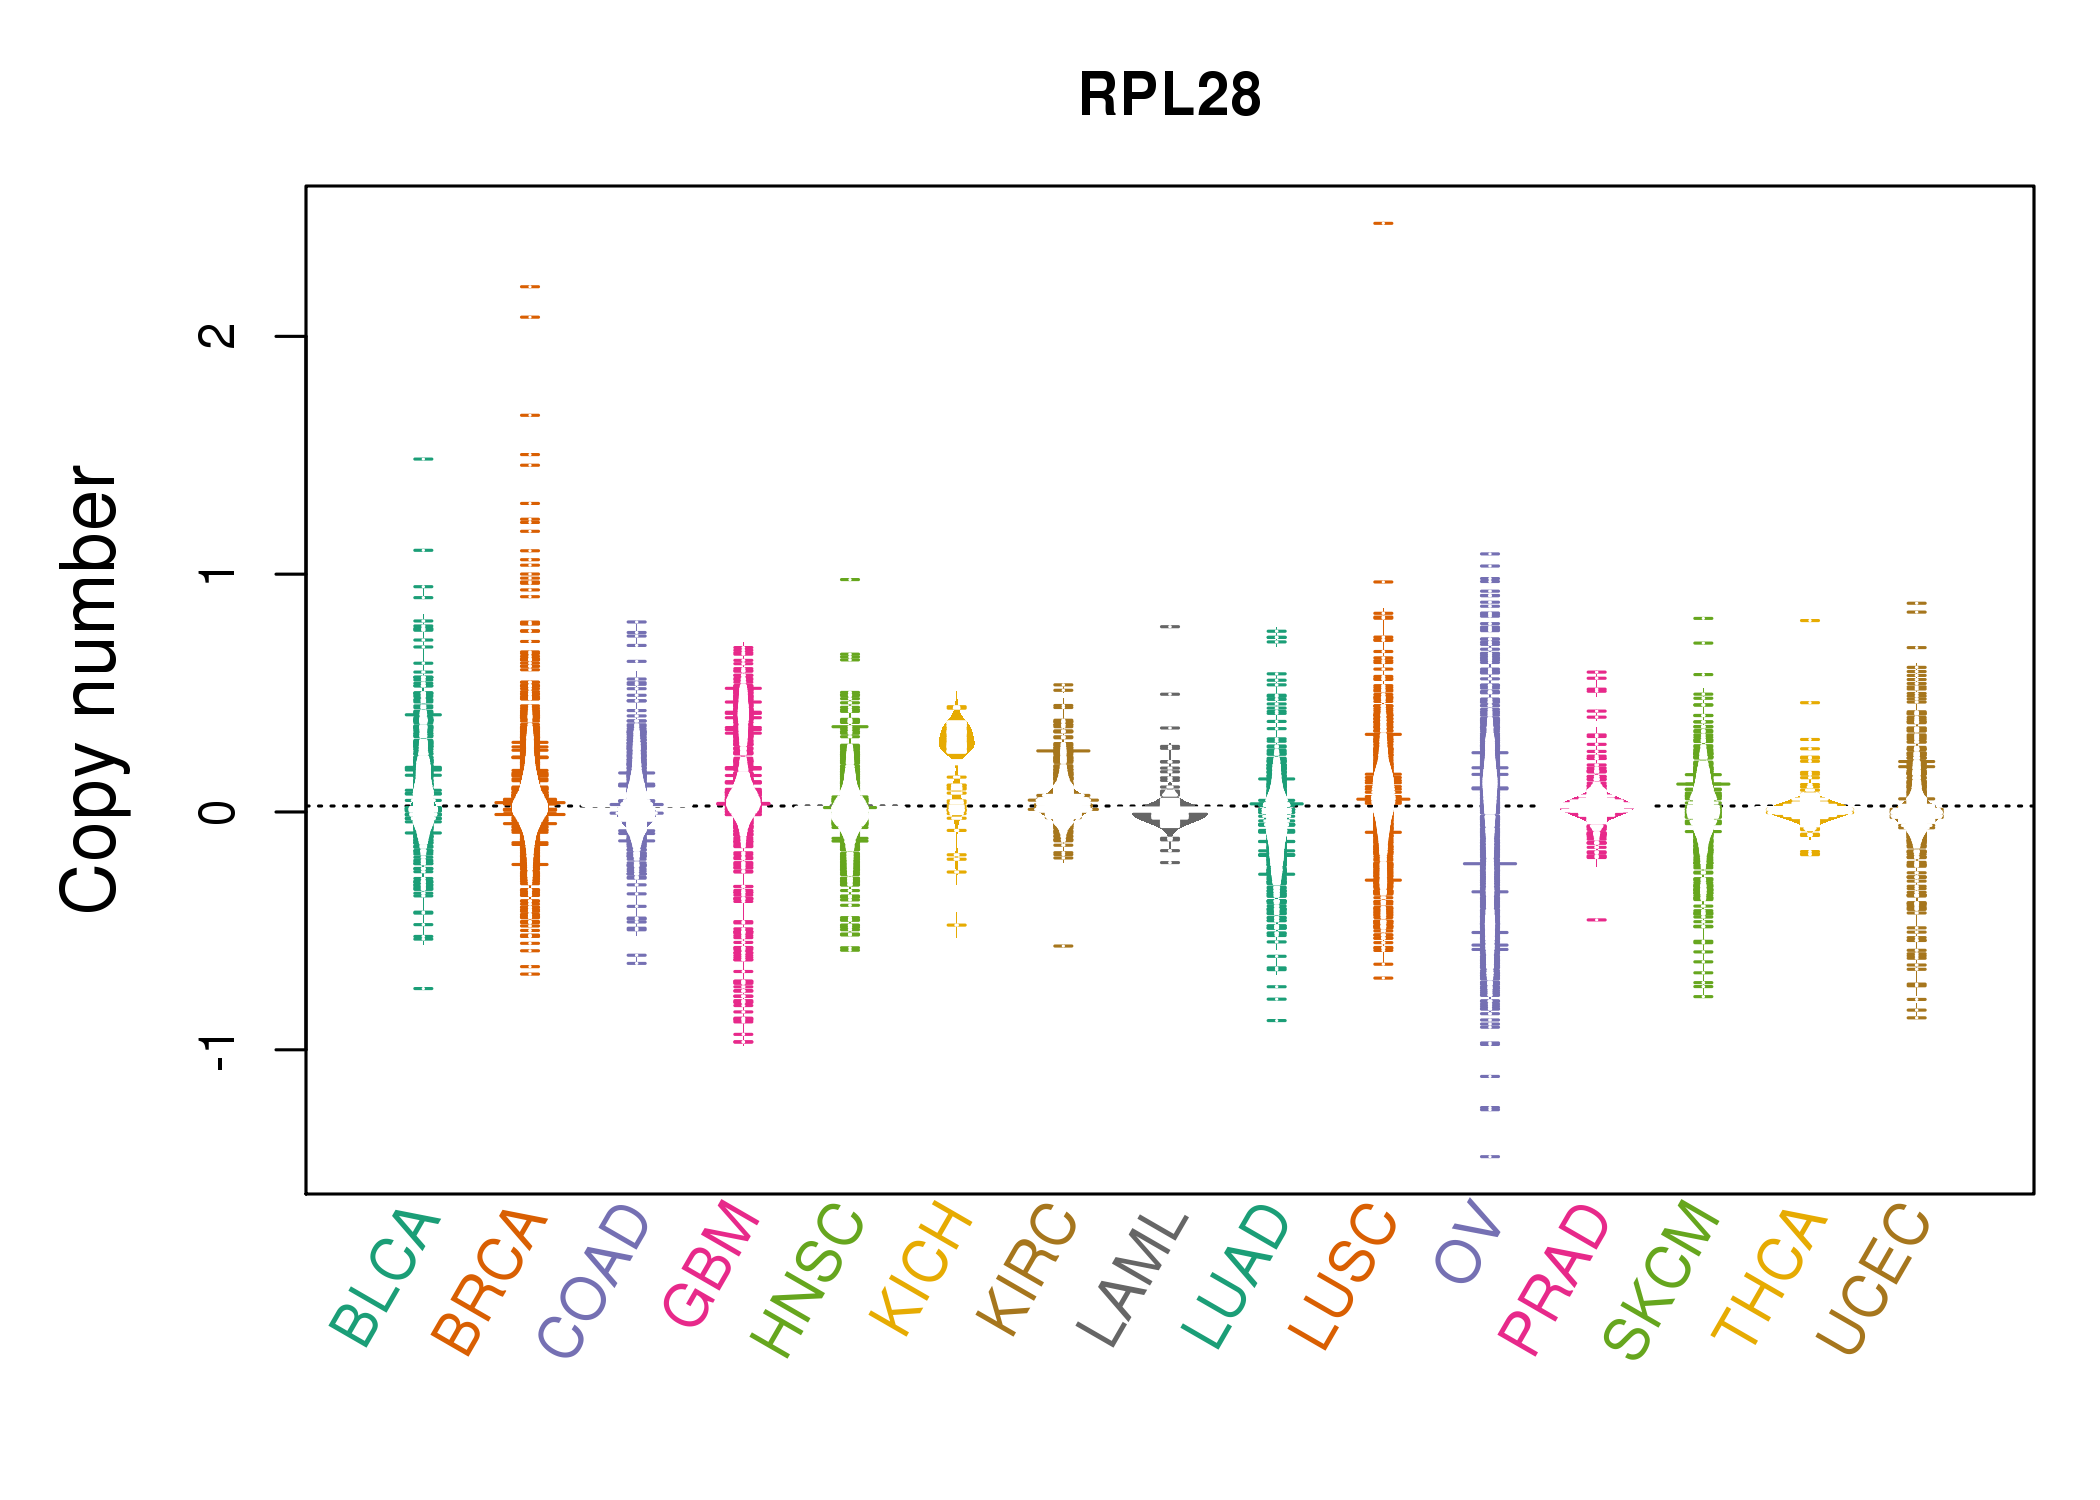 |
| cf) Tissue ID[Tissue type]: BLCA[Bladder Urothelial Carcinoma], BRCA[Breast invasive carcinoma], CESC[Cervical squamous cell carcinoma and endocervical adenocarcinoma], COAD[Colon adenocarcinoma], GBM[Glioblastoma multiforme], Glioma Low Grade, HNSC[Head and Neck squamous cell carcinoma], KICH[Kidney Chromophobe], KIRC[Kidney renal clear cell carcinoma], KIRP[Kidney renal papillary cell carcinoma], LAML[Acute Myeloid Leukemia], LUAD[Lung adenocarcinoma], LUSC[Lung squamous cell carcinoma], OV[Ovarian serous cystadenocarcinoma ], PAAD[Pancreatic adenocarcinoma], PRAD[Prostate adenocarcinoma], SKCM[Skin Cutaneous Melanoma], STAD[Stomach adenocarcinoma], THCA[Thyroid carcinoma], UCEC[Uterine Corpus Endometrial Carcinoma] |
| Top |
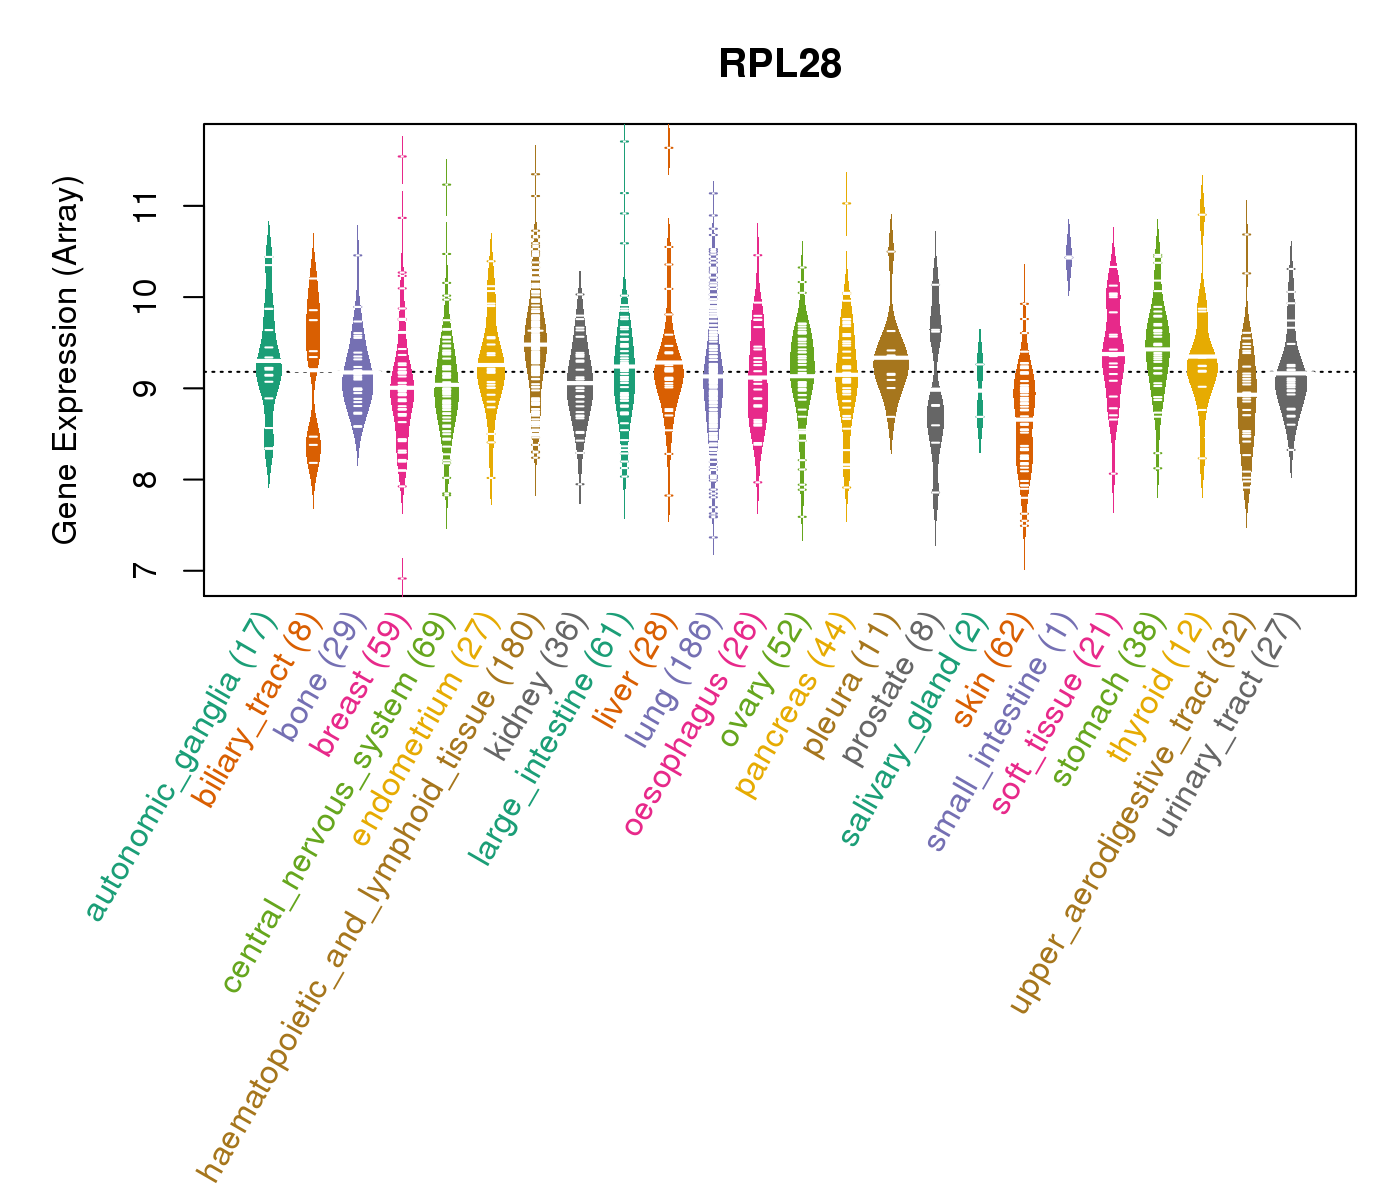
| Gene Expression for RPL28 |
| * CCLE gene expression data were extracted from CCLE_Expression_Entrez_2012-10-18.res: Gene-centric RMA-normalized mRNA expression data. |
 |
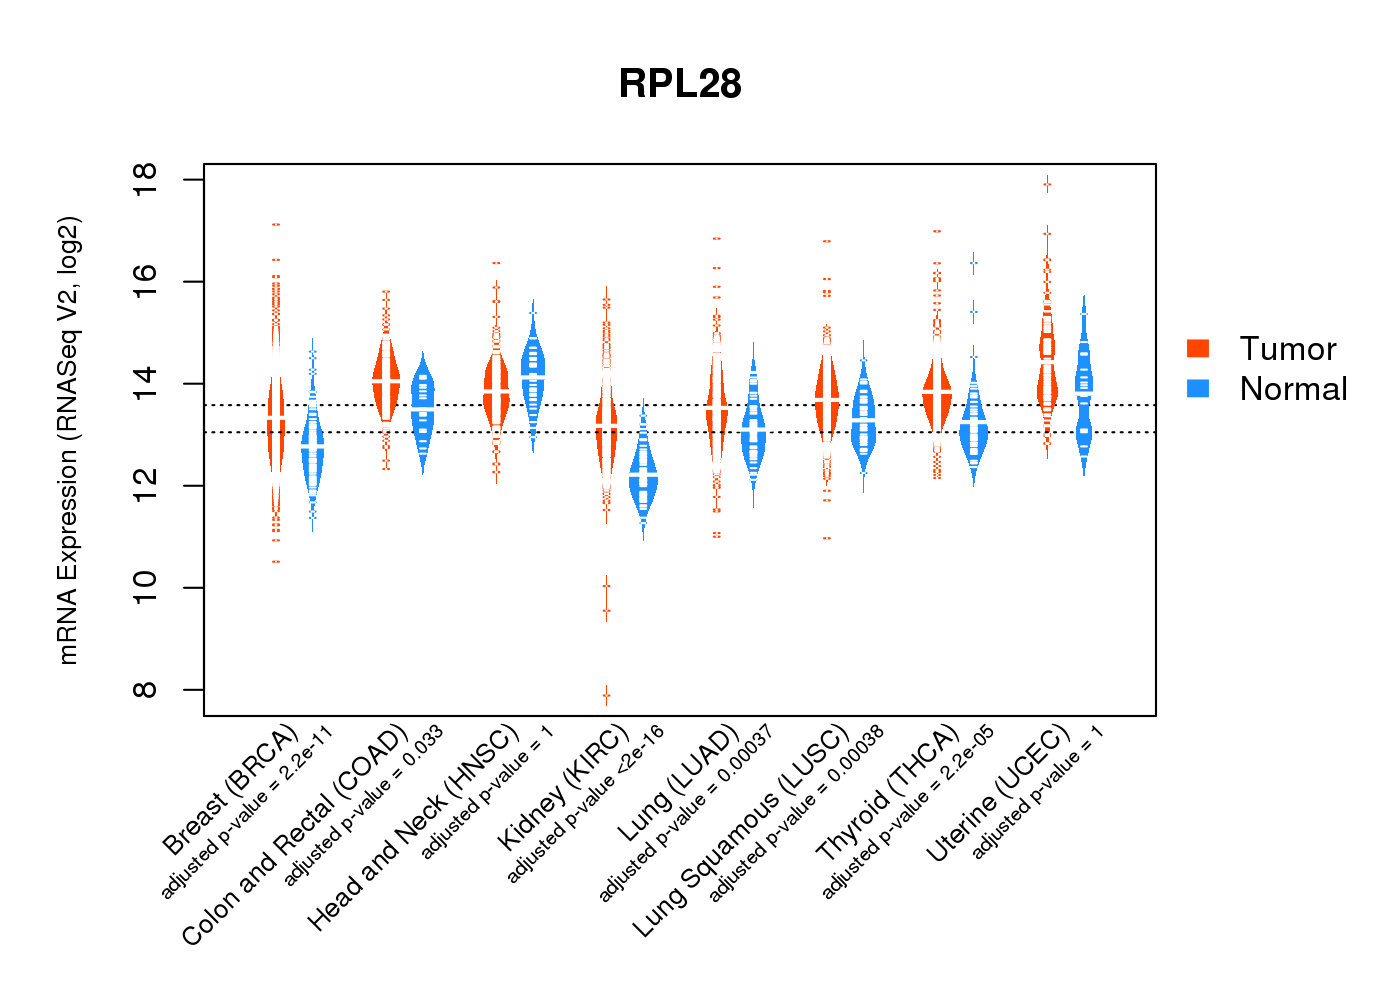
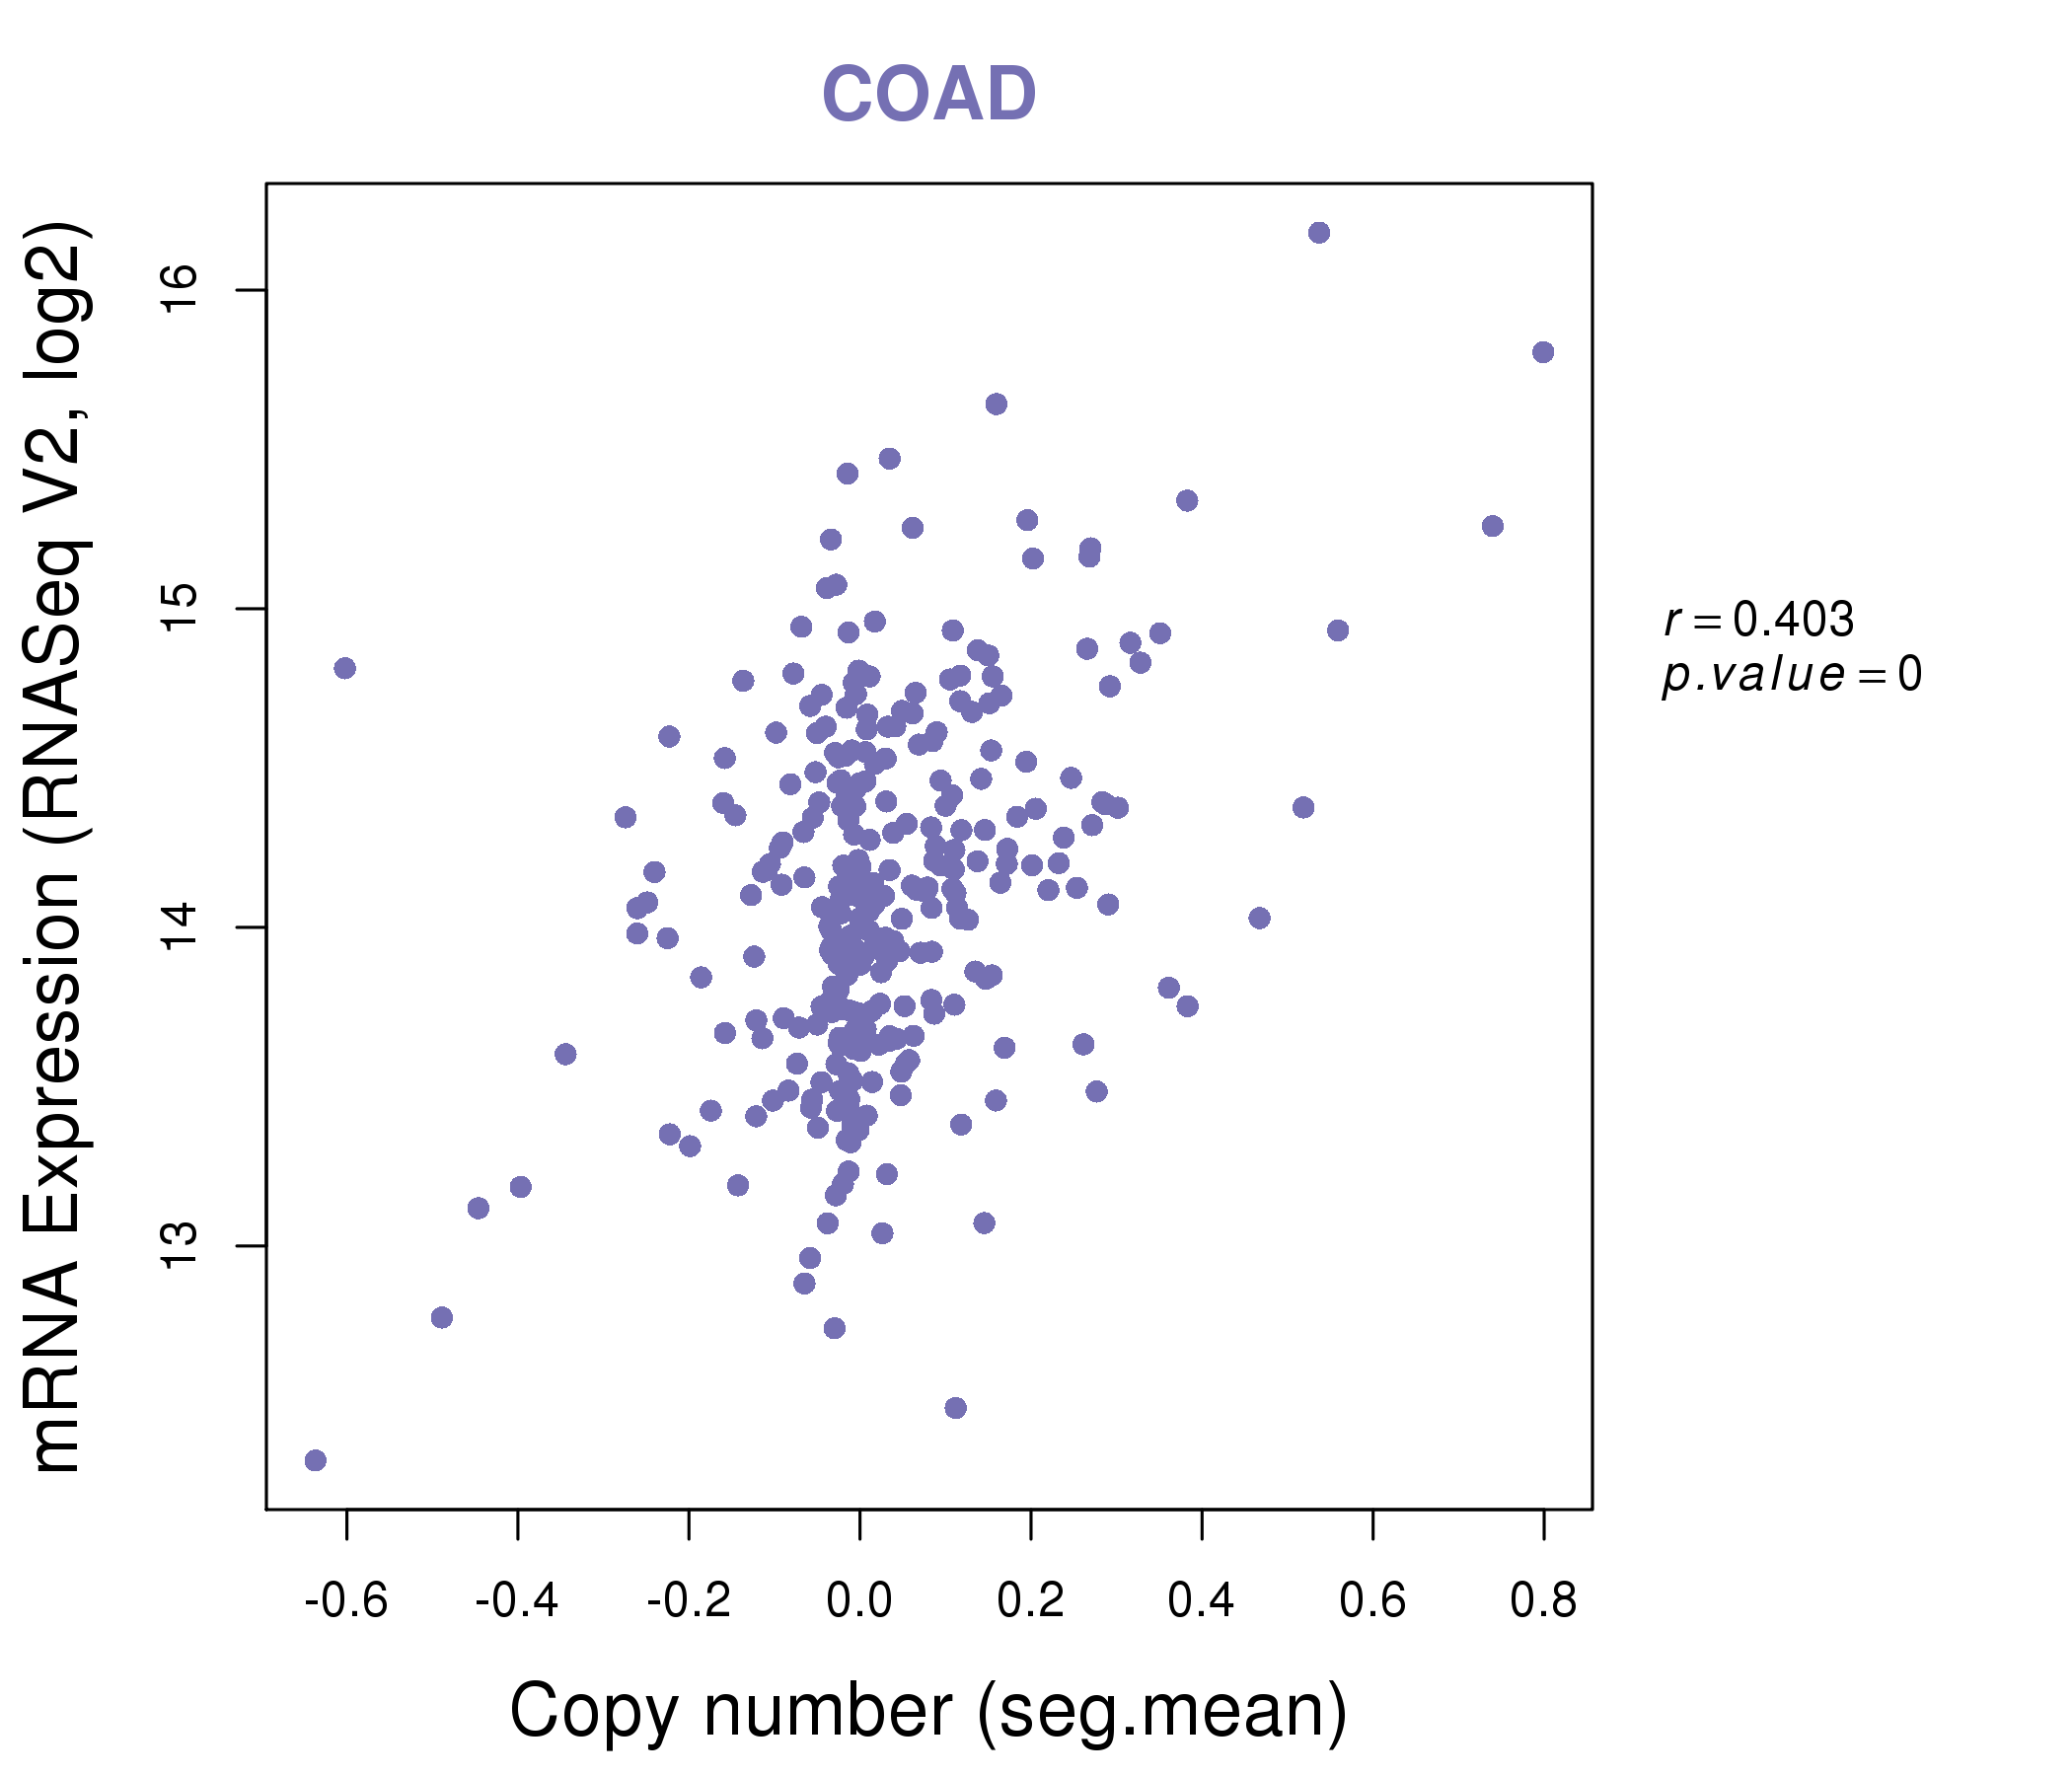
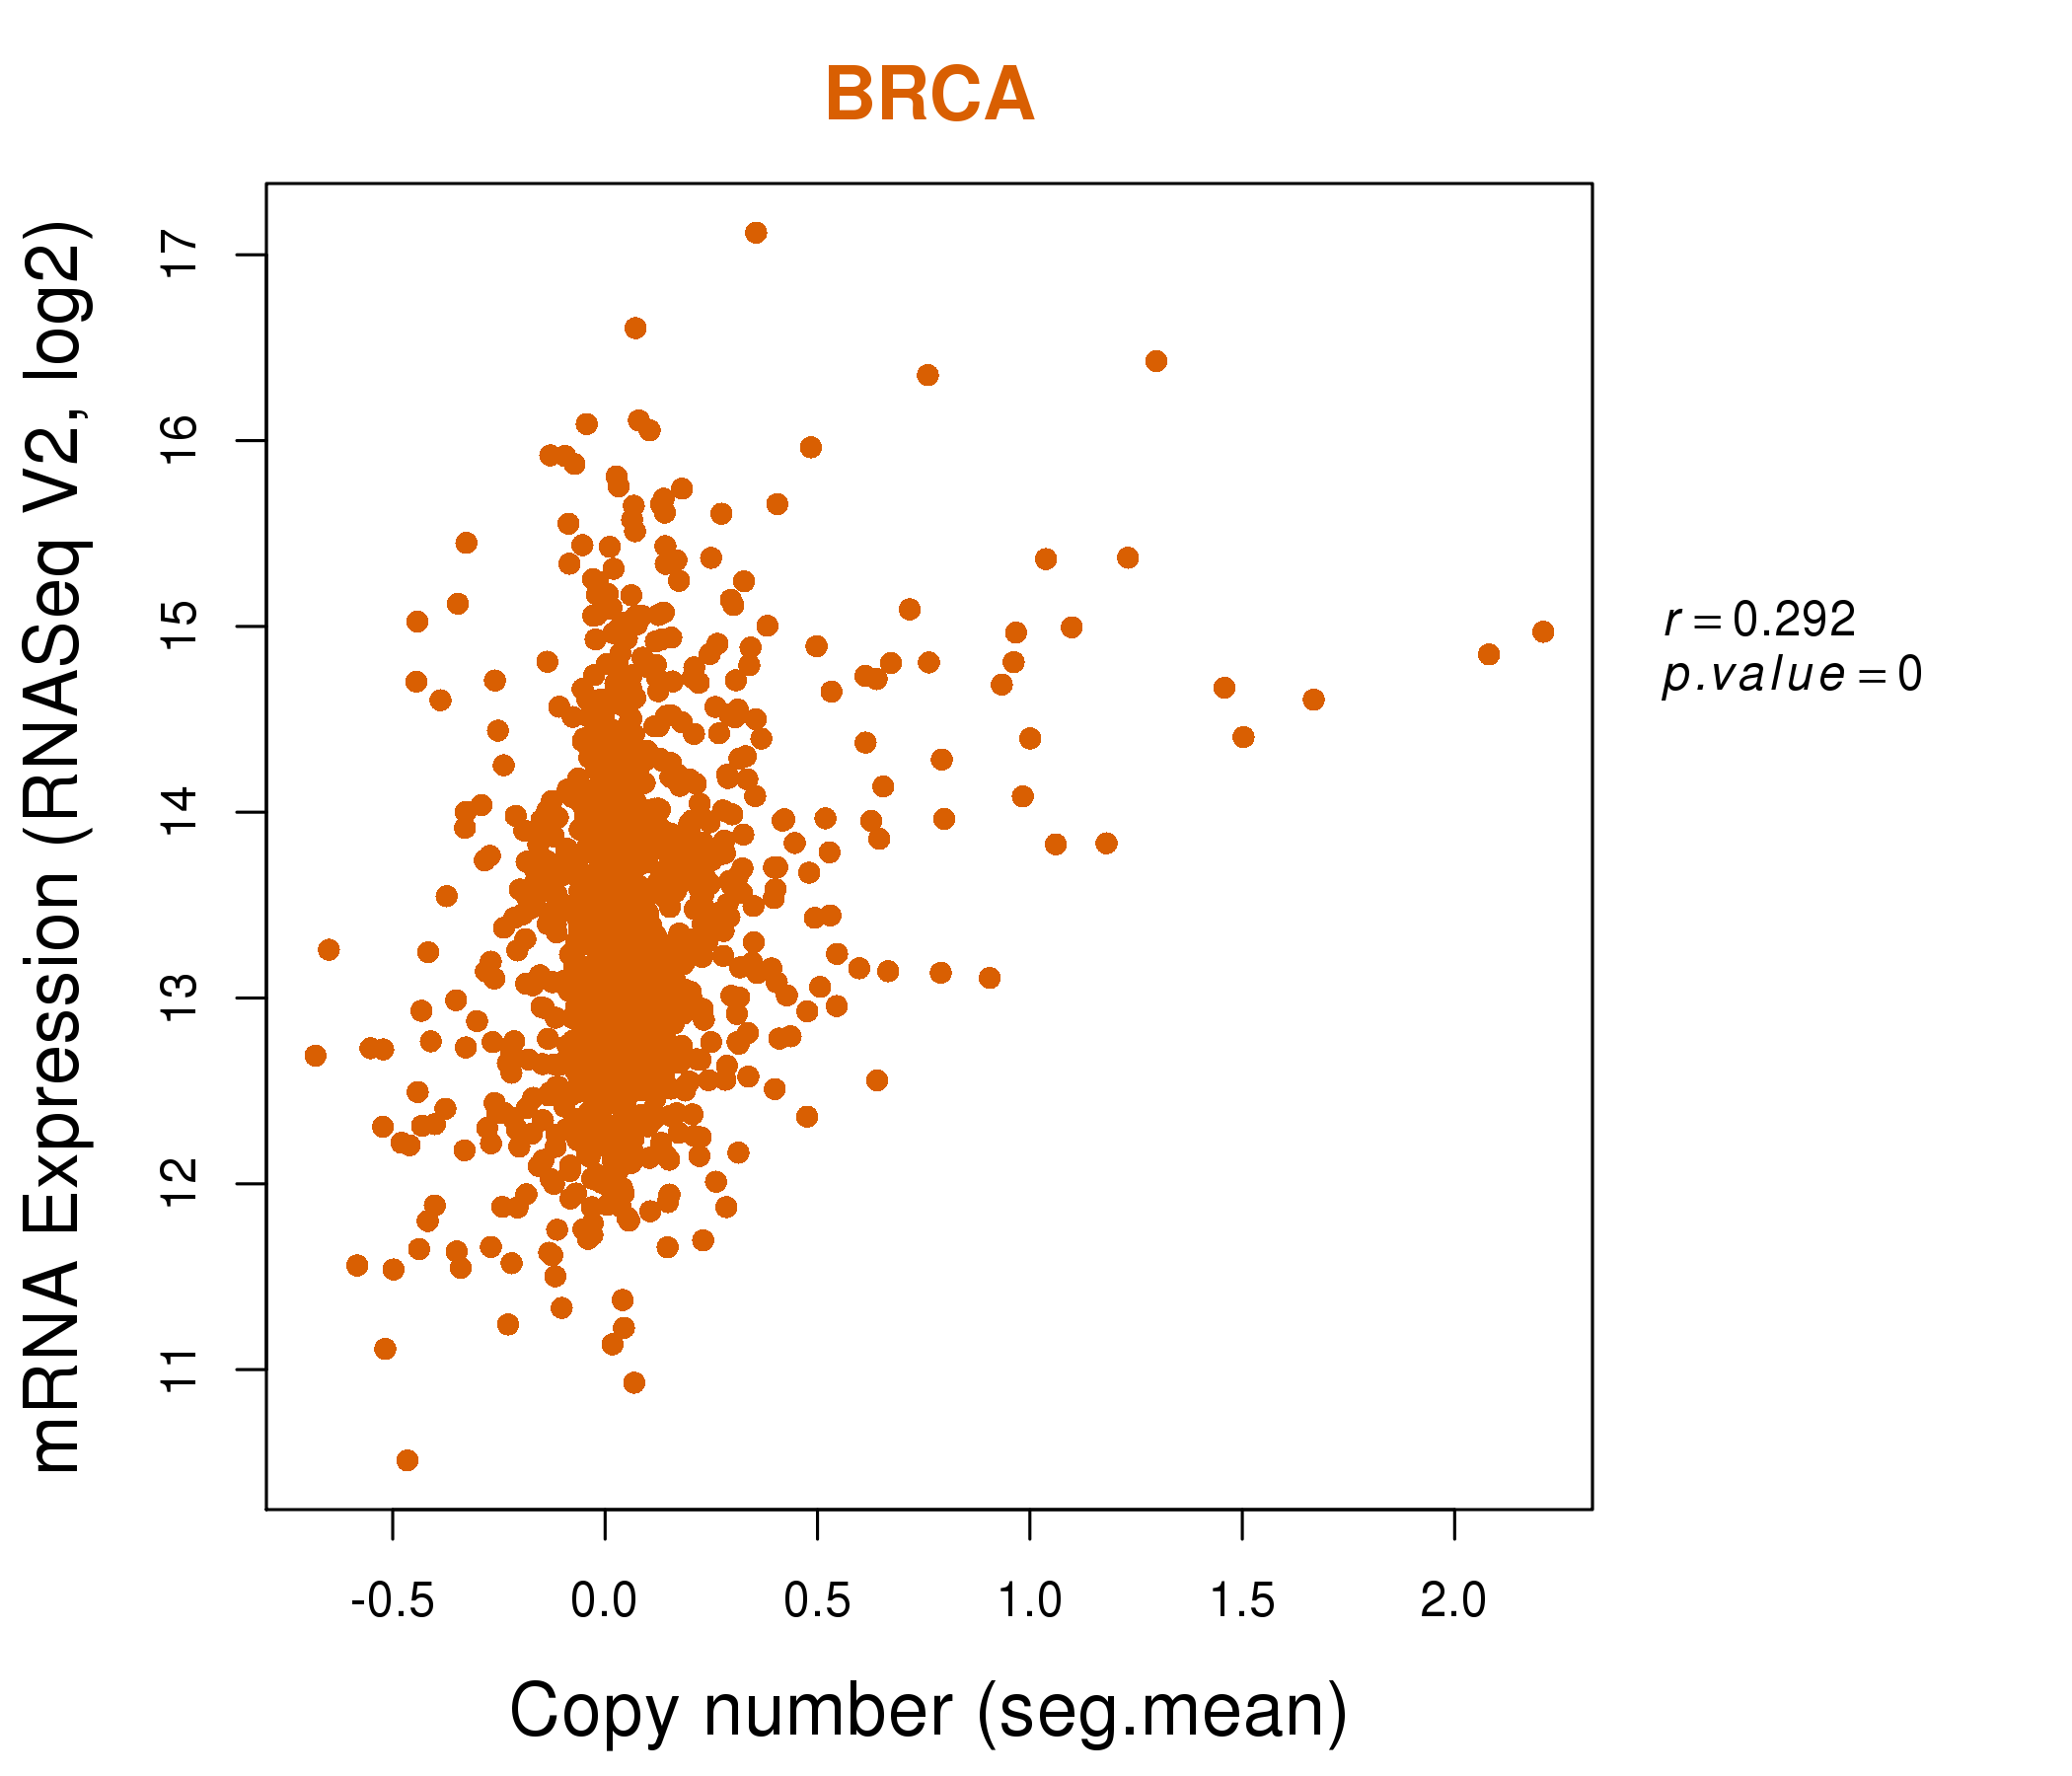
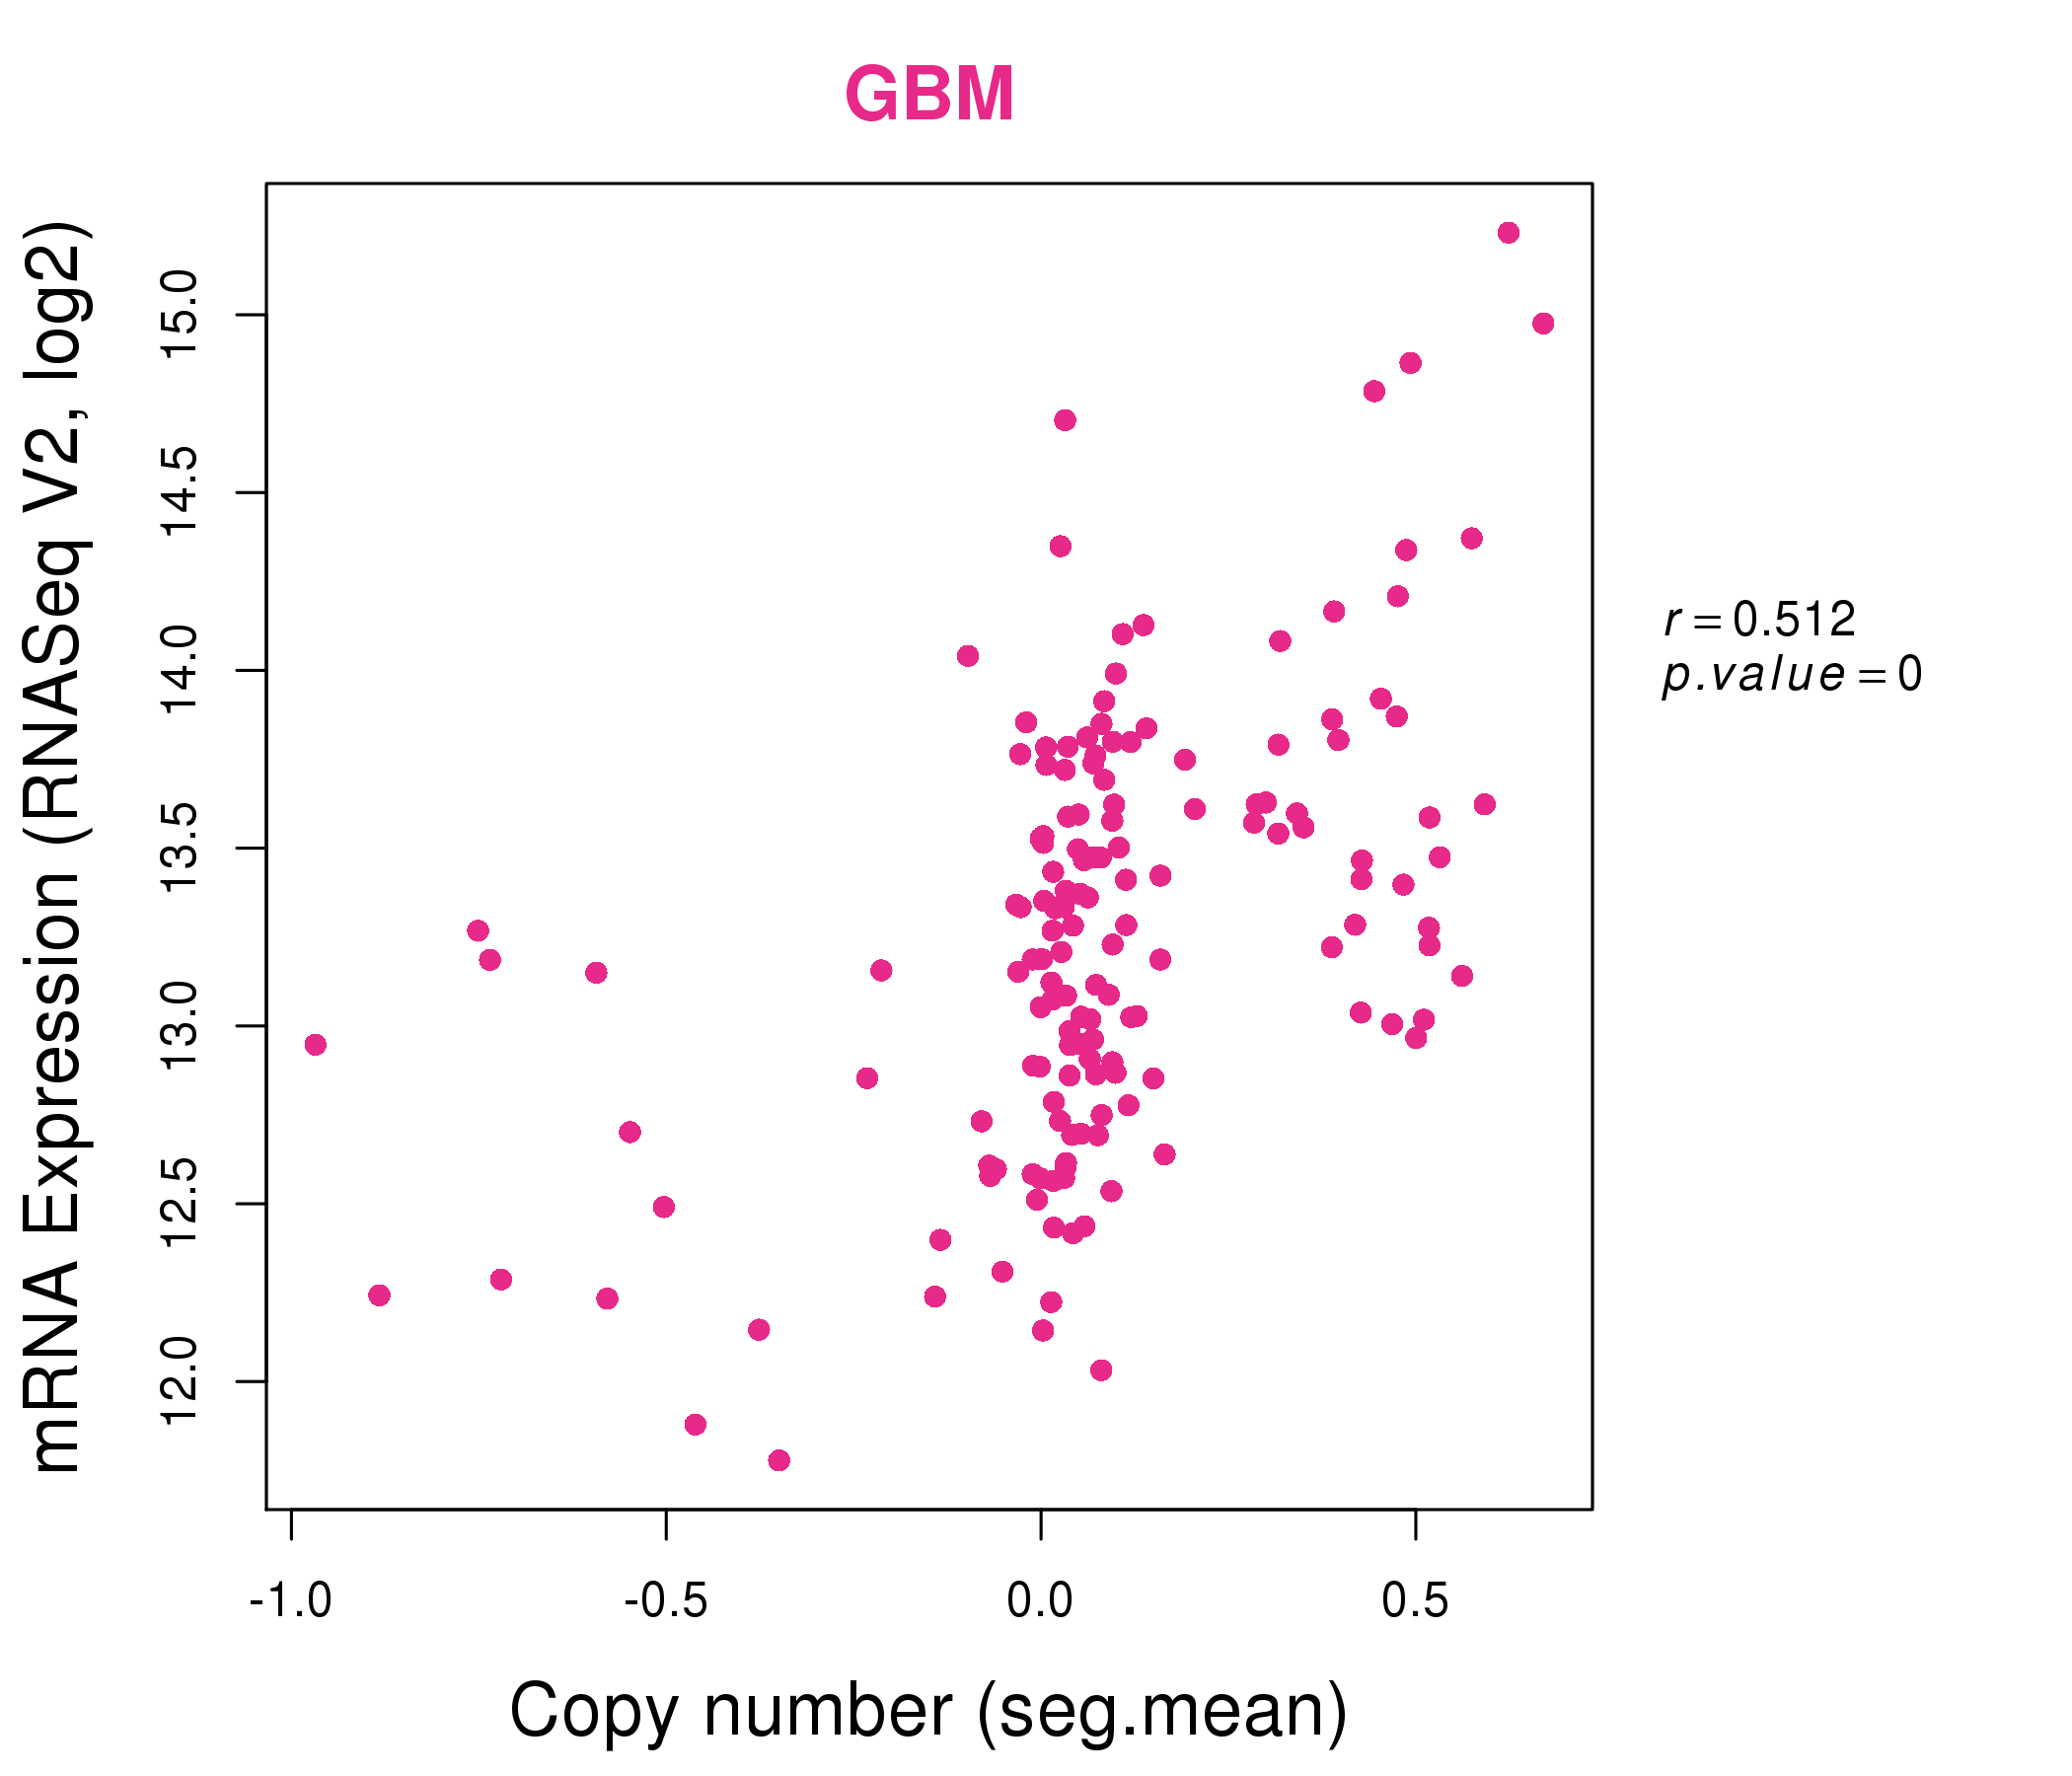
| * Normalized gene expression data of RNASeqV2 was extracted from TCGA using R package TCGA-Assembler. The URLs of all public data files on TCGA DCC data server were gathered at Jan-05-2015. Only eight cancer types have enough normal control samples for differential expression analysis. (t test, adjusted p<0.05 (using Benjamini-Hochberg FDR)) |
 |
| Top |
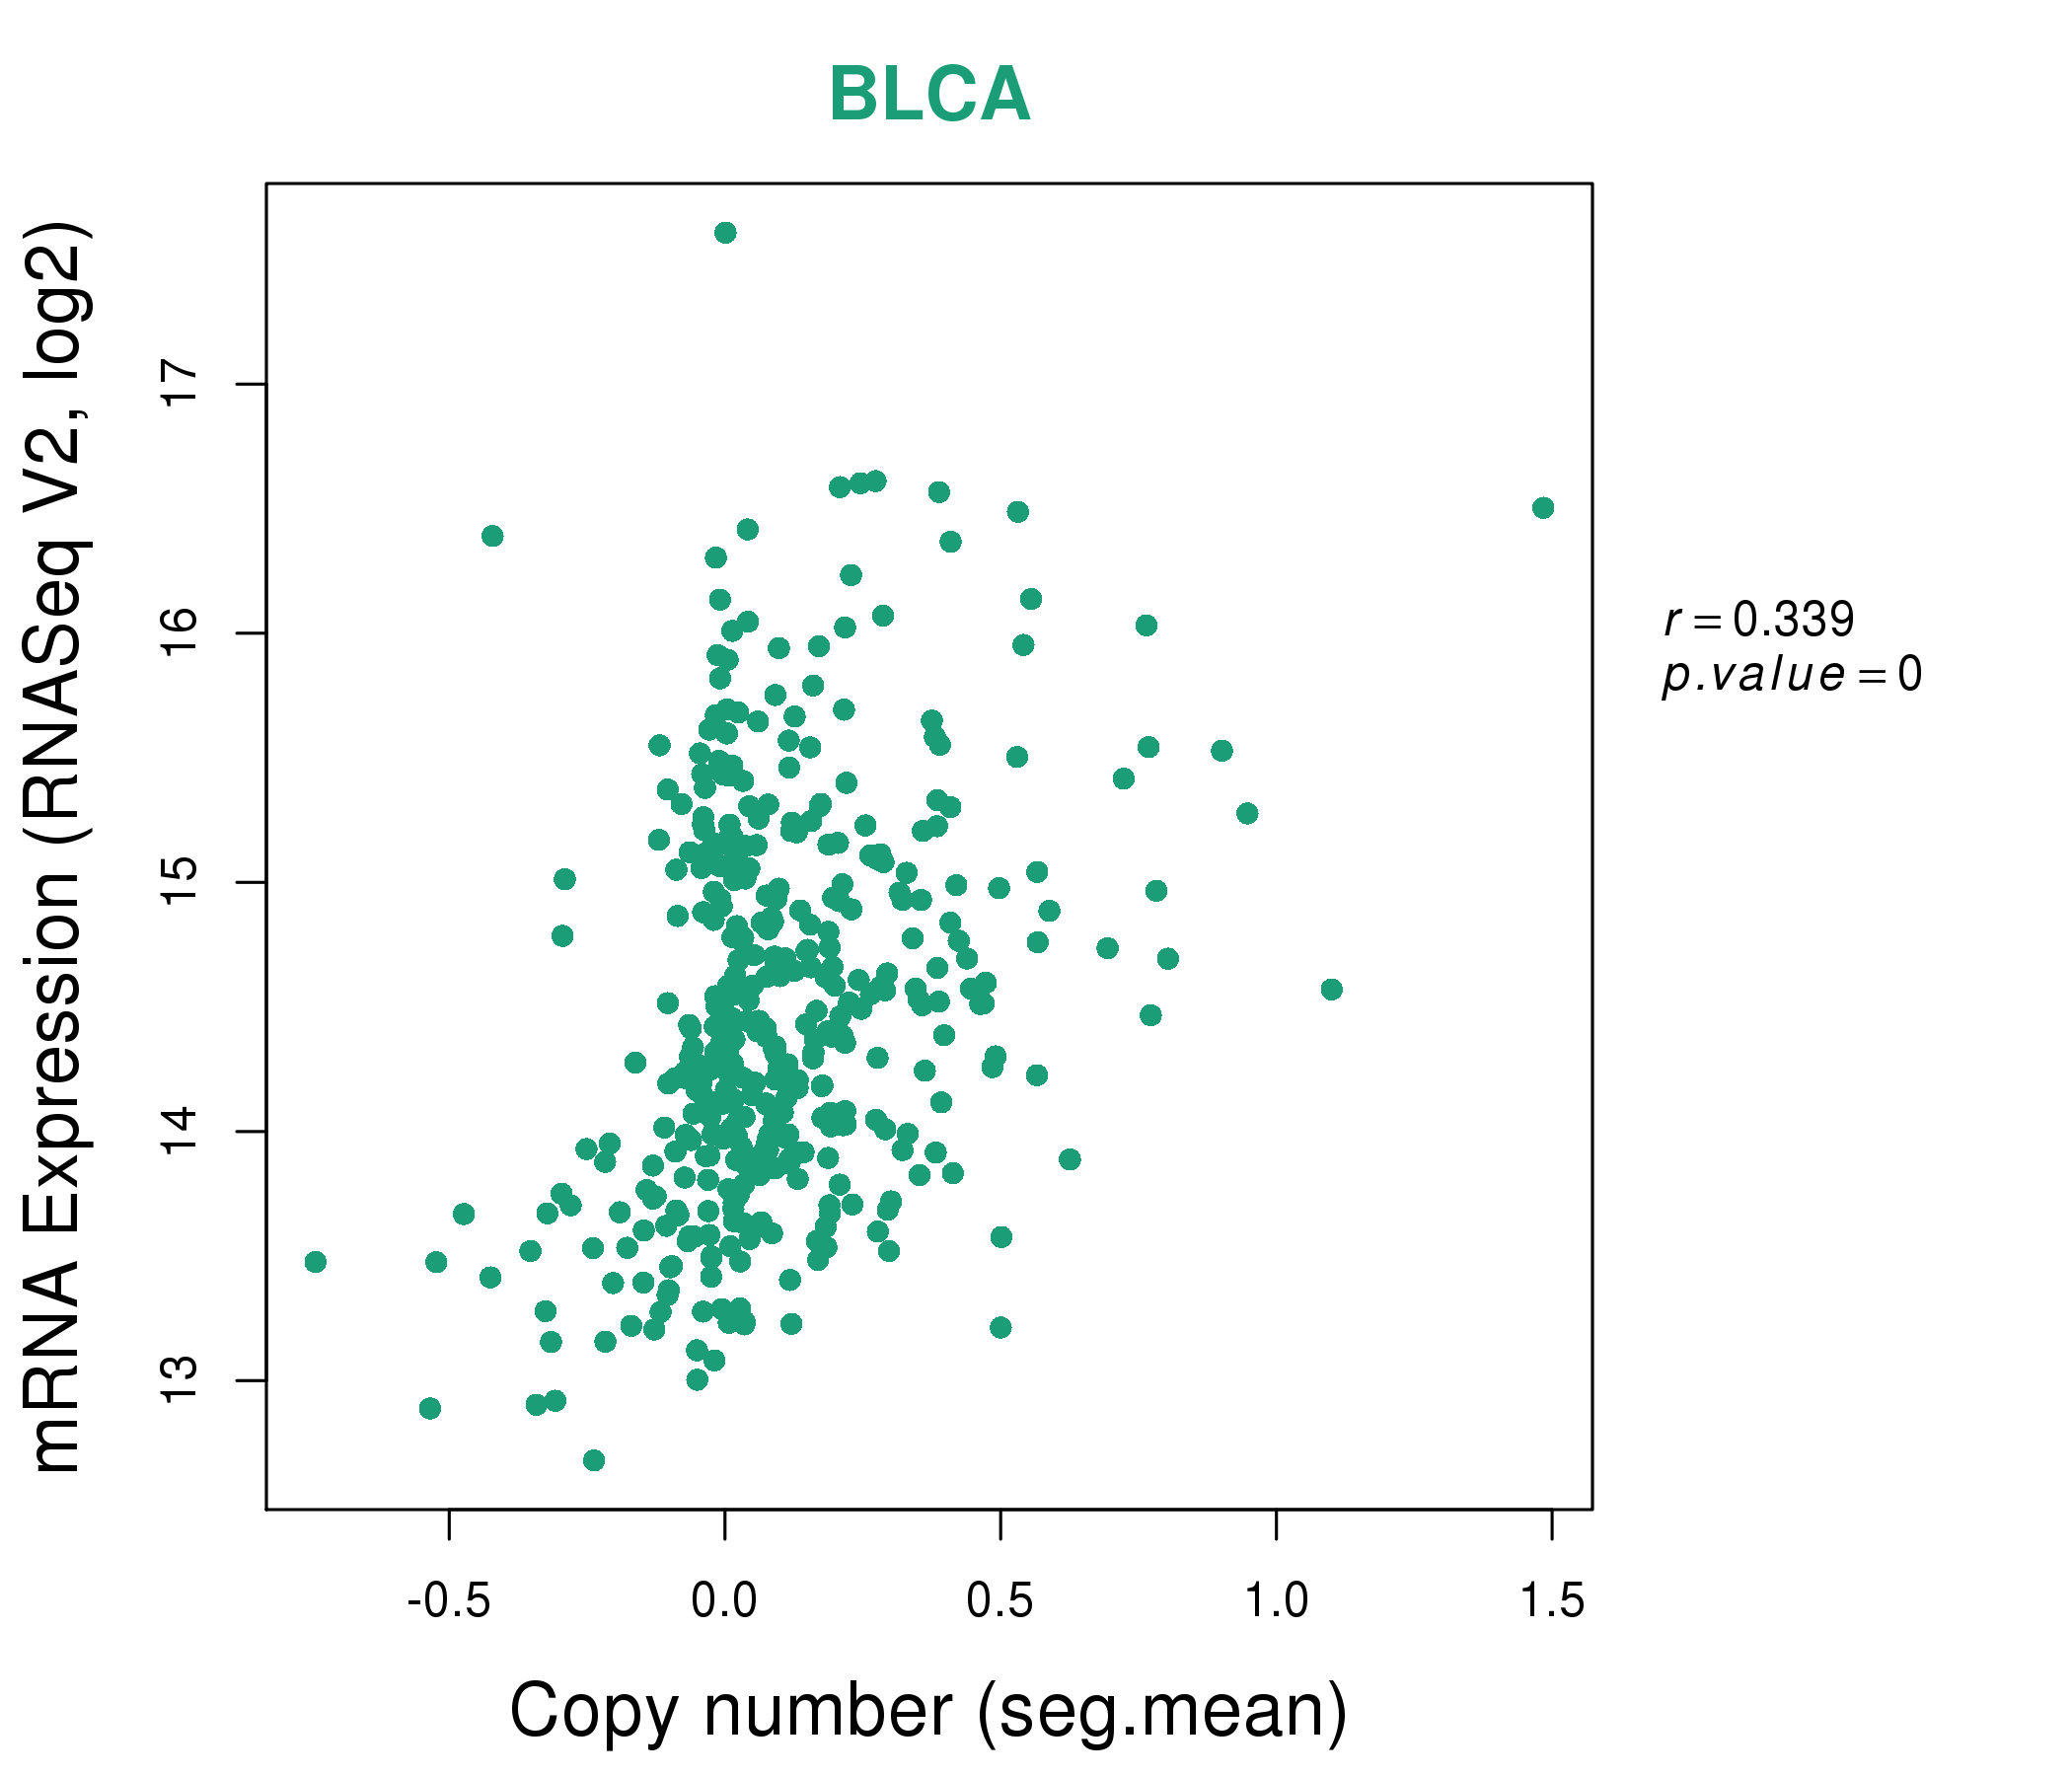
| * This plots show the correlation between CNV and gene expression. |
: Open all plots for all cancer types
 |
|
 |
|
| Top |
| Gene-Gene Network Information |
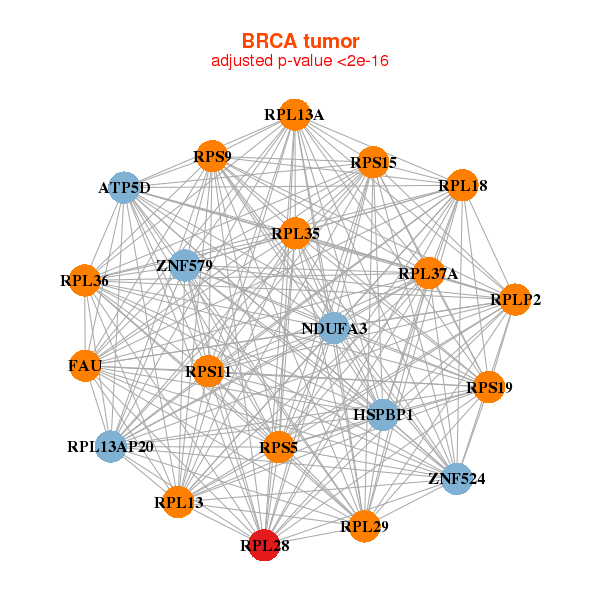
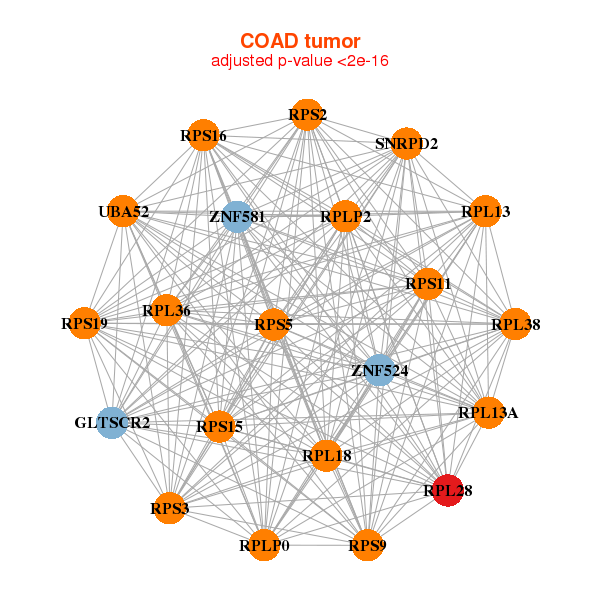
| * Co-Expression network figures were drawn using R package igraph. Only the top 20 genes with the highest correlations were shown. Red circle: input gene, orange circle: cell metabolism gene, sky circle: other gene |
: Open all plots for all cancer types
 |
|
| ATP5D,FAU,HSPBP1,NDUFA3,RPL13,RPL13A,RPL13AP20, RPL18,RPL28,RPL29,RPL35,RPL36,RPL37A,RPLP2, RPS11,RPS15,RPS19,RPS5,RPS9,ZNF524,ZNF579 | DNAJC4,ETHE1,FAU,MRPS2,RPL13,RPL13A,RPL18, RPL18A,RPL19,RPL28,RPL29,RPL35,RPL36,RPP21, RPS15,RPS16,RPS19,RPS21,RPS9,SLC27A5,ZNF581 |
 |
|
| GLTSCR2,RPL13,RPL13A,RPL18,RPL28,RPL36,RPL38, RPLP0,RPLP2,RPS11,RPS15,RPS16,RPS19,RPS2, RPS3,RPS5,RPS9,SNRPD2,UBA52,ZNF524,ZNF581 | ATPAF2,EEF1G,EIF3D,EIF3F,GNB2L1,MACROD1,MAPKAPK3, NOB1,QTRT1,RPL13,RPL18,RPL28,RPL36,RPL37, RPLP2,RPS15,RPS19,RPS2,SLC25A6,UBA52,ZNF524 |
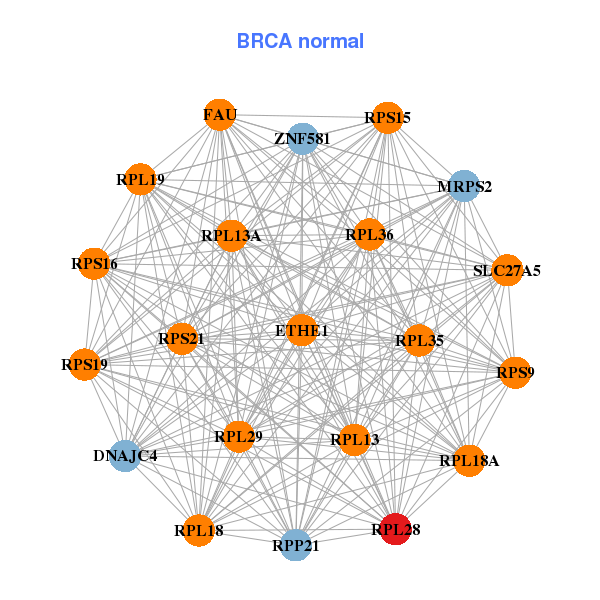
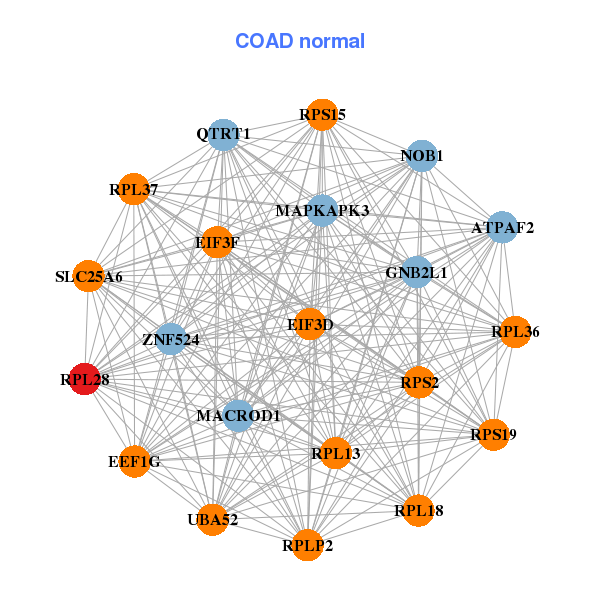
| * Co-Expression network figures were drawn using R package igraph. Only the top 20 genes with the highest correlations were shown. Red circle: input gene, orange circle: cell metabolism gene, sky circle: other gene |
: Open all plots for all cancer types
| Top |
: Open all interacting genes' information including KEGG pathway for all interacting genes from DAVID
| Top |
| Pharmacological Information for RPL28 |
| There's no related Drug. |
| Top |
| Cross referenced IDs for RPL28 |
| * We obtained these cross-references from Uniprot database. It covers 150 different DBs, 18 categories. http://www.uniprot.org/help/cross_references_section |
: Open all cross reference information
|
Copyright © 2016-Present - The Univsersity of Texas Health Science Center at Houston @ |