|
||||||||||||||||||||
| |
| Phenotypic Information (metabolism pathway, cancer, disease, phenome) |
| |
| |
| Gene-Gene Network Information: Co-Expression Network, Interacting Genes & KEGG |
| |
|


| Gene Summary for RPL34 |
| Basic gene info. | Gene symbol | RPL34 |
| Gene name | ribosomal protein L34 | |
| Synonyms | L34 | |
| Cytomap | UCSC genome browser: 4q25 | |
| Genomic location | chr4 :109541748-109551639 | |
| Type of gene | protein-coding | |
| RefGenes | NM_000995.3, NM_033625.2, | |
| Ensembl id | ENSG00000109475 | |
| Description | 60S ribosomal protein L34leukemia-associated protein | |
| Modification date | 20141207 | |
| dbXrefs | HGNC : HGNC | |
| Ensembl : ENSG00000109475 | ||
| HPRD : 17996 | ||
| Vega : OTTHUMG00000131839 | ||
| Protein | UniProt: go to UniProt's Cross Reference DB Table | |
| Expression | CleanEX: HS_RPL34 | |
| BioGPS: 6164 | ||
| Gene Expression Atlas: ENSG00000109475 | ||
| The Human Protein Atlas: ENSG00000109475 | ||
| Pathway | NCI Pathway Interaction Database: RPL34 | |
| KEGG: RPL34 | ||
| REACTOME: RPL34 | ||
| ConsensusPathDB | ||
| Pathway Commons: RPL34 | ||
| Metabolism | MetaCyc: RPL34 | |
| HUMANCyc: RPL34 | ||
| Regulation | Ensembl's Regulation: ENSG00000109475 | |
| miRBase: chr4 :109,541,748-109,551,639 | ||
| TargetScan: NM_000995 | ||
| cisRED: ENSG00000109475 | ||
| Context | iHOP: RPL34 | |
| cancer metabolism search in PubMed: RPL34 | ||
| UCL Cancer Institute: RPL34 | ||
| Assigned class in ccmGDB | C | |
| Top |
| Phenotypic Information for RPL34(metabolism pathway, cancer, disease, phenome) |
| Cancer | CGAP: RPL34 |
| Familial Cancer Database: RPL34 | |
| * This gene is included in those cancer gene databases. |
|
|
|
|
|
| . | ||||||||||||||
Oncogene 1 | Significant driver gene in | |||||||||||||||||||
| cf) number; DB name 1 Oncogene; http://nar.oxfordjournals.org/content/35/suppl_1/D721.long, 2 Tumor Suppressor gene; https://bioinfo.uth.edu/TSGene/, 3 Cancer Gene Census; http://www.nature.com/nrc/journal/v4/n3/abs/nrc1299.html, 4 CancerGenes; http://nar.oxfordjournals.org/content/35/suppl_1/D721.long, 5 Network of Cancer Gene; http://ncg.kcl.ac.uk/index.php, 1Therapeutic Vulnerabilities in Cancer; http://cbio.mskcc.org/cancergenomics/statius/ |
| REACTOME_METABOLISM_OF_PROTEINS REACTOME_METABOLISM_OF_MRNA REACTOME_METABOLISM_OF_RNA | |
| OMIM | |
| Orphanet | |
| Disease | KEGG Disease: RPL34 |
| MedGen: RPL34 (Human Medical Genetics with Condition) | |
| ClinVar: RPL34 | |
| Phenotype | MGI: RPL34 (International Mouse Phenotyping Consortium) |
| PhenomicDB: RPL34 | |
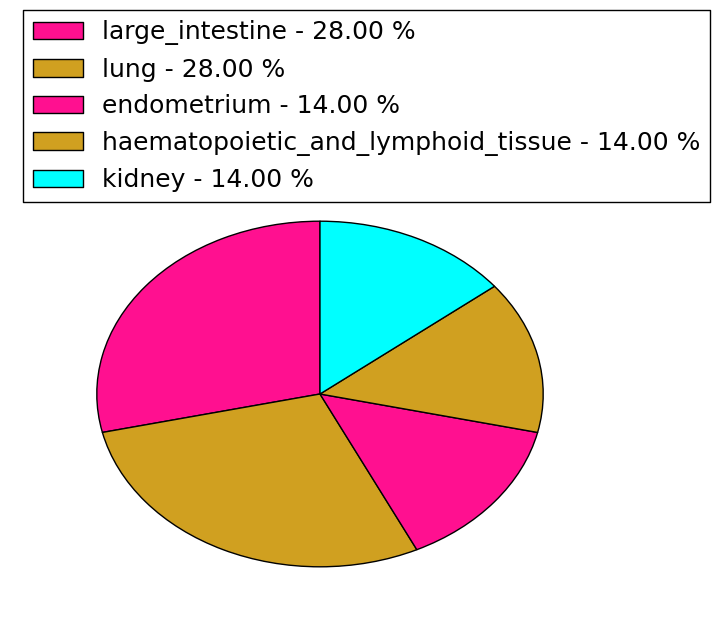
| Mutations for RPL34 |
| * Under tables are showing count per each tissue to give us broad intuition about tissue specific mutation patterns.You can go to the detailed page for each mutation database's web site. |
| - Statistics for Tissue and Mutation type | Top |
 |
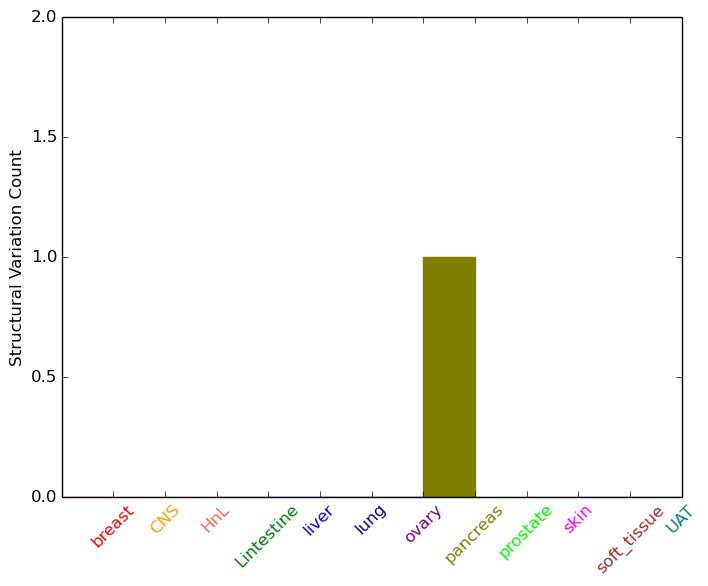
| - For Inter-chromosomal Variations |
| * Inter-chromosomal variantions includes 'interchromosomal amplicon to amplicon', 'interchromosomal amplicon to non-amplified dna', 'interchromosomal insertion', 'Interchromosomal unknown type'. |
 |
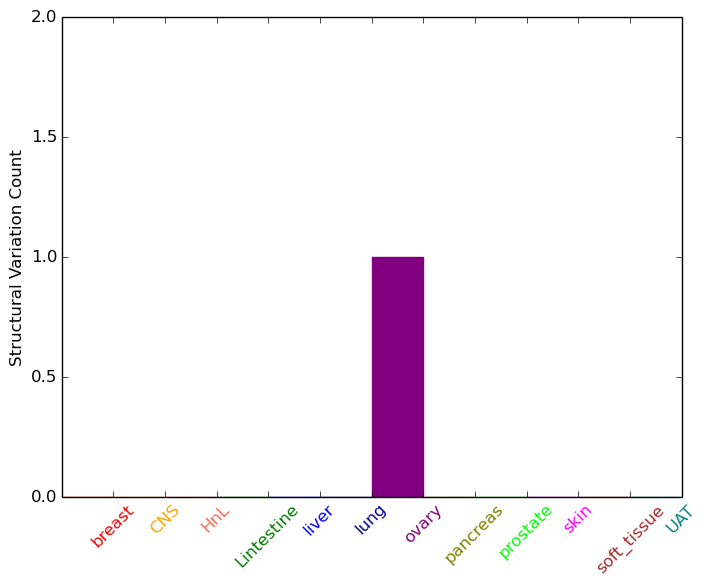
| - For Intra-chromosomal Variations |
| * Intra-chromosomal variantions includes 'intrachromosomal amplicon to amplicon', 'intrachromosomal amplicon to non-amplified dna', 'intrachromosomal deletion', 'intrachromosomal fold-back inversion', 'intrachromosomal inversion', 'intrachromosomal tandem duplication', 'Intrachromosomal unknown type', 'intrachromosomal with inverted orientation', 'intrachromosomal with non-inverted orientation'. |
 |
| Sample | Symbol_a | Chr_a | Start_a | End_a | Symbol_b | Chr_b | Start_b | End_b |
| ovary | RPL34 | chr4 | 109548351 | 109548371 | LOC285456 | chr4 | 109535847 | 109535867 |
| pancreas | RPL34 | chr4 | 109544589 | 109544609 | PKHD1L1 | chr8 | 110515488 | 110515508 |
| cf) Tissue number; Tissue name (1;Breast, 2;Central_nervous_system, 3;Haematopoietic_and_lymphoid_tissue, 4;Large_intestine, 5;Liver, 6;Lung, 7;Ovary, 8;Pancreas, 9;Prostate, 10;Skin, 11;Soft_tissue, 12;Upper_aerodigestive_tract) |
| * From mRNA Sanger sequences, Chitars2.0 arranged chimeric transcripts. This table shows RPL34 related fusion information. |
| ID | Head Gene | Tail Gene | Accession | Gene_a | qStart_a | qEnd_a | Chromosome_a | tStart_a | tEnd_a | Gene_a | qStart_a | qEnd_a | Chromosome_a | tStart_a | tEnd_a |
| BM810873 | TP53INP2 | 10 | 573 | 20 | 33297113 | 33298208 | RPL34 | 569 | 649 | 4 | 109543688 | 109543767 | |
| AA954224 | RPL34 | 3 | 161 | 4 | 109543745 | 109546412 | IQCJ | 149 | 168 | 3 | 158826972 | 158826991 | |
| BF697308 | INS-IGF2 | 1 | 490 | 11 | 2153279 | 2153766 | RPL34 | 480 | 536 | 4 | 109546339 | 109546396 | |
| AI624448 | RPL34 | 1 | 109 | 4 | 109546303 | 109546411 | NEK7 | 93 | 403 | 1 | 198290707 | 198291019 | |
| AU126976 | RPL34 | 1 | 166 | 4 | 109541733 | 109543328 | PCCB | 166 | 570 | 3 | 135969191 | 135975471 | |
| Top |
| There's no copy number variation information in COSMIC data for this gene. |
| Top |
|
 |
| Top |
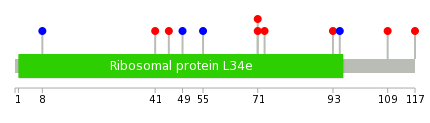
| Stat. for Non-Synonymous SNVs (# total SNVs=7) | (# total SNVs=2) |
 |  |
(# total SNVs=0) | (# total SNVs=0) |
| Top |
| * When you move the cursor on each content, you can see more deailed mutation information on the Tooltip. Those are primary_site,primary_histology,mutation(aa),pubmedID. |
| GRCh37 position | Mutation(aa) | Unique sampleID count |
| chr4:109543360-109543360 | p.G55G | 1 |
| chr4:109543717-109543717 | p.K71T | 1 |
| chr4:109543718-109543718 | p.K71N | 1 |
| chr4:109543723-109543723 | p.H73R | 1 |
| chr4:109546291-109546291 | p.R93C | 1 |
| chr4:109546299-109546299 | p.F95F | 1 |
| chr4:109546339-109546339 | p.A109T | 1 |
| chr4:109543139-109543139 | p.R8R | 1 |
| chr4:109546364-109546364 | p.K117I | 1 |
| chr4:109543317-109543317 | p.A41V | 1 |
| Top |
|
 |
| Point Mutation/ Tissue ID | 1 | 2 | 3 | 4 | 5 | 6 | 7 | 8 | 9 | 10 | 11 | 12 | 13 | 14 | 15 | 16 | 17 | 18 | 19 | 20 |
| # sample | 1 | 2 | 1 | 1 | 1 | 1 | ||||||||||||||
| # mutation | 1 | 2 | 1 | 1 | 1 | 1 | ||||||||||||||
| nonsynonymous SNV | 1 | 1 | 1 | 1 | ||||||||||||||||
| synonymous SNV | 1 | 1 | 1 |
| cf) Tissue ID; Tissue type (1; BLCA[Bladder Urothelial Carcinoma], 2; BRCA[Breast invasive carcinoma], 3; CESC[Cervical squamous cell carcinoma and endocervical adenocarcinoma], 4; COAD[Colon adenocarcinoma], 5; GBM[Glioblastoma multiforme], 6; Glioma Low Grade, 7; HNSC[Head and Neck squamous cell carcinoma], 8; KICH[Kidney Chromophobe], 9; KIRC[Kidney renal clear cell carcinoma], 10; KIRP[Kidney renal papillary cell carcinoma], 11; LAML[Acute Myeloid Leukemia], 12; LUAD[Lung adenocarcinoma], 13; LUSC[Lung squamous cell carcinoma], 14; OV[Ovarian serous cystadenocarcinoma ], 15; PAAD[Pancreatic adenocarcinoma], 16; PRAD[Prostate adenocarcinoma], 17; SKCM[Skin Cutaneous Melanoma], 18:STAD[Stomach adenocarcinoma], 19:THCA[Thyroid carcinoma], 20:UCEC[Uterine Corpus Endometrial Carcinoma]) |
| Top |
| * We represented just top 10 SNVs. When you move the cursor on each content, you can see more deailed mutation information on the Tooltip. Those are primary_site, primary_histology, mutation(aa), pubmedID. |
| Genomic Position | Mutation(aa) | Unique sampleID count |
| chr4:109546291 | p.A45T,RPL34 | 1 |
| chr4:109546299 | p.C49C,RPL34 | 1 |
| chr4:109546339 | p.G55G,RPL34 | 1 |
| chr4:109543328 | p.H73R,RPL34 | 1 |
| chr4:109543342 | p.R93C,RPL34 | 1 |
| chr4:109543360 | p.F95F,RPL34 | 1 |
| chr4:109543723 | p.A109T,RPL34 | 1 |
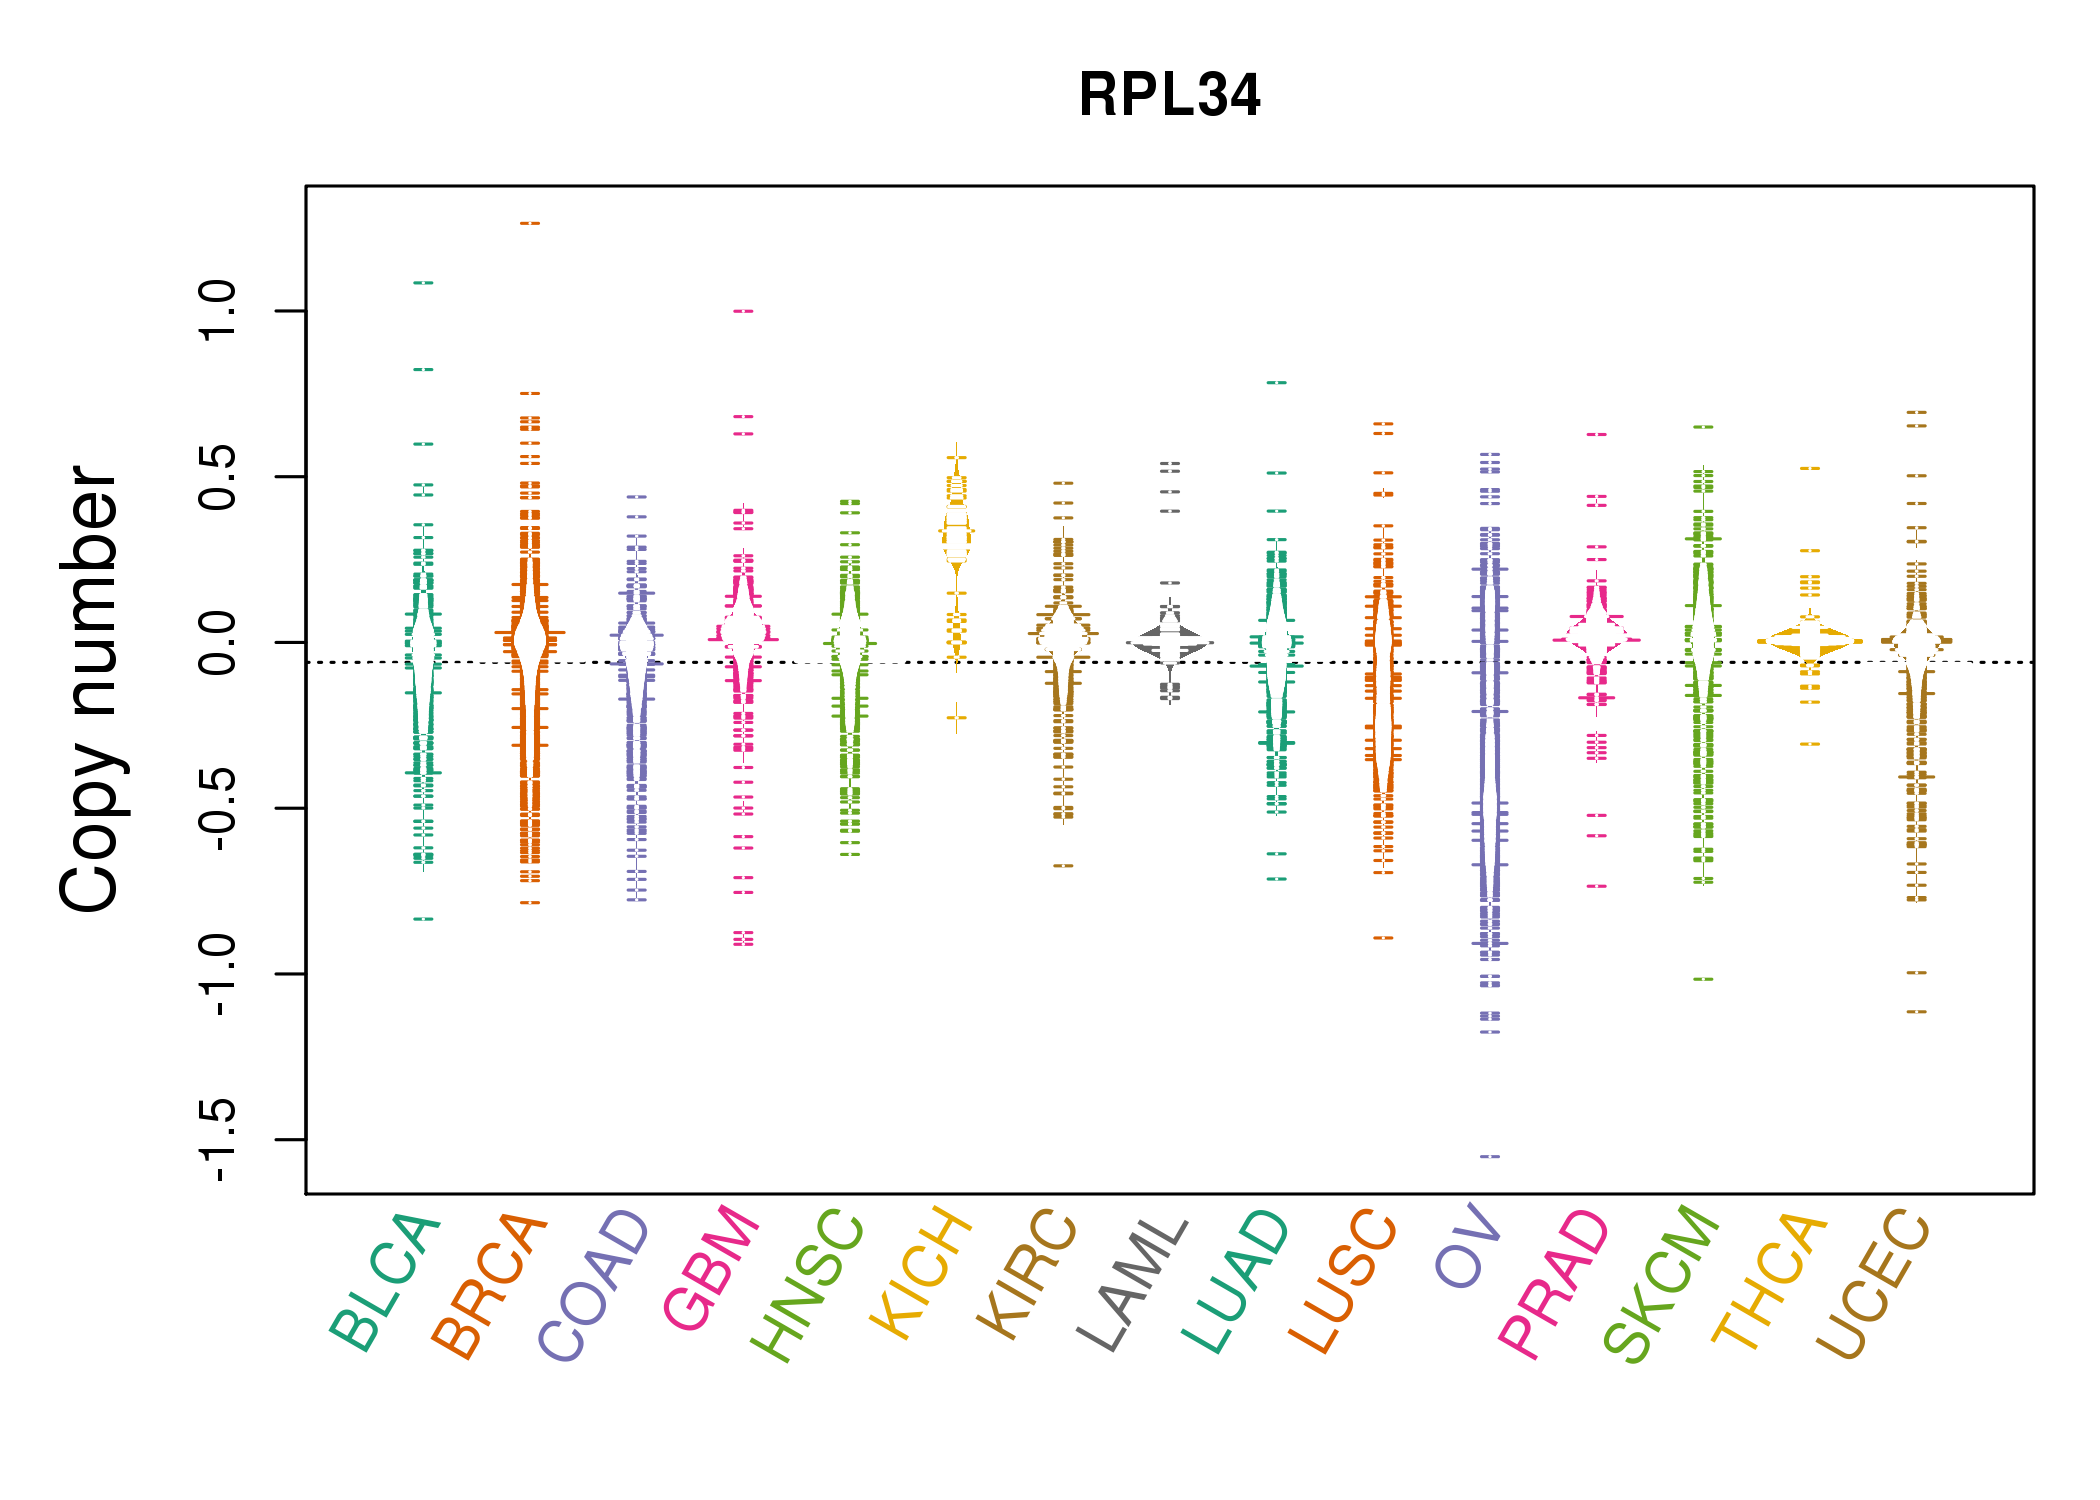
| * Copy number data were extracted from TCGA using R package TCGA-Assembler. The URLs of all public data files on TCGA DCC data server were gathered on Jan-05-2015. Function ProcessCNAData in TCGA-Assembler package was used to obtain gene-level copy number value which is calculated as the average copy number of the genomic region of a gene. |
 |
| cf) Tissue ID[Tissue type]: BLCA[Bladder Urothelial Carcinoma], BRCA[Breast invasive carcinoma], CESC[Cervical squamous cell carcinoma and endocervical adenocarcinoma], COAD[Colon adenocarcinoma], GBM[Glioblastoma multiforme], Glioma Low Grade, HNSC[Head and Neck squamous cell carcinoma], KICH[Kidney Chromophobe], KIRC[Kidney renal clear cell carcinoma], KIRP[Kidney renal papillary cell carcinoma], LAML[Acute Myeloid Leukemia], LUAD[Lung adenocarcinoma], LUSC[Lung squamous cell carcinoma], OV[Ovarian serous cystadenocarcinoma ], PAAD[Pancreatic adenocarcinoma], PRAD[Prostate adenocarcinoma], SKCM[Skin Cutaneous Melanoma], STAD[Stomach adenocarcinoma], THCA[Thyroid carcinoma], UCEC[Uterine Corpus Endometrial Carcinoma] |
| Top |
| Gene Expression for RPL34 |
| * CCLE gene expression data were extracted from CCLE_Expression_Entrez_2012-10-18.res: Gene-centric RMA-normalized mRNA expression data. |
 |
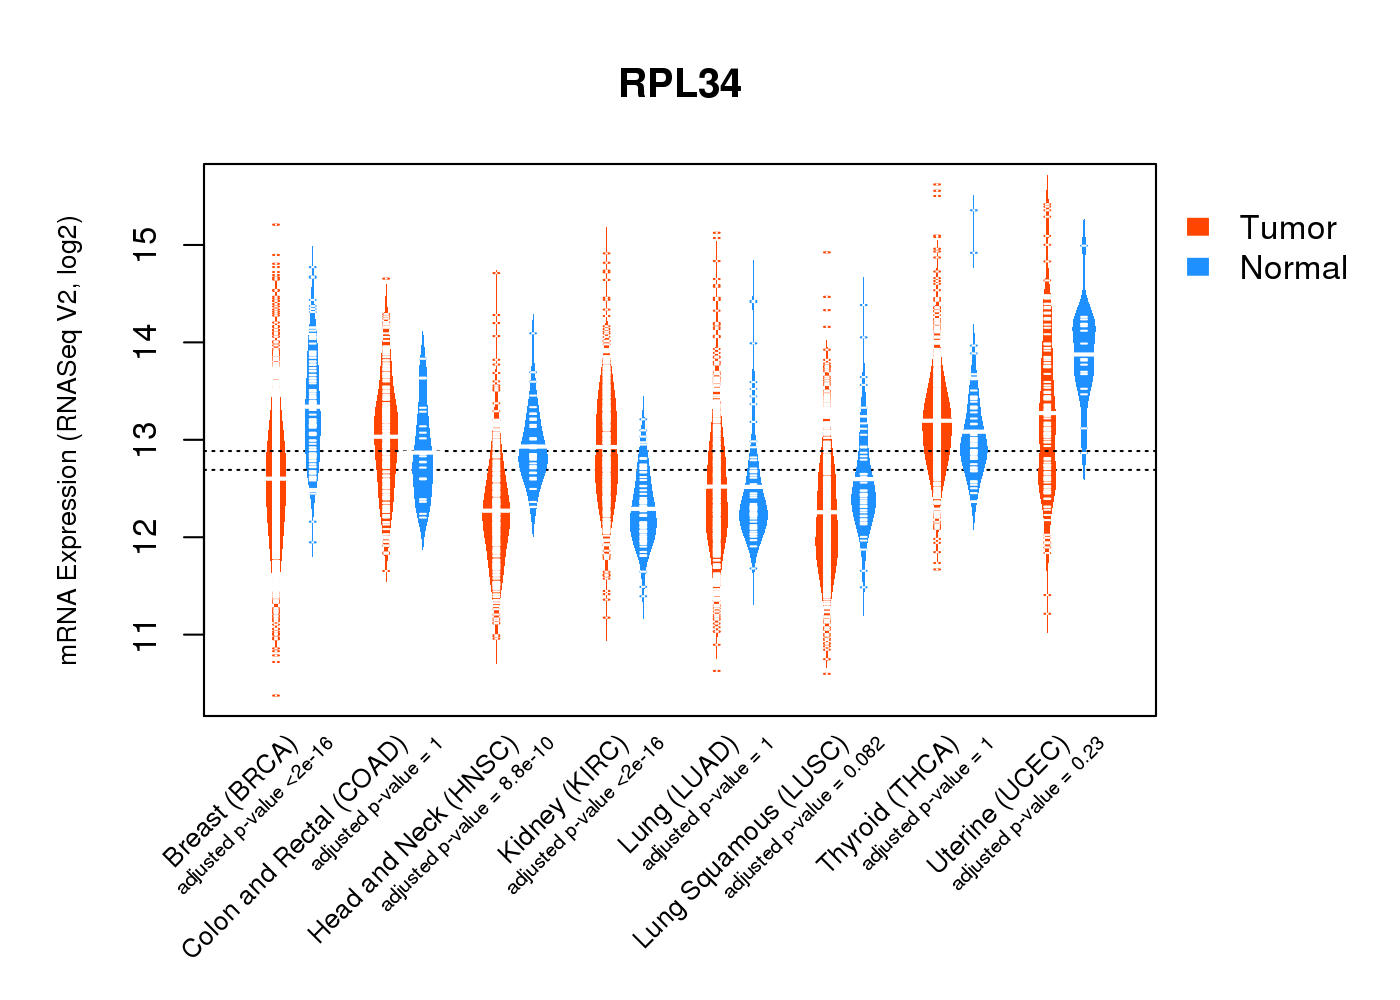
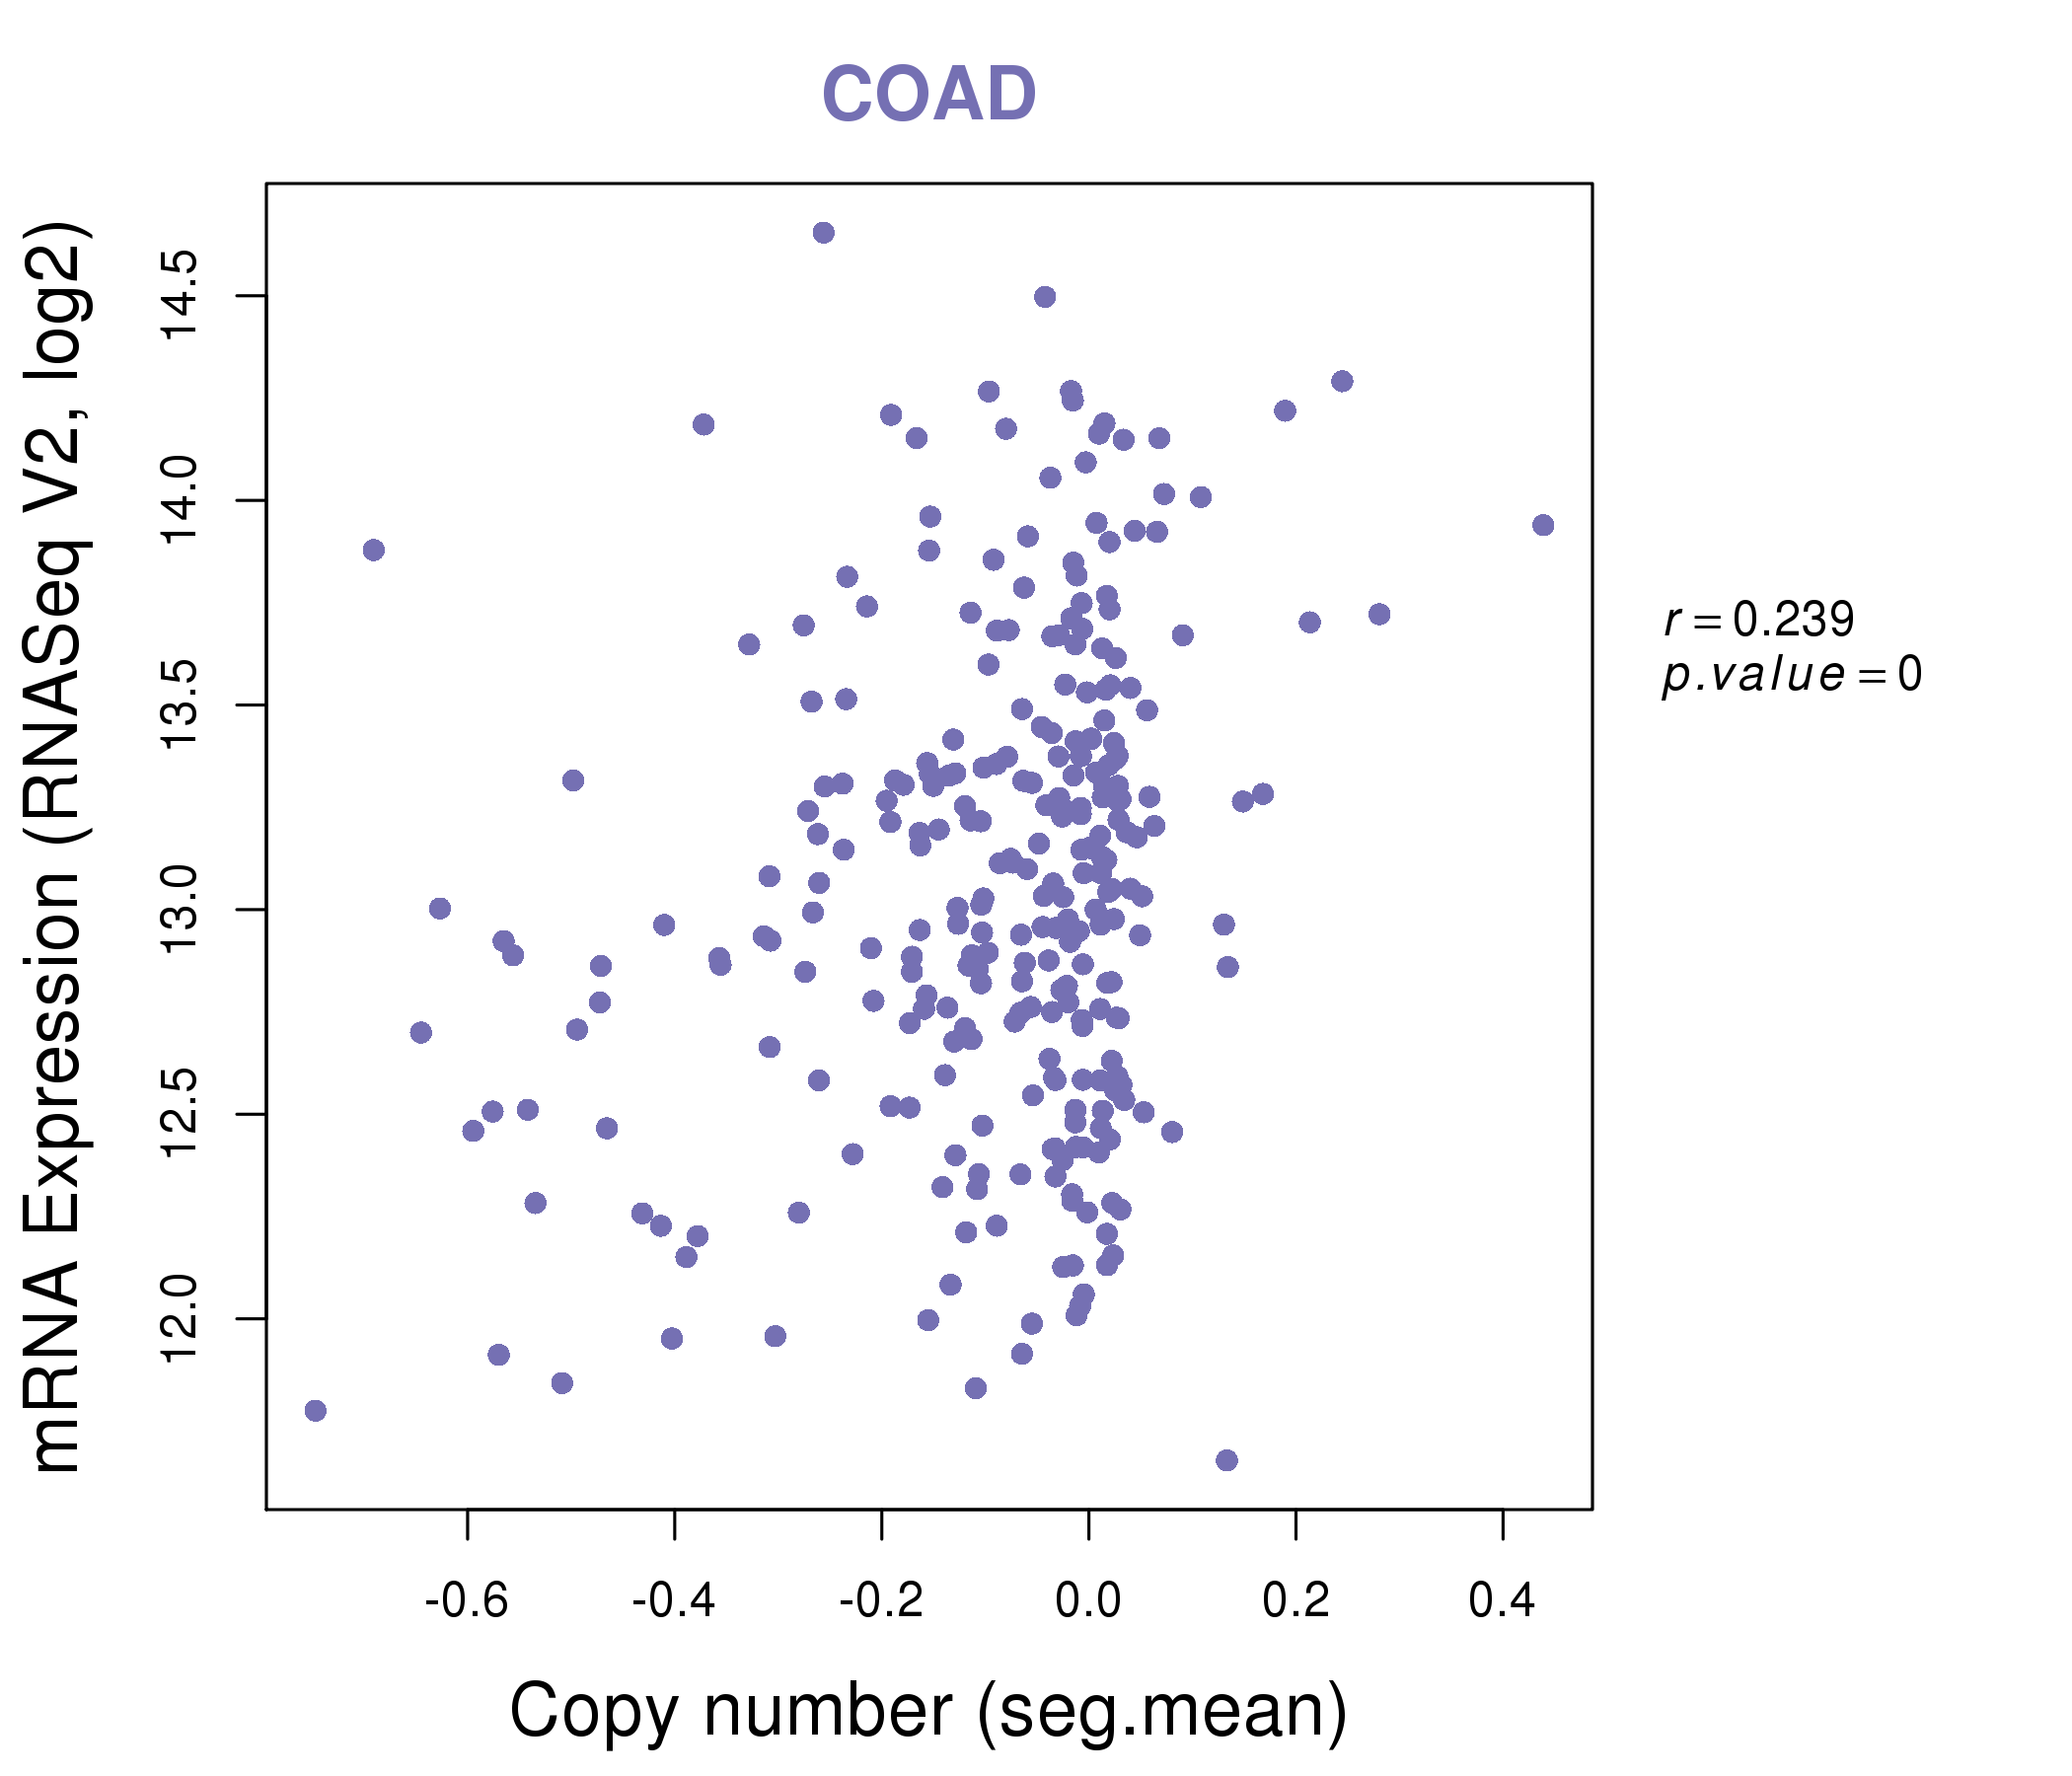
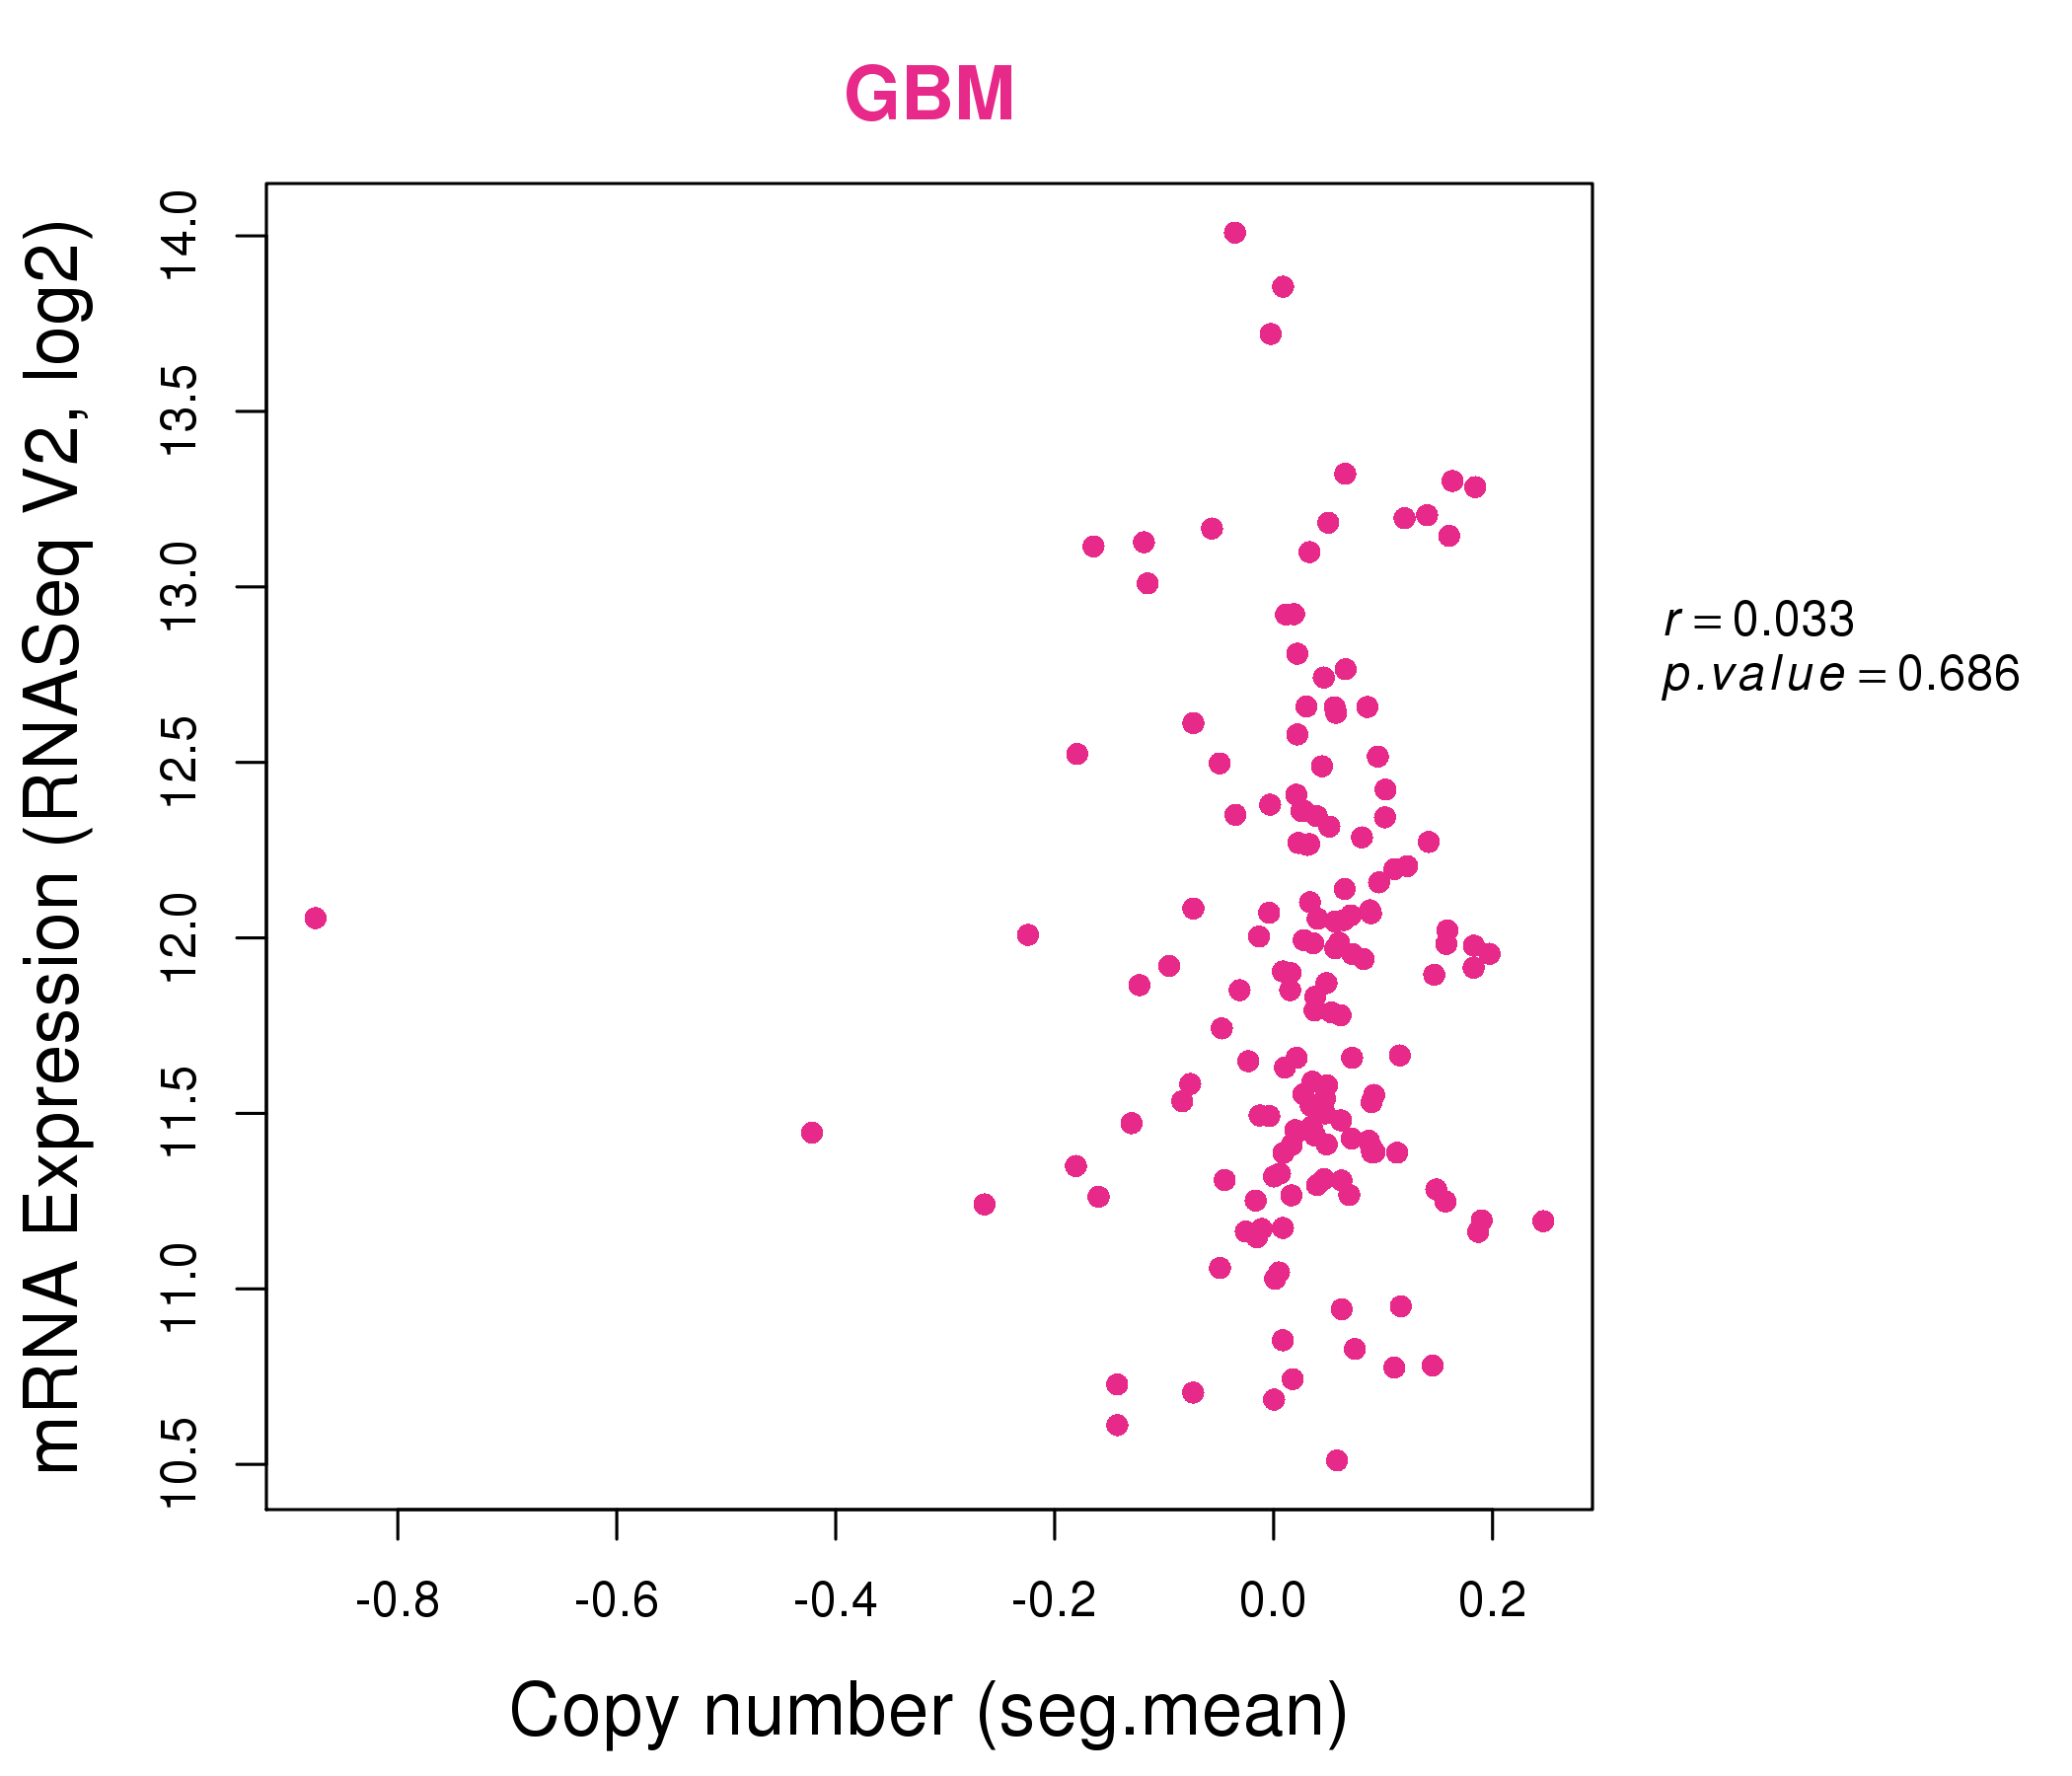
| * Normalized gene expression data of RNASeqV2 was extracted from TCGA using R package TCGA-Assembler. The URLs of all public data files on TCGA DCC data server were gathered at Jan-05-2015. Only eight cancer types have enough normal control samples for differential expression analysis. (t test, adjusted p<0.05 (using Benjamini-Hochberg FDR)) |
 |
| Top |
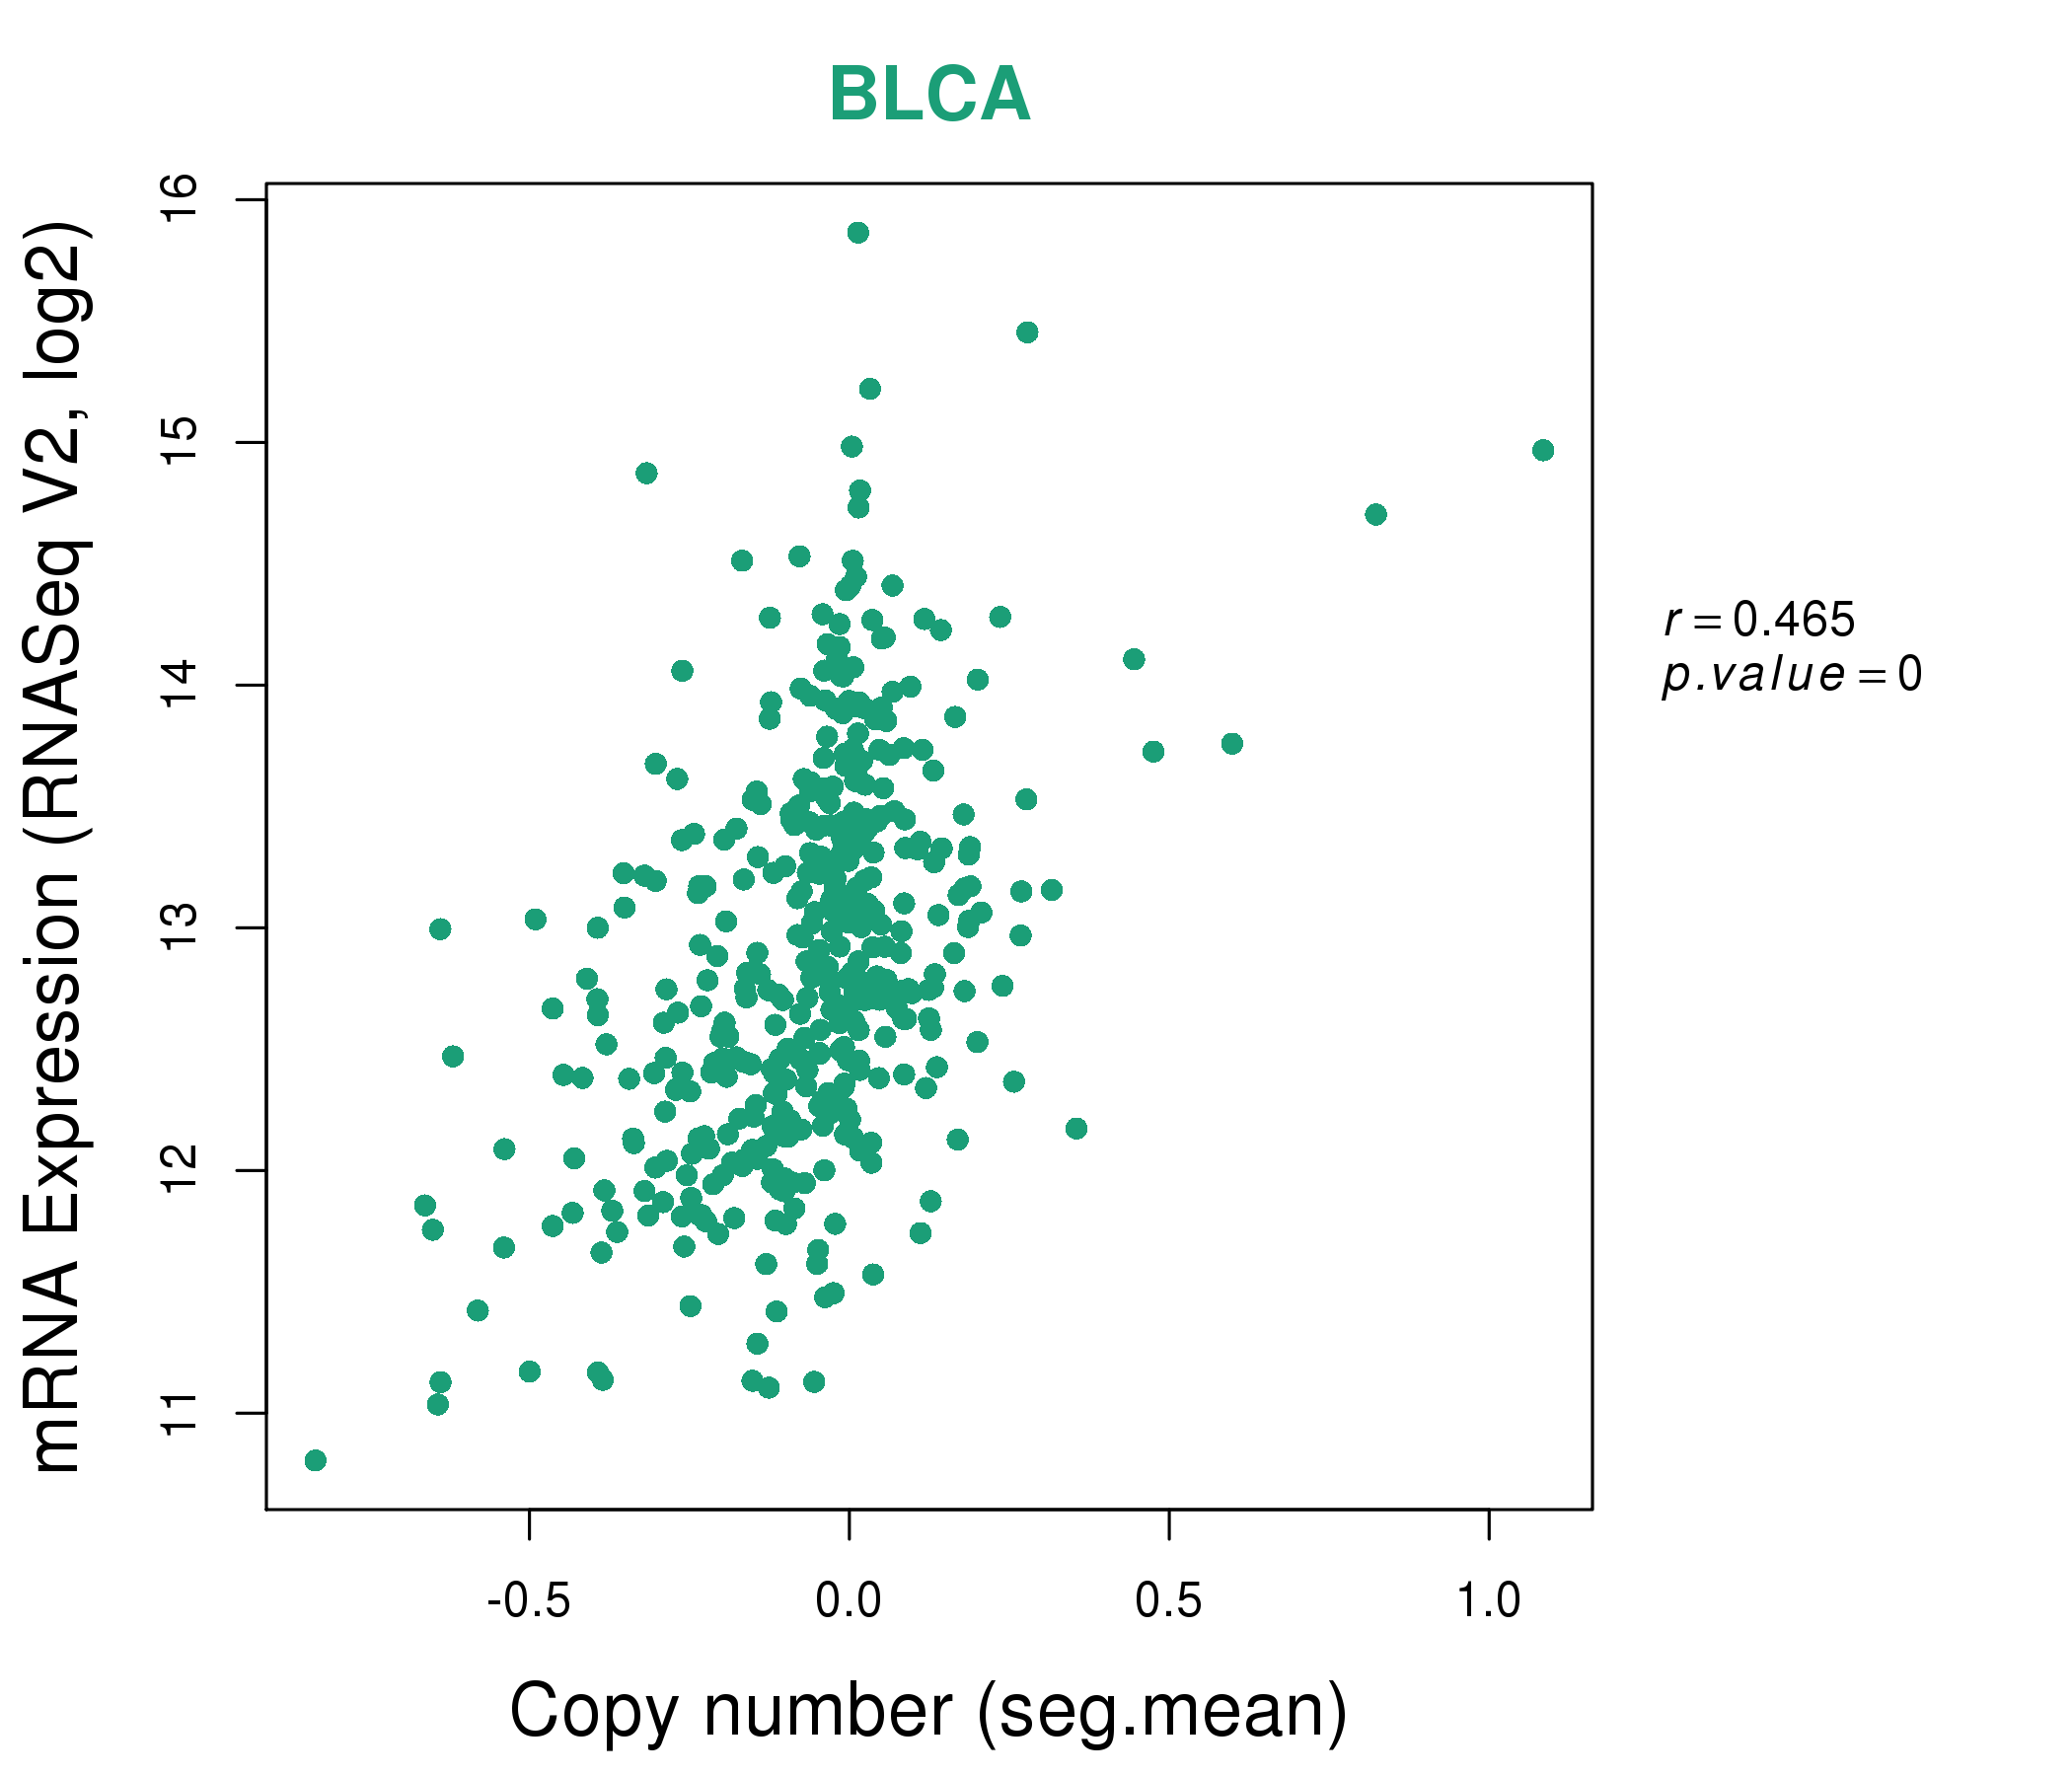
| * This plots show the correlation between CNV and gene expression. |
: Open all plots for all cancer types
 |
|
 |
|

| Top |
| Gene-Gene Network Information |
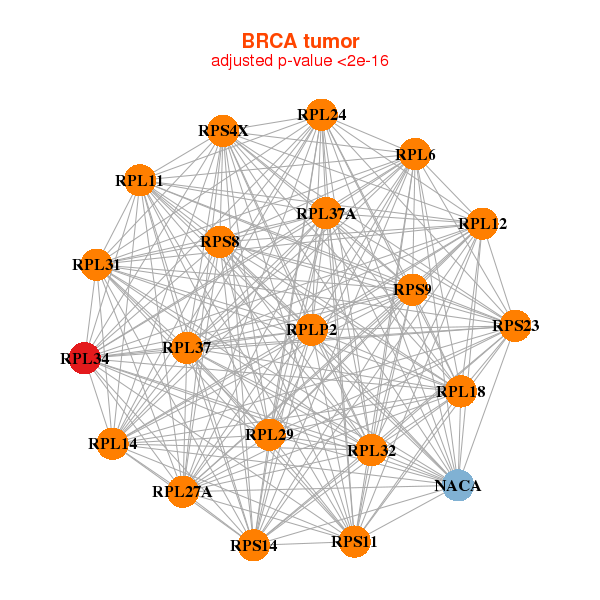
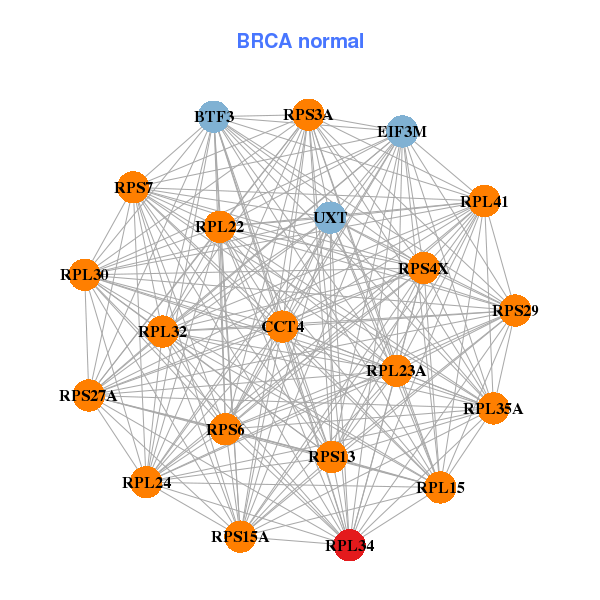
| * Co-Expression network figures were drawn using R package igraph. Only the top 20 genes with the highest correlations were shown. Red circle: input gene, orange circle: cell metabolism gene, sky circle: other gene |
: Open all plots for all cancer types
 |
|
| NACA,RPL11,RPL12,RPL14,RPL18,RPL24,RPL27A, RPL29,RPL31,RPL32,RPL34,RPL37,RPL37A,RPL6, RPLP2,RPS11,RPS14,RPS23,RPS4X,RPS8,RPS9 | BTF3,CCT4,EIF3M,RPL15,RPL22,RPL23A,RPL24, RPL30,RPL32,RPL34,RPL35A,RPL41,RPS13,RPS15A, RPS27A,RPS29,RPS3A,RPS4X,RPS6,RPS7,UXT |
 |
|
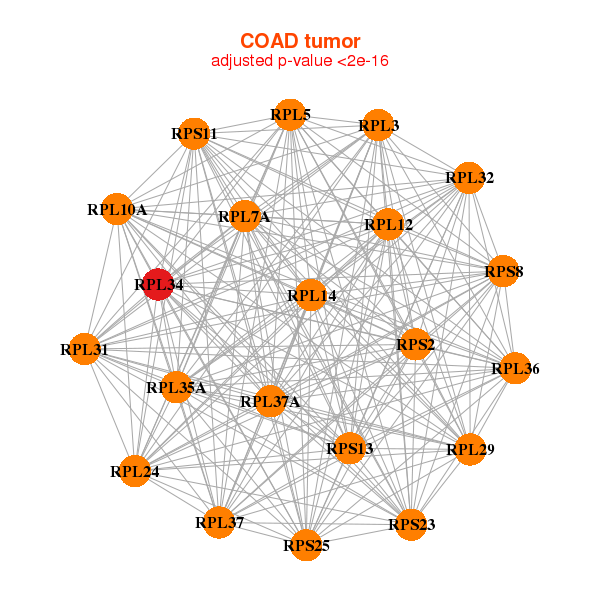
| RPL10A,RPL12,RPL14,RPL24,RPL29,RPL31,RPL32, RPL34,RPL35A,RPL3,RPL36,RPL37,RPL37A,RPL5, RPL7A,RPS11,RPS13,RPS23,RPS25,RPS2,RPS8 | BOD1,DPH5,EEF1A1,EIF3E,RPL15,RPL24,RPL26, RPL34,RPL35A,RPL5,RPS12,RPS13,RPS15A,RPS25, RPS3A,RPS6,RPS8,TATDN1,TIMM9,TMEM182,ZFAND1 |
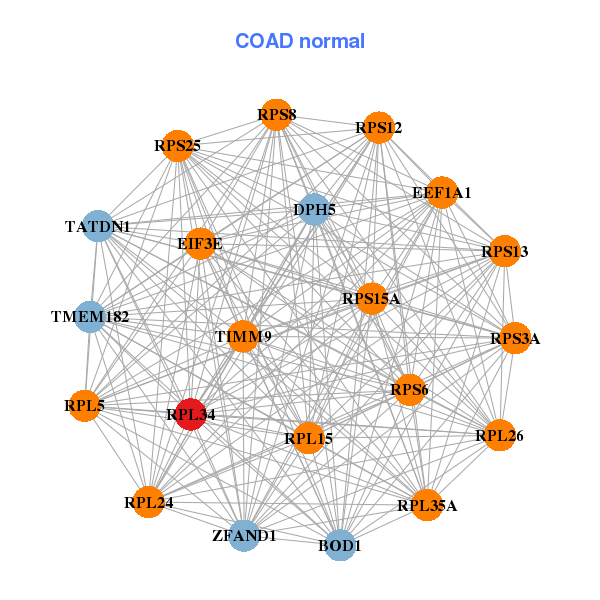
| * Co-Expression network figures were drawn using R package igraph. Only the top 20 genes with the highest correlations were shown. Red circle: input gene, orange circle: cell metabolism gene, sky circle: other gene |
: Open all plots for all cancer types
| Top |
: Open all interacting genes' information including KEGG pathway for all interacting genes from DAVID
| Top |
| Pharmacological Information for RPL34 |
| There's no related Drug. |
| Top |
| Cross referenced IDs for RPL34 |
| * We obtained these cross-references from Uniprot database. It covers 150 different DBs, 18 categories. http://www.uniprot.org/help/cross_references_section |
: Open all cross reference information
|
Copyright © 2016-Present - The Univsersity of Texas Health Science Center at Houston @ |