|
||||||||||||||||||||
| |
| Phenotypic Information (metabolism pathway, cancer, disease, phenome) |
| |
| |
| Gene-Gene Network Information: Co-Expression Network, Interacting Genes & KEGG |
| |
|


| Gene Summary for RPL38 |
| Basic gene info. | Gene symbol | RPL38 |
| Gene name | ribosomal protein L38 | |
| Synonyms | L38 | |
| Cytomap | UCSC genome browser: 17q25.1 | |
| Genomic location | chr17 :72199794-72206019 | |
| Type of gene | protein-coding | |
| RefGenes | NM_000999.3, NM_001035258.1, | |
| Ensembl id | ENSG00000172809 | |
| Description | 60S ribosomal protein L38 | |
| Modification date | 20141207 | |
| dbXrefs | MIM : 604182 | |
| HGNC : HGNC | ||
| Ensembl : ENSG00000172809 | ||
| HPRD : 16048 | ||
| Vega : OTTHUMG00000166016 | ||
| Protein | UniProt: go to UniProt's Cross Reference DB Table | |
| Expression | CleanEX: HS_RPL38 | |
| BioGPS: 6169 | ||
| Gene Expression Atlas: ENSG00000172809 | ||
| The Human Protein Atlas: ENSG00000172809 | ||
| Pathway | NCI Pathway Interaction Database: RPL38 | |
| KEGG: RPL38 | ||
| REACTOME: RPL38 | ||
| ConsensusPathDB | ||
| Pathway Commons: RPL38 | ||
| Metabolism | MetaCyc: RPL38 | |
| HUMANCyc: RPL38 | ||
| Regulation | Ensembl's Regulation: ENSG00000172809 | |
| miRBase: chr17 :72,199,794-72,206,019 | ||
| TargetScan: NM_000999 | ||
| cisRED: ENSG00000172809 | ||
| Context | iHOP: RPL38 | |
| cancer metabolism search in PubMed: RPL38 | ||
| UCL Cancer Institute: RPL38 | ||
| Assigned class in ccmGDB | C | |
| Top |
| Phenotypic Information for RPL38(metabolism pathway, cancer, disease, phenome) |
| Cancer | CGAP: RPL38 |
| Familial Cancer Database: RPL38 | |
| * This gene is included in those cancer gene databases. |
|
|
|
|
|
| . | ||||||||||||||
Oncogene 1 | Significant driver gene in | |||||||||||||||||||
| cf) number; DB name 1 Oncogene; http://nar.oxfordjournals.org/content/35/suppl_1/D721.long, 2 Tumor Suppressor gene; https://bioinfo.uth.edu/TSGene/, 3 Cancer Gene Census; http://www.nature.com/nrc/journal/v4/n3/abs/nrc1299.html, 4 CancerGenes; http://nar.oxfordjournals.org/content/35/suppl_1/D721.long, 5 Network of Cancer Gene; http://ncg.kcl.ac.uk/index.php, 1Therapeutic Vulnerabilities in Cancer; http://cbio.mskcc.org/cancergenomics/statius/ |
| REACTOME_METABOLISM_OF_PROTEINS REACTOME_METABOLISM_OF_MRNA REACTOME_METABOLISM_OF_RNA | |
| OMIM | |
| Orphanet | |
| Disease | KEGG Disease: RPL38 |
| MedGen: RPL38 (Human Medical Genetics with Condition) | |
| ClinVar: RPL38 | |
| Phenotype | MGI: RPL38 (International Mouse Phenotyping Consortium) |
| PhenomicDB: RPL38 | |
| Mutations for RPL38 |
| * Under tables are showing count per each tissue to give us broad intuition about tissue specific mutation patterns.You can go to the detailed page for each mutation database's web site. |
| There's no structural variation information in COSMIC data for this gene. |
| * From mRNA Sanger sequences, Chitars2.0 arranged chimeric transcripts. This table shows RPL38 related fusion information. |
| ID | Head Gene | Tail Gene | Accession | Gene_a | qStart_a | qEnd_a | Chromosome_a | tStart_a | tEnd_a | Gene_a | qStart_a | qEnd_a | Chromosome_a | tStart_a | tEnd_a |
| CK004088 | NDRG2 | 3 | 462 | 14 | 21486161 | 21488735 | RPL38 | 448 | 599 | 17 | 72200288 | 72205435 | |
| BX101889 | TEK | 1 | 623 | 9 | 27173224 | 27190586 | RPL38 | 617 | 743 | 17 | 72205325 | 72205450 | |
| BE388615 | RPL38 | 1 | 291 | 17 | 72200056 | 72206007 | CITED1 | 292 | 494 | X | 71526489 | 71526691 | |
| BE409397 | RPL38 | 1 | 291 | 17 | 72200056 | 72206007 | CITED1 | 292 | 664 | X | 71525968 | 71526691 | |
| R50162 | RPL38 | 1 | 205 | 17 | 72205325 | 72206054 | TEK | 199 | 333 | 9 | 27185554 | 27190586 | |
| AK075017 | UBE2J2 | 2 | 1674 | 1 | 1189857 | 1209212 | RPL38 | 1672 | 1747 | 17 | 72205942 | 72206017 | |
| AV742653 | PRR13 | 43 | 172 | 12 | 53836482 | 53837268 | RPL38 | 163 | 508 | 17 | 72199826 | 72206015 | |
| BE391347 | RPL38 | 19 | 300 | 17 | 72200067 | 72206007 | CITED1 | 301 | 555 | X | 71526441 | 71526691 | |
| BE797621 | RPL38 | 23 | 527 | 17 | 72199843 | 72206008 | DONSON | 521 | 837 | 21 | 35276247 | 35281514 | |
| CA313275 | MNT | 18 | 159 | 17 | 2287367 | 2287508 | RPL38 | 152 | 496 | 17 | 72199818 | 72205995 | |
| BP222381 | RPL38 | 1 | 274 | 17 | 72199811 | 72205423 | PHF20 | 269 | 581 | 20 | 34359946 | 34450996 | |
| BF696633 | RPL38 | 2 | 45 | 17 | 72199843 | 72199886 | SNX3 | 43 | 614 | 6 | 108532890 | 108533458 | |
| CD368190 | RPL38 | 17 | 208 | 17 | 72205334 | 72206019 | RPL3 | 203 | 697 | 22 | 39710181 | 39712824 | |
| CA432338 | RPL38 | 17 | 69 | 17 | 72205967 | 72206019 | TRMT5 | 61 | 743 | 14 | 61442204 | 61444273 | |
| BI861689 | SUPT7L | 1 | 446 | 2 | 27876379 | 27878441 | RPL38 | 440 | 521 | 17 | 72200077 | 72200329 | |
| DA794650 | RPL38 | 1 | 295 | 17 | 72199817 | 72205450 | HSP90AA1 | 296 | 501 | 14 | 102552631 | 102553443 | |
| BM968470 | RPL38 | 17 | 63 | 17 | 72205973 | 72206019 | RPL38 | 59 | 258 | 17 | 72205326 | 72206019 | |
| AA034452 | PXN | 1 | 127 | 12 | 120655334 | 120655460 | RPL38 | 116 | 246 | 17 | 72205394 | 72206019 | |
| AA017134 | RPL38 | 2 | 54 | 17 | 72205967 | 72206019 | DST | 49 | 328 | 6 | 56328425 | 56330941 | |
| CR746137 | SURF6 | 19 | 248 | 9 | 136199133 | 136199561 | RPL38 | 233 | 599 | 17 | 72199817 | 72206016 | |
| BM810069 | RPL38 | 33 | 437 | 17 | 72199954 | 72206019 | NCAPH2 | 438 | 961 | 22 | 50962352 | 50962869 | |
| DB371044 | RPL38 | 1 | 76 | 17 | 72205942 | 72206017 | UBE2J2 | 74 | 504 | 1 | 1189857 | 1190295 | |
| AA977713 | RPL38 | 22 | 77 | 17 | 72205963 | 72206019 | TRAPPC6B | 64 | 423 | 14 | 39619329 | 39619688 | |
| BC046153 | PMS2P3 | 13 | 942 | 7 | 75144011 | 75157428 | RPL38 | 932 | 1003 | 17 | 72205948 | 72206019 | |
| Top |
| There's no copy number variation information in COSMIC data for this gene. |
| Top |
|
 |
| Top |
| Stat. for Non-Synonymous SNVs (# total SNVs=1) | (# total SNVs=3) |
 |  |
(# total SNVs=0) | (# total SNVs=0) |
| Top |
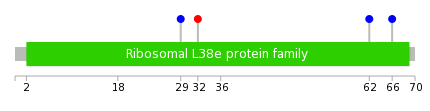
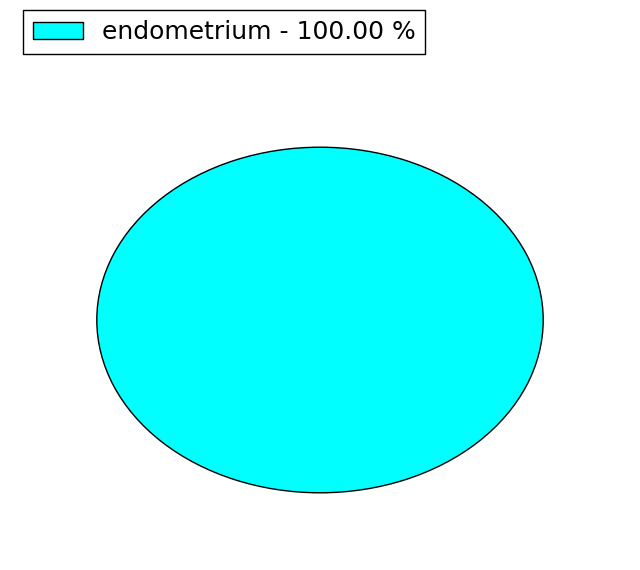
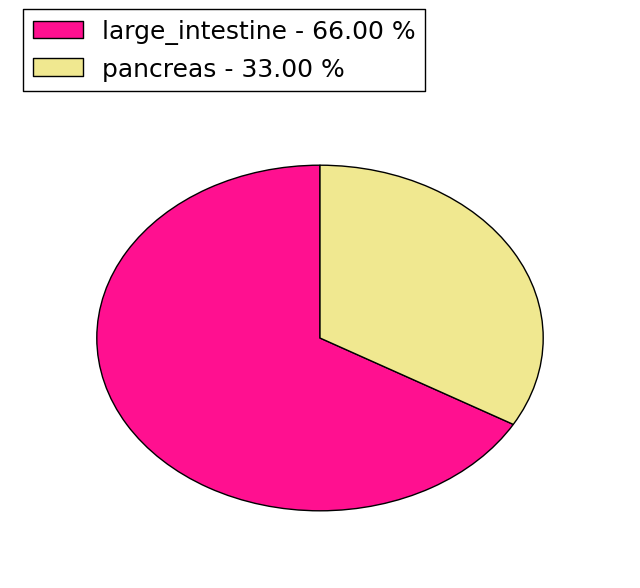
| * When you move the cursor on each content, you can see more deailed mutation information on the Tooltip. Those are primary_site,primary_histology,mutation(aa),pubmedID. |
| GRCh37 position | Mutation(aa) | Unique sampleID count |
| chr17:72205348-72205348 | p.K29K | 1 |
| chr17:72205355-72205355 | p.V32M | 1 |
| chr17:72205370-72205370 | p.R37* | 1 |
| chr17:72205441-72205442 | p.G63fs*>9 | 1 |
| chr17:72205447-72205447 | p.P62P | 1 |
| chr17:72205953-72205953 | p.V66V | 1 |
| Top |
|
 |
| Point Mutation/ Tissue ID | 1 | 2 | 3 | 4 | 5 | 6 | 7 | 8 | 9 | 10 | 11 | 12 | 13 | 14 | 15 | 16 | 17 | 18 | 19 | 20 |
| # sample | 2 | 1 | ||||||||||||||||||
| # mutation | 2 | 1 | ||||||||||||||||||
| nonsynonymous SNV | 1 | |||||||||||||||||||
| synonymous SNV | 2 |
| cf) Tissue ID; Tissue type (1; BLCA[Bladder Urothelial Carcinoma], 2; BRCA[Breast invasive carcinoma], 3; CESC[Cervical squamous cell carcinoma and endocervical adenocarcinoma], 4; COAD[Colon adenocarcinoma], 5; GBM[Glioblastoma multiforme], 6; Glioma Low Grade, 7; HNSC[Head and Neck squamous cell carcinoma], 8; KICH[Kidney Chromophobe], 9; KIRC[Kidney renal clear cell carcinoma], 10; KIRP[Kidney renal papillary cell carcinoma], 11; LAML[Acute Myeloid Leukemia], 12; LUAD[Lung adenocarcinoma], 13; LUSC[Lung squamous cell carcinoma], 14; OV[Ovarian serous cystadenocarcinoma ], 15; PAAD[Pancreatic adenocarcinoma], 16; PRAD[Prostate adenocarcinoma], 17; SKCM[Skin Cutaneous Melanoma], 18:STAD[Stomach adenocarcinoma], 19:THCA[Thyroid carcinoma], 20:UCEC[Uterine Corpus Endometrial Carcinoma]) |
| Top |
| * We represented just top 10 SNVs. When you move the cursor on each content, you can see more deailed mutation information on the Tooltip. Those are primary_site, primary_histology, mutation(aa), pubmedID. |
| Genomic Position | Mutation(aa) | Unique sampleID count |
| chr17:72205348 | p.K29K,RPL38 | 1 |
| chr17:72205355 | p.V32M,RPL38 | 1 |
| chr17:72205953 | p.V66V,RPL38 | 1 |
| * Copy number data were extracted from TCGA using R package TCGA-Assembler. The URLs of all public data files on TCGA DCC data server were gathered on Jan-05-2015. Function ProcessCNAData in TCGA-Assembler package was used to obtain gene-level copy number value which is calculated as the average copy number of the genomic region of a gene. |
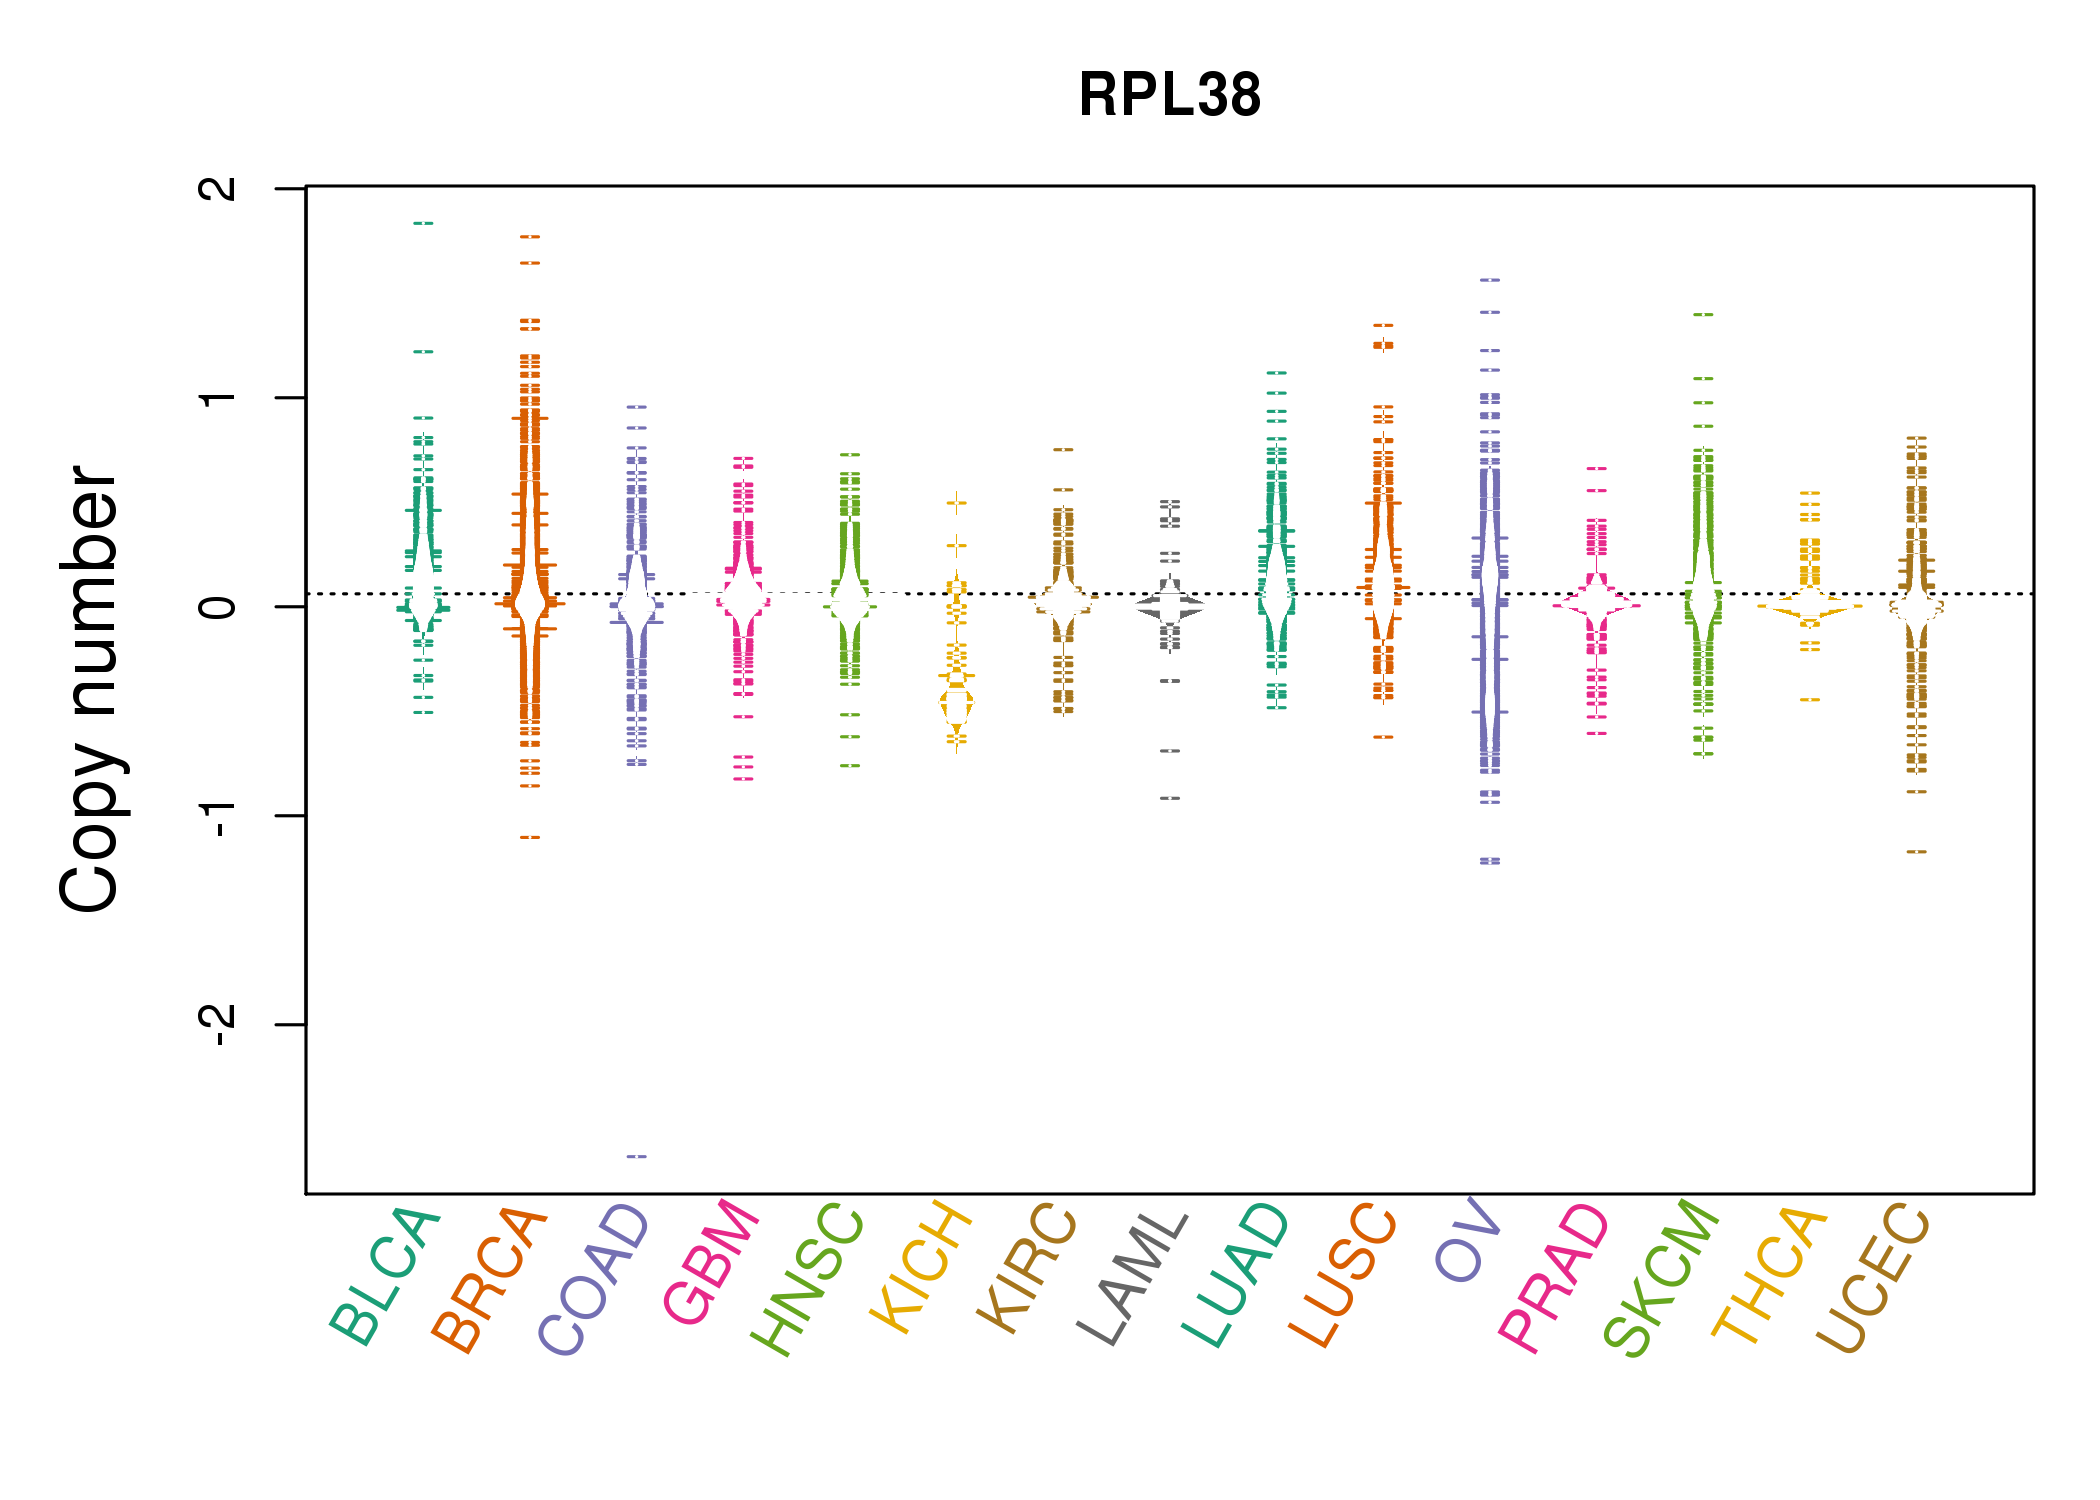 |
| cf) Tissue ID[Tissue type]: BLCA[Bladder Urothelial Carcinoma], BRCA[Breast invasive carcinoma], CESC[Cervical squamous cell carcinoma and endocervical adenocarcinoma], COAD[Colon adenocarcinoma], GBM[Glioblastoma multiforme], Glioma Low Grade, HNSC[Head and Neck squamous cell carcinoma], KICH[Kidney Chromophobe], KIRC[Kidney renal clear cell carcinoma], KIRP[Kidney renal papillary cell carcinoma], LAML[Acute Myeloid Leukemia], LUAD[Lung adenocarcinoma], LUSC[Lung squamous cell carcinoma], OV[Ovarian serous cystadenocarcinoma ], PAAD[Pancreatic adenocarcinoma], PRAD[Prostate adenocarcinoma], SKCM[Skin Cutaneous Melanoma], STAD[Stomach adenocarcinoma], THCA[Thyroid carcinoma], UCEC[Uterine Corpus Endometrial Carcinoma] |
| Top |
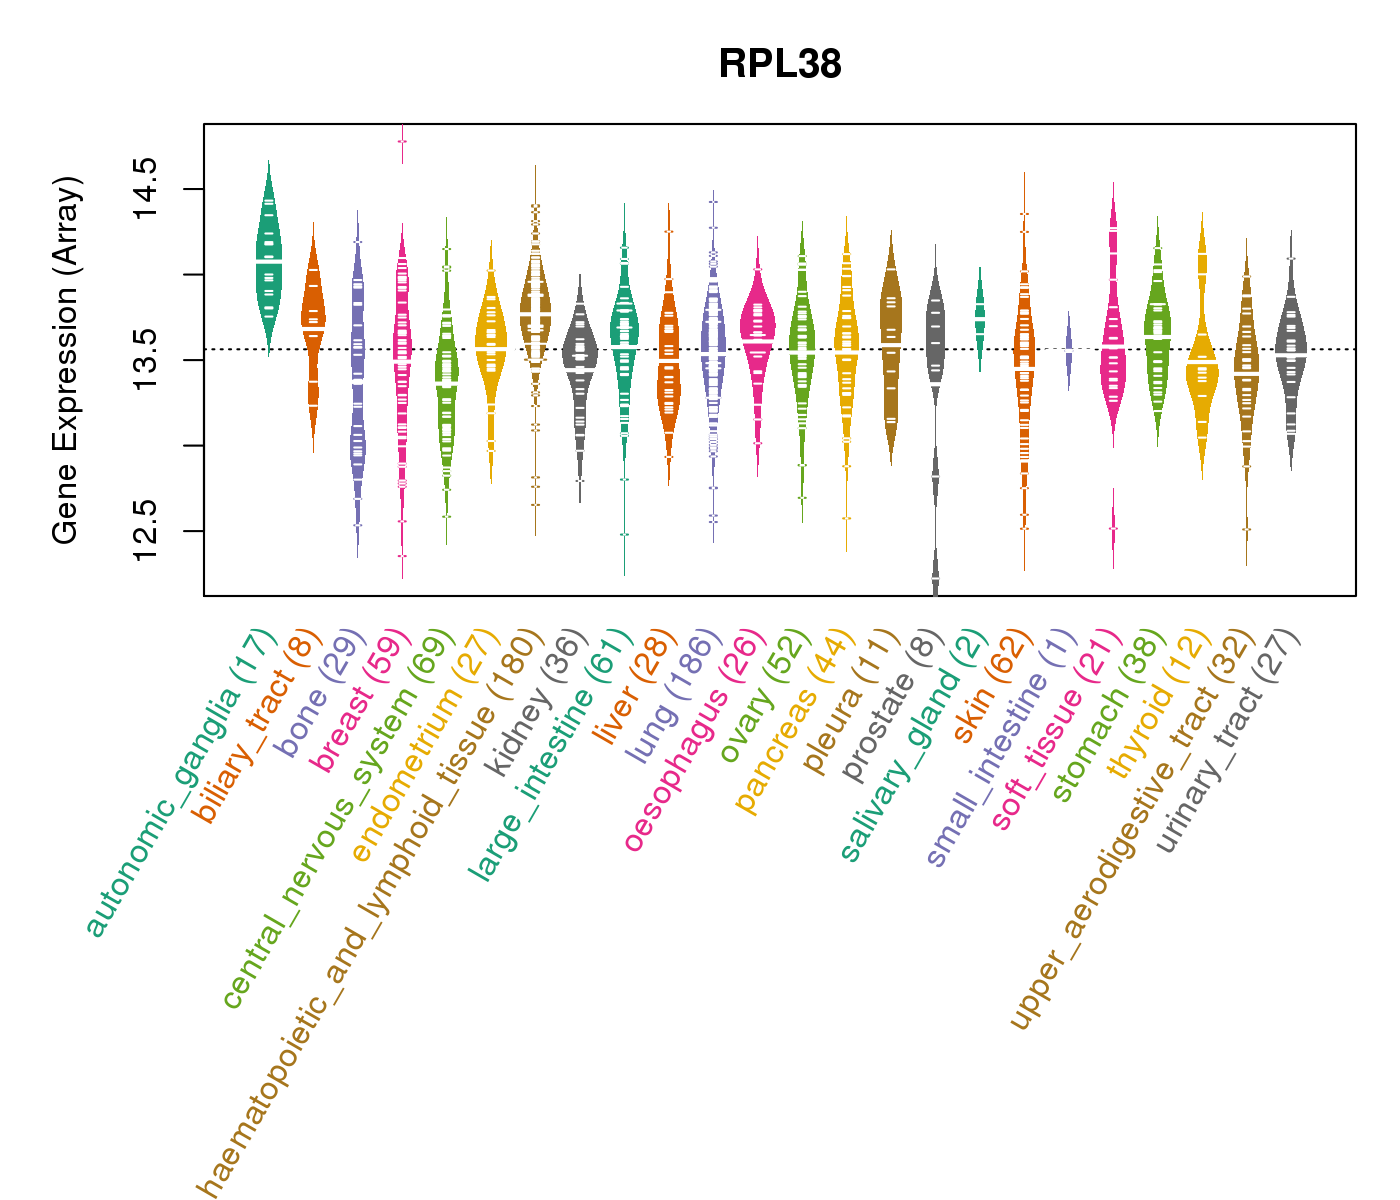
| Gene Expression for RPL38 |
| * CCLE gene expression data were extracted from CCLE_Expression_Entrez_2012-10-18.res: Gene-centric RMA-normalized mRNA expression data. |
 |
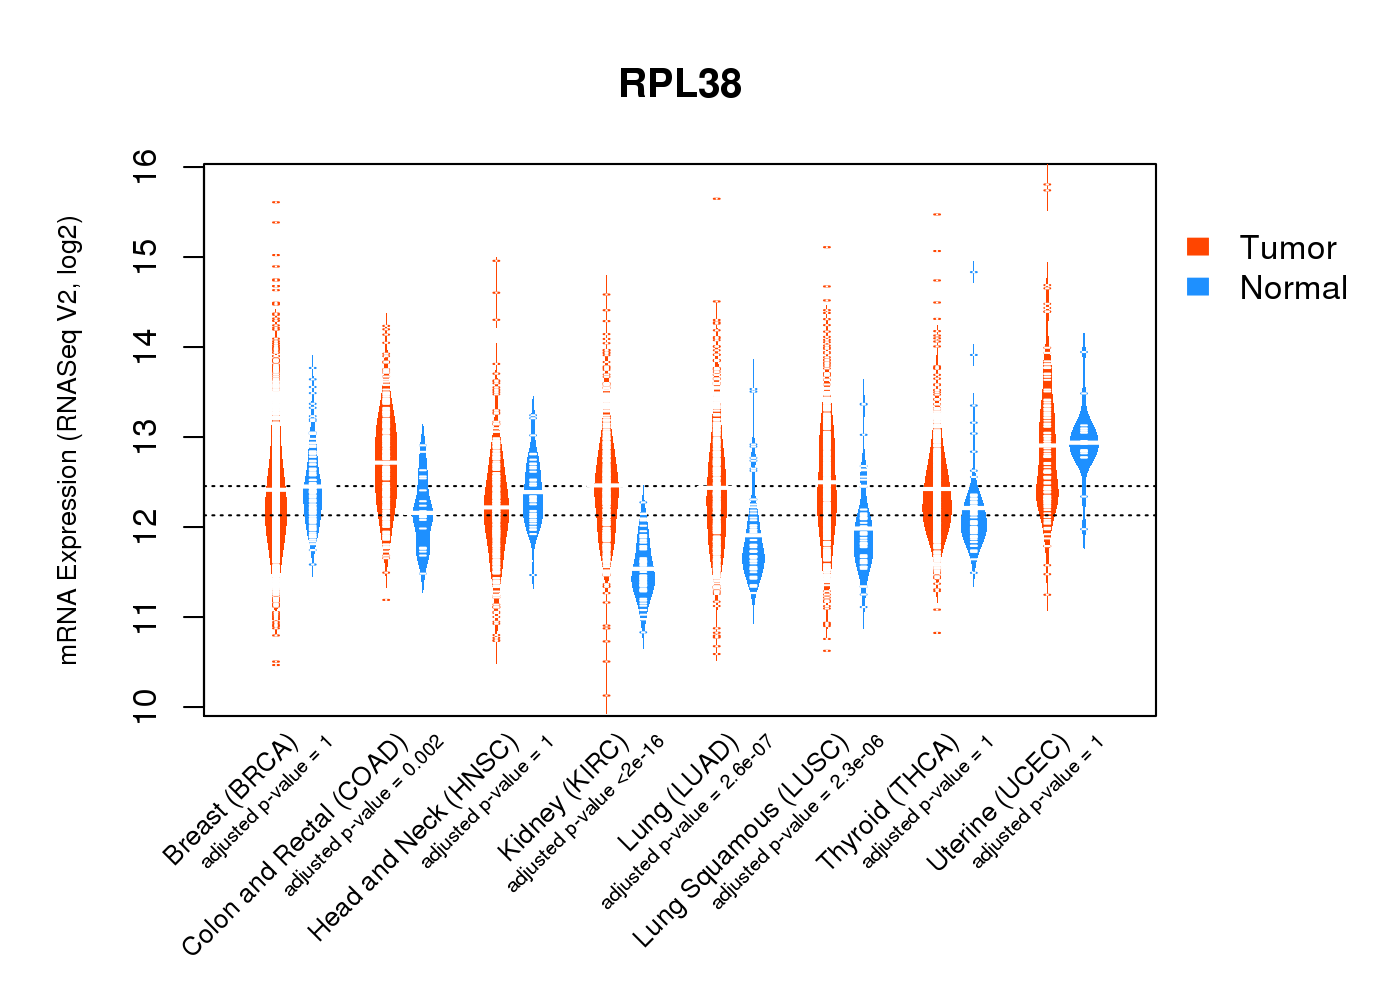
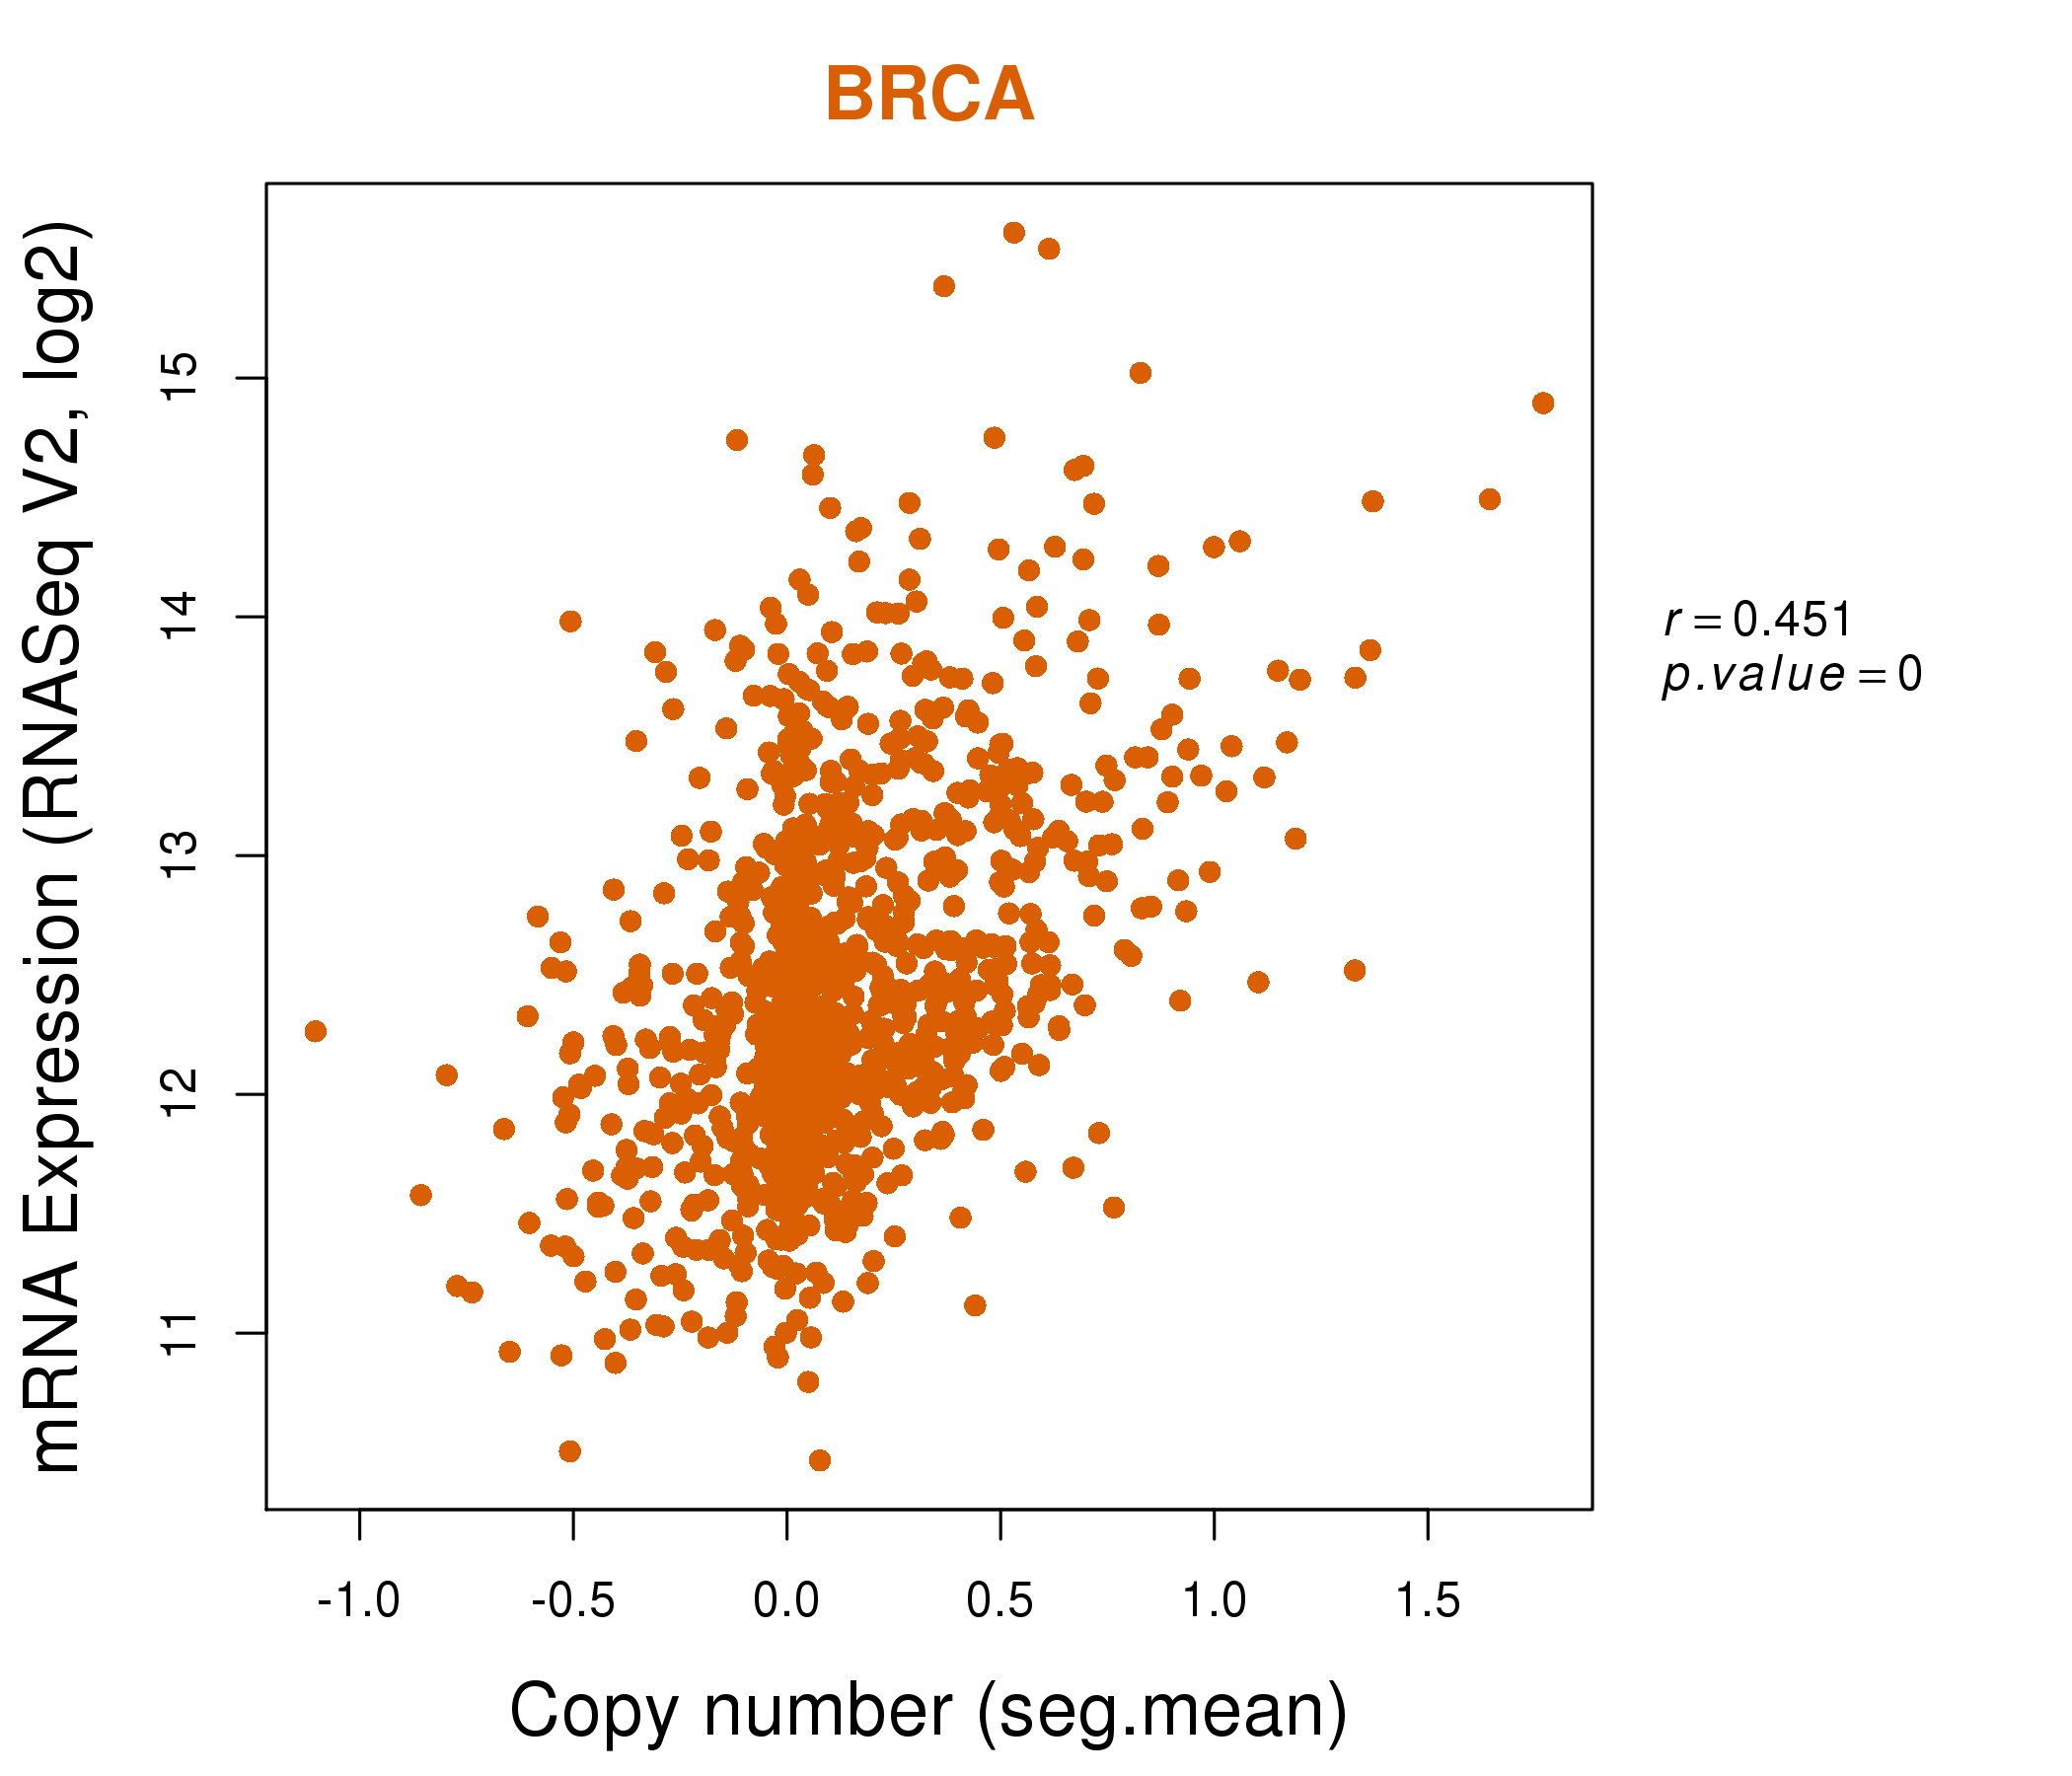
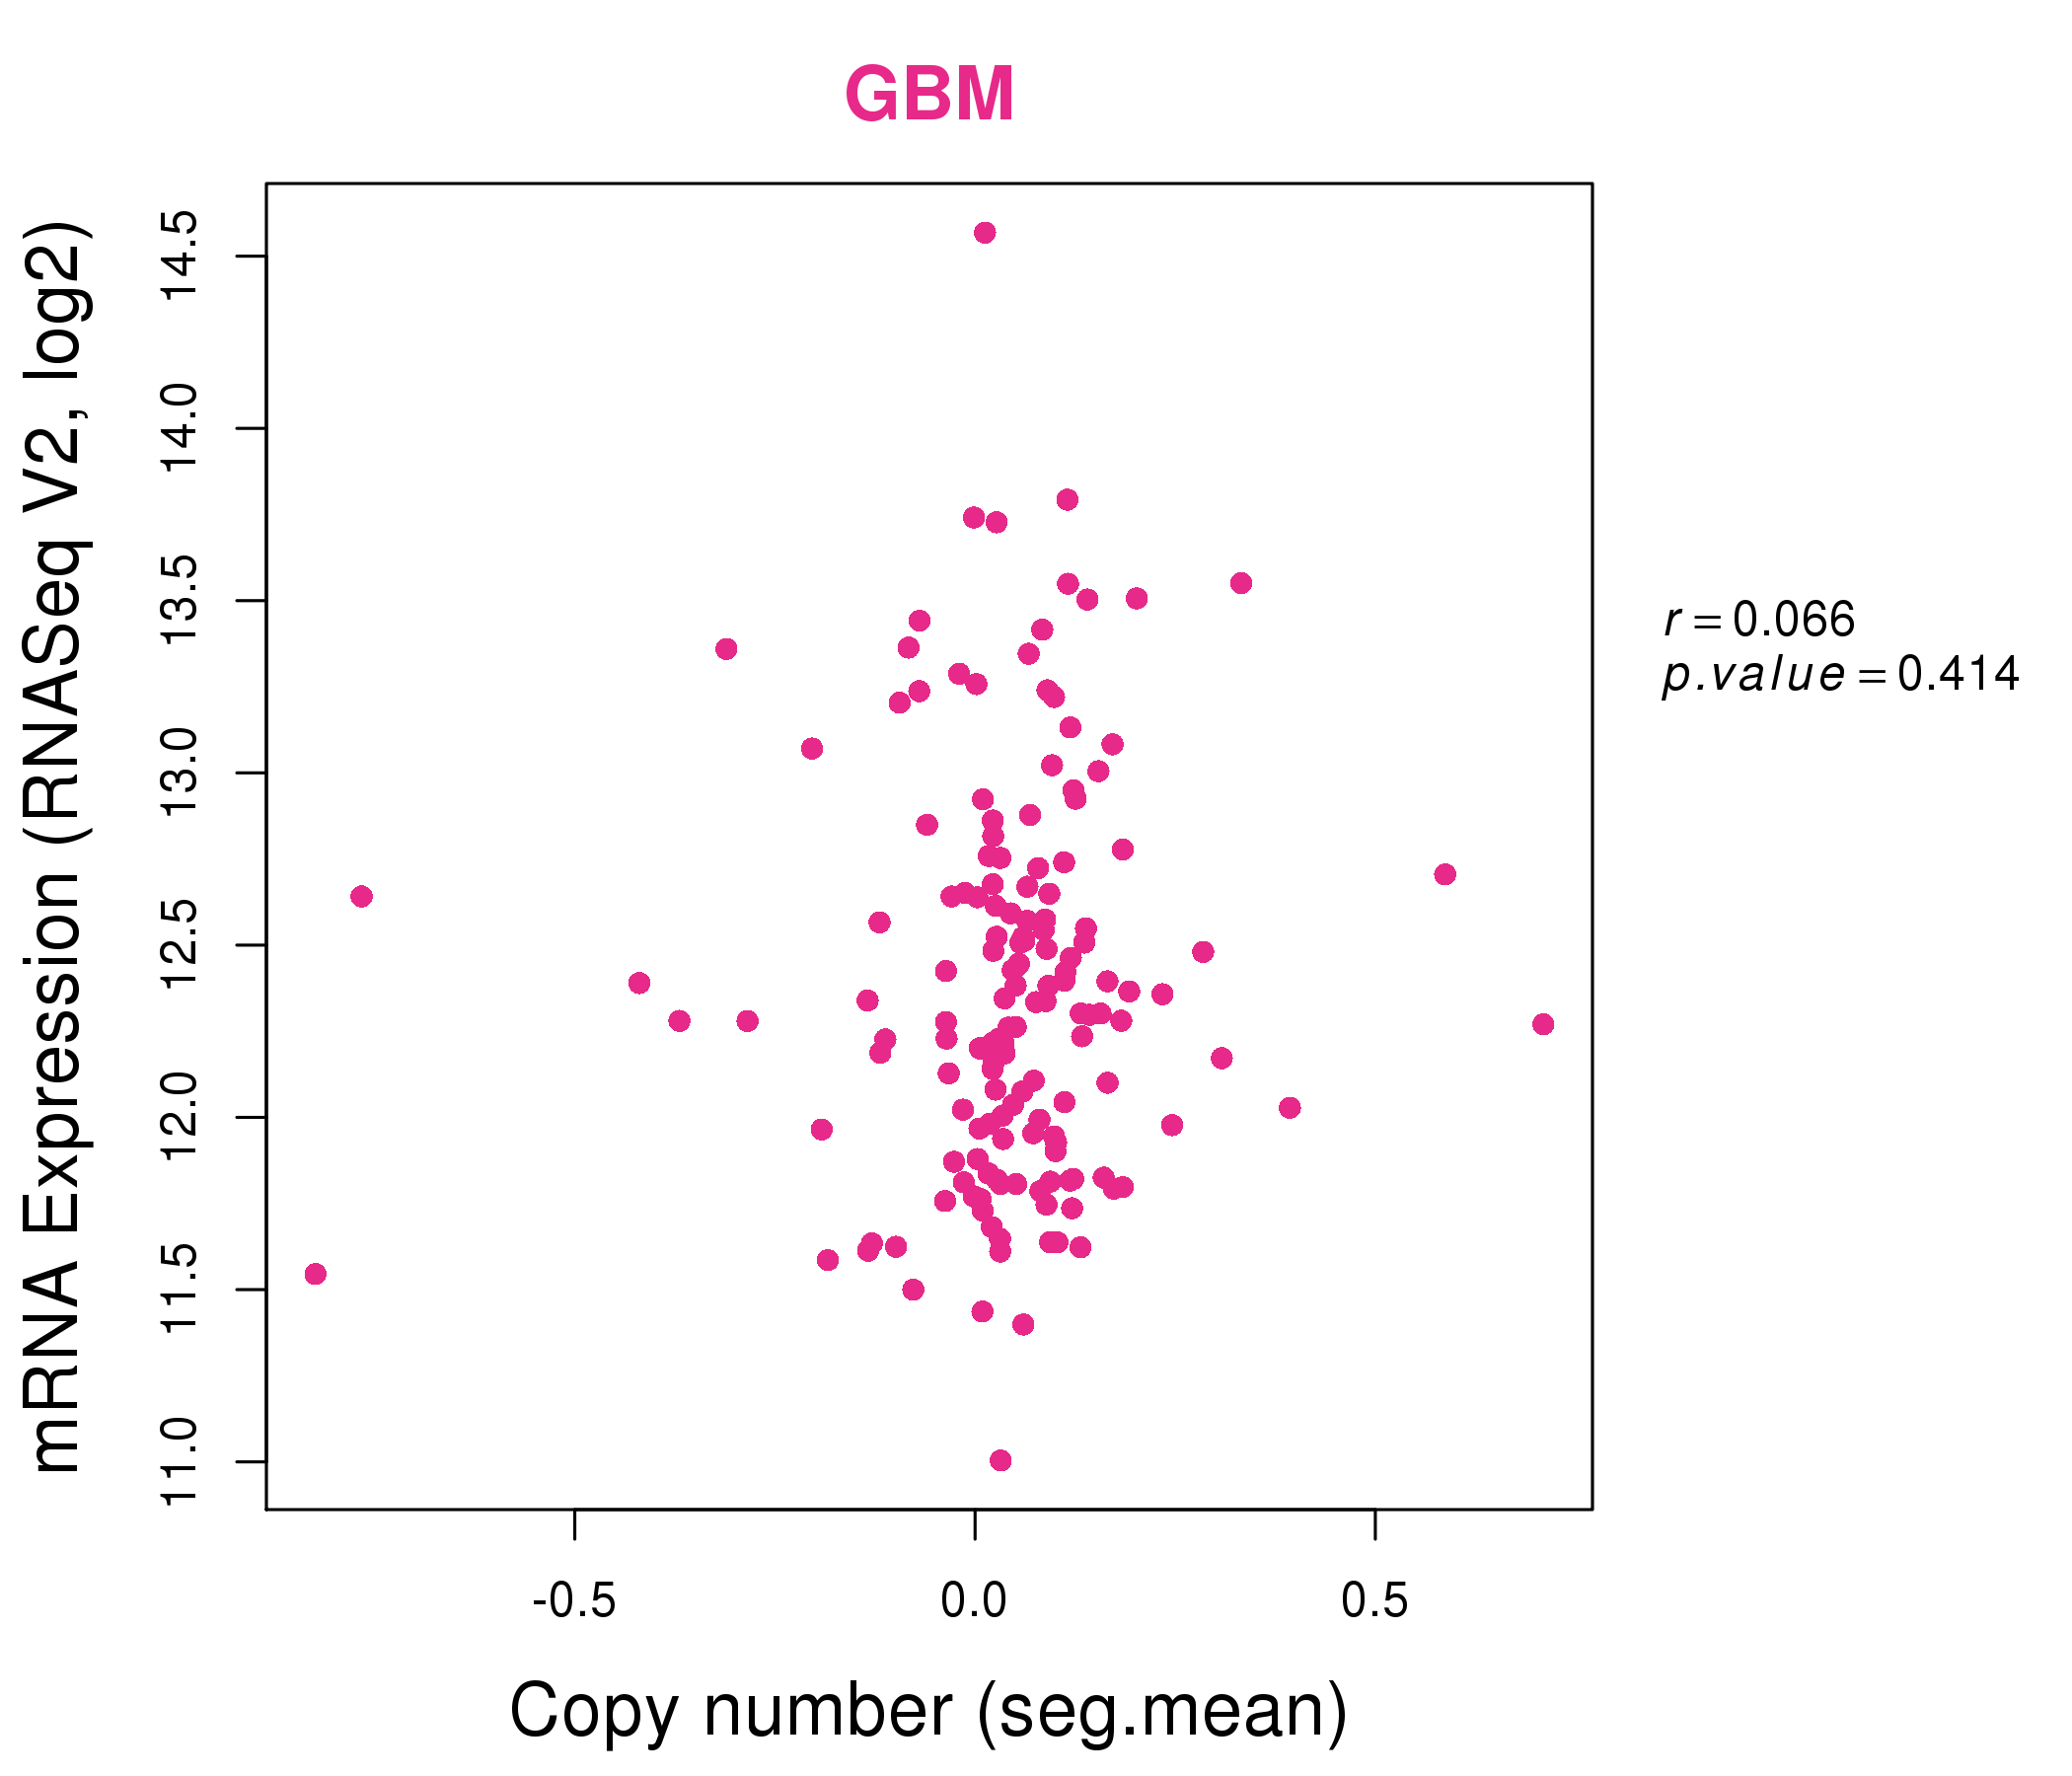
| * Normalized gene expression data of RNASeqV2 was extracted from TCGA using R package TCGA-Assembler. The URLs of all public data files on TCGA DCC data server were gathered at Jan-05-2015. Only eight cancer types have enough normal control samples for differential expression analysis. (t test, adjusted p<0.05 (using Benjamini-Hochberg FDR)) |
 |
| Top |
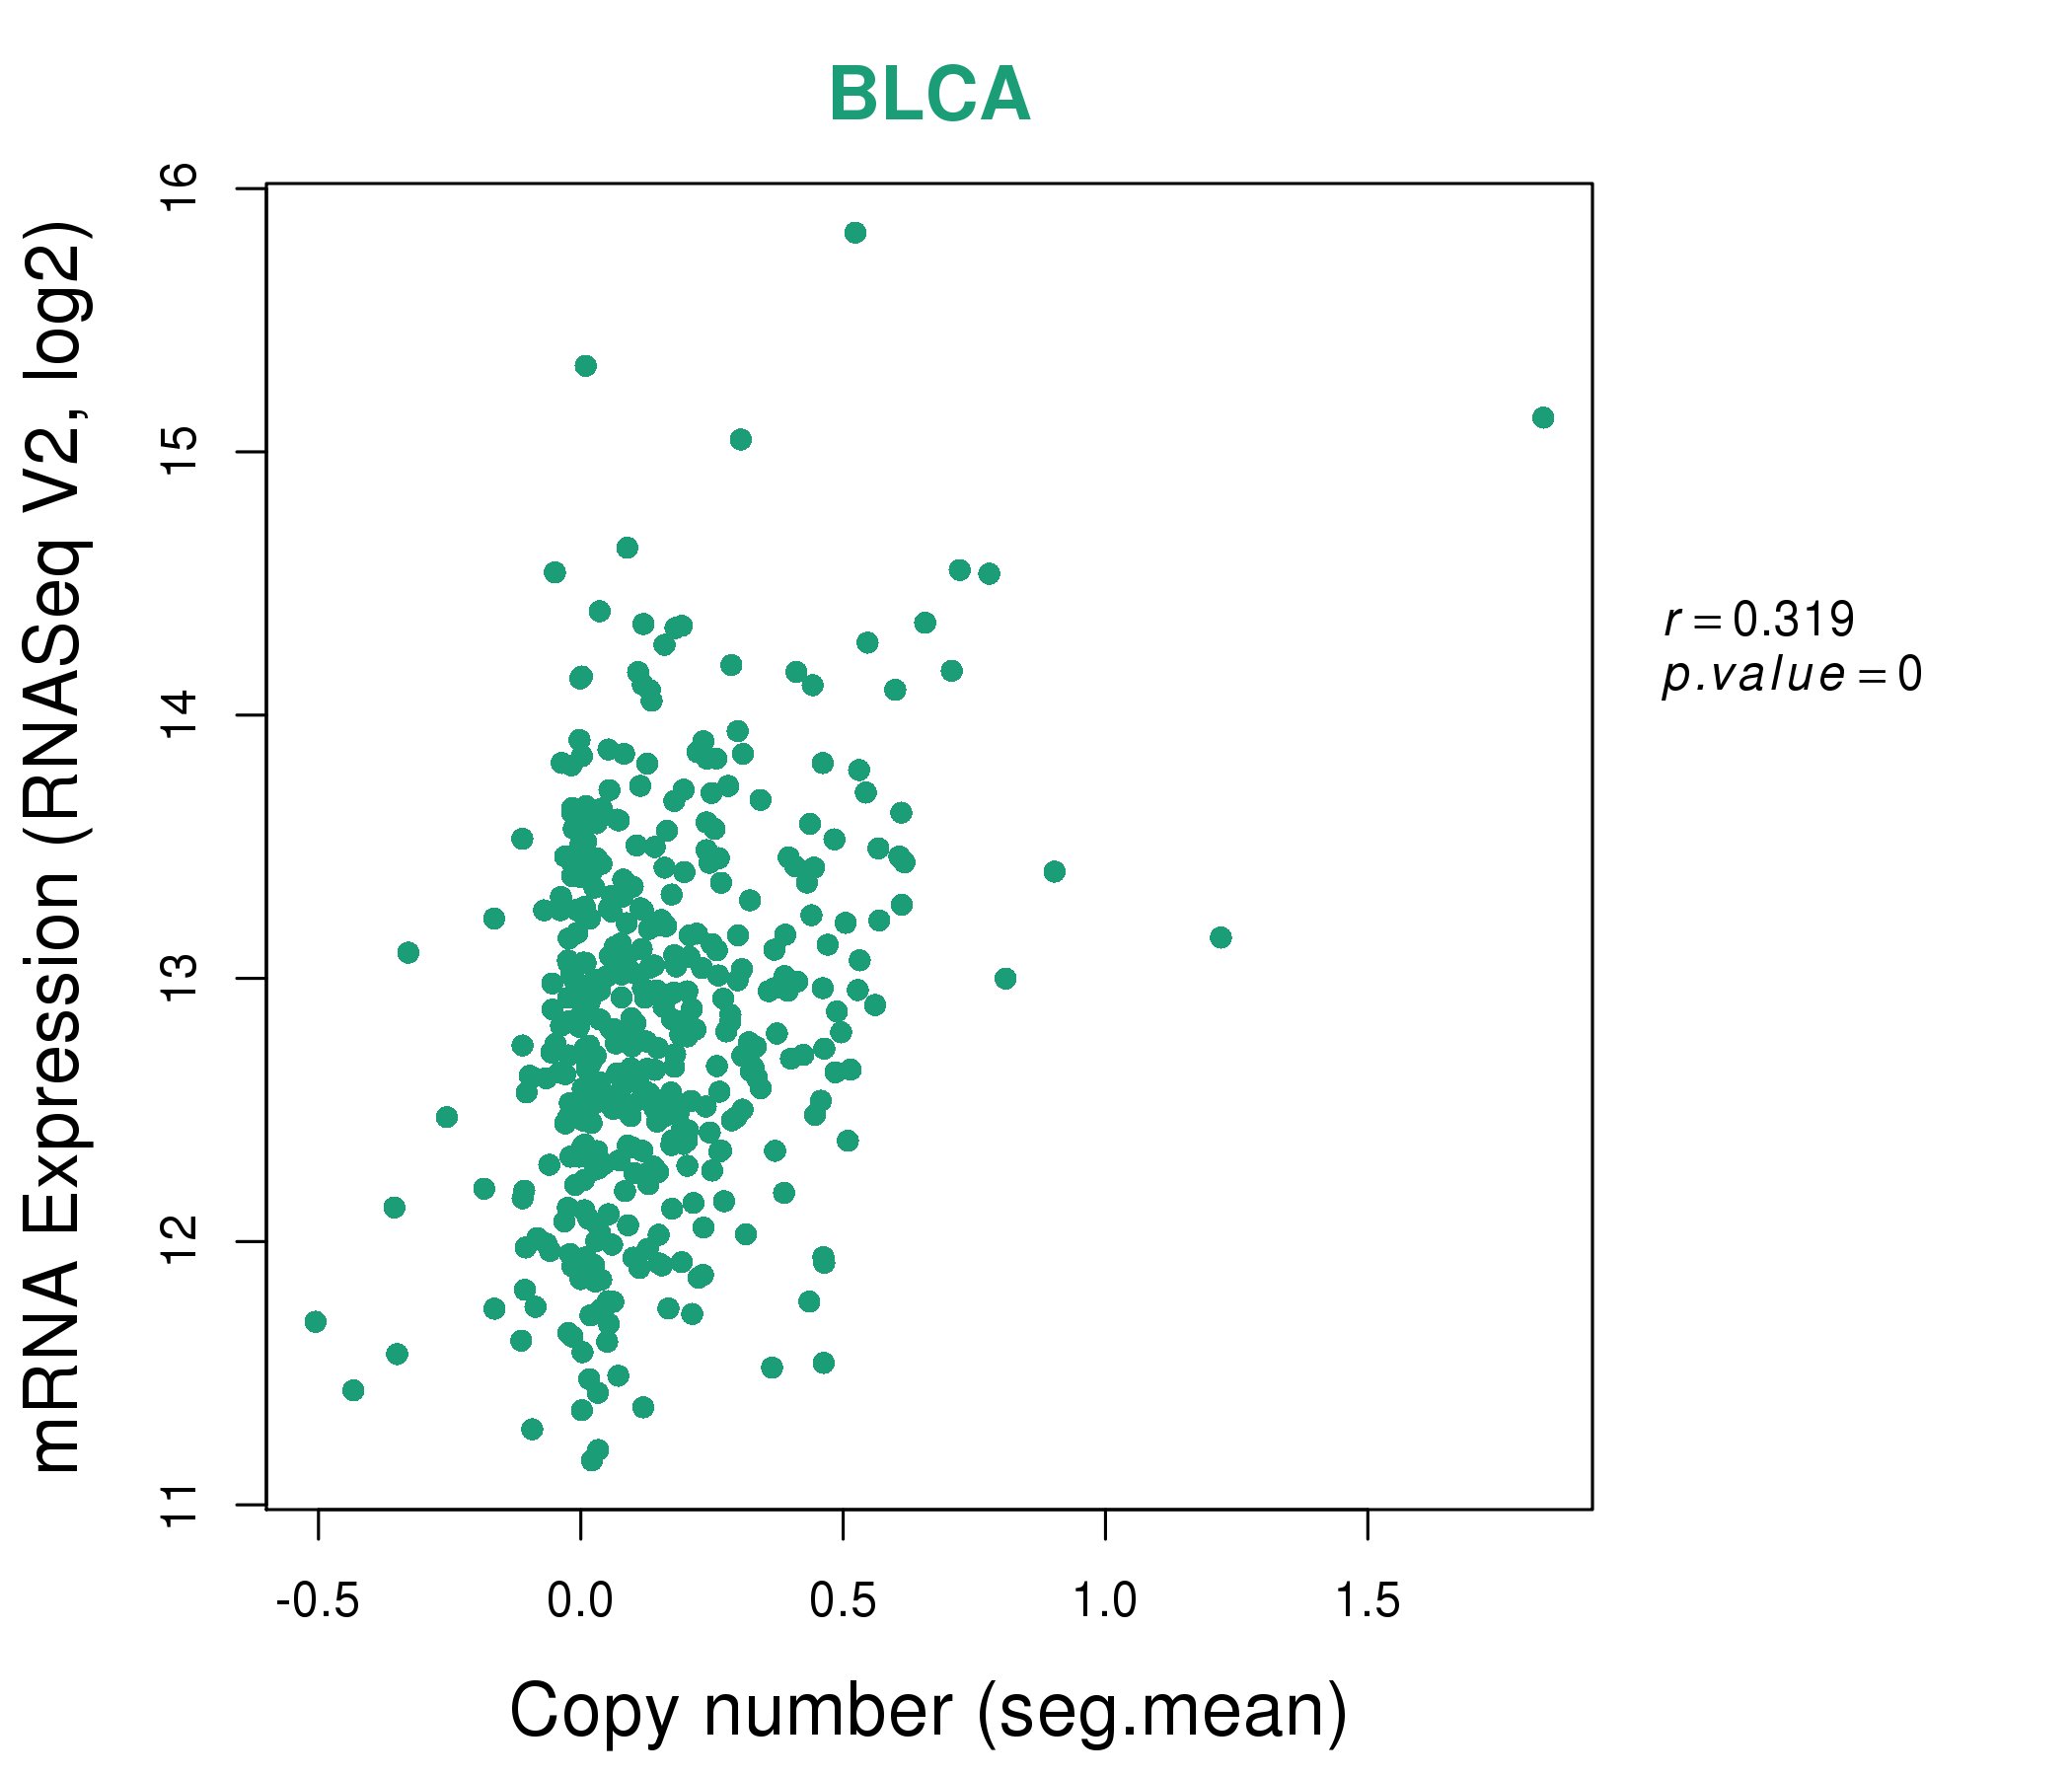
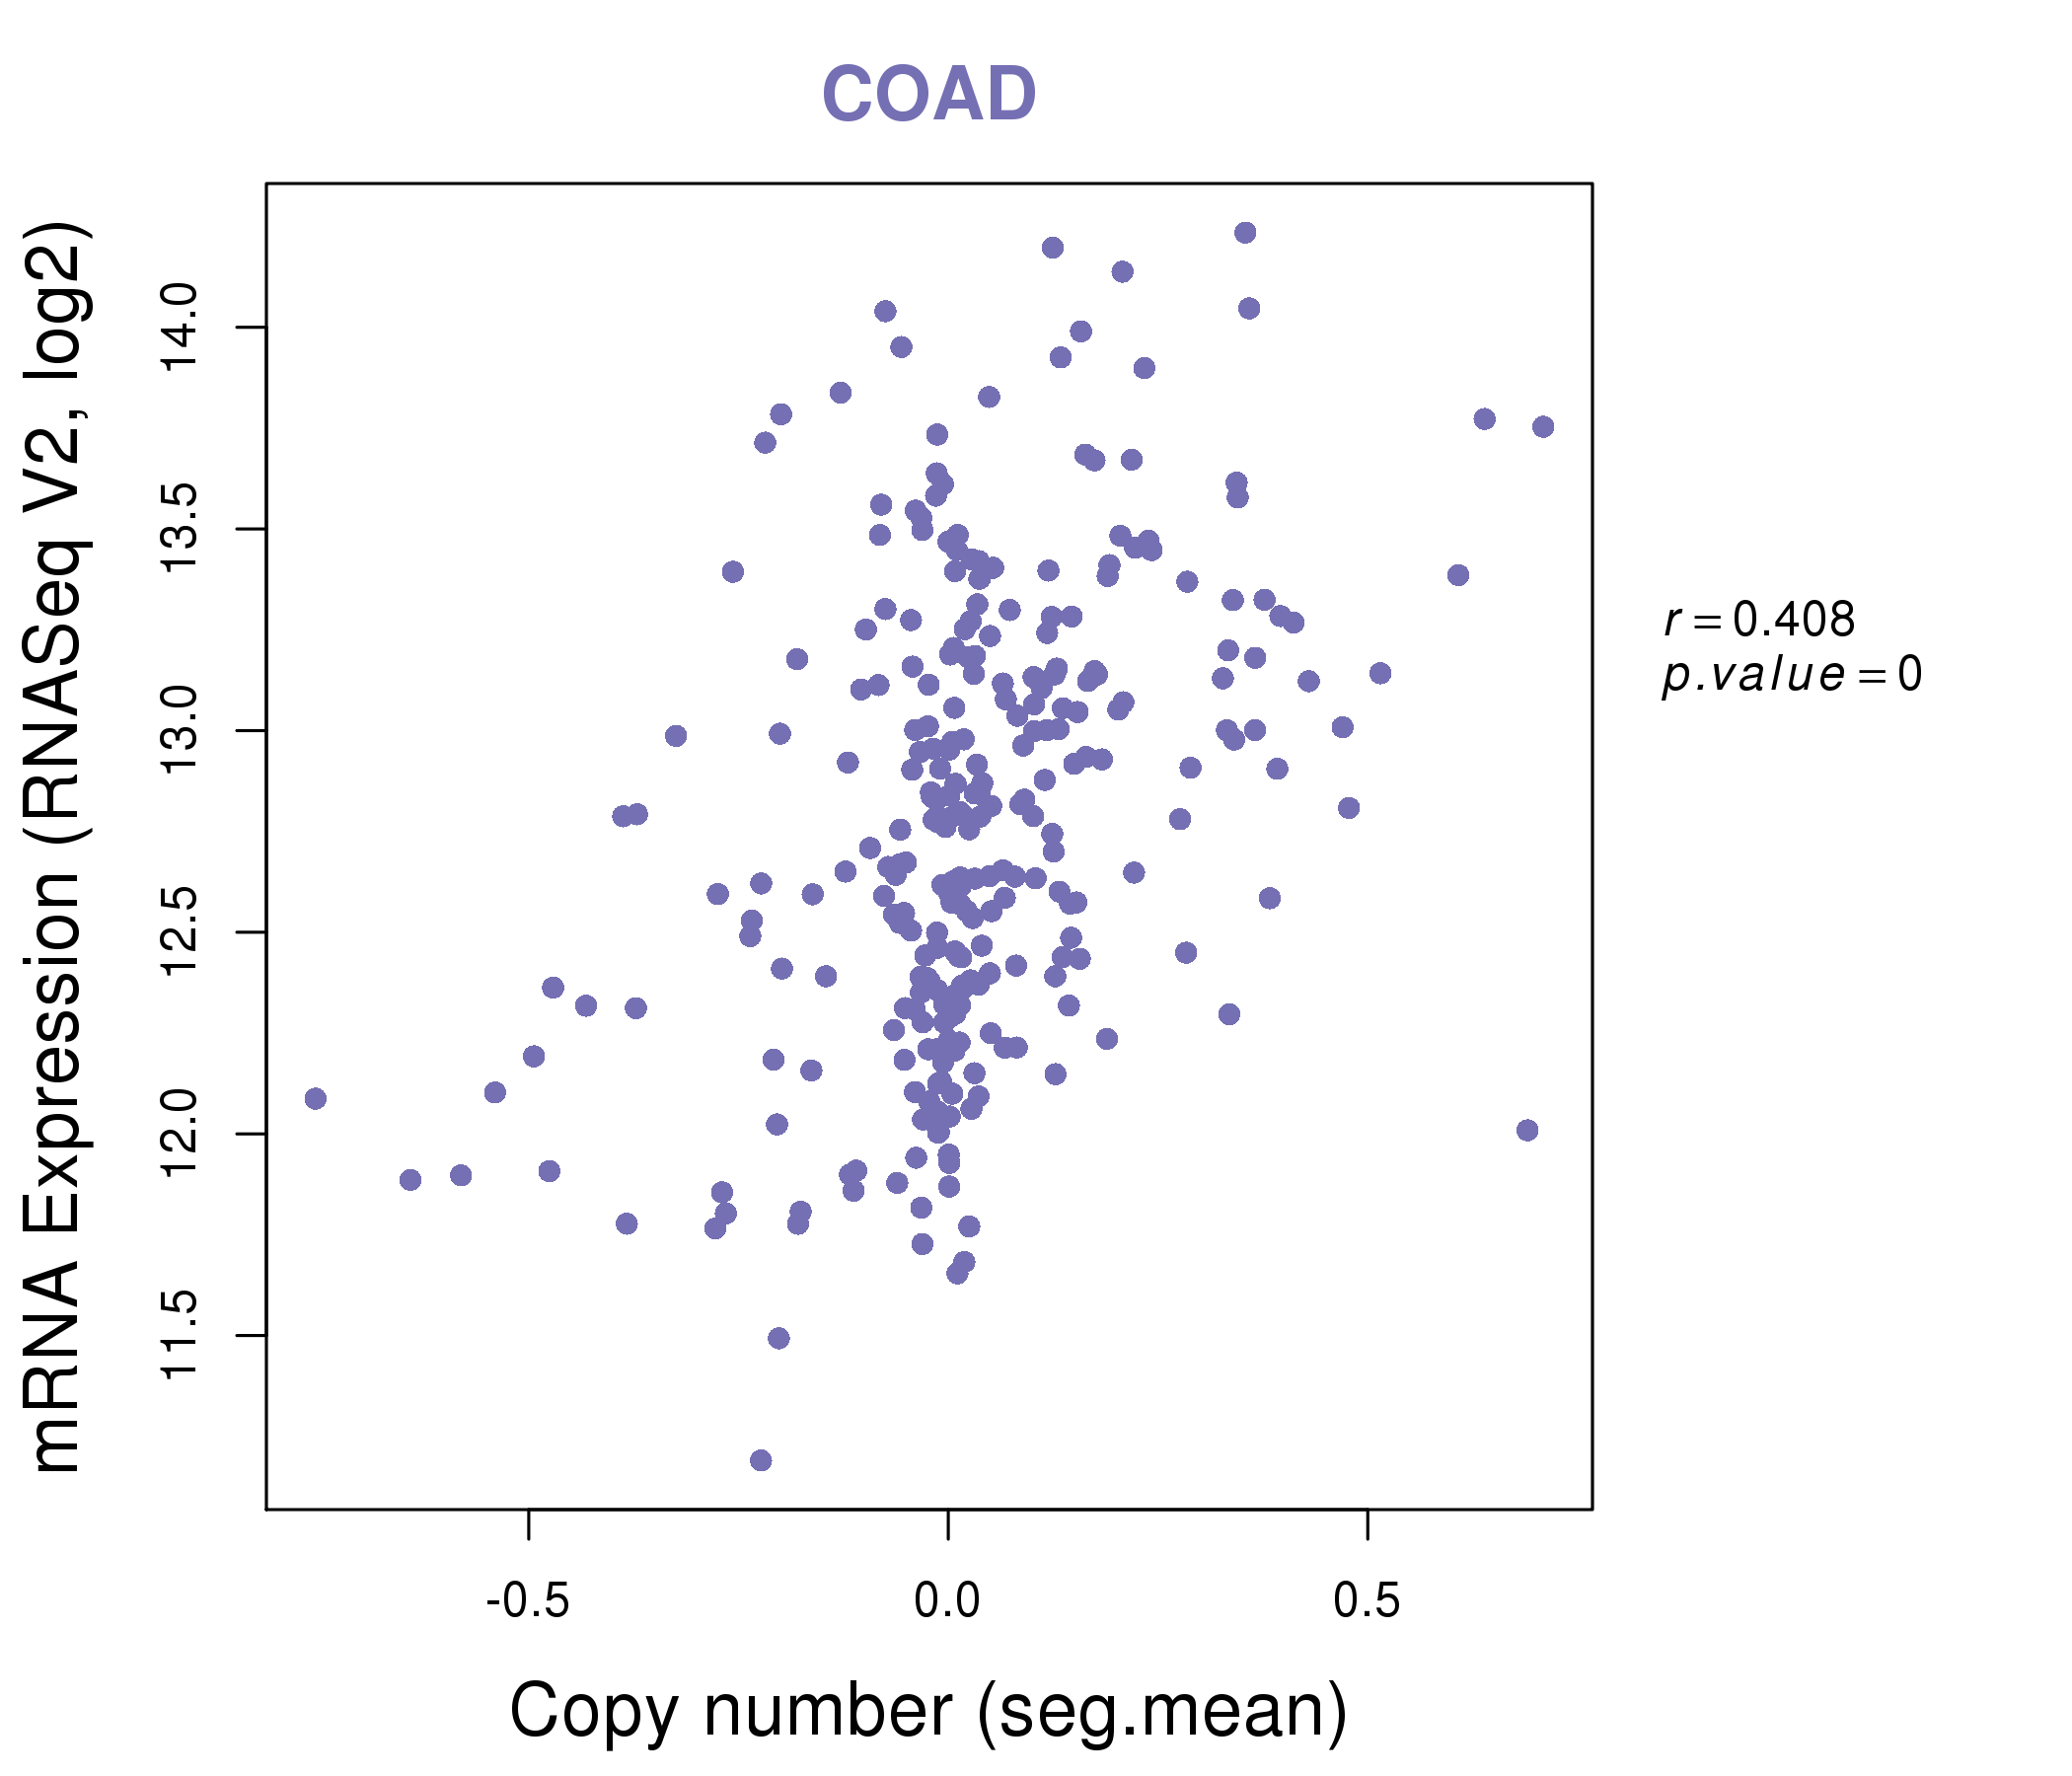
| * This plots show the correlation between CNV and gene expression. |
: Open all plots for all cancer types
 |
|
 |
|
| Top |
| Gene-Gene Network Information |
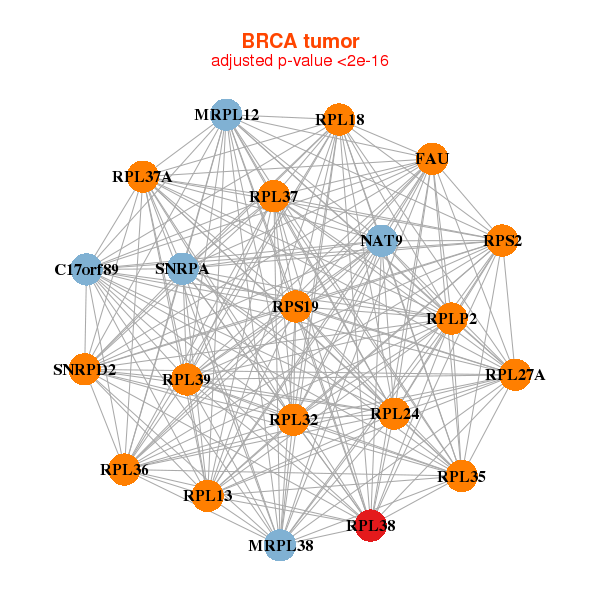
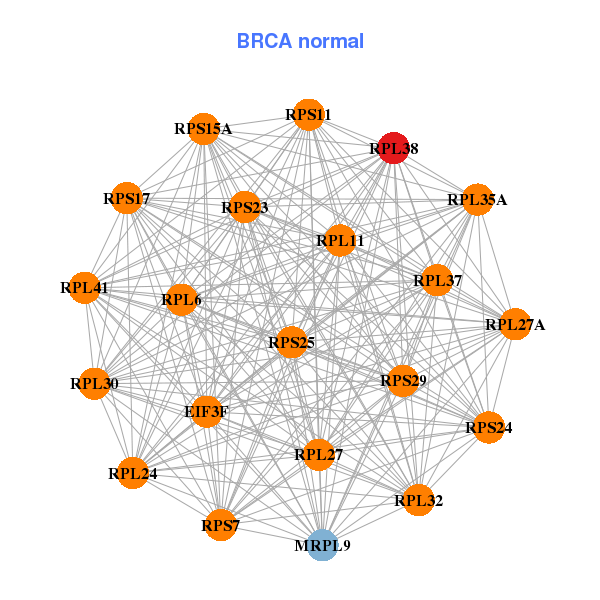
| * Co-Expression network figures were drawn using R package igraph. Only the top 20 genes with the highest correlations were shown. Red circle: input gene, orange circle: cell metabolism gene, sky circle: other gene |
: Open all plots for all cancer types
 |
|
| C17orf89,FAU,MRPL12,MRPL38,NAT9,RPL13,RPL18, RPL24,RPL27A,RPL32,RPL35,RPL36,RPL37,RPL37A, RPL38,RPL39,RPLP2,RPS19,RPS2,SNRPA,SNRPD2 | EIF3F,MRPL9,RPL11,RPL24,RPL27,RPL27A,RPL30, RPL32,RPL35A,RPL37,RPL38,RPL41,RPL6,RPS11, RPS15A,RPS17,RPS23,RPS24,RPS25,RPS29,RPS7 |
 |
|
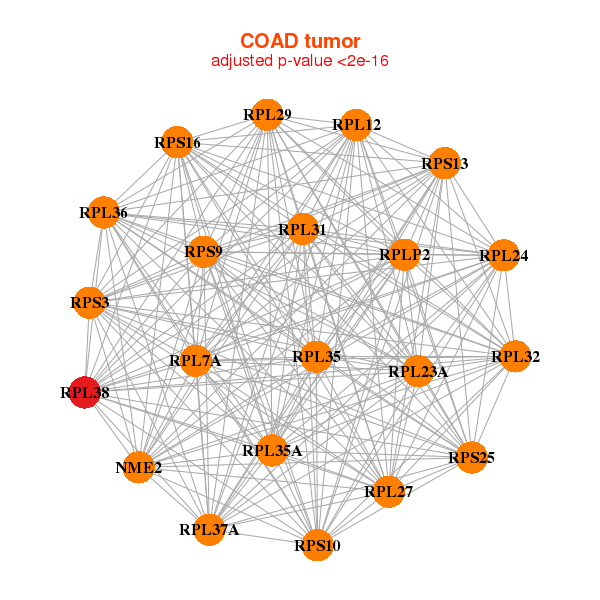
| NME2,RPL12,RPL23A,RPL24,RPL27,RPL29,RPL31, RPL32,RPL35,RPL35A,RPL36,RPL37A,RPL38,RPL7A, RPLP2,RPS10,RPS13,RPS16,RPS25,RPS3,RPS9 | EEF1A1,RPL10,RPL14,RPL15,RPL19,RPL30,RPL32, RPL35A,RPL37A,RPL38,RPL7A,RPLP1,RPS10,RPS11, RPS12,RPS13,RPS16,RPS23,RPS25,RPS3,RPS9 |
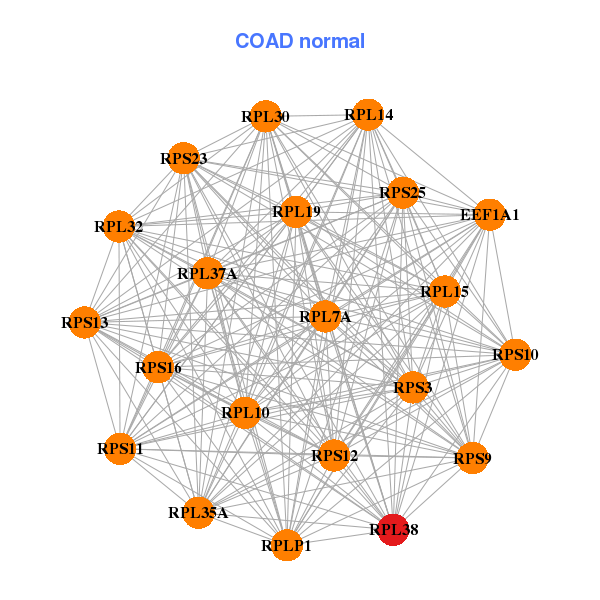
| * Co-Expression network figures were drawn using R package igraph. Only the top 20 genes with the highest correlations were shown. Red circle: input gene, orange circle: cell metabolism gene, sky circle: other gene |
: Open all plots for all cancer types
| Top |
: Open all interacting genes' information including KEGG pathway for all interacting genes from DAVID
| Top |
| Pharmacological Information for RPL38 |
| There's no related Drug. |
| Top |
| Cross referenced IDs for RPL38 |
| * We obtained these cross-references from Uniprot database. It covers 150 different DBs, 18 categories. http://www.uniprot.org/help/cross_references_section |
: Open all cross reference information
|
Copyright © 2016-Present - The Univsersity of Texas Health Science Center at Houston @ |