|
|||||||||||||||||||||||||||||||||||||||||||||||||||||||||||||||||||||||||||||||||||||||||||||||||||||||||||||||||||||||||||||||||||||||||||||||||||||||||||||||||||||||||||||||||||||||||||||||||||||||||||||||||||||||||||||||||||||||||||||||||||||||||||||||||||||||||||||||||||||||||||||||||||||||||||||||||||||||||||||||||||||||||||||||||||
| |
| Phenotypic Information (metabolism pathway, cancer, disease, phenome) |
| |
| |
| Gene-Gene Network Information: Co-Expression Network, Interacting Genes & KEGG |
| |
|


| Gene Summary for RPN1 |
| Basic gene info. | Gene symbol | RPN1 |
| Gene name | ribophorin I | |
| Synonyms | OST1|RBPH1 | |
| Cytomap | UCSC genome browser: 3q21.3 | |
| Genomic location | chr3 :128338812-128369719 | |
| Type of gene | protein-coding | |
| RefGenes | NM_002950.3, | |
| Ensembl id | ENSG00000163902 | |
| Description | RPN-Idolichyl-diphosphooligosaccharide--protein glycosyltransferase 67 kDa subunitdolichyl-diphosphooligosaccharide--protein glycosyltransferase subunit 1dolichyl-diphosphooligosaccharide-protein glycosyltransferase 67 kDa subunitoligosaccharyltransfe | |
| Modification date | 20141207 | |
| dbXrefs | MIM : 180470 | |
| HGNC : HGNC | ||
| Ensembl : ENSG00000163902 | ||
| HPRD : 01598 | ||
| Vega : OTTHUMG00000159691 | ||
| Protein | UniProt: P04843 go to UniProt's Cross Reference DB Table | |
| Expression | CleanEX: HS_RPN1 | |
| BioGPS: 6184 | ||
| Gene Expression Atlas: ENSG00000163902 | ||
| The Human Protein Atlas: ENSG00000163902 | ||
| Pathway | NCI Pathway Interaction Database: RPN1 | |
| KEGG: RPN1 | ||
| REACTOME: RPN1 | ||
| ConsensusPathDB | ||
| Pathway Commons: RPN1 | ||
| Metabolism | MetaCyc: RPN1 | |
| HUMANCyc: RPN1 | ||
| Regulation | Ensembl's Regulation: ENSG00000163902 | |
| miRBase: chr3 :128,338,812-128,369,719 | ||
| TargetScan: NM_002950 | ||
| cisRED: ENSG00000163902 | ||
| Context | iHOP: RPN1 | |
| cancer metabolism search in PubMed: RPN1 | ||
| UCL Cancer Institute: RPN1 | ||
| Assigned class in ccmGDB | B - This gene belongs to cancer gene. | |
| Top |
| Phenotypic Information for RPN1(metabolism pathway, cancer, disease, phenome) |
| Cancer | CGAP: RPN1 |
| Familial Cancer Database: RPN1 | |
| * This gene is included in those cancer gene databases. |
|
|
|
|
|
| . | |||||||||||||||||||||||||||||||||||||||||||||||||||||||||||||||||||||||||||||||||||||||||||||||||||||||||||||||||||||||||||||||||||||||||||||||||||||||||||||||||||||||||||||||||||||||||||||||||||||||||||||||||||||||||||||||||||||||||||||||||||||||||||||||||||||||||||||||||||||||||||||||||||||||||||||||||||||||||||||||||||||||||||||
Oncogene 1 | Significant driver gene in | ||||||||||||||||||||||||||||||||||||||||||||||||||||||||||||||||||||||||||||||||||||||||||||||||||||||||||||||||||||||||||||||||||||||||||||||||||||||||||||||||||||||||||||||||||||||||||||||||||||||||||||||||||||||||||||||||||||||||||||||||||||||||||||||||||||||||||||||||||||||||||||||||||||||||||||||||||||||||||||||||||||||||||||||||||
| cf) number; DB name 1 Oncogene; http://nar.oxfordjournals.org/content/35/suppl_1/D721.long, 2 Tumor Suppressor gene; https://bioinfo.uth.edu/TSGene/, 3 Cancer Gene Census; http://www.nature.com/nrc/journal/v4/n3/abs/nrc1299.html, 4 CancerGenes; http://nar.oxfordjournals.org/content/35/suppl_1/D721.long, 5 Network of Cancer Gene; http://ncg.kcl.ac.uk/index.php, 1Therapeutic Vulnerabilities in Cancer; http://cbio.mskcc.org/cancergenomics/statius/ |
| REACTOME_METABOLISM_OF_PROTEINS | |
| OMIM | 180470; gene. |
| Orphanet | |
| Disease | KEGG Disease: RPN1 |
| MedGen: RPN1 (Human Medical Genetics with Condition) | |
| ClinVar: RPN1 | |
| Phenotype | MGI: RPN1 (International Mouse Phenotyping Consortium) |
| PhenomicDB: RPN1 | |
| Mutations for RPN1 |
| * Under tables are showing count per each tissue to give us broad intuition about tissue specific mutation patterns.You can go to the detailed page for each mutation database's web site. |
| - Statistics for Tissue and Mutation type | Top |
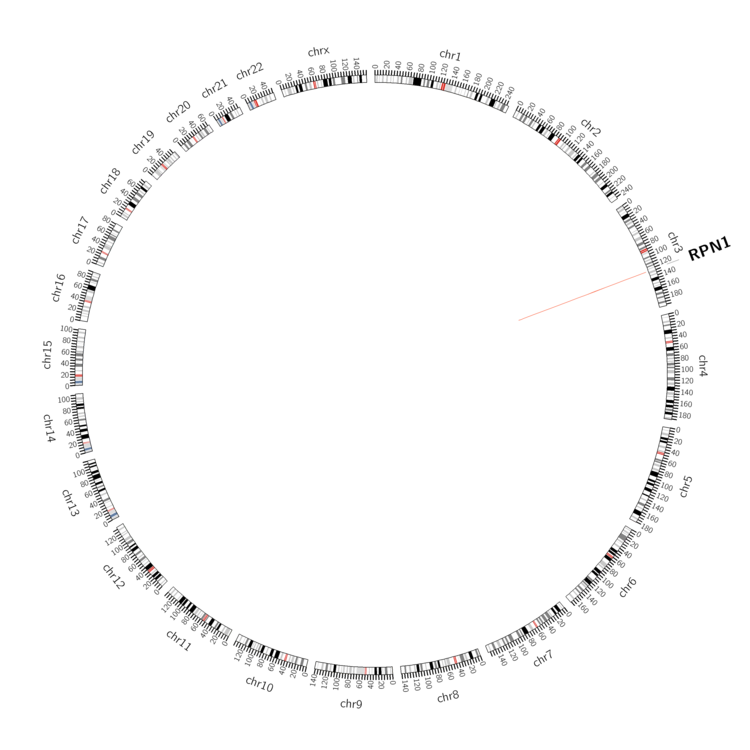 |
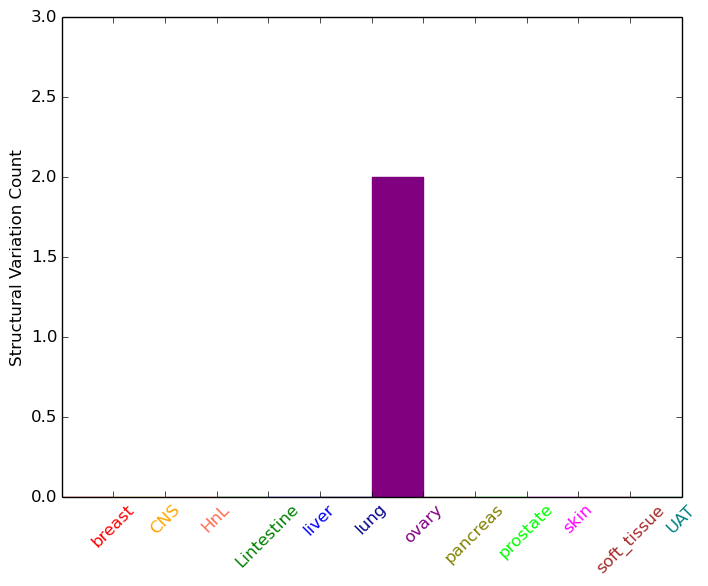
| - For Inter-chromosomal Variations |
| There's no inter-chromosomal structural variation. |
| - For Intra-chromosomal Variations |
| * Intra-chromosomal variantions includes 'intrachromosomal amplicon to amplicon', 'intrachromosomal amplicon to non-amplified dna', 'intrachromosomal deletion', 'intrachromosomal fold-back inversion', 'intrachromosomal inversion', 'intrachromosomal tandem duplication', 'Intrachromosomal unknown type', 'intrachromosomal with inverted orientation', 'intrachromosomal with non-inverted orientation'. |
 |
| Sample | Symbol_a | Chr_a | Start_a | End_a | Symbol_b | Chr_b | Start_b | End_b |
| ovary | RPN1 | chr3 | 128341367 | 128341567 | RPN1 | chr3 | 128351578 | 128351778 |
| ovary | RPN1 | chr3 | 128341414 | 128341434 | RPN1 | chr3 | 128341732 | 128341752 |
| cf) Tissue number; Tissue name (1;Breast, 2;Central_nervous_system, 3;Haematopoietic_and_lymphoid_tissue, 4;Large_intestine, 5;Liver, 6;Lung, 7;Ovary, 8;Pancreas, 9;Prostate, 10;Skin, 11;Soft_tissue, 12;Upper_aerodigestive_tract) |
| * From mRNA Sanger sequences, Chitars2.0 arranged chimeric transcripts. This table shows RPN1 related fusion information. |
| ID | Head Gene | Tail Gene | Accession | Gene_a | qStart_a | qEnd_a | Chromosome_a | tStart_a | tEnd_a | Gene_a | qStart_a | qEnd_a | Chromosome_a | tStart_a | tEnd_a |
| CD370735 | RPLP2 | 21 | 436 | 11 | 809999 | 812873 | RPN1 | 433 | 666 | 3 | 128339108 | 128339342 | |
| BM838536 | MALAT1 | 1 | 84 | 11 | 65271319 | 65271402 | RPN1 | 85 | 558 | 3 | 128341096 | 128345633 | |
| AF310158 | RPN1 | 1 | 111 | 3 | 128369383 | 128369493 | MECOM | 110 | 140 | 3 | 168849291 | 168849321 | |
| BE873777 | RPN1 | 285 | 311 | 3 | 128385395 | 128385421 | GATAD2B | 293 | 314 | 1 | 153894765 | 153894786 | |
| AW067818 | RPN1 | 9 | 79 | 3 | 128339335 | 128339405 | RPN1 | 73 | 480 | 3 | 128338867 | 128339270 | |
| Top |
| Mutation type/ Tissue ID | brca | cns | cerv | endome | haematopo | kidn | Lintest | liver | lung | ns | ovary | pancre | prost | skin | stoma | thyro | urina | |||
| Total # sample | 1 | 1 | ||||||||||||||||||
| GAIN (# sample) | ||||||||||||||||||||
| LOSS (# sample) | 1 | 1 |
| cf) Tissue ID; Tissue type (1; Breast, 2; Central_nervous_system, 3; Cervix, 4; Endometrium, 5; Haematopoietic_and_lymphoid_tissue, 6; Kidney, 7; Large_intestine, 8; Liver, 9; Lung, 10; NS, 11; Ovary, 12; Pancreas, 13; Prostate, 14; Skin, 15; Stomach, 16; Thyroid, 17; Urinary_tract) |
| Top |
|
 |
| Top |
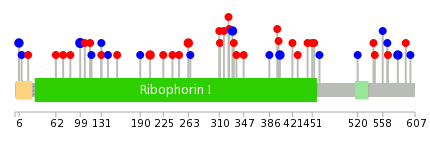
| Stat. for Non-Synonymous SNVs (# total SNVs=30) | (# total SNVs=14) |
 |  |
(# total SNVs=0) | (# total SNVs=1) |
 |
| Top |
| * When you move the cursor on each content, you can see more deailed mutation information on the Tooltip. Those are primary_site,primary_histology,mutation(aa),pubmedID. |
| GRCh37 position | Mutation(aa) | Unique sampleID count |
| chr3:128363791-128363791 | p.E99E | 3 |
| chr3:128356662-128356662 | p.D205Y | 2 |
| chr3:128344786-128344786 | p.D402D | 2 |
| chr3:128369626-128369626 | p.A6A | 2 |
| chr3:128350847-128350847 | p.R263C | 2 |
| chr3:128348840-128348840 | p.Y330Y | 2 |
| chr3:128339335-128339335 | p.T581T | 2 |
| chr3:128339383-128339383 | p.S565S | 1 |
| chr3:128344731-128344731 | p.I421V | 1 |
| chr3:128369425-128369425 | p.L73F | 1 |
| Top |
|
 |
| Point Mutation/ Tissue ID | 1 | 2 | 3 | 4 | 5 | 6 | 7 | 8 | 9 | 10 | 11 | 12 | 13 | 14 | 15 | 16 | 17 | 18 | 19 | 20 |
| # sample | 1 | 2 | 9 | 1 | 1 | 1 | 1 | 3 | 1 | 1 | 3 | 4 | 4 | |||||||
| # mutation | 1 | 2 | 6 | 1 | 1 | 1 | 1 | 3 | 1 | 1 | 3 | 4 | 4 | |||||||
| nonsynonymous SNV | 2 | 4 | 1 | 1 | 1 | 1 | 2 | 1 | 1 | 2 | 3 | |||||||||
| synonymous SNV | 1 | 2 | 1 | 3 | 2 | 1 |
| cf) Tissue ID; Tissue type (1; BLCA[Bladder Urothelial Carcinoma], 2; BRCA[Breast invasive carcinoma], 3; CESC[Cervical squamous cell carcinoma and endocervical adenocarcinoma], 4; COAD[Colon adenocarcinoma], 5; GBM[Glioblastoma multiforme], 6; Glioma Low Grade, 7; HNSC[Head and Neck squamous cell carcinoma], 8; KICH[Kidney Chromophobe], 9; KIRC[Kidney renal clear cell carcinoma], 10; KIRP[Kidney renal papillary cell carcinoma], 11; LAML[Acute Myeloid Leukemia], 12; LUAD[Lung adenocarcinoma], 13; LUSC[Lung squamous cell carcinoma], 14; OV[Ovarian serous cystadenocarcinoma ], 15; PAAD[Pancreatic adenocarcinoma], 16; PRAD[Prostate adenocarcinoma], 17; SKCM[Skin Cutaneous Melanoma], 18:STAD[Stomach adenocarcinoma], 19:THCA[Thyroid carcinoma], 20:UCEC[Uterine Corpus Endometrial Carcinoma]) |
| Top |
| * We represented just top 10 SNVs. When you move the cursor on each content, you can see more deailed mutation information on the Tooltip. Those are primary_site, primary_histology, mutation(aa), pubmedID. |
| Genomic Position | Mutation(aa) | Unique sampleID count |
| chr3:128363791 | p.E99E | 3 |
| chr3:128341088 | p.E520E | 2 |
| chr3:128341012 | p.D205Y | 1 |
| chr3:128348836 | p.S462S | 1 |
| chr3:128341018 | p.N190N | 1 |
| chr3:128348837 | p.I454T | 1 |
| chr3:128363793 | p.V131M | 1 |
| chr3:128348859 | p.F451S | 1 |
| chr3:128369460 | p.K116K | 1 |
| chr3:128344386 | p.A444V | 1 |
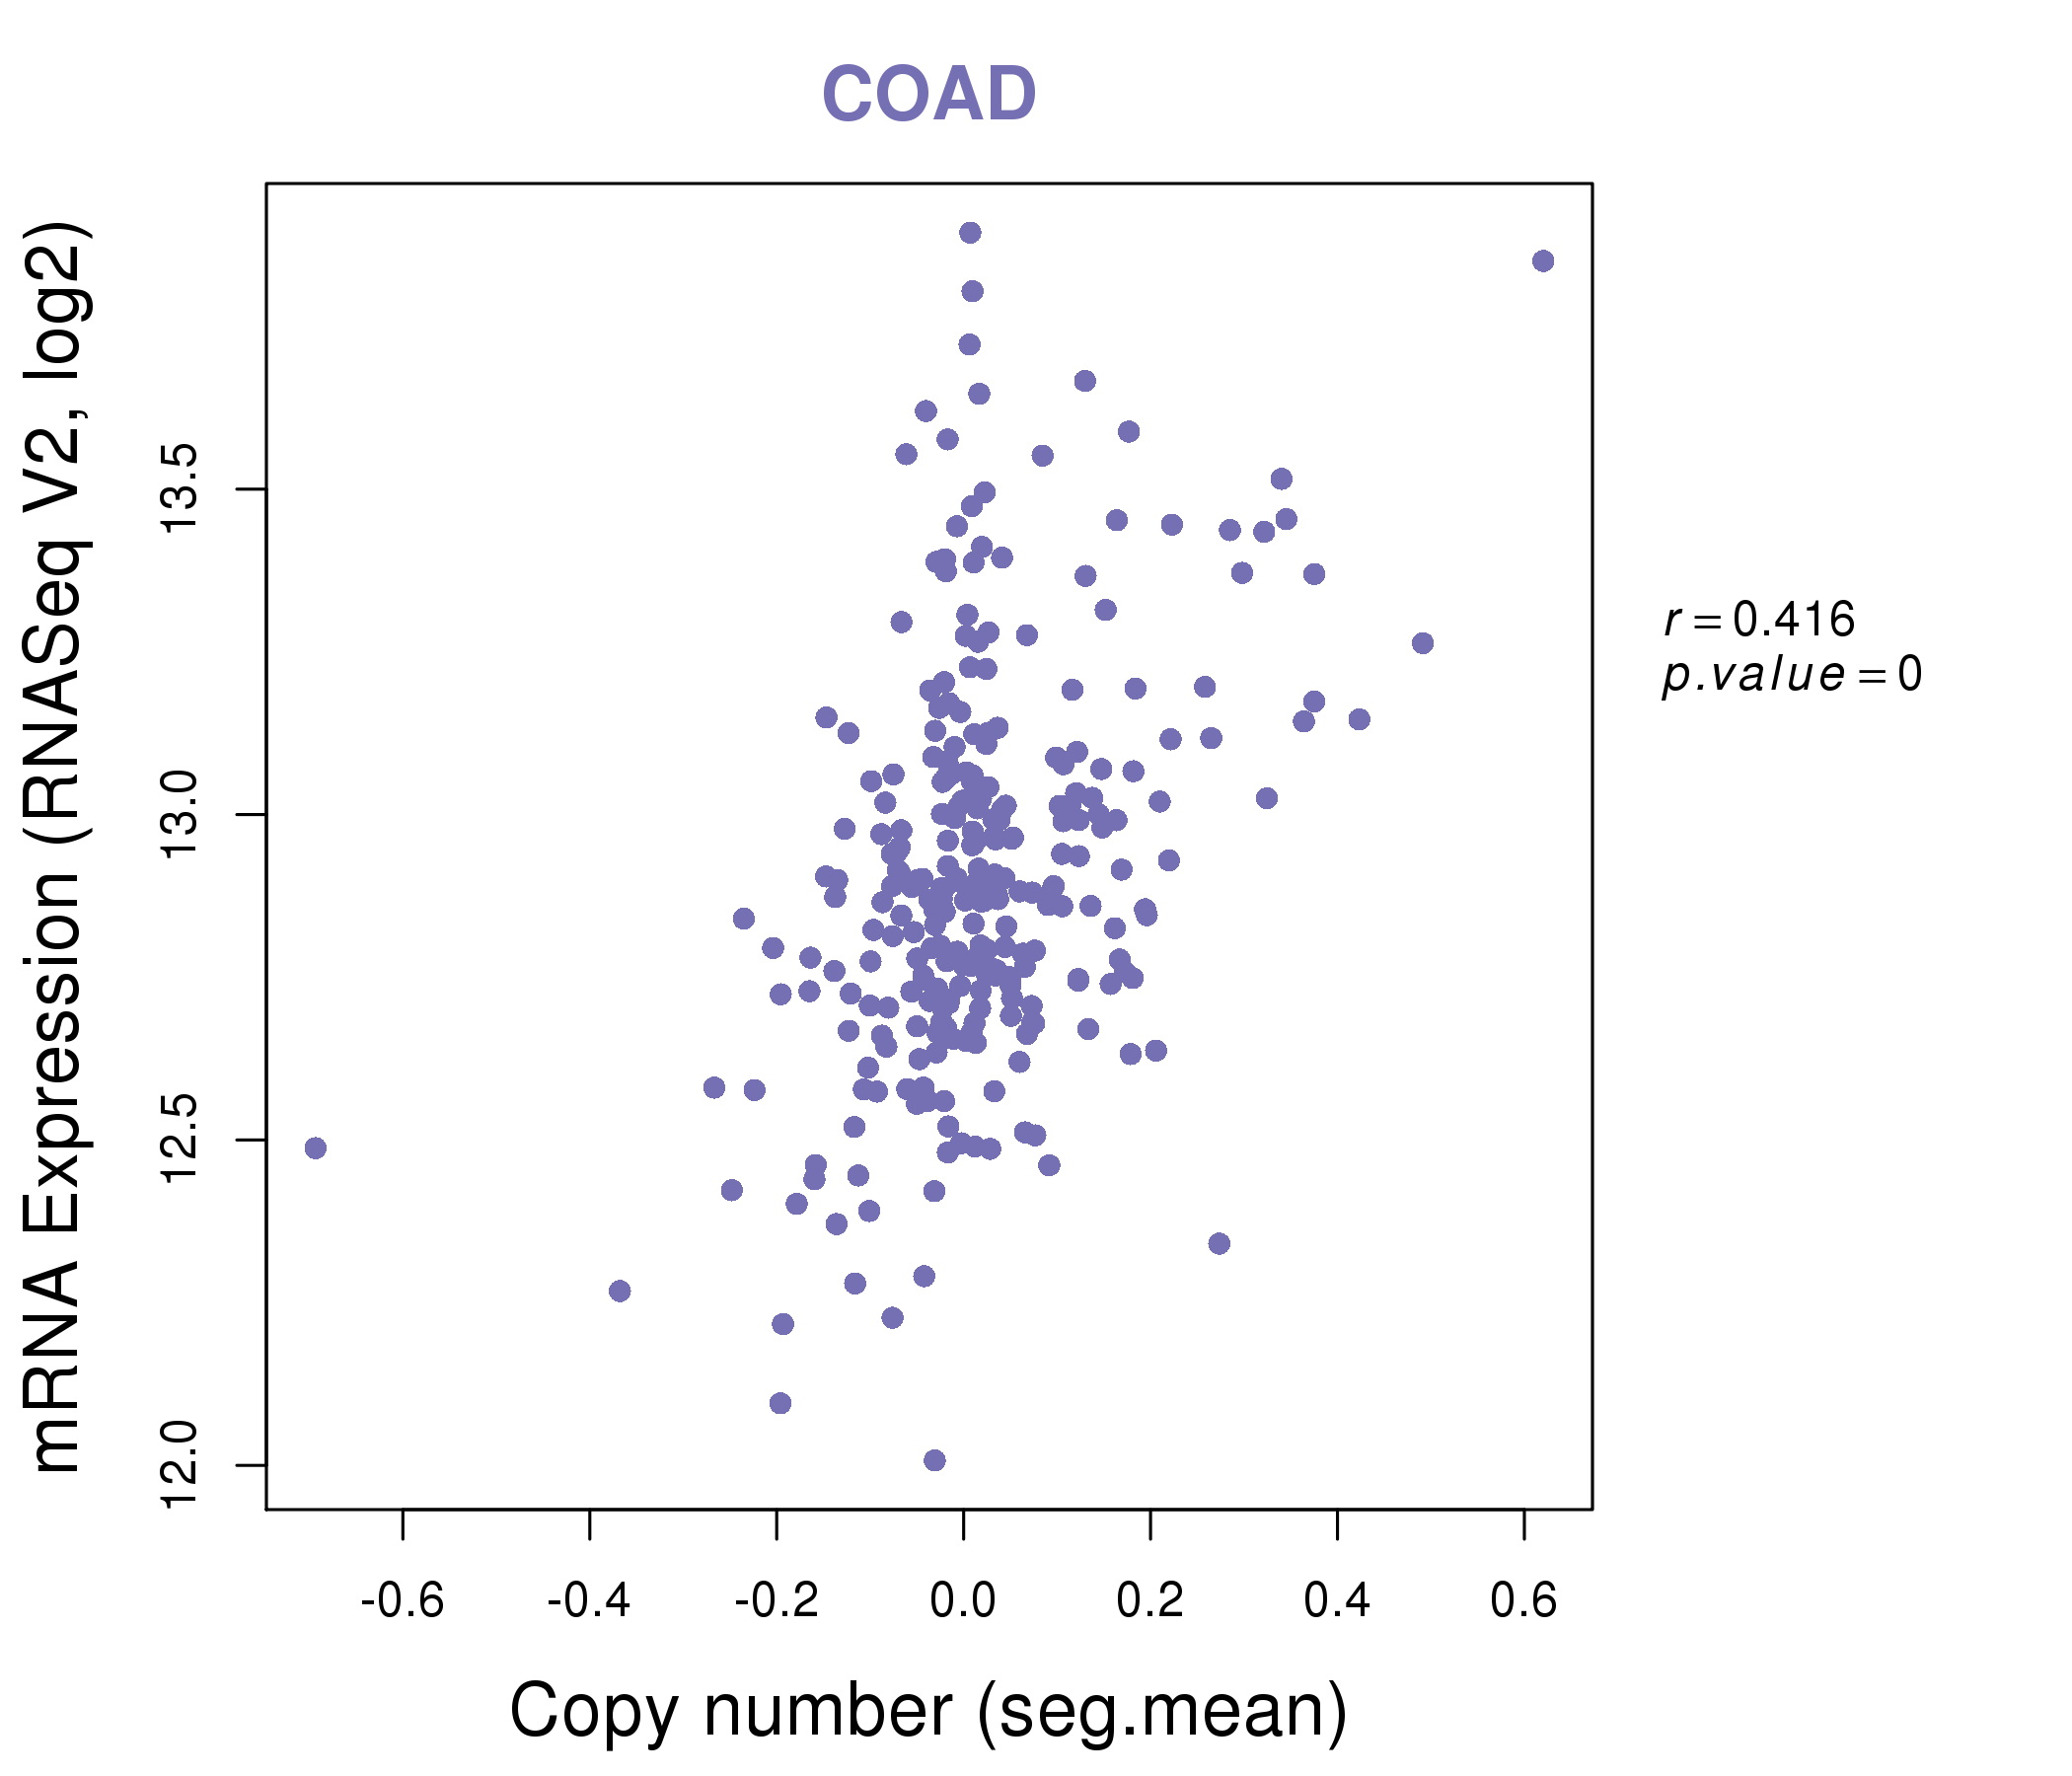
| * Copy number data were extracted from TCGA using R package TCGA-Assembler. The URLs of all public data files on TCGA DCC data server were gathered on Jan-05-2015. Function ProcessCNAData in TCGA-Assembler package was used to obtain gene-level copy number value which is calculated as the average copy number of the genomic region of a gene. |
 |
| cf) Tissue ID[Tissue type]: BLCA[Bladder Urothelial Carcinoma], BRCA[Breast invasive carcinoma], CESC[Cervical squamous cell carcinoma and endocervical adenocarcinoma], COAD[Colon adenocarcinoma], GBM[Glioblastoma multiforme], Glioma Low Grade, HNSC[Head and Neck squamous cell carcinoma], KICH[Kidney Chromophobe], KIRC[Kidney renal clear cell carcinoma], KIRP[Kidney renal papillary cell carcinoma], LAML[Acute Myeloid Leukemia], LUAD[Lung adenocarcinoma], LUSC[Lung squamous cell carcinoma], OV[Ovarian serous cystadenocarcinoma ], PAAD[Pancreatic adenocarcinoma], PRAD[Prostate adenocarcinoma], SKCM[Skin Cutaneous Melanoma], STAD[Stomach adenocarcinoma], THCA[Thyroid carcinoma], UCEC[Uterine Corpus Endometrial Carcinoma] |
| Top |
| Gene Expression for RPN1 |
| * CCLE gene expression data were extracted from CCLE_Expression_Entrez_2012-10-18.res: Gene-centric RMA-normalized mRNA expression data. |
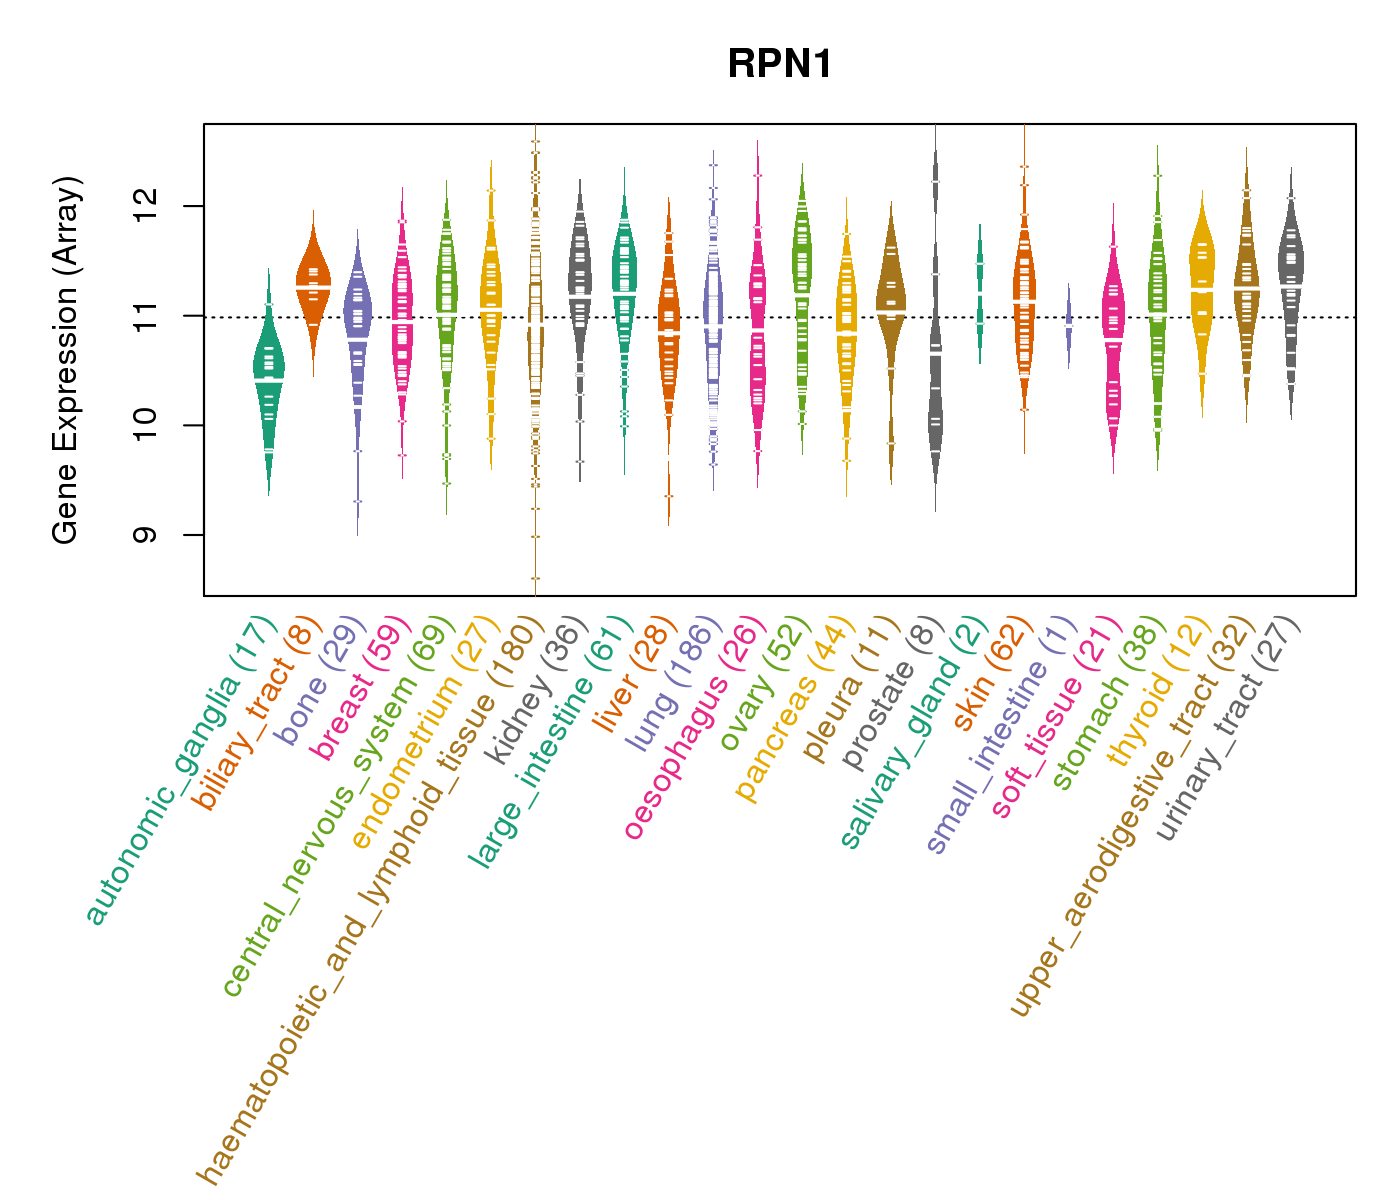 |
| * Normalized gene expression data of RNASeqV2 was extracted from TCGA using R package TCGA-Assembler. The URLs of all public data files on TCGA DCC data server were gathered at Jan-05-2015. Only eight cancer types have enough normal control samples for differential expression analysis. (t test, adjusted p<0.05 (using Benjamini-Hochberg FDR)) |
 |
| Top |
| * This plots show the correlation between CNV and gene expression. |
: Open all plots for all cancer types
 |
|
 |
|


| Top |
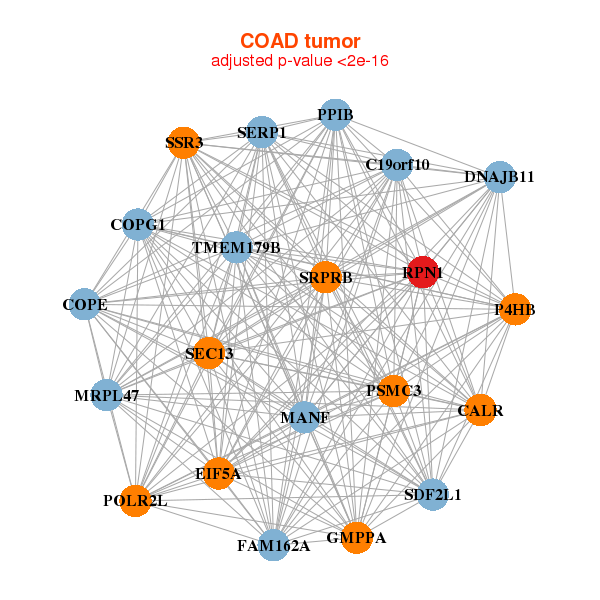
| Gene-Gene Network Information |
| * Co-Expression network figures were drawn using R package igraph. Only the top 20 genes with the highest correlations were shown. Red circle: input gene, orange circle: cell metabolism gene, sky circle: other gene |
: Open all plots for all cancer types
 |
| ||||
| ACAD9,ALG3,TIMMDC1,HMCES,CALR,CCDC58,COPG1, DDOST,DNAJB11,ISY1,MCM2,MRPL3,MRPS22,PDIA5, PDIA6,PRDX4,RPN1,RUVBL1,SEC61A1,SRPRB,TPRA1 | ARF1,ATP6V0B,BSCL2,CALR,CFL1,HM13,LAMP1, LMAN2,MANF,NANS,PDIA3,PPIB,RHOC,RPN1, SDF2,SEC61B,SRPRB,SUMF2,TMED9,TMEM179B,UFC1 | ||||
 |
| ||||
| C19orf10,CALR,COPE,COPG1,DNAJB11,EIF5A,FAM162A, GMPPA,MANF,MRPL47,P4HB,POLR2L,PPIB,PSMC3, RPN1,SDF2L1,SEC13,SERP1,SRPRB,SSR3,TMEM179B | ACTR3,C19orf10,CALR,CCT5,DNAJB11,EIF4A1,GMPPB, HNRNPF,LRRC59,MANF,NUDT5,PDIA4,PDIA6,PPIB, PSMB2,PSMC4,RPN1,SDF2L1,SEC61B,SPCS2,TMED9 |

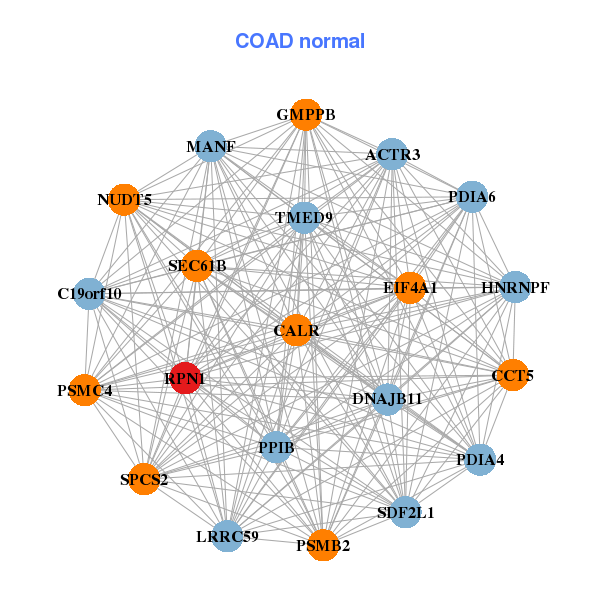
| * Co-Expression network figures were drawn using R package igraph. Only the top 20 genes with the highest correlations were shown. Red circle: input gene, orange circle: cell metabolism gene, sky circle: other gene |
: Open all plots for all cancer types
| Top |
: Open all interacting genes' information including KEGG pathway for all interacting genes from DAVID
| Top |
| Pharmacological Information for RPN1 |
| DB Category | DB Name | DB's ID and Url link |
| Organism-specific databases | PharmGKB | PA34777; -. |
| Organism-specific databases | CTD | 6184; -. |
| * Gene Centered Interaction Network. |
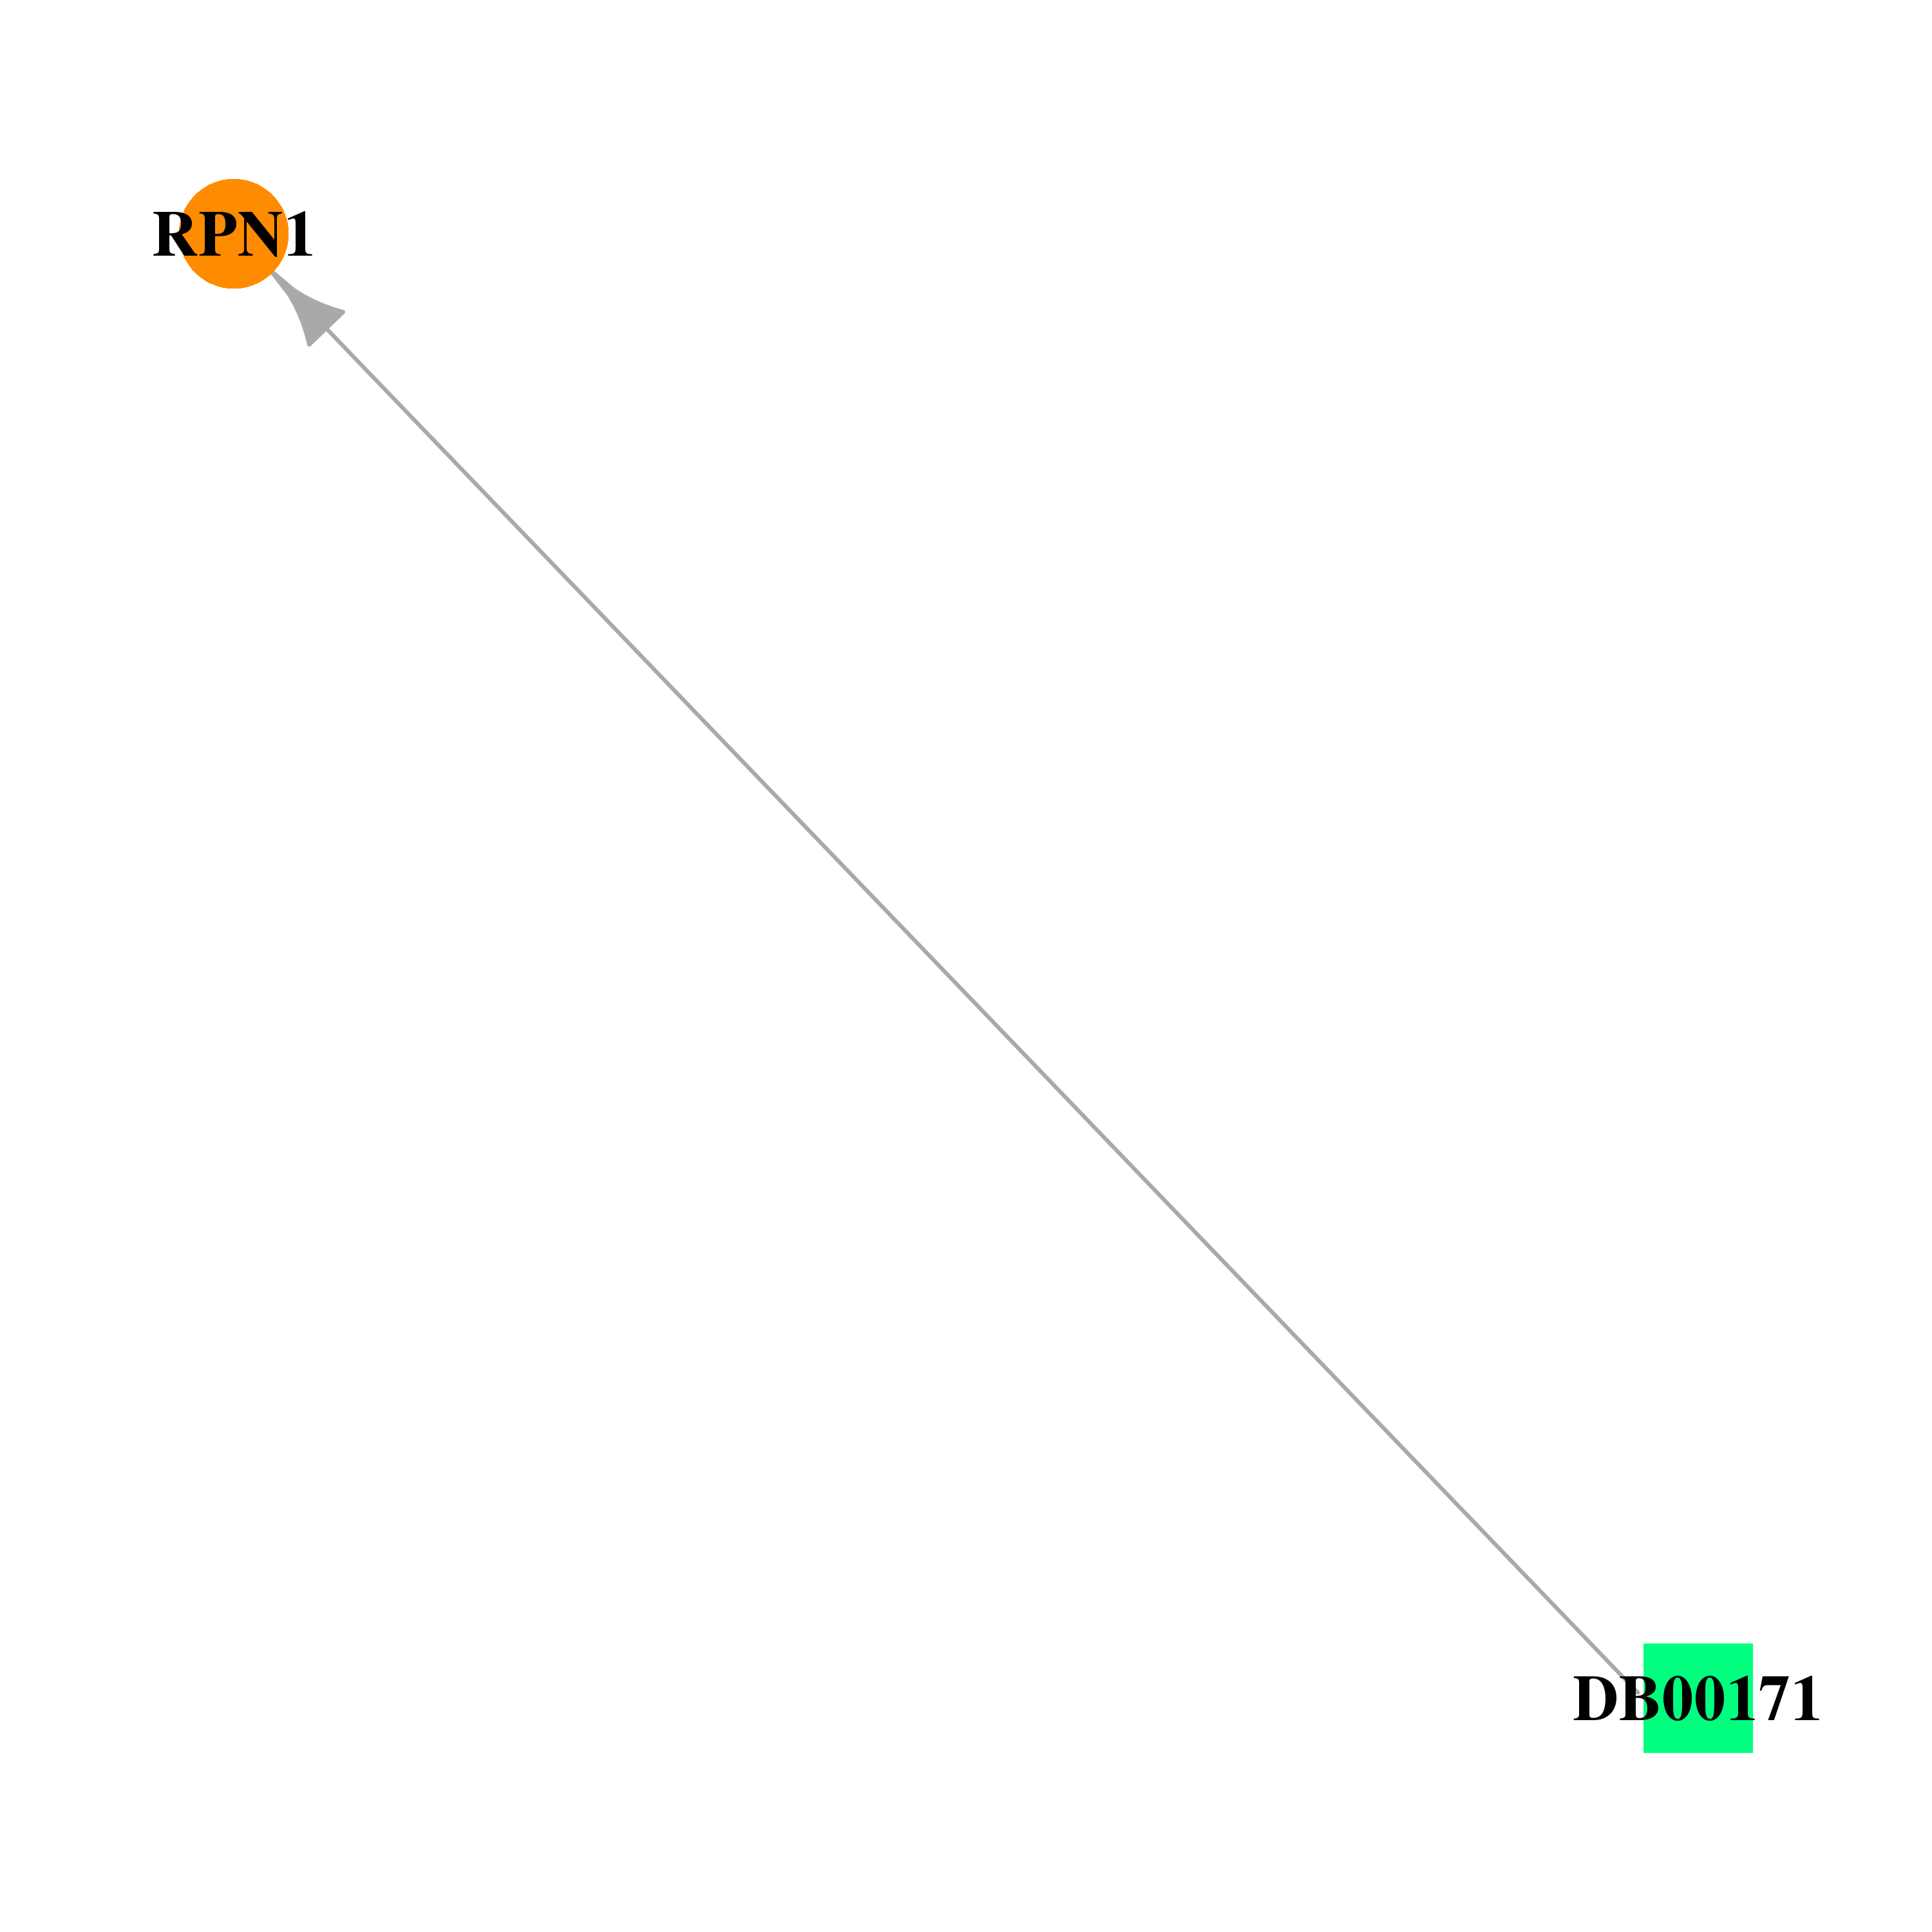 |
| * Drug Centered Interaction Network. |
| DrugBank ID | Target Name | Drug Groups | Generic Name | Drug Centered Network | Drug Structure |
| DB00171 | ribophorin I | approved; nutraceutical | Adenosine triphosphate |  |  |
| Top |
| Cross referenced IDs for RPN1 |
| * We obtained these cross-references from Uniprot database. It covers 150 different DBs, 18 categories. http://www.uniprot.org/help/cross_references_section |
: Open all cross reference information
|
Copyright © 2016-Present - The Univsersity of Texas Health Science Center at Houston @ |