|
||||||||||||||||||||
| |
| Phenotypic Information (metabolism pathway, cancer, disease, phenome) |
| |
| |
| Gene-Gene Network Information: Co-Expression Network, Interacting Genes & KEGG |
| |
|


| Gene Summary for RPS4Y1 |
| Basic gene info. | Gene symbol | RPS4Y1 |
| Gene name | ribosomal protein S4, Y-linked 1 | |
| Synonyms | RPS4Y|S4 | |
| Cytomap | UCSC genome browser: Yp11.3 | |
| Genomic location | chrY :2709622-2734997 | |
| Type of gene | protein-coding | |
| RefGenes | NM_001008.3, | |
| Ensembl id | ENSG00000129824 | |
| Description | 40S ribosomal protein S4, Y40S ribosomal protein S4, Y isoform 1ribosomal protein S4Y | |
| Modification date | 20141207 | |
| dbXrefs | MIM : 470000 | |
| HGNC : HGNC | ||
| Ensembl : ENSG00000279950 | ||
| HPRD : 15963 | ||
| Protein | UniProt: go to UniProt's Cross Reference DB Table | |
| Expression | CleanEX: HS_RPS4Y1 | |
| BioGPS: 6192 | ||
| Gene Expression Atlas: ENSG00000129824 | ||
| The Human Protein Atlas: ENSG00000129824 | ||
| Pathway | NCI Pathway Interaction Database: RPS4Y1 | |
| KEGG: RPS4Y1 | ||
| REACTOME: RPS4Y1 | ||
| ConsensusPathDB | ||
| Pathway Commons: RPS4Y1 | ||
| Metabolism | MetaCyc: RPS4Y1 | |
| HUMANCyc: RPS4Y1 | ||
| Regulation | Ensembl's Regulation: ENSG00000129824 | |
| miRBase: chrY :2,709,622-2,734,997 | ||
| TargetScan: NM_001008 | ||
| cisRED: ENSG00000129824 | ||
| Context | iHOP: RPS4Y1 | |
| cancer metabolism search in PubMed: RPS4Y1 | ||
| UCL Cancer Institute: RPS4Y1 | ||
| Assigned class in ccmGDB | C | |
| Top |
| Phenotypic Information for RPS4Y1(metabolism pathway, cancer, disease, phenome) |
| Cancer | CGAP: RPS4Y1 |
| Familial Cancer Database: RPS4Y1 | |
| * This gene is included in those cancer gene databases. |
|
|
|
|
|
| . | ||||||||||||||
Oncogene 1 | Significant driver gene in | |||||||||||||||||||
| cf) number; DB name 1 Oncogene; http://nar.oxfordjournals.org/content/35/suppl_1/D721.long, 2 Tumor Suppressor gene; https://bioinfo.uth.edu/TSGene/, 3 Cancer Gene Census; http://www.nature.com/nrc/journal/v4/n3/abs/nrc1299.html, 4 CancerGenes; http://nar.oxfordjournals.org/content/35/suppl_1/D721.long, 5 Network of Cancer Gene; http://ncg.kcl.ac.uk/index.php, 1Therapeutic Vulnerabilities in Cancer; http://cbio.mskcc.org/cancergenomics/statius/ |
| REACTOME_METABOLISM_OF_PROTEINS REACTOME_METABOLISM_OF_MRNA REACTOME_METABOLISM_OF_RNA | |
| OMIM | |
| Orphanet | |
| Disease | KEGG Disease: RPS4Y1 |
| MedGen: RPS4Y1 (Human Medical Genetics with Condition) | |
| ClinVar: RPS4Y1 | |
| Phenotype | MGI: RPS4Y1 (International Mouse Phenotyping Consortium) |
| PhenomicDB: RPS4Y1 | |
| Mutations for RPS4Y1 |
| * Under tables are showing count per each tissue to give us broad intuition about tissue specific mutation patterns.You can go to the detailed page for each mutation database's web site. |
| There's no structural variation information in COSMIC data for this gene. |
| * From mRNA Sanger sequences, Chitars2.0 arranged chimeric transcripts. This table shows RPS4Y1 related fusion information. |
| ID | Head Gene | Tail Gene | Accession | Gene_a | qStart_a | qEnd_a | Chromosome_a | tStart_a | tEnd_a | Gene_a | qStart_a | qEnd_a | Chromosome_a | tStart_a | tEnd_a |
| AF116711 | ALB | 167 | 274 | 4 | 74281996 | 74283280 | RPS4Y1 | 268 | 1144 | Y | 2709643 | 2734997 | |
| BF810102 | RPS4Y1 | 12 | 102 | Y | 2715560 | 2715654 | RPS4Y1 | 96 | 317 | Y | 2715297 | 2715518 | |
| AI174917 | ALB | 167 | 274 | 4 | 74281996 | 74283280 | RPS4Y1 | 268 | 691 | Y | 2709643 | 2722681 | |
| BI047537 | RPS4Y1 | 1 | 205 | Y | 2722654 | 2733176 | ARGLU1 | 192 | 311 | 13 | 107220075 | 107220194 | |
| AW300778 | RPS19 | 9 | 399 | 19 | 42364325 | 42373284 | RPS4Y1 | 387 | 474 | Y | 2734859 | 2734946 | |
| Top |
| There's no copy number variation information in COSMIC data for this gene. |
| Top |
|
 |
| Top |
| Stat. for Non-Synonymous SNVs (# total SNVs=4) | (# total SNVs=2) |
 |  |
(# total SNVs=0) | (# total SNVs=0) |
| Top |
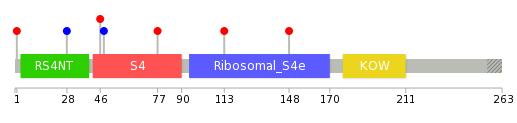
| * When you move the cursor on each content, you can see more deailed mutation information on the Tooltip. Those are primary_site,primary_histology,mutation(aa),pubmedID. |
| GRCh37 position | Mutation(aa) | Unique sampleID count |
| chr24:2712266-2712266 | p.R77L | 1 |
| chr24:2713761-2713761 | p.R113C | 1 |
| chr24:2722722-2722722 | p.R148C | 1 |
| chr24:2709666-2709666 | p.M1V | 1 |
| chr24:2712120-2712120 | p.A28A | 1 |
| chr24:2712172-2712172 | p.V46I | 1 |
| chr24:2712180-2712180 | p.L48L | 1 |
| Top |
|
 |
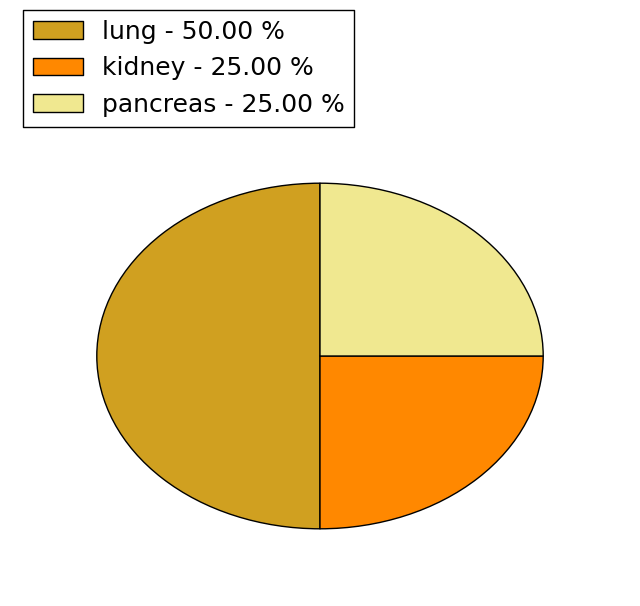
| Point Mutation/ Tissue ID | 1 | 2 | 3 | 4 | 5 | 6 | 7 | 8 | 9 | 10 | 11 | 12 | 13 | 14 | 15 | 16 | 17 | 18 | 19 | 20 |
| # sample | 1 | 1 | 1 | |||||||||||||||||
| # mutation | 1 | 1 | 1 | |||||||||||||||||
| nonsynonymous SNV | 1 | 1 | ||||||||||||||||||
| synonymous SNV | 1 |
| cf) Tissue ID; Tissue type (1; BLCA[Bladder Urothelial Carcinoma], 2; BRCA[Breast invasive carcinoma], 3; CESC[Cervical squamous cell carcinoma and endocervical adenocarcinoma], 4; COAD[Colon adenocarcinoma], 5; GBM[Glioblastoma multiforme], 6; Glioma Low Grade, 7; HNSC[Head and Neck squamous cell carcinoma], 8; KICH[Kidney Chromophobe], 9; KIRC[Kidney renal clear cell carcinoma], 10; KIRP[Kidney renal papillary cell carcinoma], 11; LAML[Acute Myeloid Leukemia], 12; LUAD[Lung adenocarcinoma], 13; LUSC[Lung squamous cell carcinoma], 14; OV[Ovarian serous cystadenocarcinoma ], 15; PAAD[Pancreatic adenocarcinoma], 16; PRAD[Prostate adenocarcinoma], 17; SKCM[Skin Cutaneous Melanoma], 18:STAD[Stomach adenocarcinoma], 19:THCA[Thyroid carcinoma], 20:UCEC[Uterine Corpus Endometrial Carcinoma]) |
| Top |
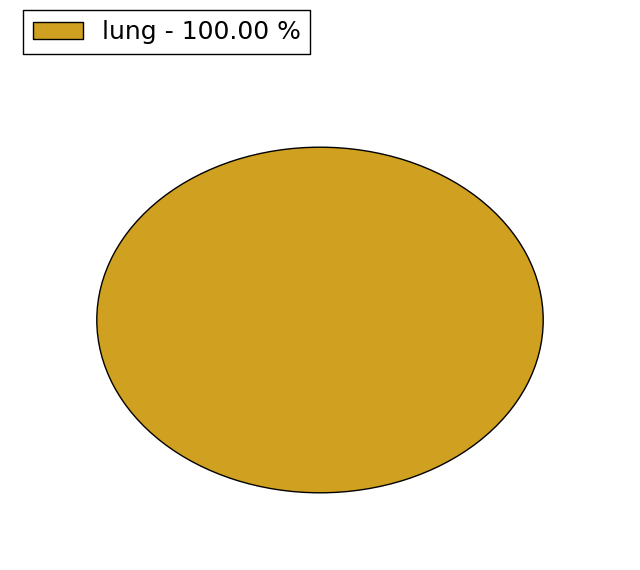
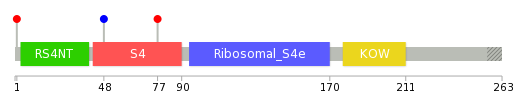
| * We represented just top 10 SNVs. When you move the cursor on each content, you can see more deailed mutation information on the Tooltip. Those are primary_site, primary_histology, mutation(aa), pubmedID. |
| Genomic Position | Mutation(aa) | Unique sampleID count |
| chrY:2709666 | p.M1V | 1 |
| chrY:2712180 | p.L48L | 1 |
| chrY:2712266 | p.R77L | 1 |
| * Copy number data were extracted from TCGA using R package TCGA-Assembler. The URLs of all public data files on TCGA DCC data server were gathered on Jan-05-2015. Function ProcessCNAData in TCGA-Assembler package was used to obtain gene-level copy number value which is calculated as the average copy number of the genomic region of a gene. |
 |
| cf) Tissue ID[Tissue type]: BLCA[Bladder Urothelial Carcinoma], BRCA[Breast invasive carcinoma], CESC[Cervical squamous cell carcinoma and endocervical adenocarcinoma], COAD[Colon adenocarcinoma], GBM[Glioblastoma multiforme], Glioma Low Grade, HNSC[Head and Neck squamous cell carcinoma], KICH[Kidney Chromophobe], KIRC[Kidney renal clear cell carcinoma], KIRP[Kidney renal papillary cell carcinoma], LAML[Acute Myeloid Leukemia], LUAD[Lung adenocarcinoma], LUSC[Lung squamous cell carcinoma], OV[Ovarian serous cystadenocarcinoma ], PAAD[Pancreatic adenocarcinoma], PRAD[Prostate adenocarcinoma], SKCM[Skin Cutaneous Melanoma], STAD[Stomach adenocarcinoma], THCA[Thyroid carcinoma], UCEC[Uterine Corpus Endometrial Carcinoma] |
| Top |
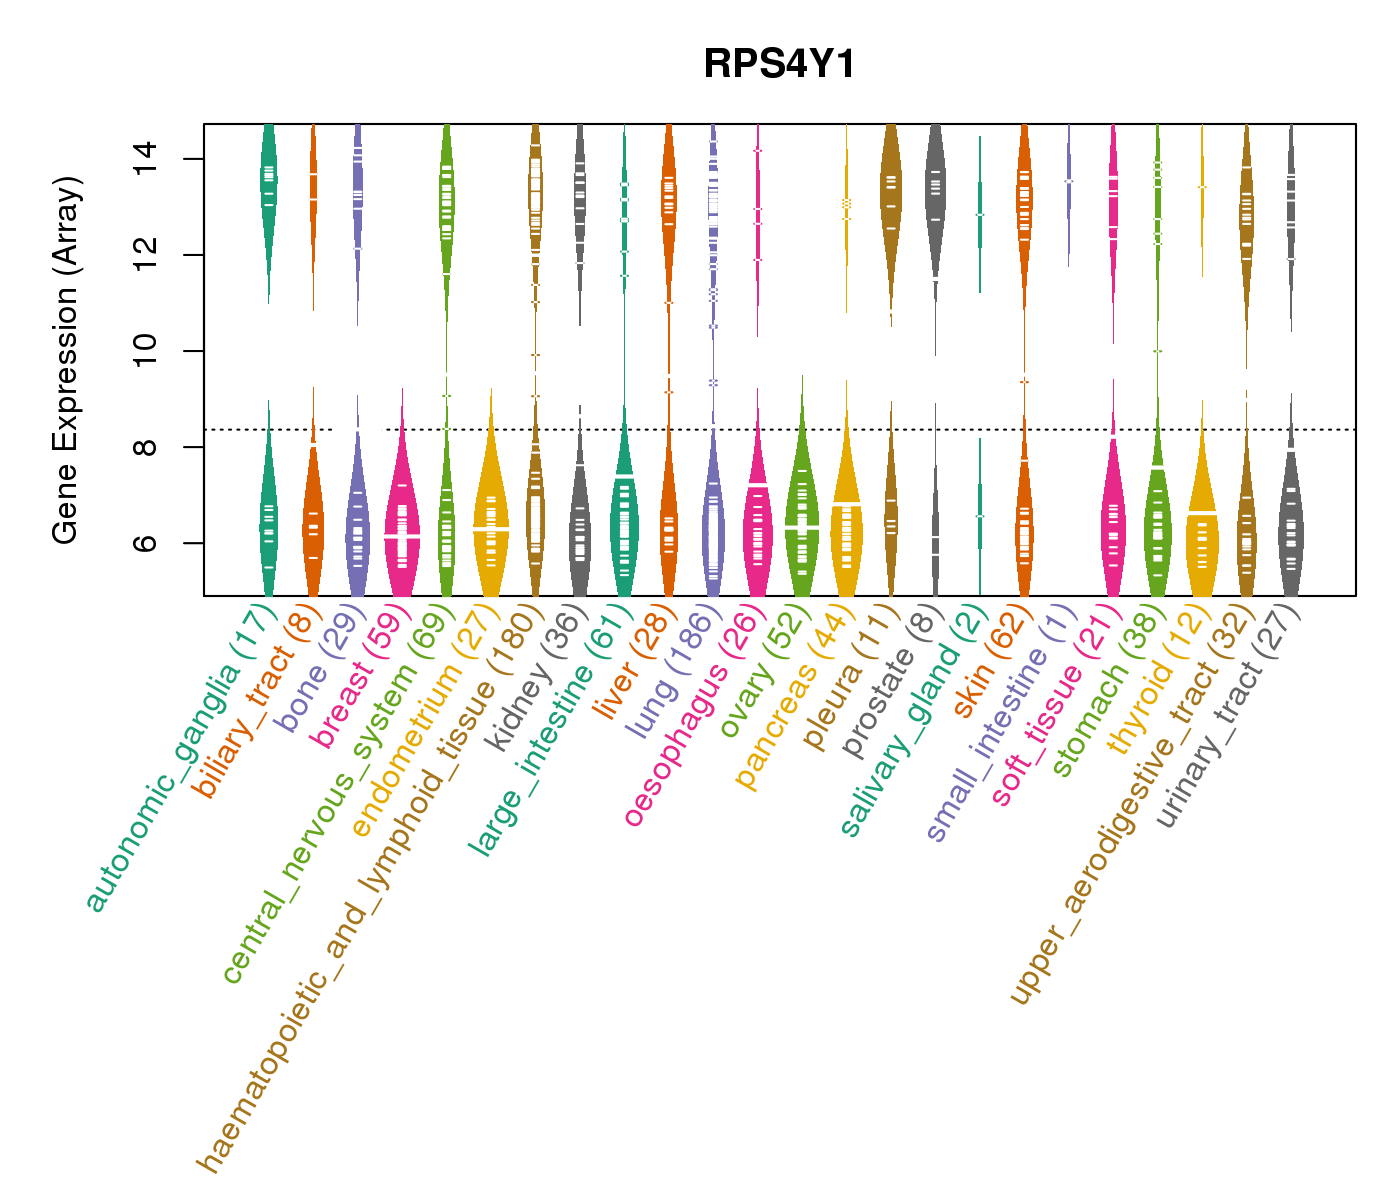
| Gene Expression for RPS4Y1 |
| * CCLE gene expression data were extracted from CCLE_Expression_Entrez_2012-10-18.res: Gene-centric RMA-normalized mRNA expression data. |
 |
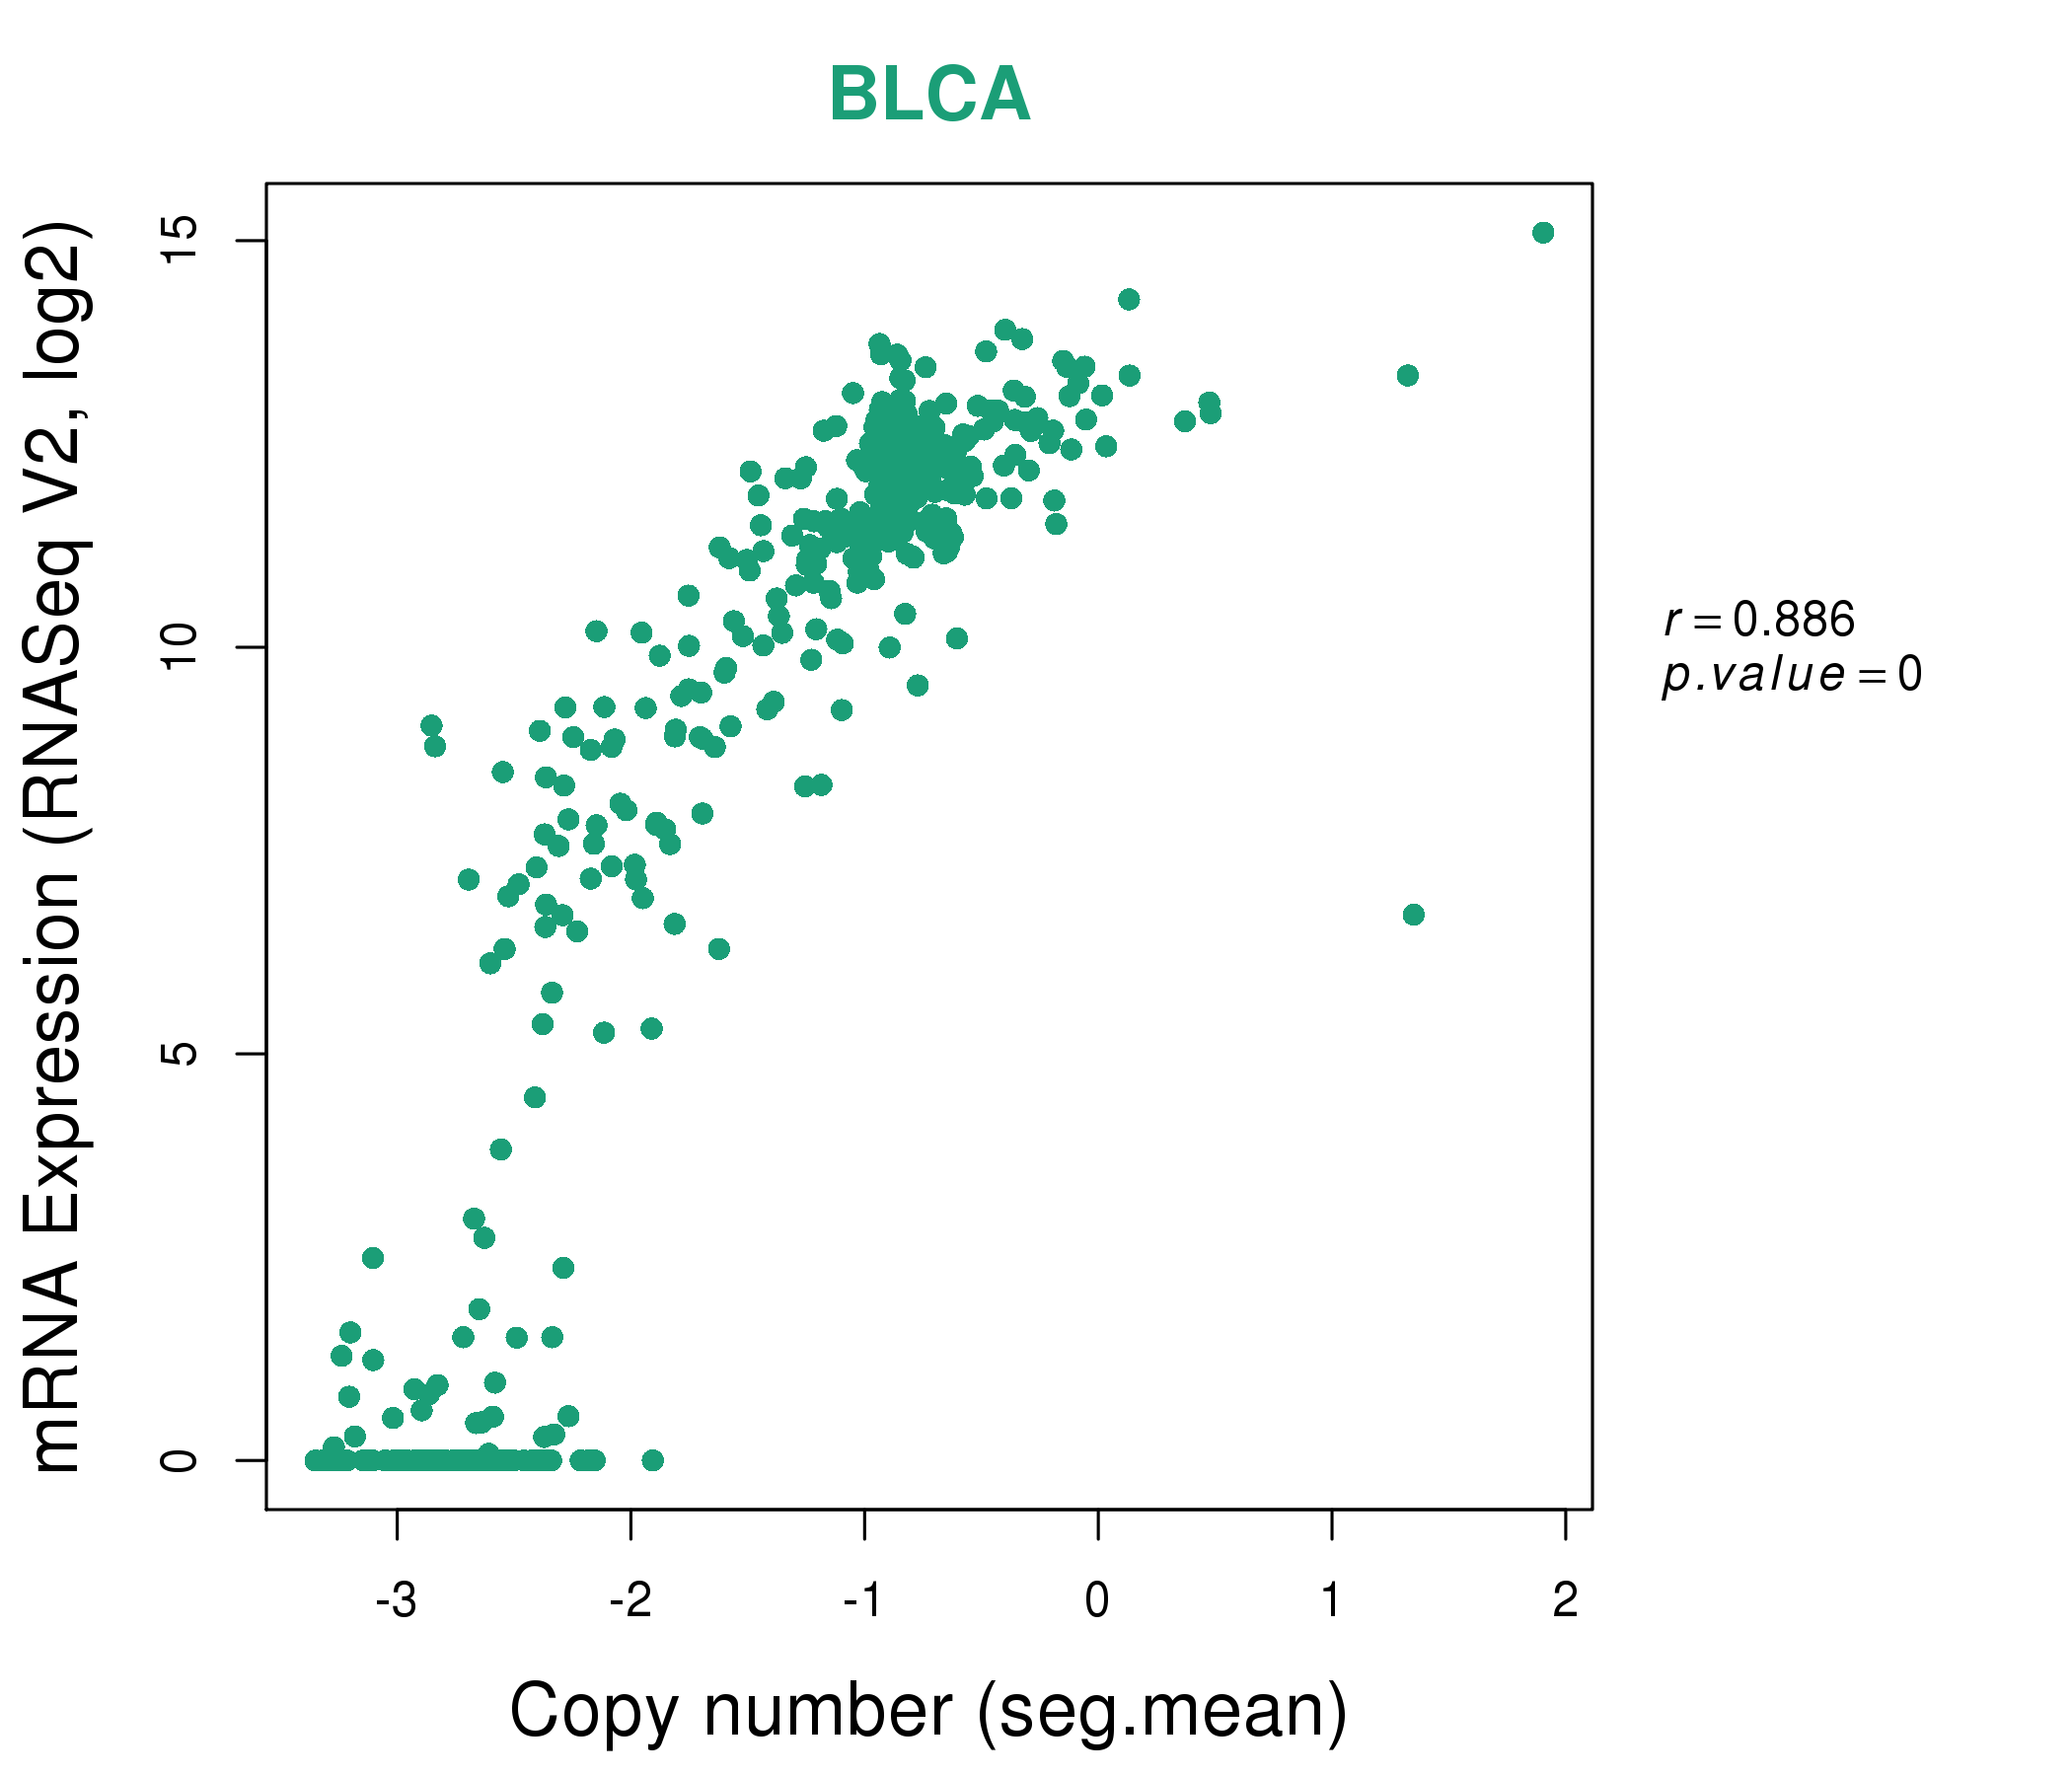
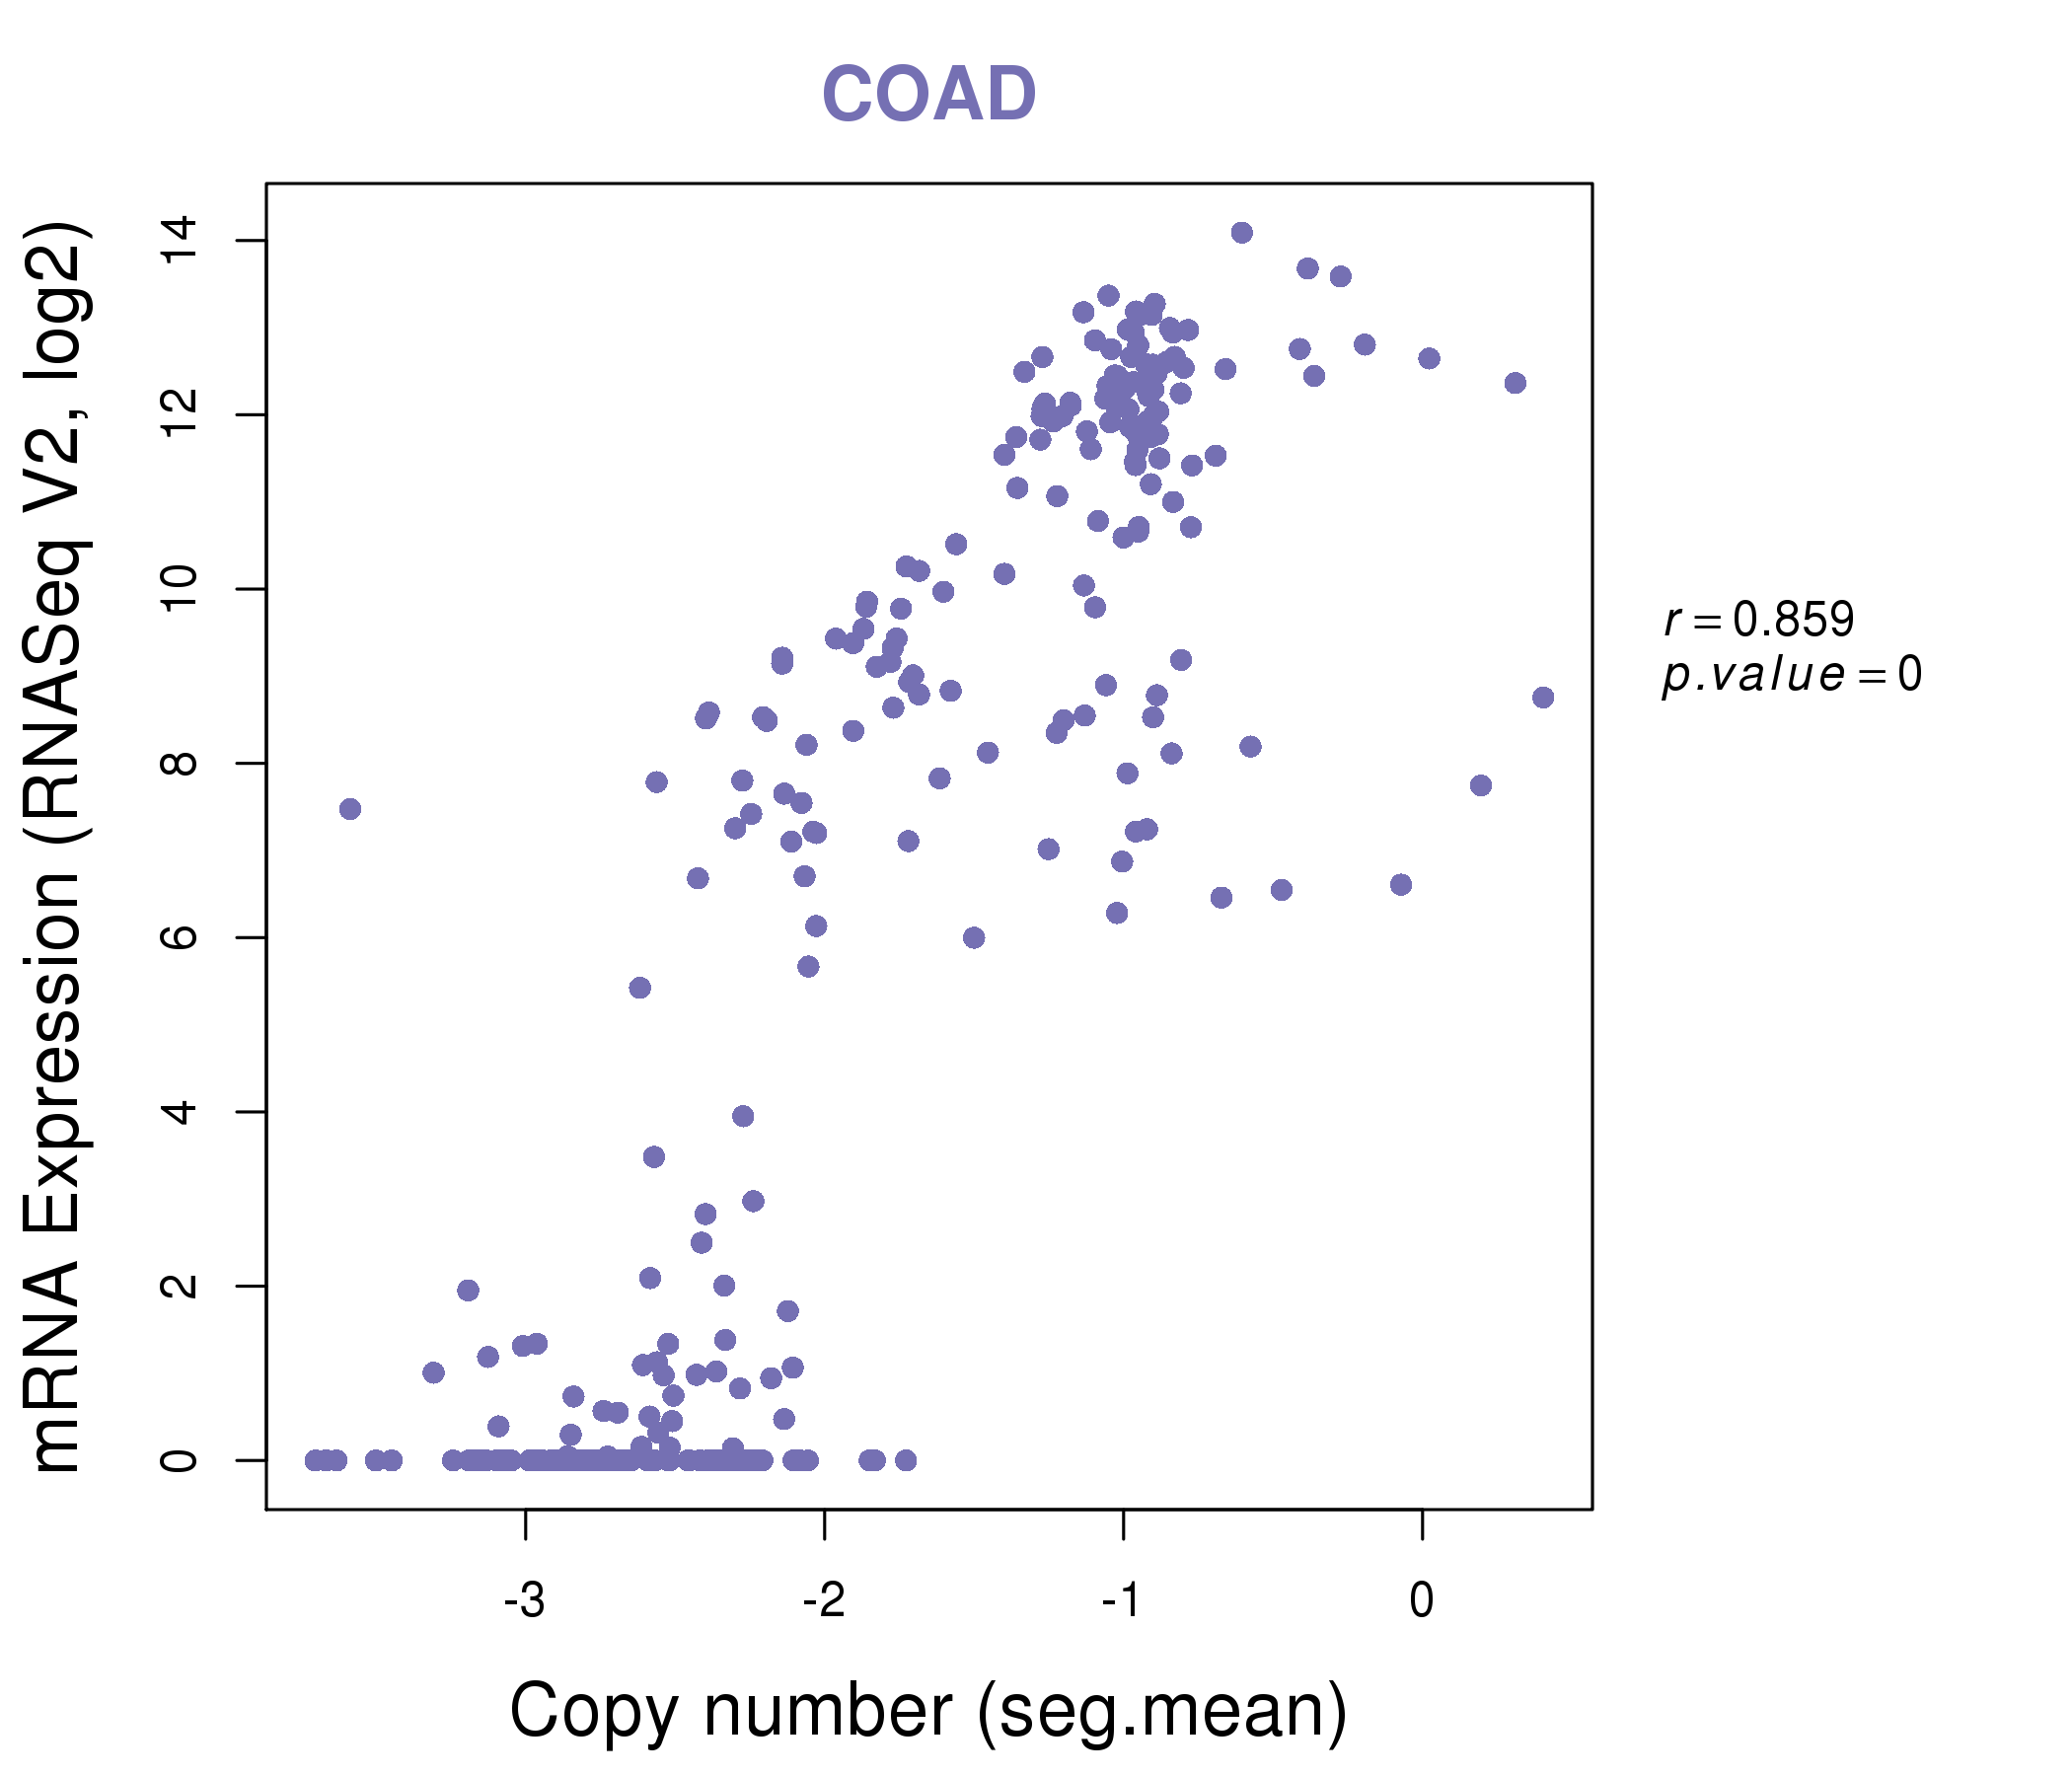
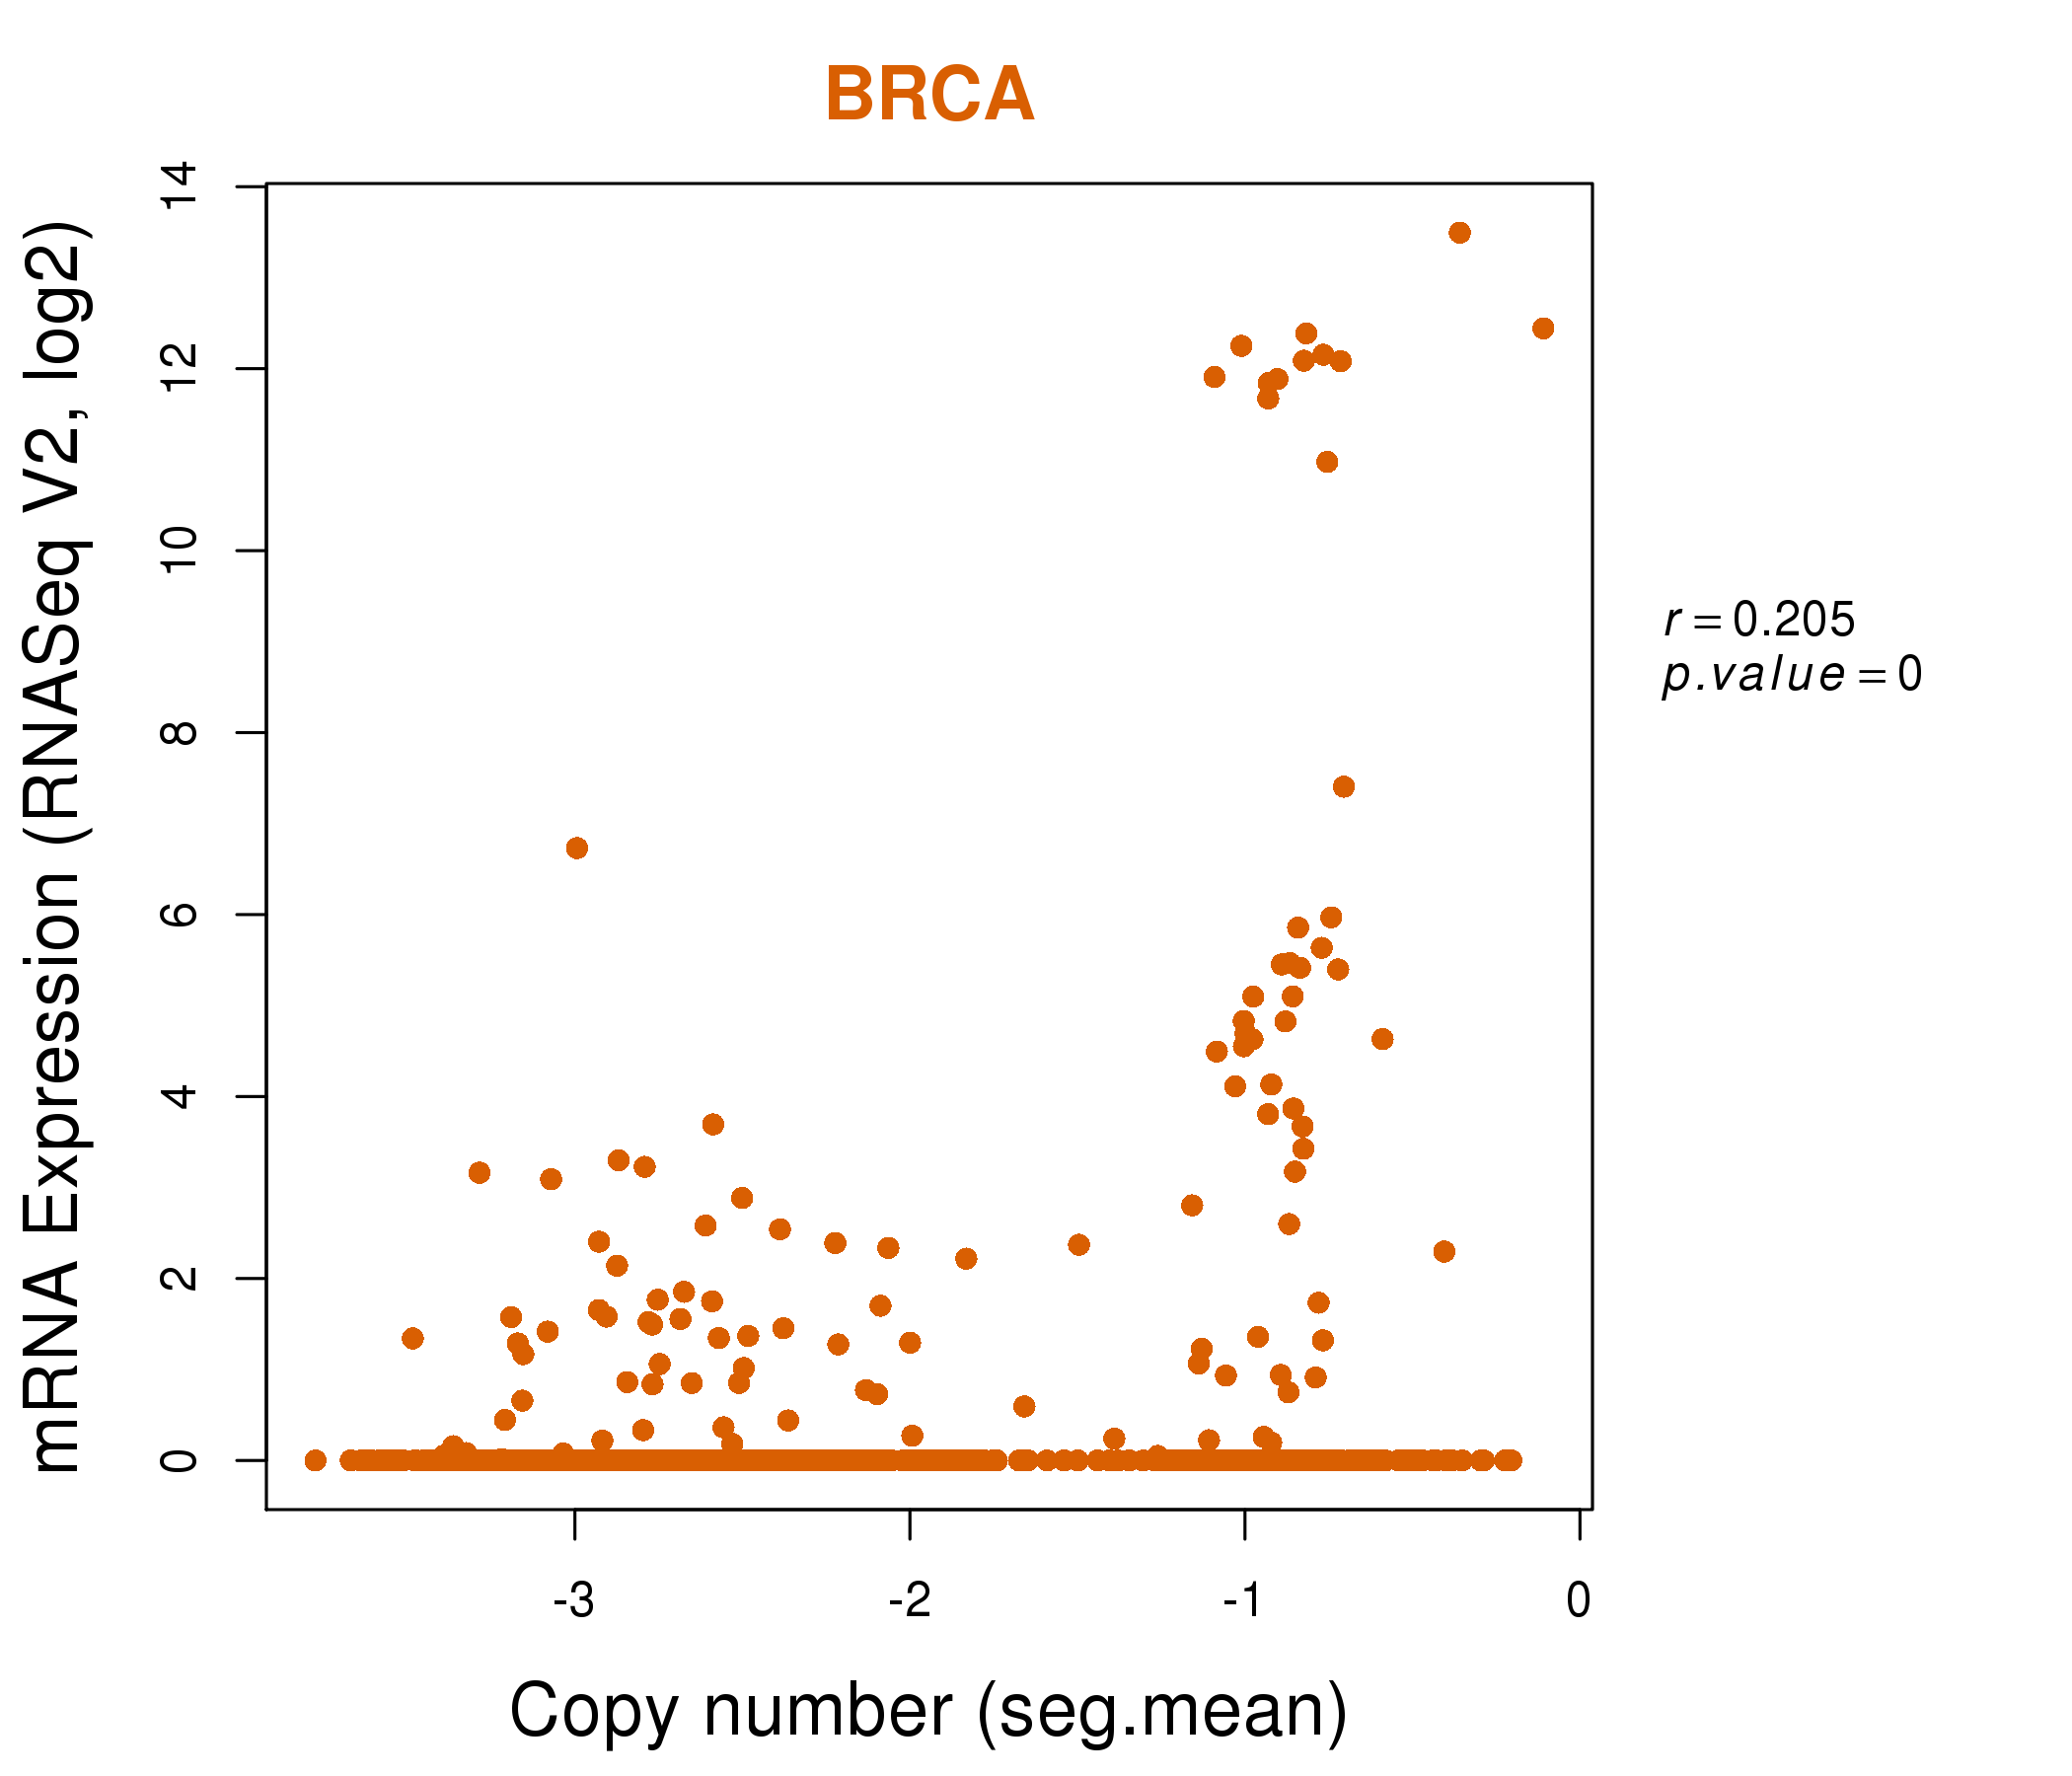
| * Normalized gene expression data of RNASeqV2 was extracted from TCGA using R package TCGA-Assembler. The URLs of all public data files on TCGA DCC data server were gathered at Jan-05-2015. Only eight cancer types have enough normal control samples for differential expression analysis. (t test, adjusted p<0.05 (using Benjamini-Hochberg FDR)) |
 |
| Top |
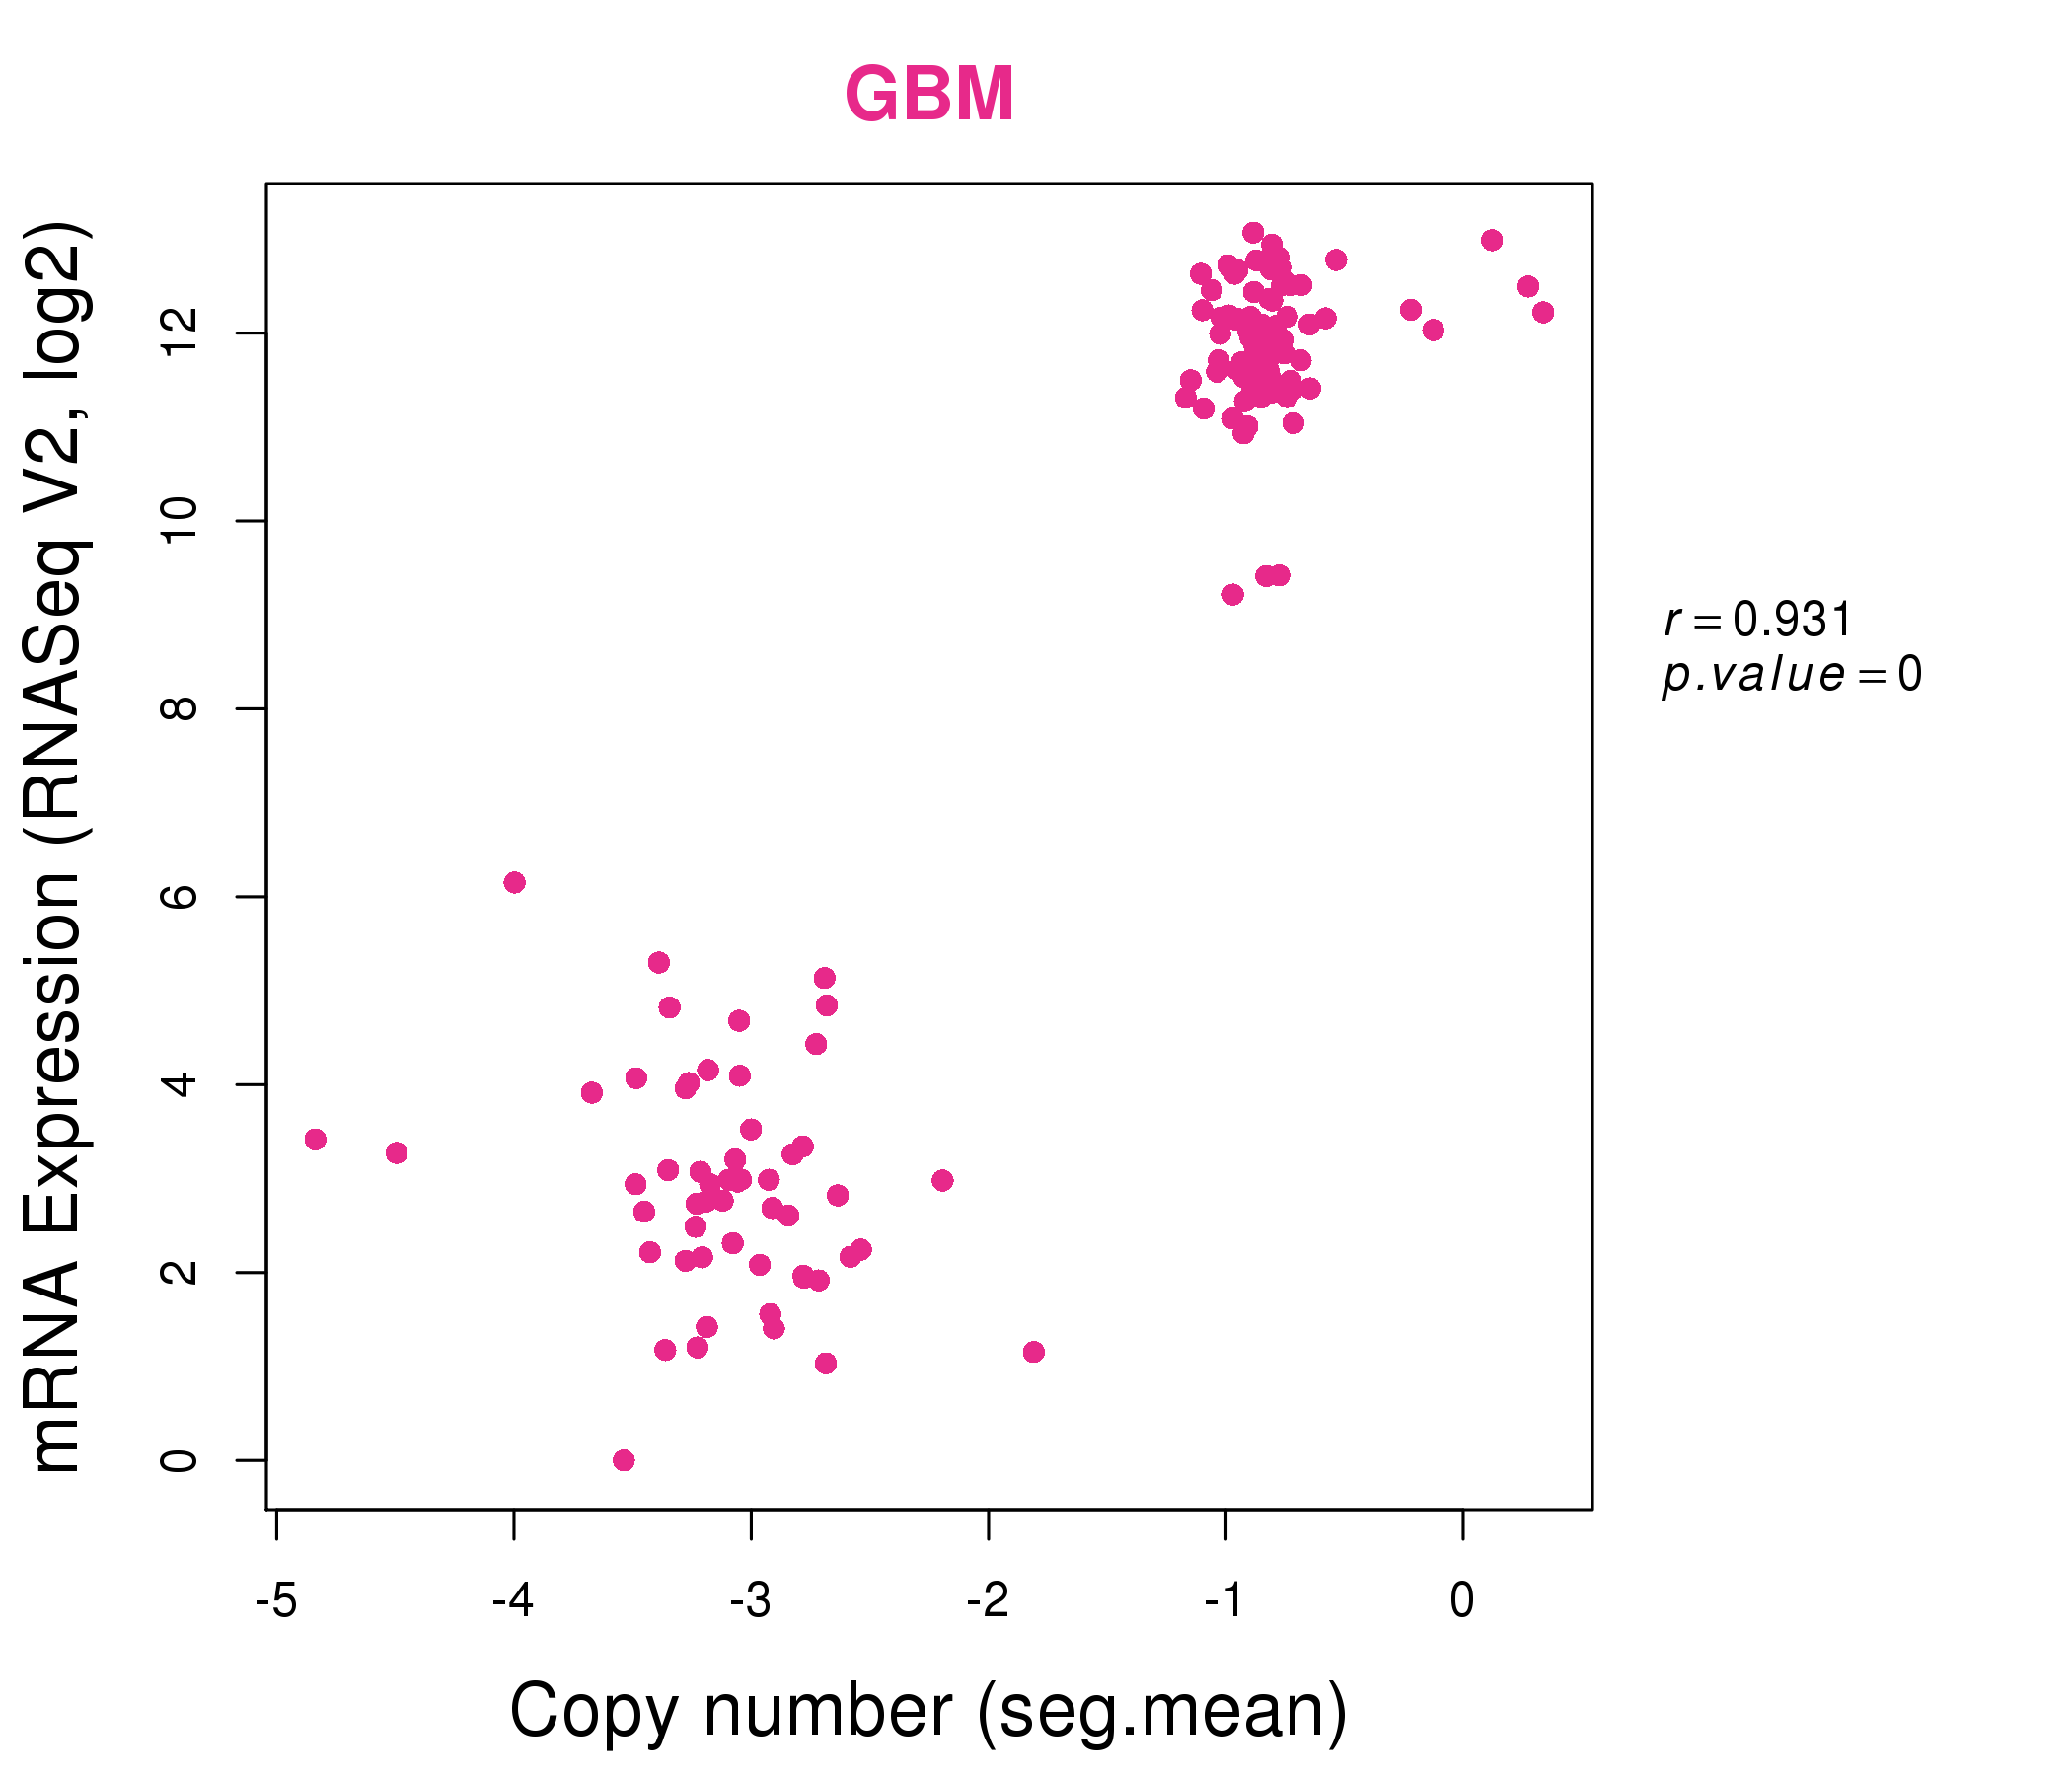
| * This plots show the correlation between CNV and gene expression. |
: Open all plots for all cancer types
 |
|
 |
|
| Top |
| Gene-Gene Network Information |
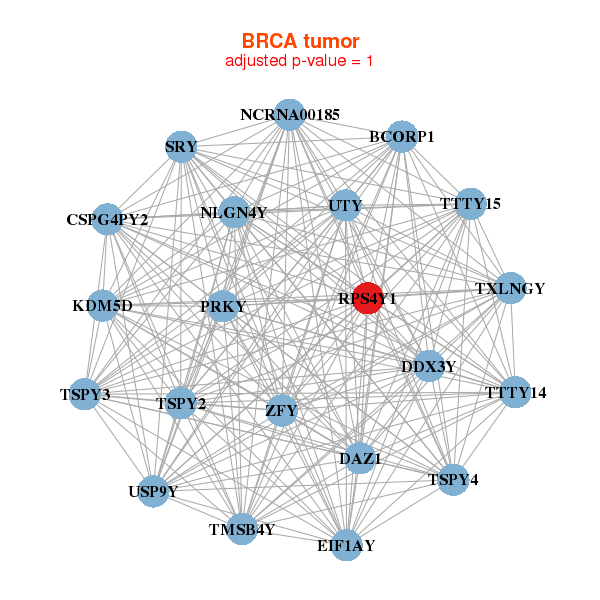
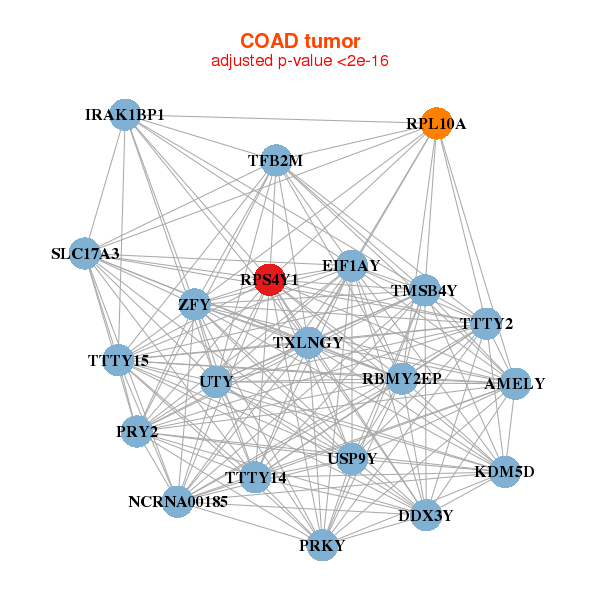
| * Co-Expression network figures were drawn using R package igraph. Only the top 20 genes with the highest correlations were shown. Red circle: input gene, orange circle: cell metabolism gene, sky circle: other gene |
: Open all plots for all cancer types
 |
|
| BCORP1,CSPG4PY2,TXLNGY,DAZ1,DDX3Y,EIF1AY,KDM5D, NCRNA00185,NLGN4Y,PRKY,RPS4Y1,SRY,TMSB4Y,TSPY2, TSPY3,TSPY4,TTTY14,TTTY15,USP9Y,UTY,ZFY | AMELY,BCORP1,TXLNGY,DDX3Y,EIF1AY,FAM41AY1,HSFY2, KDM5D,NCRNA00185,RPS4Y1,SRY,TBL1Y,TMSB4Y,TTTY10, TTTY14,TTTY15,TTTY2,TTTY9B,USP9Y,UTY,ZFY |
 |
|
| AMELY,TXLNGY,DDX3Y,EIF1AY,IRAK1BP1,KDM5D,NCRNA00185, PRKY,PRY2,RBMY2EP,RPL10A,RPS4Y1,SLC17A3,TFB2M, TMSB4Y,TTTY14,TTTY15,TTTY2,USP9Y,UTY,ZFY | BCORP1,TXLNGY,DDX3Y,DDX50,EIF1AY,EIF2B3,KDM5D, LOC441089,LTV1,MTMR6,NCRNA00185,PCDH11Y,PRKY,RPS4Y1, SENP3,TMSB4Y,TTTY14,TTTY15,USP9Y,UTY,ZFY |
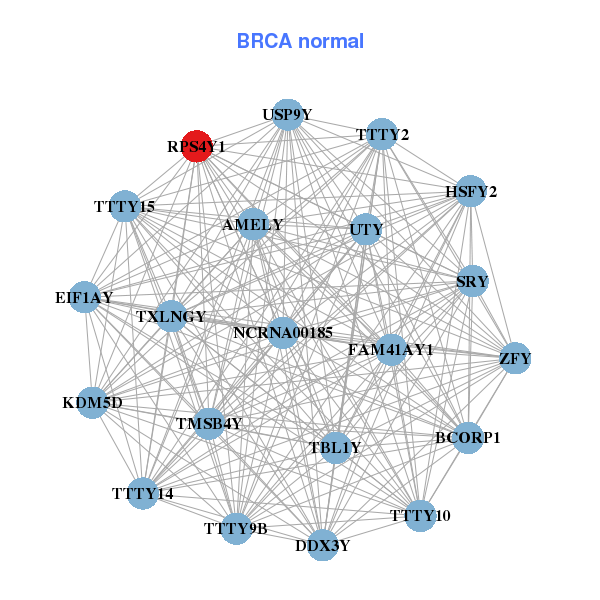
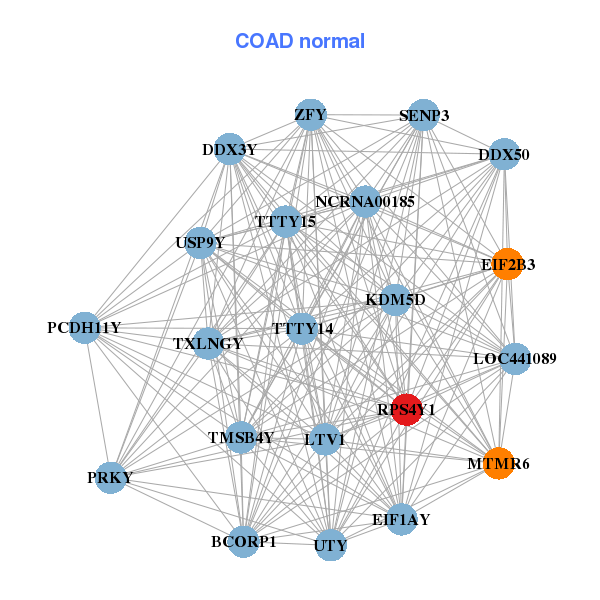
| * Co-Expression network figures were drawn using R package igraph. Only the top 20 genes with the highest correlations were shown. Red circle: input gene, orange circle: cell metabolism gene, sky circle: other gene |
: Open all plots for all cancer types
| Top |
: Open all interacting genes' information including KEGG pathway for all interacting genes from DAVID
| Top |
| Pharmacological Information for RPS4Y1 |
| There's no related Drug. |
| Top |
| Cross referenced IDs for RPS4Y1 |
| * We obtained these cross-references from Uniprot database. It covers 150 different DBs, 18 categories. http://www.uniprot.org/help/cross_references_section |
: Open all cross reference information
|
Copyright © 2016-Present - The Univsersity of Texas Health Science Center at Houston @ |