|
||||||||||||||||||||
| |
| Phenotypic Information (metabolism pathway, cancer, disease, phenome) |
| |
| |
| Gene-Gene Network Information: Co-Expression Network, Interacting Genes & KEGG |
| |
|


| Gene Summary for RPS16 |
| Basic gene info. | Gene symbol | RPS16 |
| Gene name | ribosomal protein S16 | |
| Synonyms | S16 | |
| Cytomap | UCSC genome browser: 19q13.1 | |
| Genomic location | chr19 :39923846-39926618 | |
| Type of gene | protein-coding | |
| RefGenes | NM_001020.4, | |
| Ensembl id | ENSG00000105193 | |
| Description | 40S ribosomal protein S16 | |
| Modification date | 20141207 | |
| dbXrefs | MIM : 603675 | |
| HGNC : HGNC | ||
| Ensembl : ENSG00000105193 | ||
| HPRD : 04724 | ||
| Vega : OTTHUMG00000182972 | ||
| Protein | UniProt: go to UniProt's Cross Reference DB Table | |
| Expression | CleanEX: HS_RPS16 | |
| BioGPS: 6217 | ||
| Gene Expression Atlas: ENSG00000105193 | ||
| The Human Protein Atlas: ENSG00000105193 | ||
| Pathway | NCI Pathway Interaction Database: RPS16 | |
| KEGG: RPS16 | ||
| REACTOME: RPS16 | ||
| ConsensusPathDB | ||
| Pathway Commons: RPS16 | ||
| Metabolism | MetaCyc: RPS16 | |
| HUMANCyc: RPS16 | ||
| Regulation | Ensembl's Regulation: ENSG00000105193 | |
| miRBase: chr19 :39,923,846-39,926,618 | ||
| TargetScan: NM_001020 | ||
| cisRED: ENSG00000105193 | ||
| Context | iHOP: RPS16 | |
| cancer metabolism search in PubMed: RPS16 | ||
| UCL Cancer Institute: RPS16 | ||
| Assigned class in ccmGDB | C | |
| Top |
| Phenotypic Information for RPS16(metabolism pathway, cancer, disease, phenome) |
| Cancer | CGAP: RPS16 |
| Familial Cancer Database: RPS16 | |
| * This gene is included in those cancer gene databases. |
|
|
|
|
|
| . | ||||||||||||||
Oncogene 1 | Significant driver gene in | |||||||||||||||||||
| cf) number; DB name 1 Oncogene; http://nar.oxfordjournals.org/content/35/suppl_1/D721.long, 2 Tumor Suppressor gene; https://bioinfo.uth.edu/TSGene/, 3 Cancer Gene Census; http://www.nature.com/nrc/journal/v4/n3/abs/nrc1299.html, 4 CancerGenes; http://nar.oxfordjournals.org/content/35/suppl_1/D721.long, 5 Network of Cancer Gene; http://ncg.kcl.ac.uk/index.php, 1Therapeutic Vulnerabilities in Cancer; http://cbio.mskcc.org/cancergenomics/statius/ |
| REACTOME_METABOLISM_OF_PROTEINS REACTOME_METABOLISM_OF_MRNA REACTOME_METABOLISM_OF_RNA | |
| OMIM | |
| Orphanet | |
| Disease | KEGG Disease: RPS16 |
| MedGen: RPS16 (Human Medical Genetics with Condition) | |
| ClinVar: RPS16 | |
| Phenotype | MGI: RPS16 (International Mouse Phenotyping Consortium) |
| PhenomicDB: RPS16 | |
| Mutations for RPS16 |
| * Under tables are showing count per each tissue to give us broad intuition about tissue specific mutation patterns.You can go to the detailed page for each mutation database's web site. |
| There's no structural variation information in COSMIC data for this gene. |
| * From mRNA Sanger sequences, Chitars2.0 arranged chimeric transcripts. This table shows RPS16 related fusion information. |
| ID | Head Gene | Tail Gene | Accession | Gene_a | qStart_a | qEnd_a | Chromosome_a | tStart_a | tEnd_a | Gene_a | qStart_a | qEnd_a | Chromosome_a | tStart_a | tEnd_a |
| CB528938 | RPS16 | 18 | 168 | 19 | 39923864 | 39924014 | GABARAPL1 | 165 | 720 | 12 | 10370662 | 10374746 | |
| BG773769 | ACTB | 2 | 272 | 7 | 5568957 | 5570222 | RPS16 | 272 | 538 | 19 | 39924323 | 39926573 | |
| BE843019 | RPS16 | 19 | 249 | 19 | 39923922 | 39924349 | UBD | 250 | 355 | 6 | 827387 | 830817 | |
| BG473536 | ACTB | 2 | 273 | 7 | 5568957 | 5570222 | RPS16 | 273 | 685 | 19 | 39923982 | 39926573 | |
| BE732178 | ACTB | 1 | 248 | 7 | 5568957 | 5570201 | RPS16 | 248 | 764 | 19 | 39923872 | 39926573 | |
| BG998400 | LRRC38 | 25 | 194 | 1 | 13802001 | 13802168 | RPS16 | 195 | 305 | 19 | 39926191 | 39926301 | |
| BE621901 | RPS16 | 1 | 325 | 19 | 39923866 | 39924390 | MCM5 | 321 | 842 | 22 | 35802570 | 35808549 | |
| BU620241 | RPS16 | 18 | 276 | 19 | 39923864 | 39924320 | CCND1 | 274 | 583 | 11 | 69468257 | 69468566 | |
| BE904292 | RPS16 | 1 | 536 | 19 | 39923861 | 39926575 | FBL | 525 | 708 | 19 | 40331337 | 40337034 | |
| AI114445 | RPS16 | 1 | 86 | 19 | 39926336 | 39926560 | FGA | 81 | 754 | 4 | 155506702 | 155507364 | |
| BC070487 | ZNFX1-AS1 | 40 | 571 | 20 | 47895191 | 47905797 | RPS16 | 572 | 832 | 19 | 39924312 | 39926556 | |
| BQ218778 | ZNFX1-AS1 | 37 | 568 | 20 | 47895191 | 47905797 | RPS16 | 569 | 833 | 19 | 39924313 | 39926556 | |
| CF128699 | RPS16 | 19 | 560 | 19 | 39923864 | 39926587 | HIST1H1C | 557 | 689 | 6 | 26056333 | 26056469 | |
| BE906373 | RPS16 | 1 | 502 | 19 | 39923889 | 39926573 | NOL7 | 496 | 569 | 6 | 13615623 | 13615696 | |
| Top |
| There's no copy number variation information in COSMIC data for this gene. |
| Top |
|
 |
| Top |
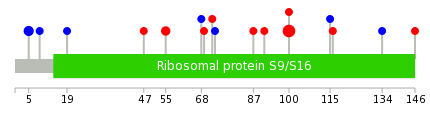
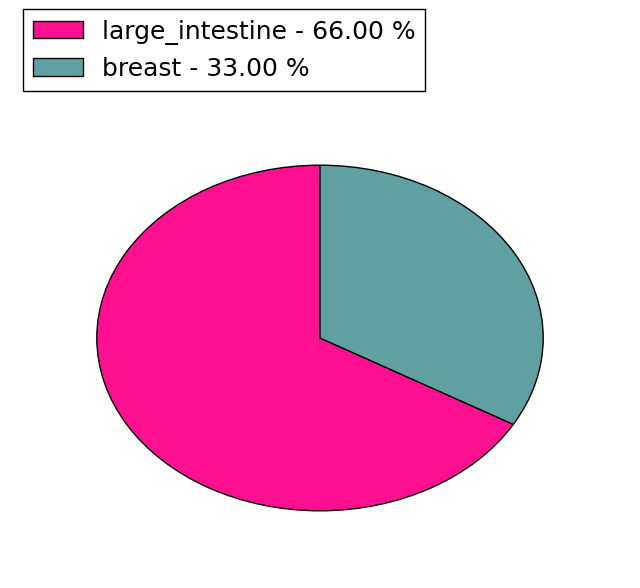
| Stat. for Non-Synonymous SNVs (# total SNVs=19) | (# total SNVs=3) |
 |  |
(# total SNVs=0) | (# total SNVs=0) |
| Top |
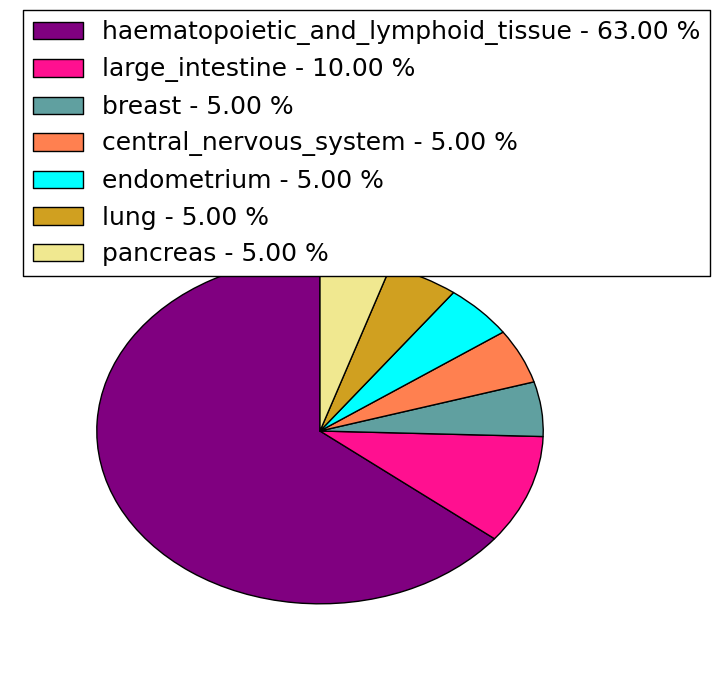
| * When you move the cursor on each content, you can see more deailed mutation information on the Tooltip. Those are primary_site,primary_histology,mutation(aa),pubmedID. |
| GRCh37 position | Mutation(aa) | Unique sampleID count |
| chr19:39924056-39924056 | p.V100M | 11 |
| chr19:39926521-39926521 | p.G5G | 3 |
| chr19:39924156-39924156 | p.? | 2 |
| chr19:39924389-39924389 | p.V55I | 2 |
| chr19:39926340-39926340 | p.A19A | 1 |
| chr19:39926509-39926509 | p.S9S | 1 |
| chr19:39924185-39924185 | p.A91V | 1 |
| chr19:39924197-39924197 | p.S87F | 1 |
| chr19:39924333-39924333 | p.K73K | 1 |
| chr19:39924338-39924338 | p.V72L | 1 |
| Top |
|
 |
| Point Mutation/ Tissue ID | 1 | 2 | 3 | 4 | 5 | 6 | 7 | 8 | 9 | 10 | 11 | 12 | 13 | 14 | 15 | 16 | 17 | 18 | 19 | 20 |
| # sample | 1 | 2 | 1 | 2 | 3 | 1 | ||||||||||||||
| # mutation | 1 | 2 | 1 | 2 | 3 | 1 | ||||||||||||||
| nonsynonymous SNV | 1 | 1 | 1 | 1 | 1 | |||||||||||||||
| synonymous SNV | 1 | 1 | 1 | 2 |
| cf) Tissue ID; Tissue type (1; BLCA[Bladder Urothelial Carcinoma], 2; BRCA[Breast invasive carcinoma], 3; CESC[Cervical squamous cell carcinoma and endocervical adenocarcinoma], 4; COAD[Colon adenocarcinoma], 5; GBM[Glioblastoma multiforme], 6; Glioma Low Grade, 7; HNSC[Head and Neck squamous cell carcinoma], 8; KICH[Kidney Chromophobe], 9; KIRC[Kidney renal clear cell carcinoma], 10; KIRP[Kidney renal papillary cell carcinoma], 11; LAML[Acute Myeloid Leukemia], 12; LUAD[Lung adenocarcinoma], 13; LUSC[Lung squamous cell carcinoma], 14; OV[Ovarian serous cystadenocarcinoma ], 15; PAAD[Pancreatic adenocarcinoma], 16; PRAD[Prostate adenocarcinoma], 17; SKCM[Skin Cutaneous Melanoma], 18:STAD[Stomach adenocarcinoma], 19:THCA[Thyroid carcinoma], 20:UCEC[Uterine Corpus Endometrial Carcinoma]) |
| Top |
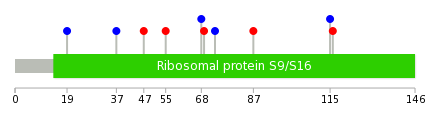
| * We represented just top 10 SNVs. When you move the cursor on each content, you can see more deailed mutation information on the Tooltip. Those are primary_site, primary_histology, mutation(aa), pubmedID. |
| Genomic Position | Mutation(aa) | Unique sampleID count |
| chr19:39924348 | p.R37R | 1 |
| chr19:39924389 | p.A19A | 1 |
| chr19:39926258 | p.D116Y | 1 |
| chr19:39926288 | p.Y115Y | 1 |
| chr19:39926340 | p.S87F | 1 |
| chr19:39924008 | p.K73K | 1 |
| chr19:39924009 | p.R69L | 1 |
| chr19:39924197 | p.I68I | 1 |
| chr19:39924333 | p.V55I | 1 |
| chr19:39924346 | p.L47V | 1 |
| * Copy number data were extracted from TCGA using R package TCGA-Assembler. The URLs of all public data files on TCGA DCC data server were gathered on Jan-05-2015. Function ProcessCNAData in TCGA-Assembler package was used to obtain gene-level copy number value which is calculated as the average copy number of the genomic region of a gene. |
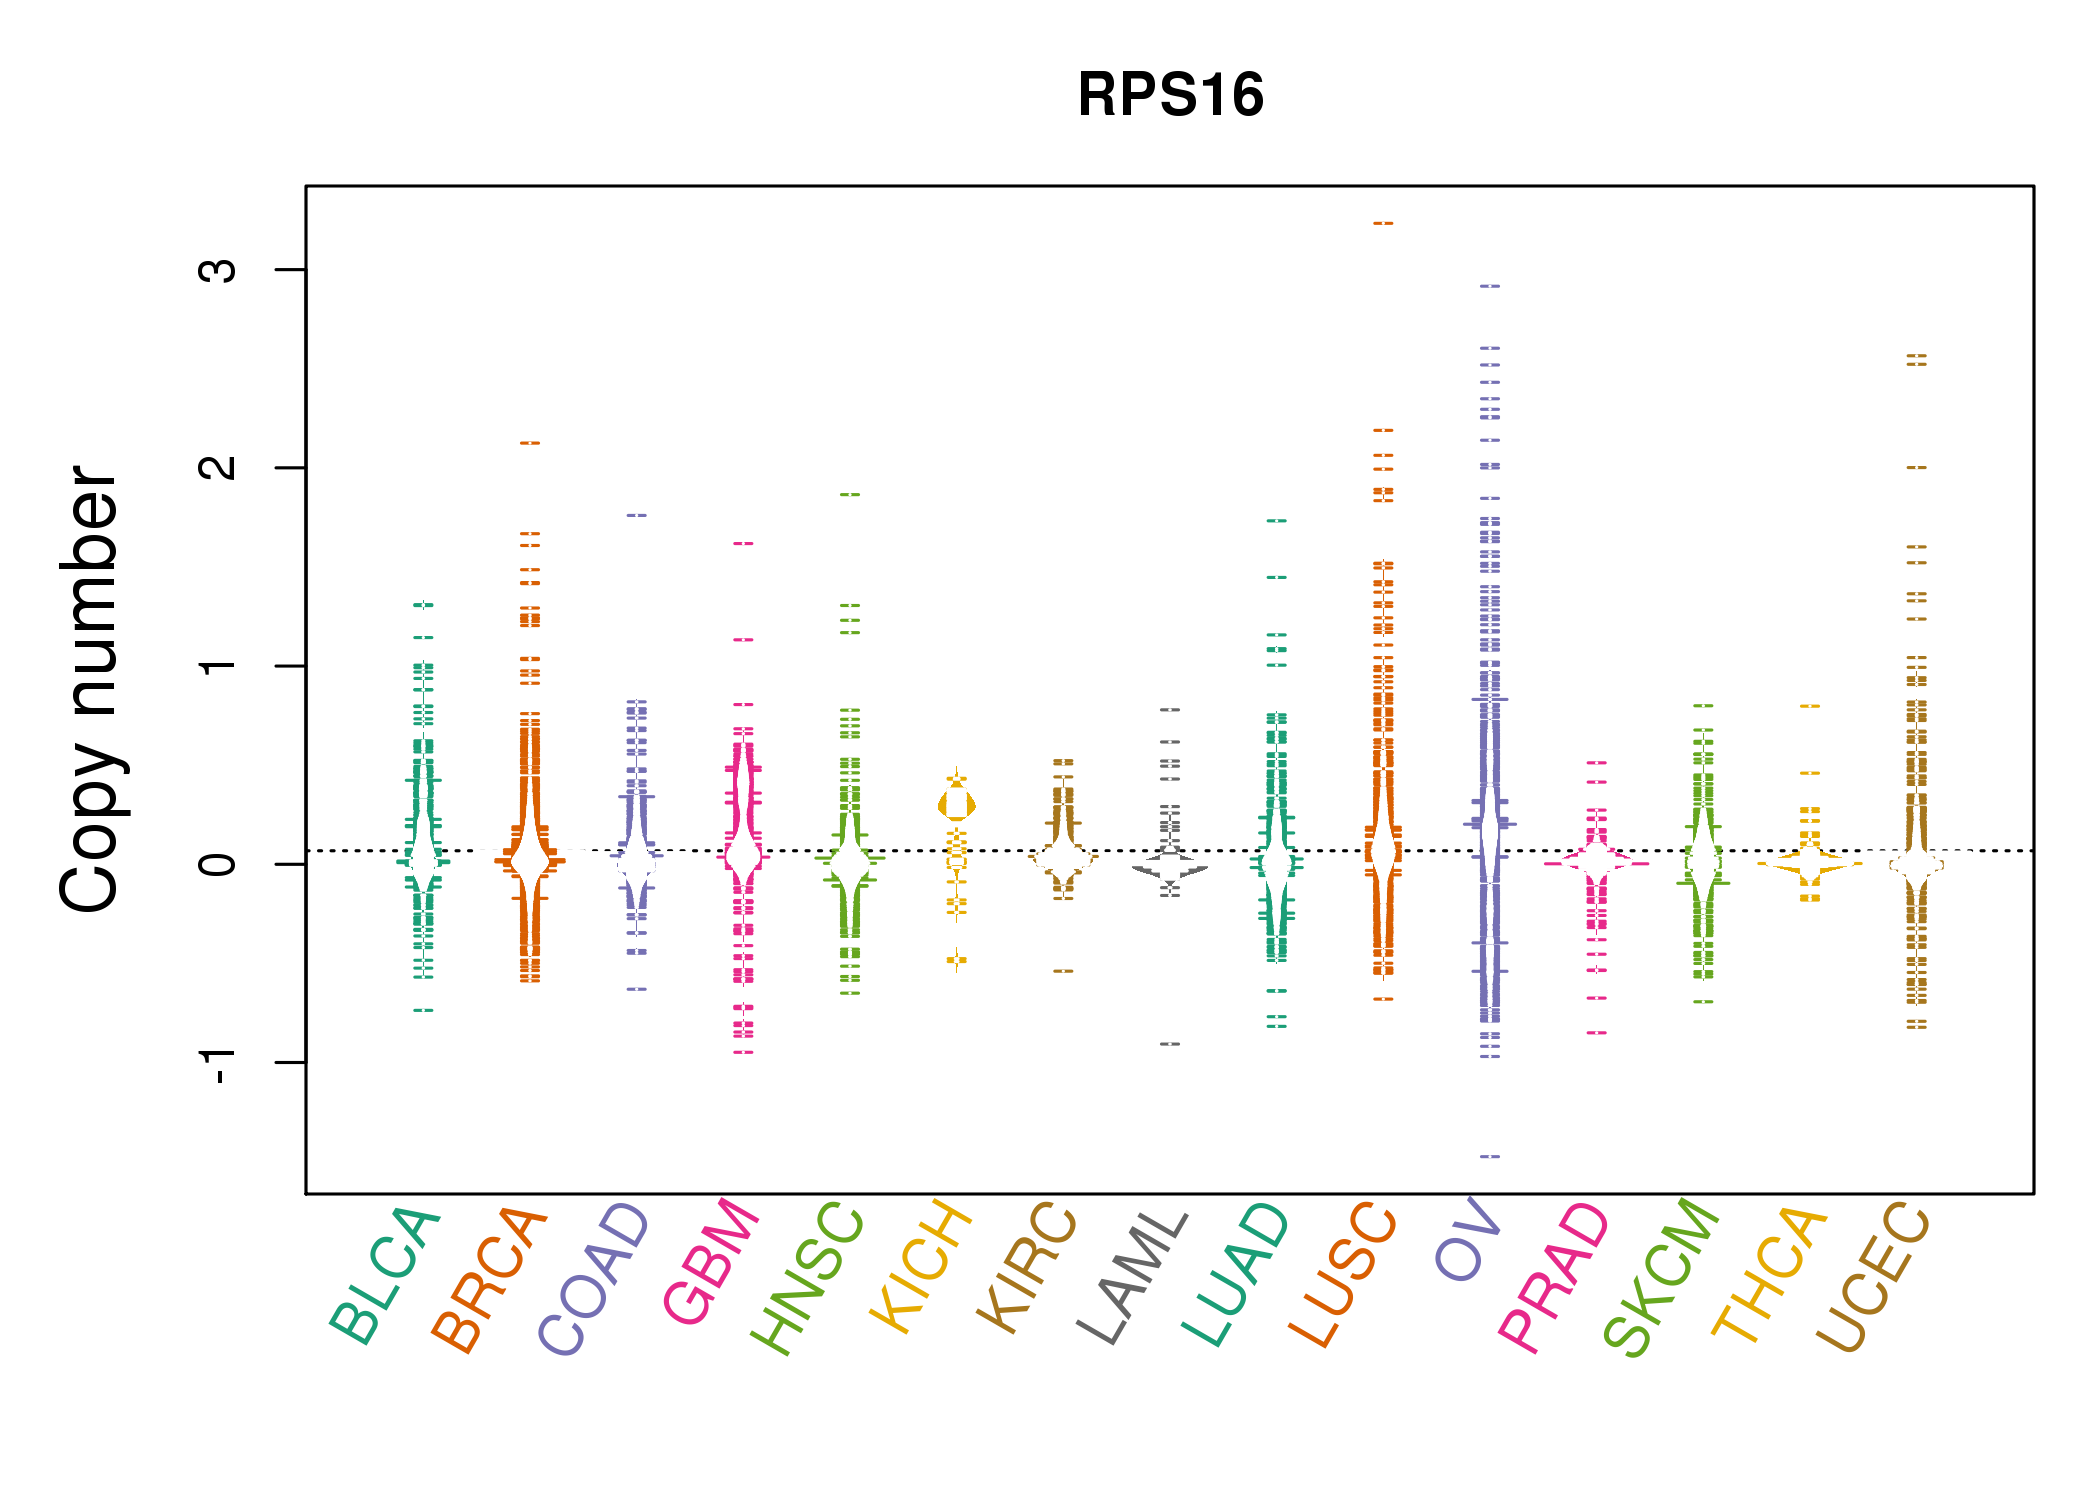 |
| cf) Tissue ID[Tissue type]: BLCA[Bladder Urothelial Carcinoma], BRCA[Breast invasive carcinoma], CESC[Cervical squamous cell carcinoma and endocervical adenocarcinoma], COAD[Colon adenocarcinoma], GBM[Glioblastoma multiforme], Glioma Low Grade, HNSC[Head and Neck squamous cell carcinoma], KICH[Kidney Chromophobe], KIRC[Kidney renal clear cell carcinoma], KIRP[Kidney renal papillary cell carcinoma], LAML[Acute Myeloid Leukemia], LUAD[Lung adenocarcinoma], LUSC[Lung squamous cell carcinoma], OV[Ovarian serous cystadenocarcinoma ], PAAD[Pancreatic adenocarcinoma], PRAD[Prostate adenocarcinoma], SKCM[Skin Cutaneous Melanoma], STAD[Stomach adenocarcinoma], THCA[Thyroid carcinoma], UCEC[Uterine Corpus Endometrial Carcinoma] |
| Top |
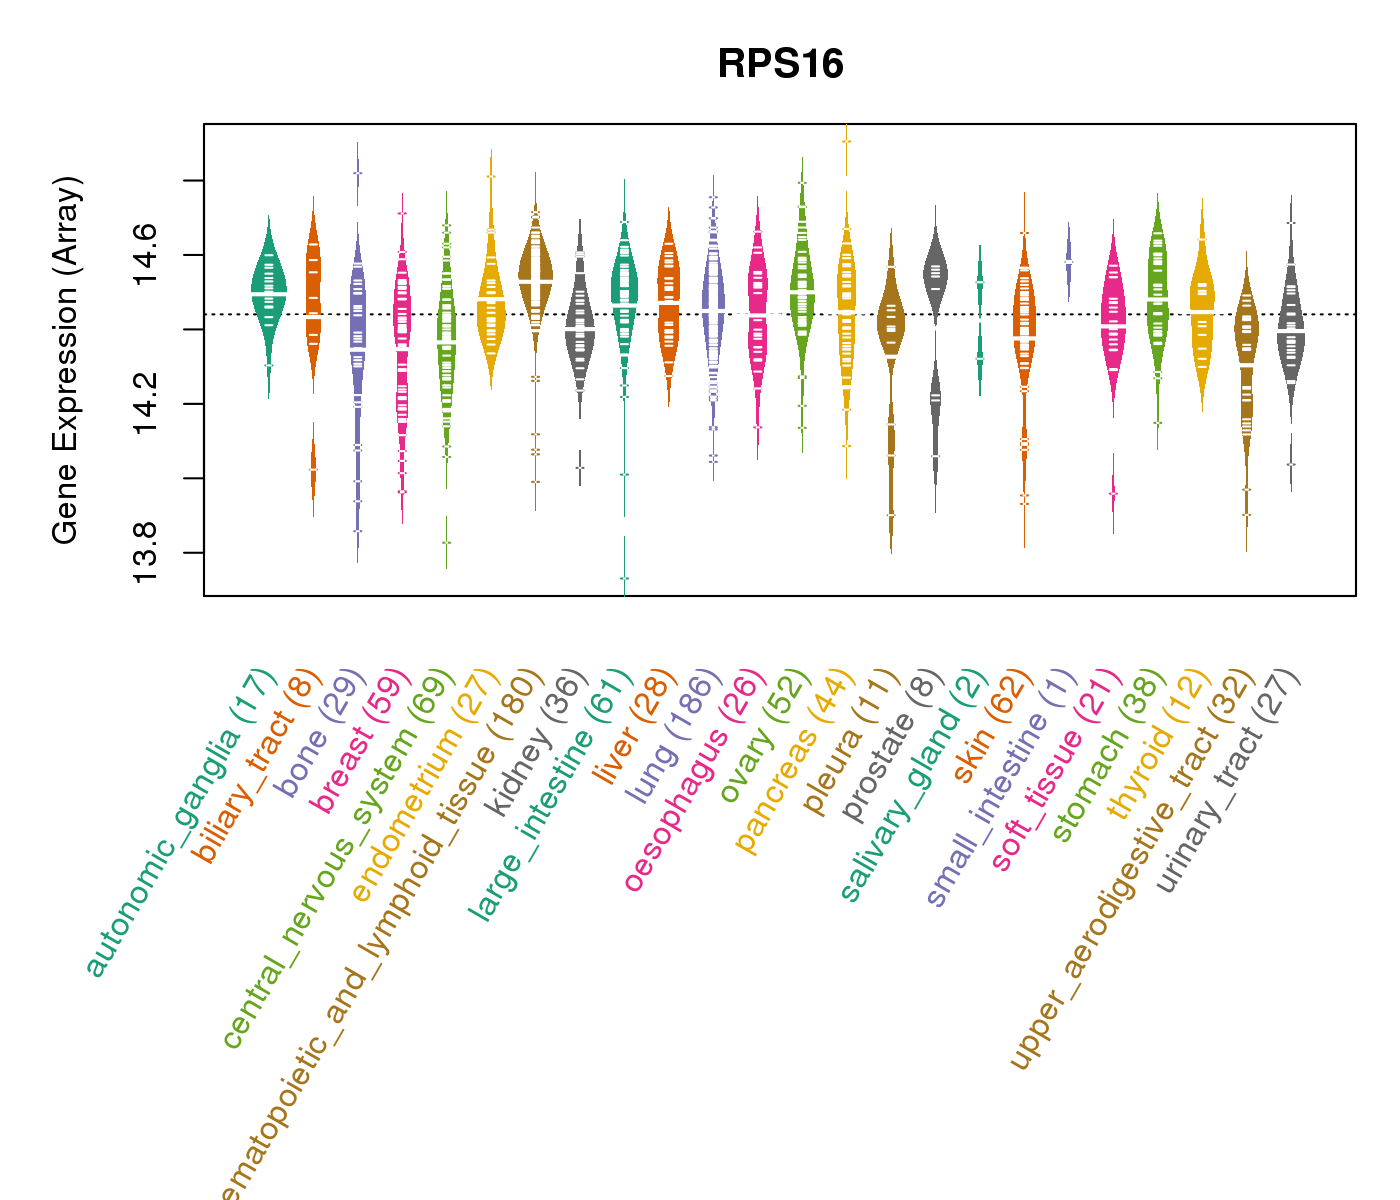
| Gene Expression for RPS16 |
| * CCLE gene expression data were extracted from CCLE_Expression_Entrez_2012-10-18.res: Gene-centric RMA-normalized mRNA expression data. |
 |
| * Normalized gene expression data of RNASeqV2 was extracted from TCGA using R package TCGA-Assembler. The URLs of all public data files on TCGA DCC data server were gathered at Jan-05-2015. Only eight cancer types have enough normal control samples for differential expression analysis. (t test, adjusted p<0.05 (using Benjamini-Hochberg FDR)) |
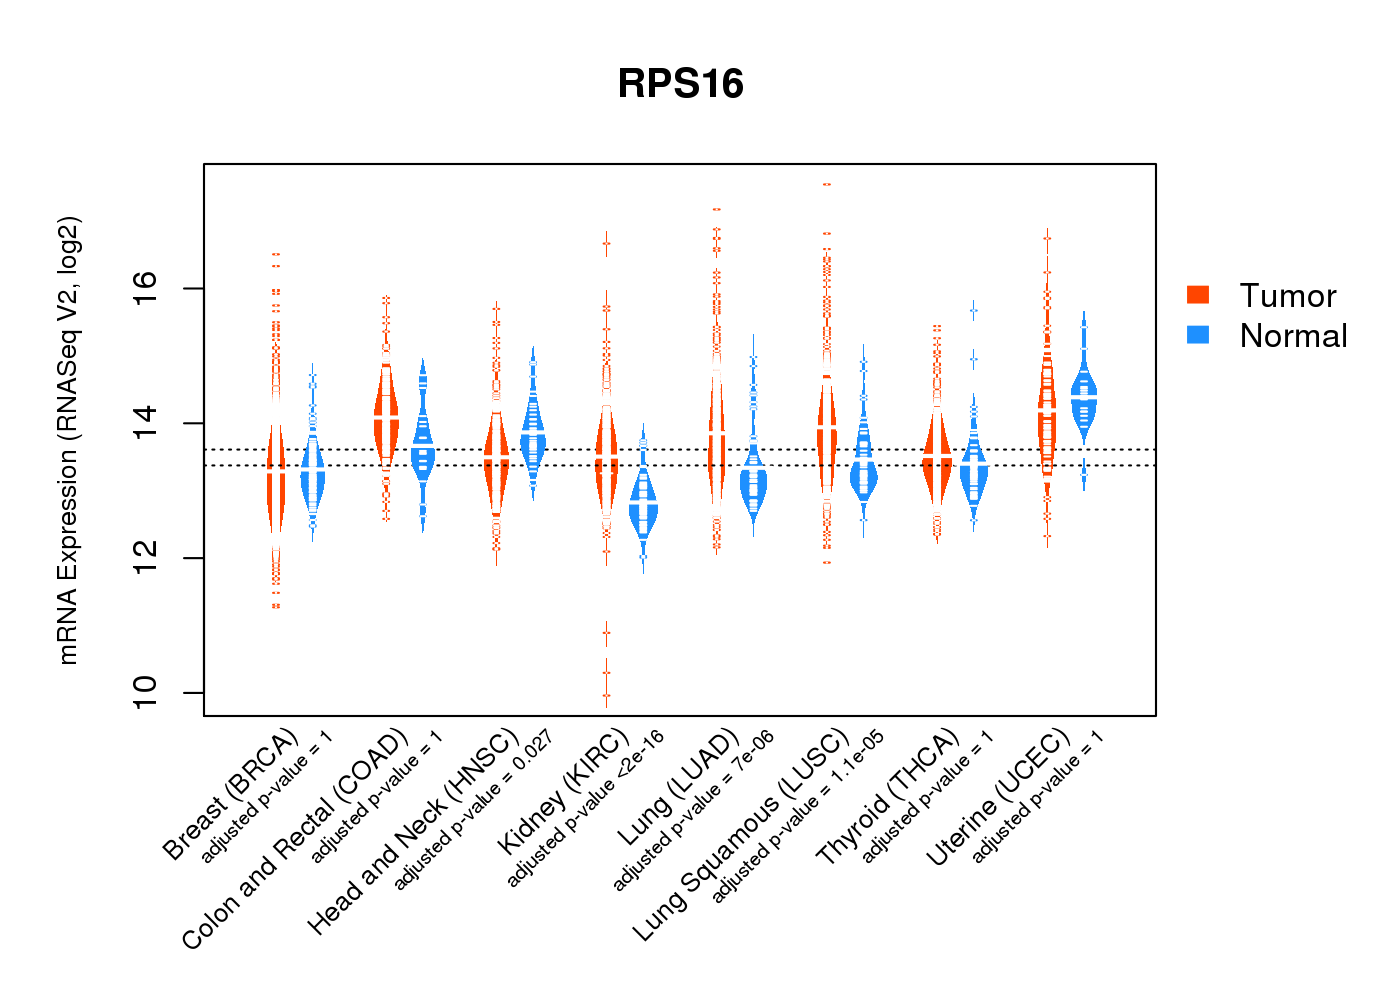 |
| Top |
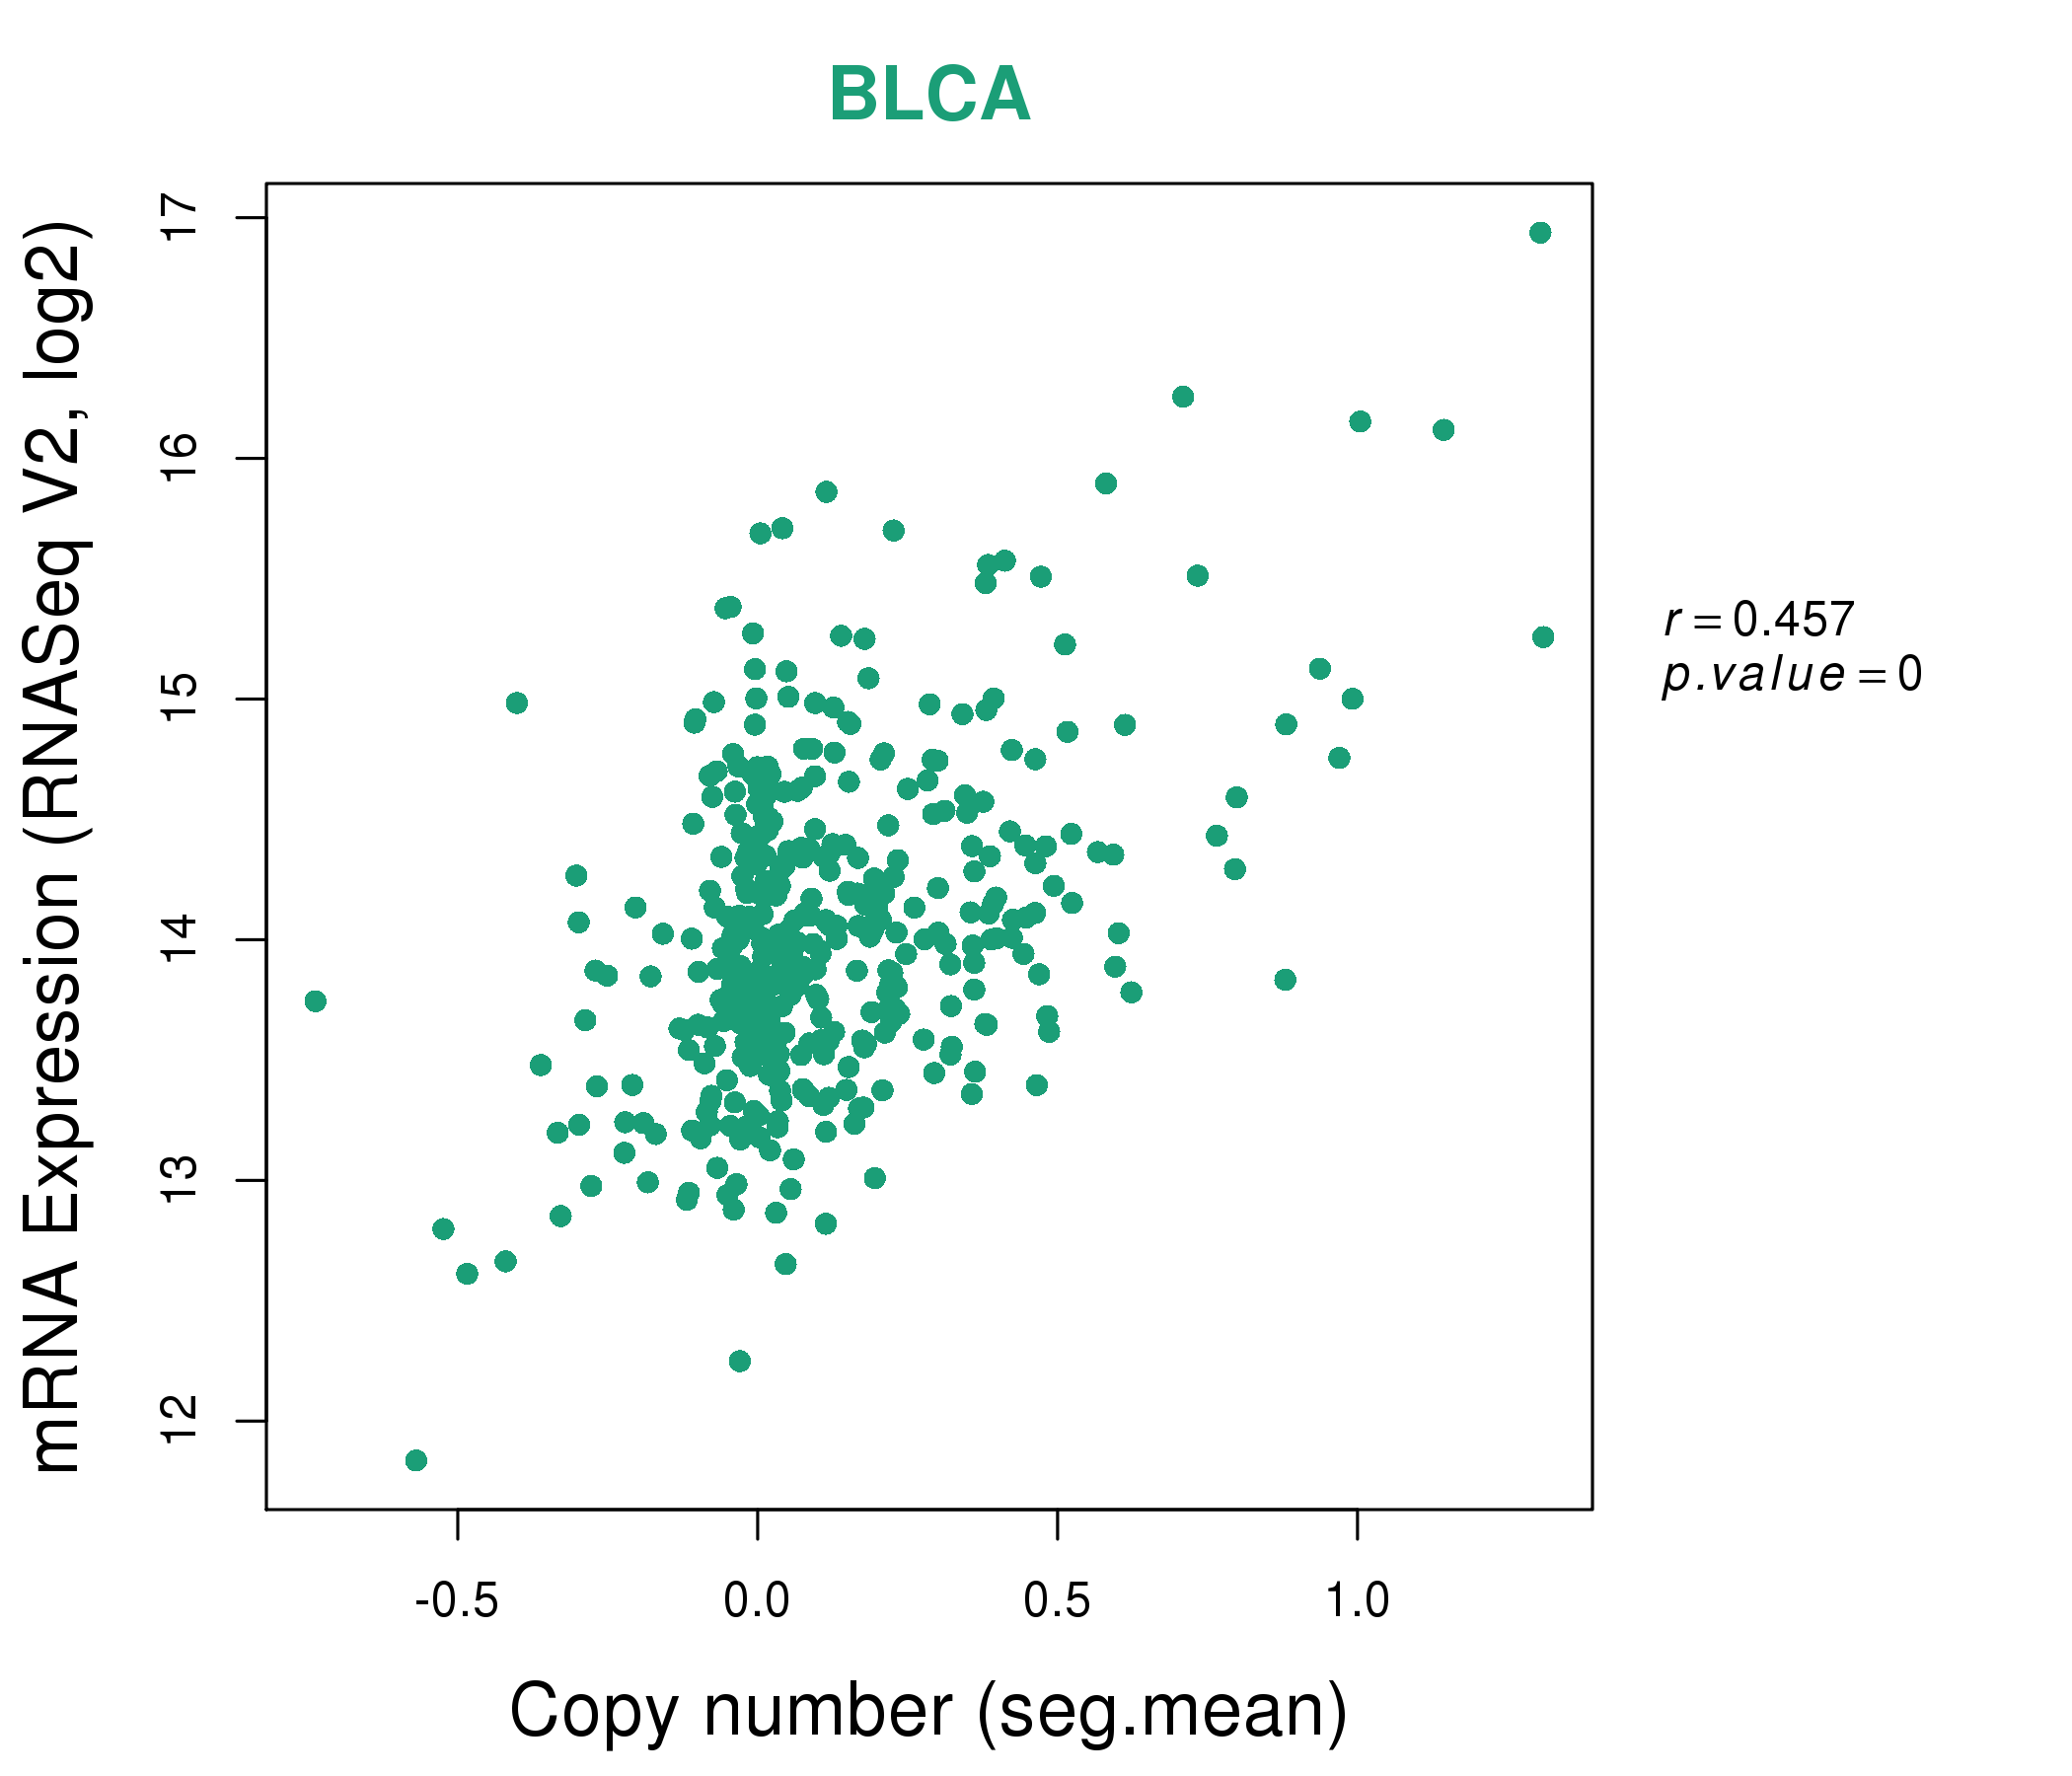
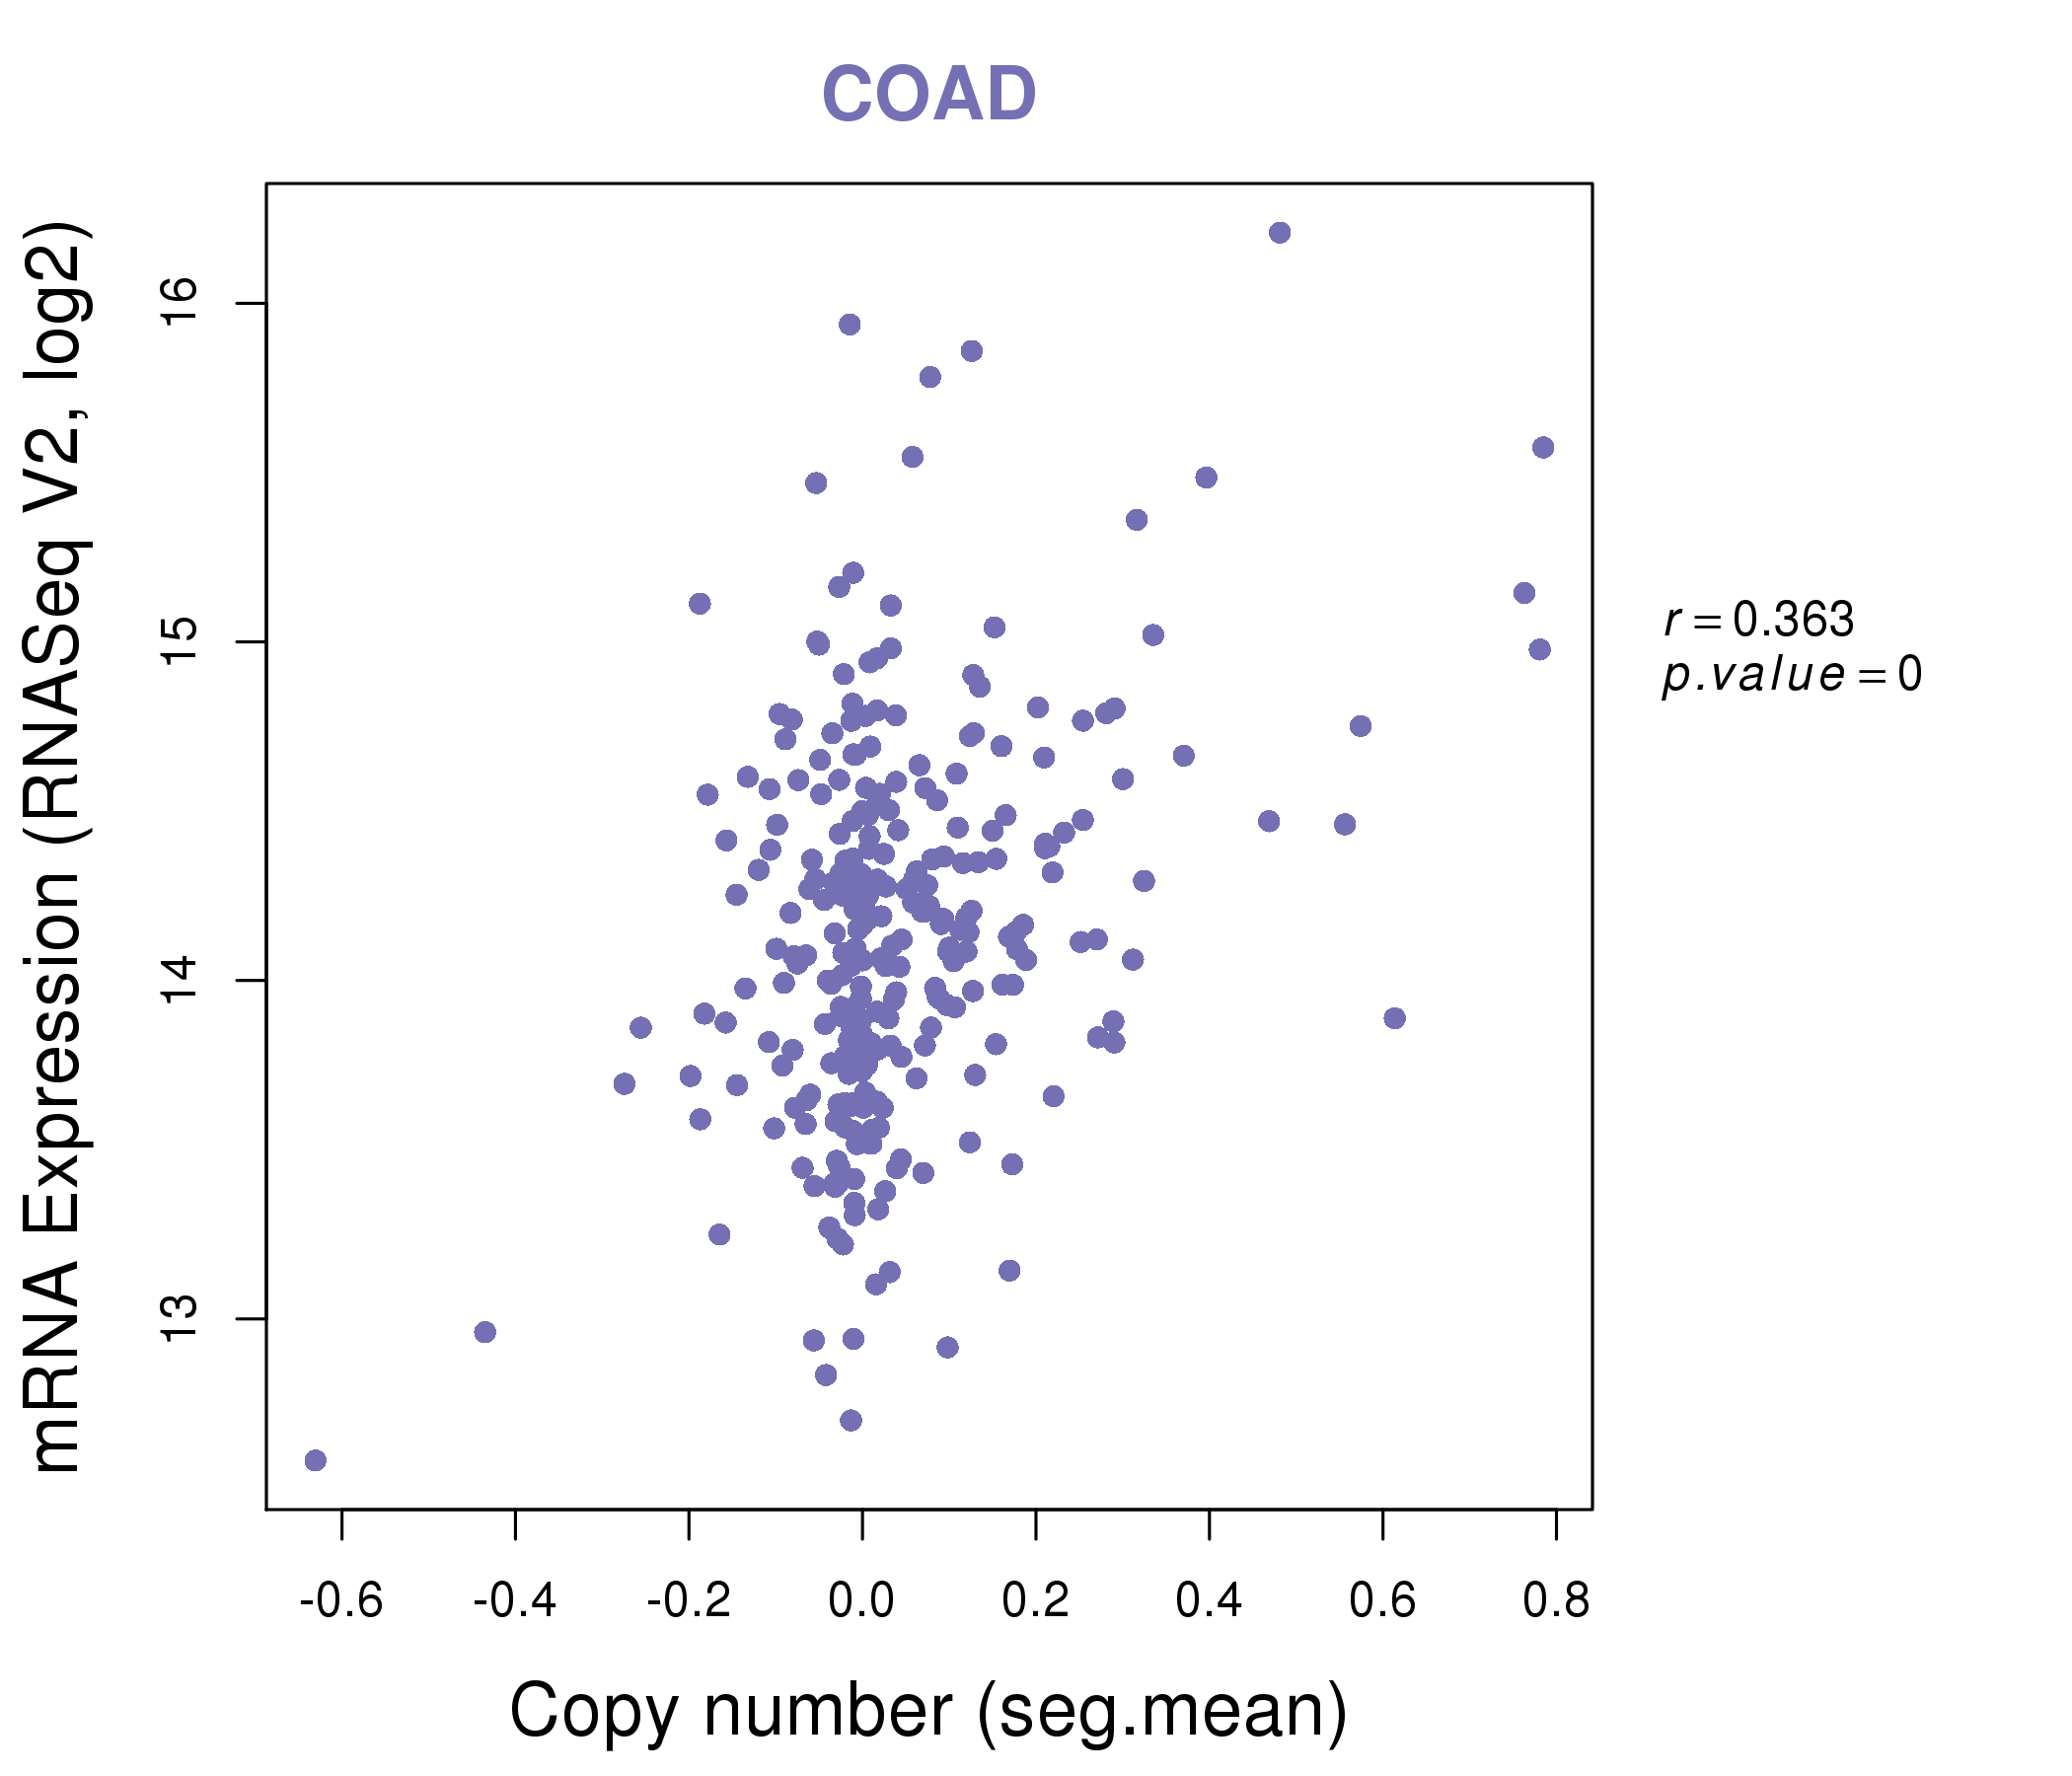
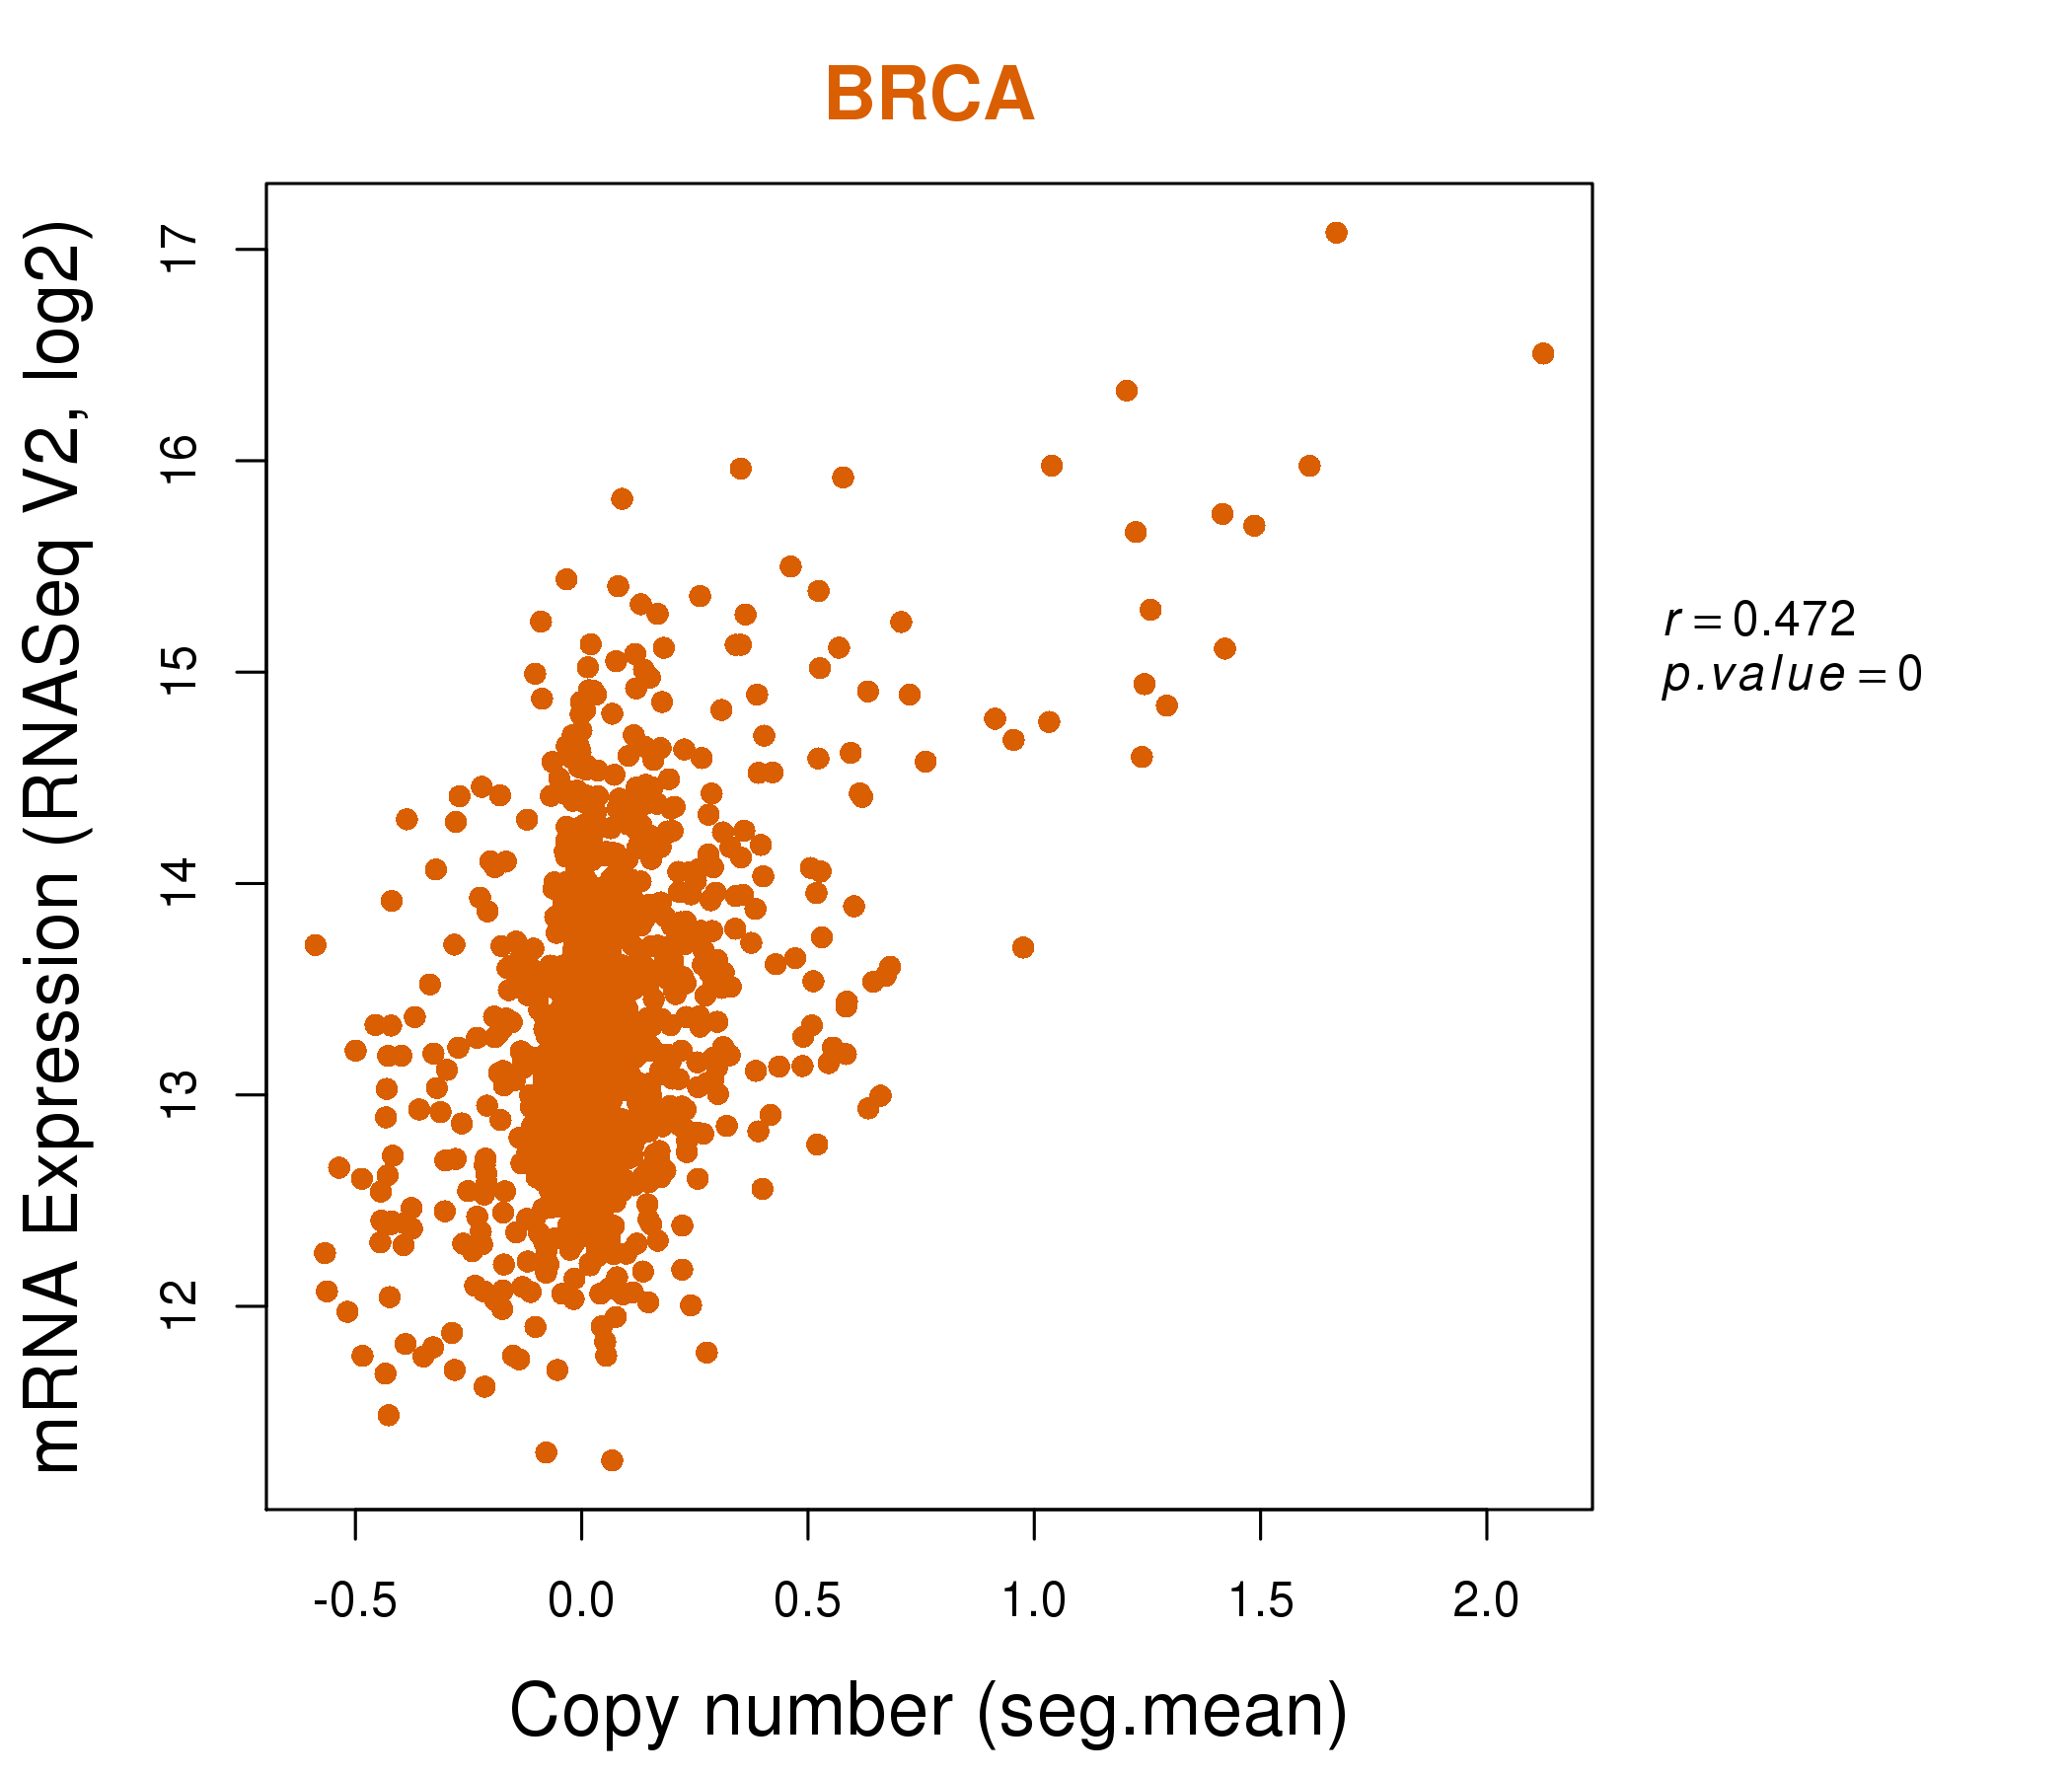
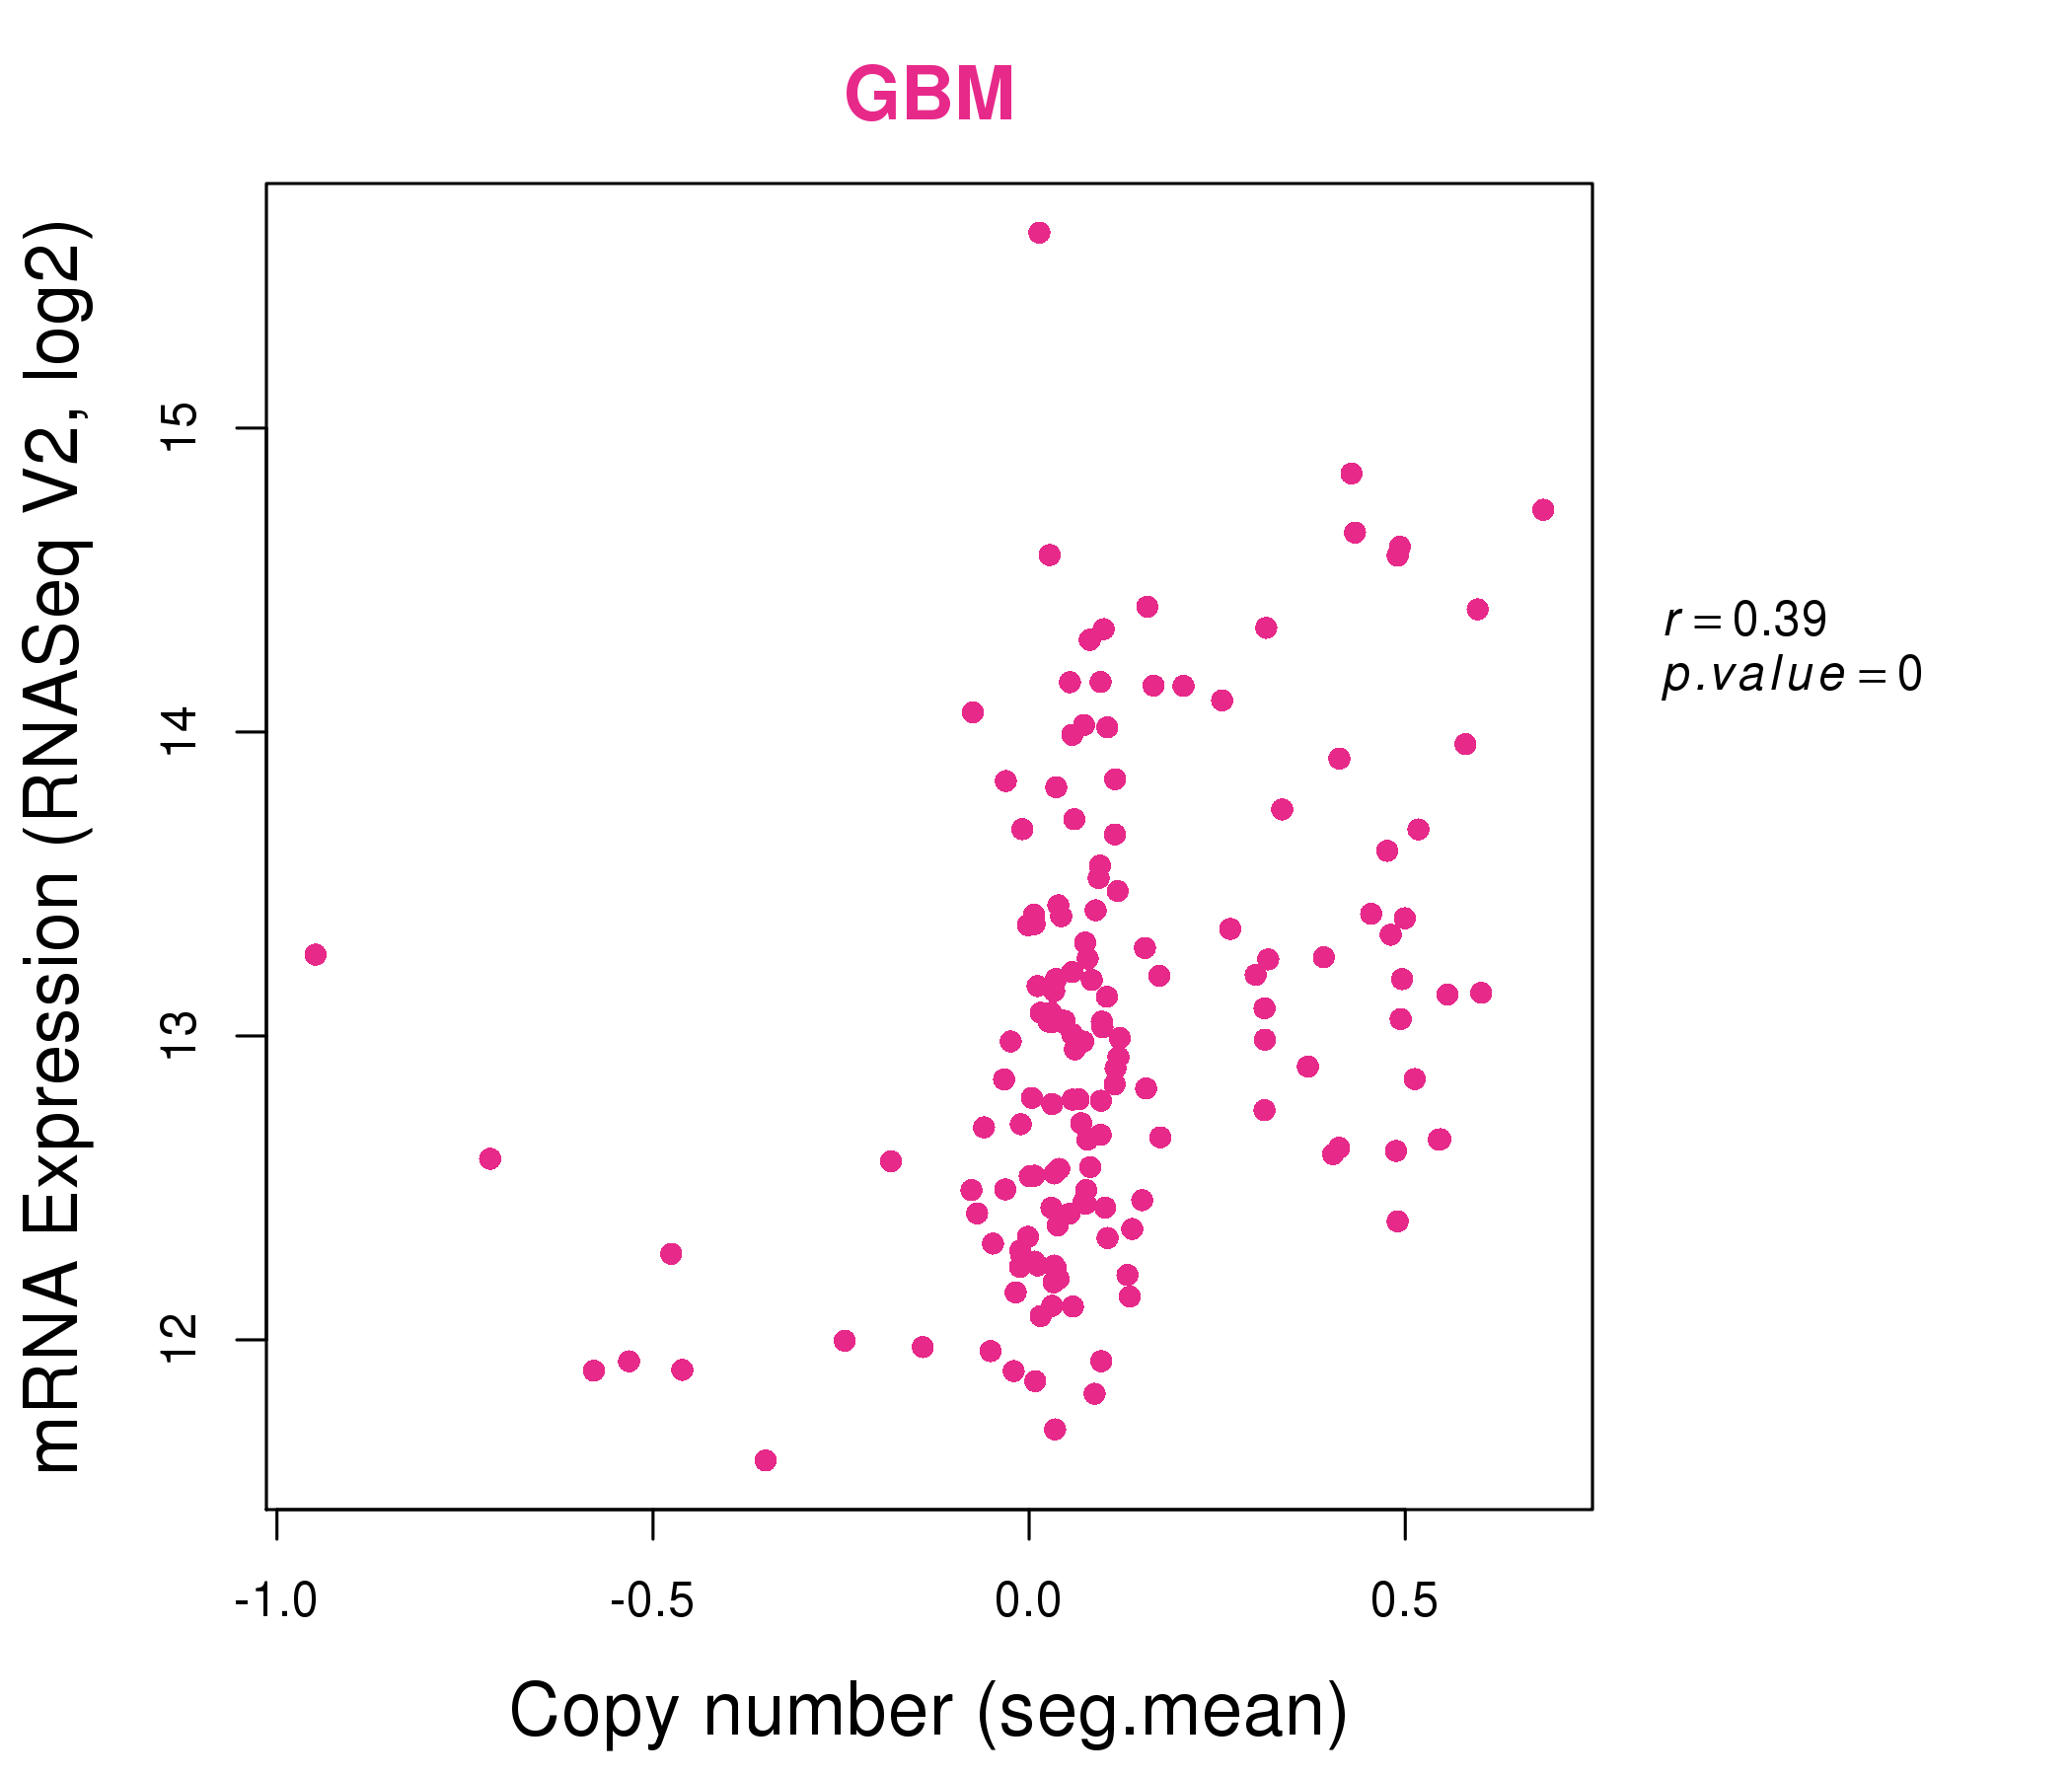
| * This plots show the correlation between CNV and gene expression. |
: Open all plots for all cancer types
 |
|
 |
|
| Top |
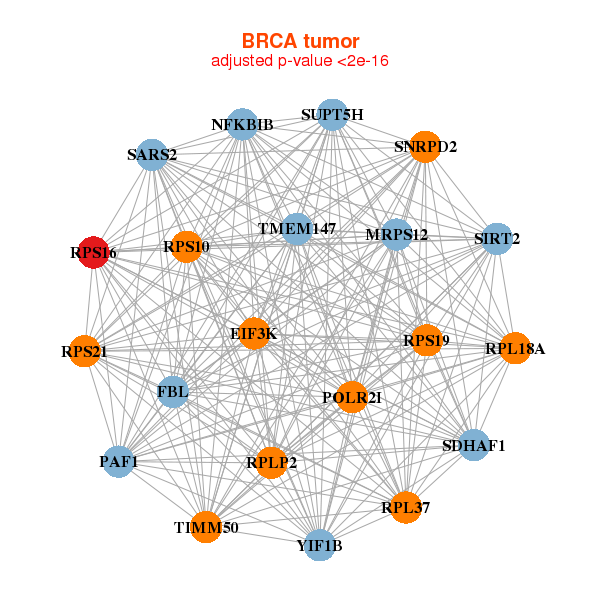
| Gene-Gene Network Information |
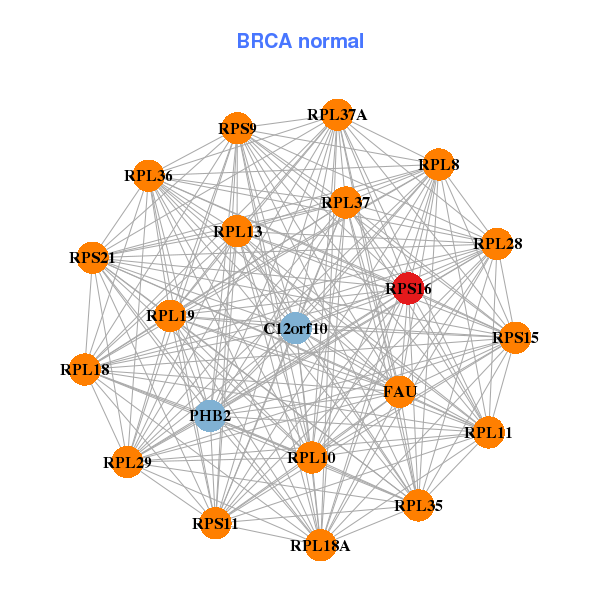
| * Co-Expression network figures were drawn using R package igraph. Only the top 20 genes with the highest correlations were shown. Red circle: input gene, orange circle: cell metabolism gene, sky circle: other gene |
: Open all plots for all cancer types
 |
|
| EIF3K,FBL,MRPS12,NFKBIB,PAF1,POLR2I,RPL18A, RPL37,RPLP2,RPS10,RPS16,RPS19,RPS21,SARS2, SDHAF1,SIRT2,SNRPD2,SUPT5H,TIMM50,TMEM147,YIF1B | C12orf10,FAU,PHB2,RPL10,RPL11,RPL13,RPL18, RPL18A,RPL19,RPL28,RPL29,RPL35,RPL36,RPL37, RPL37A,RPL8,RPS11,RPS15,RPS16,RPS21,RPS9 |
 |
|
| RPL10A,RPL13A,RPL18,RPL27,RPL28,RPL35,RPL36, RPLP0,RPS10,RPS11,RPS14,RPS15,RPS16,RPS19, RPS29,RPS3,RPS5,RPS8,RPS9,SNRPD2,UBA52 | ANAPC11,EEF1A1,FAU,RPL18A,RPL19,RPL29,RPL32, RPL35,RPL35A,RPL38,RPL7A,RPL8,RPLP1,RPS10, RPS11,RPS13,RPS16,RPS3,RPS5,RPS9,SNRPD2 |
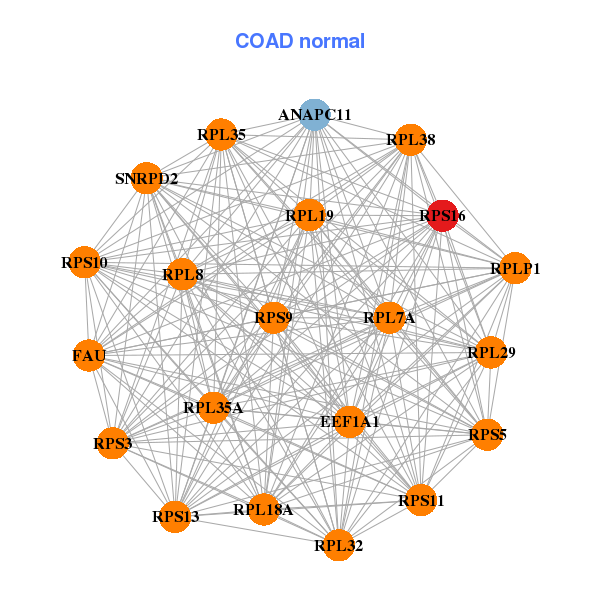
| * Co-Expression network figures were drawn using R package igraph. Only the top 20 genes with the highest correlations were shown. Red circle: input gene, orange circle: cell metabolism gene, sky circle: other gene |
: Open all plots for all cancer types
| Top |
: Open all interacting genes' information including KEGG pathway for all interacting genes from DAVID
| Top |
| Pharmacological Information for RPS16 |
| There's no related Drug. |
| Top |
| Cross referenced IDs for RPS16 |
| * We obtained these cross-references from Uniprot database. It covers 150 different DBs, 18 categories. http://www.uniprot.org/help/cross_references_section |
: Open all cross reference information
|
Copyright © 2016-Present - The Univsersity of Texas Health Science Center at Houston @ |