|
||||||||||||||||||||
| |
| Phenotypic Information (metabolism pathway, cancer, disease, phenome) |
| |
| |
| Gene-Gene Network Information: Co-Expression Network, Interacting Genes & KEGG |
| |
|


| Gene Summary for RPS19 |
| Basic gene info. | Gene symbol | RPS19 |
| Gene name | ribosomal protein S19 | |
| Synonyms | DBA|DBA1|S19 | |
| Cytomap | UCSC genome browser: 19q13.2 | |
| Genomic location | chr19 :42363987-42375484 | |
| Type of gene | protein-coding | |
| RefGenes | NM_001022.3, | |
| Ensembl id | ENSG00000105372 | |
| Description | 40S ribosomal protein S19 | |
| Modification date | 20141222 | |
| dbXrefs | MIM : 603474 | |
| HGNC : HGNC | ||
| HPRD : 04591 | ||
| Protein | UniProt: go to UniProt's Cross Reference DB Table | |
| Expression | CleanEX: HS_RPS19 | |
| BioGPS: 6223 | ||
| Gene Expression Atlas: ENSG00000105372 | ||
| The Human Protein Atlas: ENSG00000105372 | ||
| Pathway | NCI Pathway Interaction Database: RPS19 | |
| KEGG: RPS19 | ||
| REACTOME: RPS19 | ||
| ConsensusPathDB | ||
| Pathway Commons: RPS19 | ||
| Metabolism | MetaCyc: RPS19 | |
| HUMANCyc: RPS19 | ||
| Regulation | Ensembl's Regulation: ENSG00000105372 | |
| miRBase: chr19 :42,363,987-42,375,484 | ||
| TargetScan: NM_001022 | ||
| cisRED: ENSG00000105372 | ||
| Context | iHOP: RPS19 | |
| cancer metabolism search in PubMed: RPS19 | ||
| UCL Cancer Institute: RPS19 | ||
| Assigned class in ccmGDB | C | |
| Top |
| Phenotypic Information for RPS19(metabolism pathway, cancer, disease, phenome) |
| Cancer | CGAP: RPS19 |
| Familial Cancer Database: RPS19 | |
| * This gene is included in those cancer gene databases. |
|
|
|
|
|
| . | ||||||||||||||
Oncogene 1 | Significant driver gene in | |||||||||||||||||||
| cf) number; DB name 1 Oncogene; http://nar.oxfordjournals.org/content/35/suppl_1/D721.long, 2 Tumor Suppressor gene; https://bioinfo.uth.edu/TSGene/, 3 Cancer Gene Census; http://www.nature.com/nrc/journal/v4/n3/abs/nrc1299.html, 4 CancerGenes; http://nar.oxfordjournals.org/content/35/suppl_1/D721.long, 5 Network of Cancer Gene; http://ncg.kcl.ac.uk/index.php, 1Therapeutic Vulnerabilities in Cancer; http://cbio.mskcc.org/cancergenomics/statius/ |
| REACTOME_METABOLISM_OF_PROTEINS REACTOME_METABOLISM_OF_MRNA REACTOME_METABOLISM_OF_RNA | |
| OMIM | |
| Orphanet | |
| Disease | KEGG Disease: RPS19 |
| MedGen: RPS19 (Human Medical Genetics with Condition) | |
| ClinVar: RPS19 | |
| Phenotype | MGI: RPS19 (International Mouse Phenotyping Consortium) |
| PhenomicDB: RPS19 | |
| Mutations for RPS19 |
| * Under tables are showing count per each tissue to give us broad intuition about tissue specific mutation patterns.You can go to the detailed page for each mutation database's web site. |
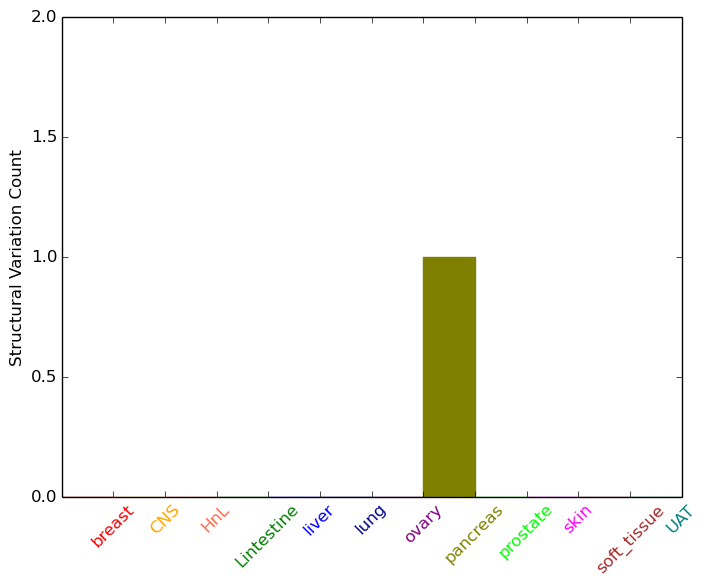
| - Statistics for Tissue and Mutation type | Top |
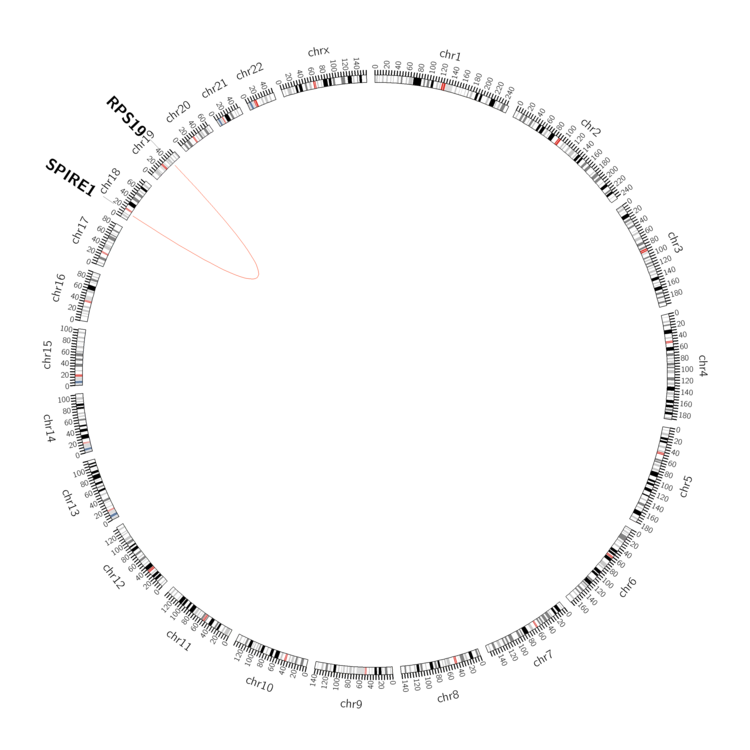 |
| - For Inter-chromosomal Variations |
| * Inter-chromosomal variantions includes 'interchromosomal amplicon to amplicon', 'interchromosomal amplicon to non-amplified dna', 'interchromosomal insertion', 'Interchromosomal unknown type'. |
 |
| - For Intra-chromosomal Variations |
| There's no intra-chromosomal structural variation. |
| Sample | Symbol_a | Chr_a | Start_a | End_a | Symbol_b | Chr_b | Start_b | End_b |
| cf) Tissue number; Tissue name (1;Breast, 2;Central_nervous_system, 3;Haematopoietic_and_lymphoid_tissue, 4;Large_intestine, 5;Liver, 6;Lung, 7;Ovary, 8;Pancreas, 9;Prostate, 10;Skin, 11;Soft_tissue, 12;Upper_aerodigestive_tract) |
| * From mRNA Sanger sequences, Chitars2.0 arranged chimeric transcripts. This table shows RPS19 related fusion information. |
| ID | Head Gene | Tail Gene | Accession | Gene_a | qStart_a | qEnd_a | Chromosome_a | tStart_a | tEnd_a | Gene_a | qStart_a | qEnd_a | Chromosome_a | tStart_a | tEnd_a |
| BU602070 | RPS14 | 4 | 348 | 5 | 149826368 | 149829300 | RPS19 | 348 | 482 | 19 | 42373271 | 42375484 | |
| AW300778 | RPS19 | 9 | 399 | 19 | 42364325 | 42373284 | RPS4Y1 | 387 | 474 | Y | 2734859 | 2734946 | |
| BQ351523 | PLD1 | 66 | 295 | 3 | 171510161 | 171510388 | RPS19 | 290 | 517 | 19 | 42364898 | 42373208 | |
| DB116923 | RPS19 | 1 | 147 | 19 | 42364327 | 42365223 | DCAF8 | 144 | 558 | 1 | 160209269 | 160209683 | |
| Top |
| There's no copy number variation information in COSMIC data for this gene. |
| Top |
|
 |
| Top |
| Stat. for Non-Synonymous SNVs (# total SNVs=4) | (# total SNVs=1) |
 |  |
(# total SNVs=0) | (# total SNVs=0) |
| Top |
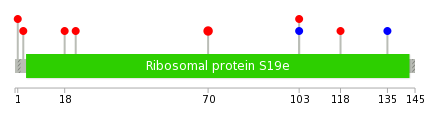
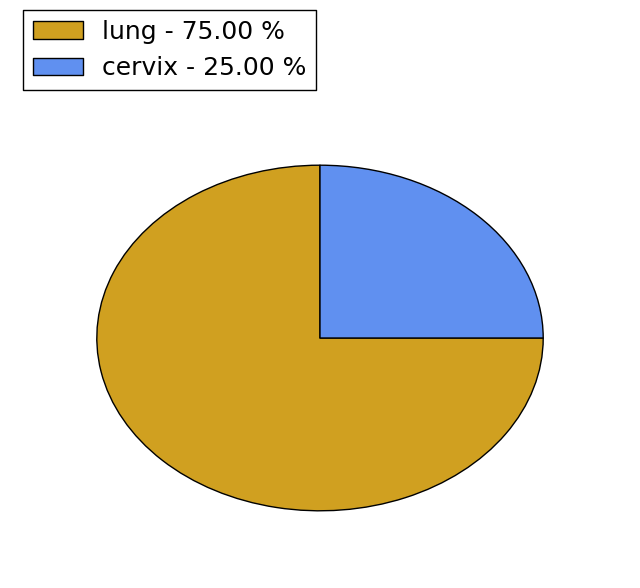
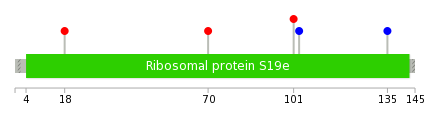
| * When you move the cursor on each content, you can see more deailed mutation information on the Tooltip. Those are primary_site,primary_histology,mutation(aa),pubmedID. |
| GRCh37 position | Mutation(aa) | Unique sampleID count |
| chr19:42373137-42373137 | p.A70V | 2 |
| chr19:42373235-42373235 | p.V103I | 1 |
| chr19:42373237-42373237 | p.V103V | 1 |
| chr19:42373280-42373280 | p.D118N | 1 |
| chr19:42373788-42373788 | p.Q126* | 1 |
| chr19:42373817-42373817 | p.A135A | 1 |
| chr19:42364847-42364847 | p.M1I | 1 |
| chr19:42364852-42364852 | p.G3A | 1 |
| chr19:42364896-42364896 | p.L18V | 1 |
| chr19:42364908-42364908 | p.L22F | 1 |
| Top |
|
 |
| Point Mutation/ Tissue ID | 1 | 2 | 3 | 4 | 5 | 6 | 7 | 8 | 9 | 10 | 11 | 12 | 13 | 14 | 15 | 16 | 17 | 18 | 19 | 20 |
| # sample | 1 | 1 | 1 | 1 | 1 | |||||||||||||||
| # mutation | 1 | 1 | 1 | 1 | 1 | |||||||||||||||
| nonsynonymous SNV | 1 | 1 | 1 | |||||||||||||||||
| synonymous SNV | 1 | 1 |
| cf) Tissue ID; Tissue type (1; BLCA[Bladder Urothelial Carcinoma], 2; BRCA[Breast invasive carcinoma], 3; CESC[Cervical squamous cell carcinoma and endocervical adenocarcinoma], 4; COAD[Colon adenocarcinoma], 5; GBM[Glioblastoma multiforme], 6; Glioma Low Grade, 7; HNSC[Head and Neck squamous cell carcinoma], 8; KICH[Kidney Chromophobe], 9; KIRC[Kidney renal clear cell carcinoma], 10; KIRP[Kidney renal papillary cell carcinoma], 11; LAML[Acute Myeloid Leukemia], 12; LUAD[Lung adenocarcinoma], 13; LUSC[Lung squamous cell carcinoma], 14; OV[Ovarian serous cystadenocarcinoma ], 15; PAAD[Pancreatic adenocarcinoma], 16; PRAD[Prostate adenocarcinoma], 17; SKCM[Skin Cutaneous Melanoma], 18:STAD[Stomach adenocarcinoma], 19:THCA[Thyroid carcinoma], 20:UCEC[Uterine Corpus Endometrial Carcinoma]) |
| Top |
| * We represented just top 10 SNVs. When you move the cursor on each content, you can see more deailed mutation information on the Tooltip. Those are primary_site, primary_histology, mutation(aa), pubmedID. |
| Genomic Position | Mutation(aa) | Unique sampleID count |
| chr19:42364896 | p.L18V | 1 |
| chr19:42373137 | p.A70V | 1 |
| chr19:42373230 | p.R101H | 1 |
| chr19:42373237 | p.V103V | 1 |
| chr19:42373817 | p.A135A | 1 |
| * Copy number data were extracted from TCGA using R package TCGA-Assembler. The URLs of all public data files on TCGA DCC data server were gathered on Jan-05-2015. Function ProcessCNAData in TCGA-Assembler package was used to obtain gene-level copy number value which is calculated as the average copy number of the genomic region of a gene. |
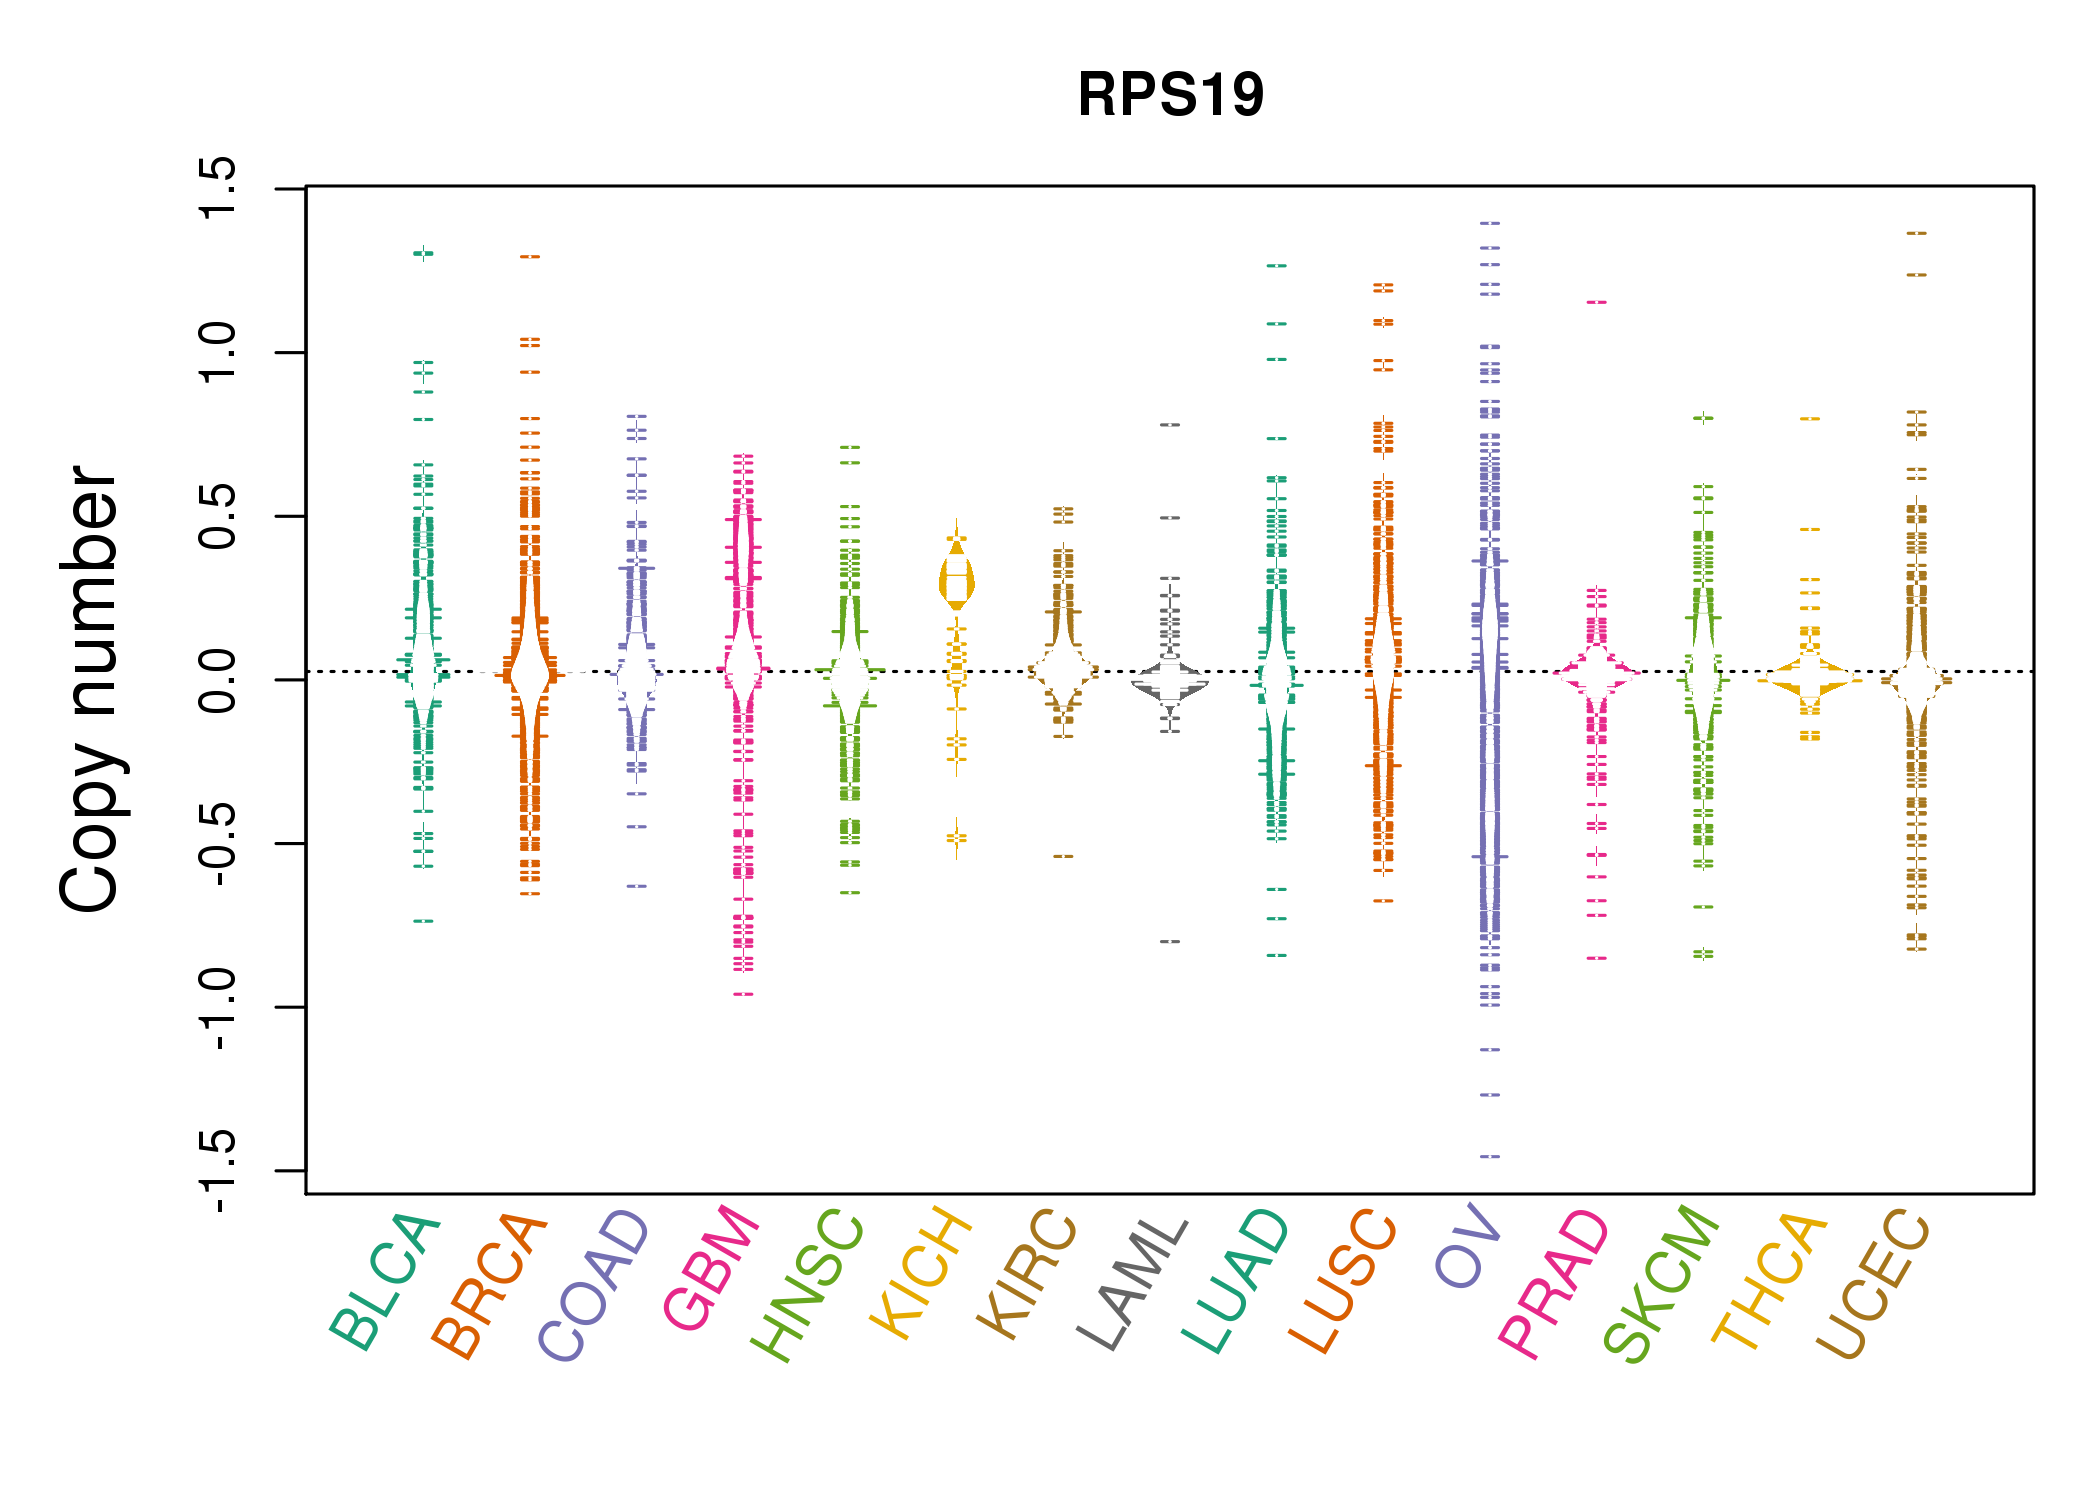 |
| cf) Tissue ID[Tissue type]: BLCA[Bladder Urothelial Carcinoma], BRCA[Breast invasive carcinoma], CESC[Cervical squamous cell carcinoma and endocervical adenocarcinoma], COAD[Colon adenocarcinoma], GBM[Glioblastoma multiforme], Glioma Low Grade, HNSC[Head and Neck squamous cell carcinoma], KICH[Kidney Chromophobe], KIRC[Kidney renal clear cell carcinoma], KIRP[Kidney renal papillary cell carcinoma], LAML[Acute Myeloid Leukemia], LUAD[Lung adenocarcinoma], LUSC[Lung squamous cell carcinoma], OV[Ovarian serous cystadenocarcinoma ], PAAD[Pancreatic adenocarcinoma], PRAD[Prostate adenocarcinoma], SKCM[Skin Cutaneous Melanoma], STAD[Stomach adenocarcinoma], THCA[Thyroid carcinoma], UCEC[Uterine Corpus Endometrial Carcinoma] |
| Top |
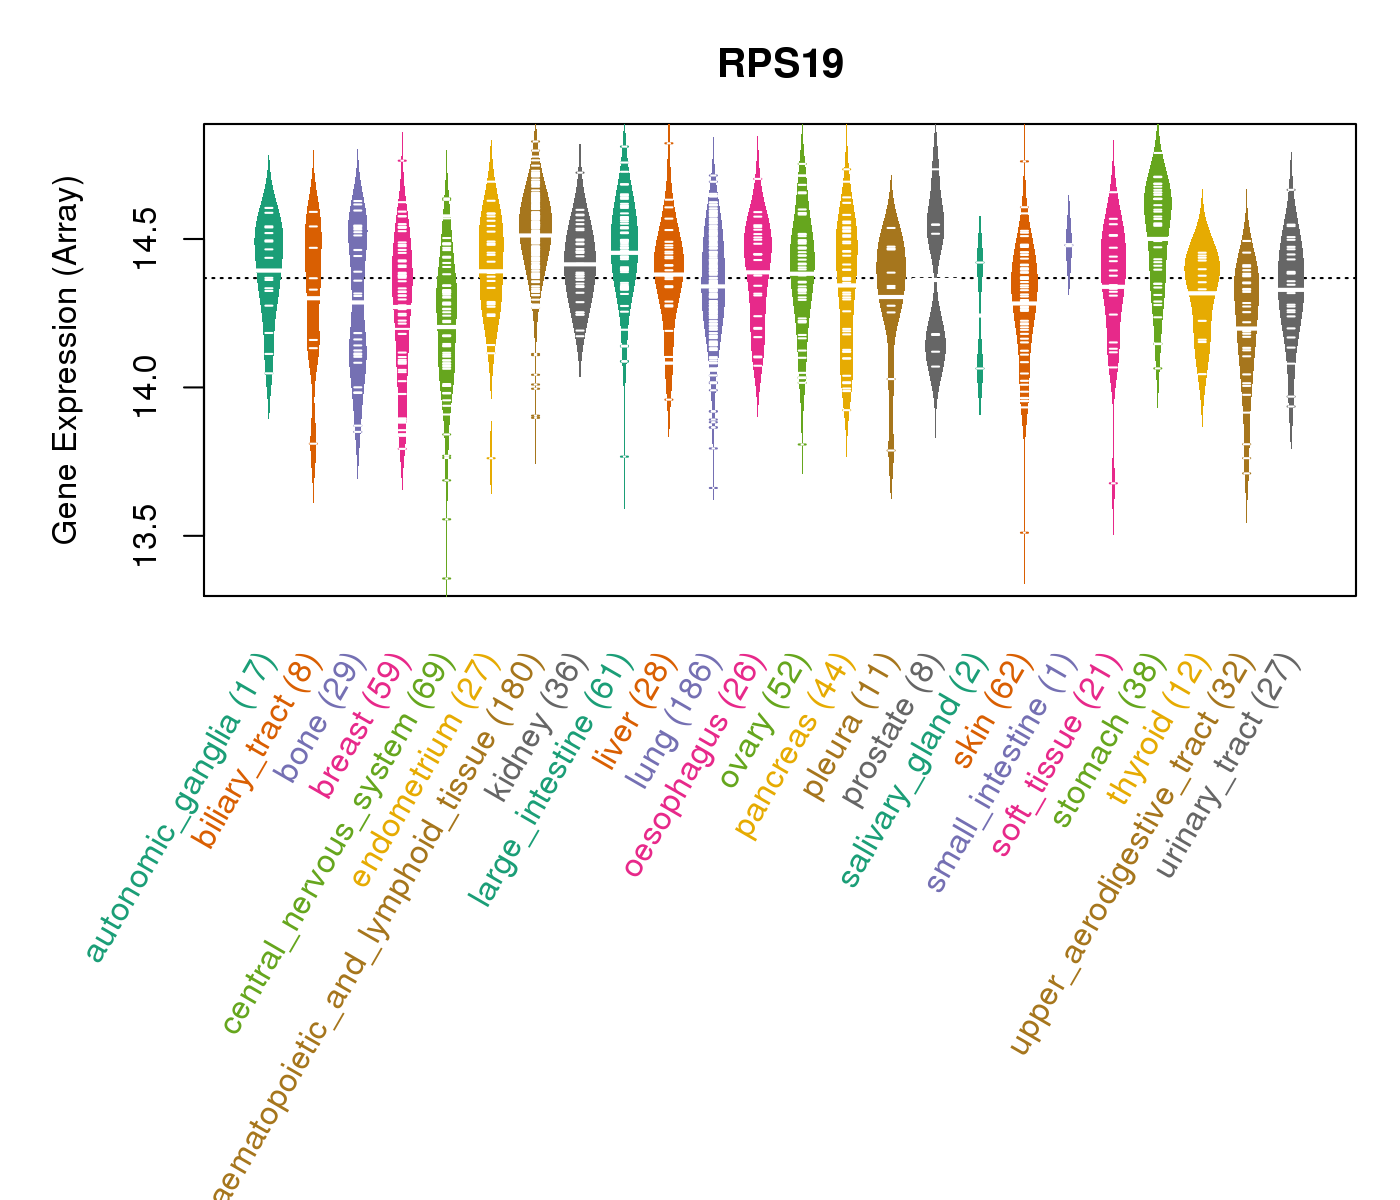
| Gene Expression for RPS19 |
| * CCLE gene expression data were extracted from CCLE_Expression_Entrez_2012-10-18.res: Gene-centric RMA-normalized mRNA expression data. |
 |
| * Normalized gene expression data of RNASeqV2 was extracted from TCGA using R package TCGA-Assembler. The URLs of all public data files on TCGA DCC data server were gathered at Jan-05-2015. Only eight cancer types have enough normal control samples for differential expression analysis. (t test, adjusted p<0.05 (using Benjamini-Hochberg FDR)) |
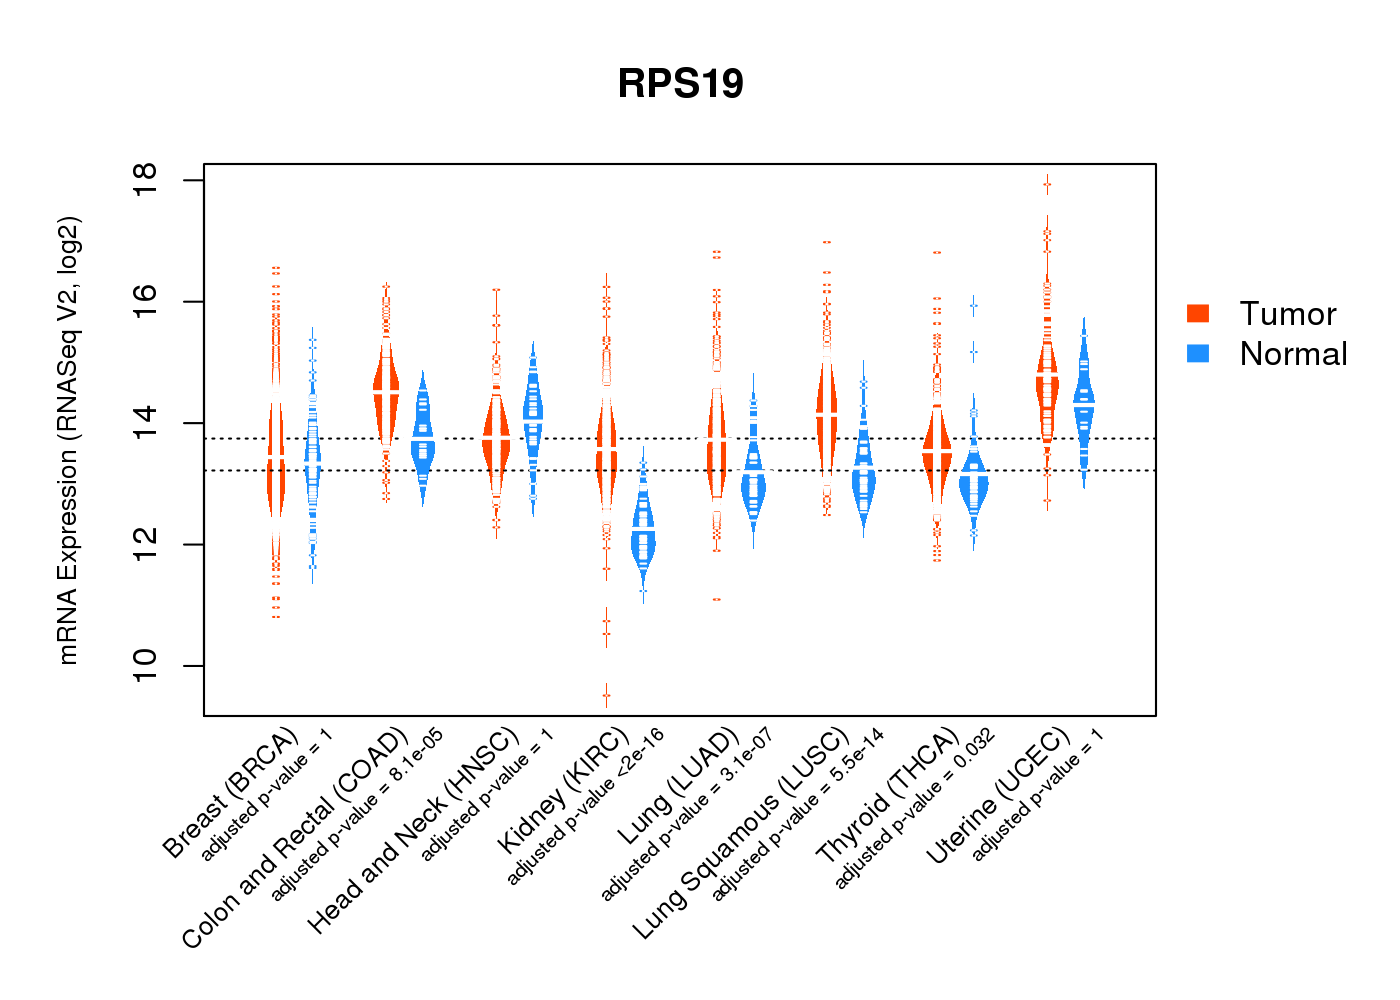 |
| Top |
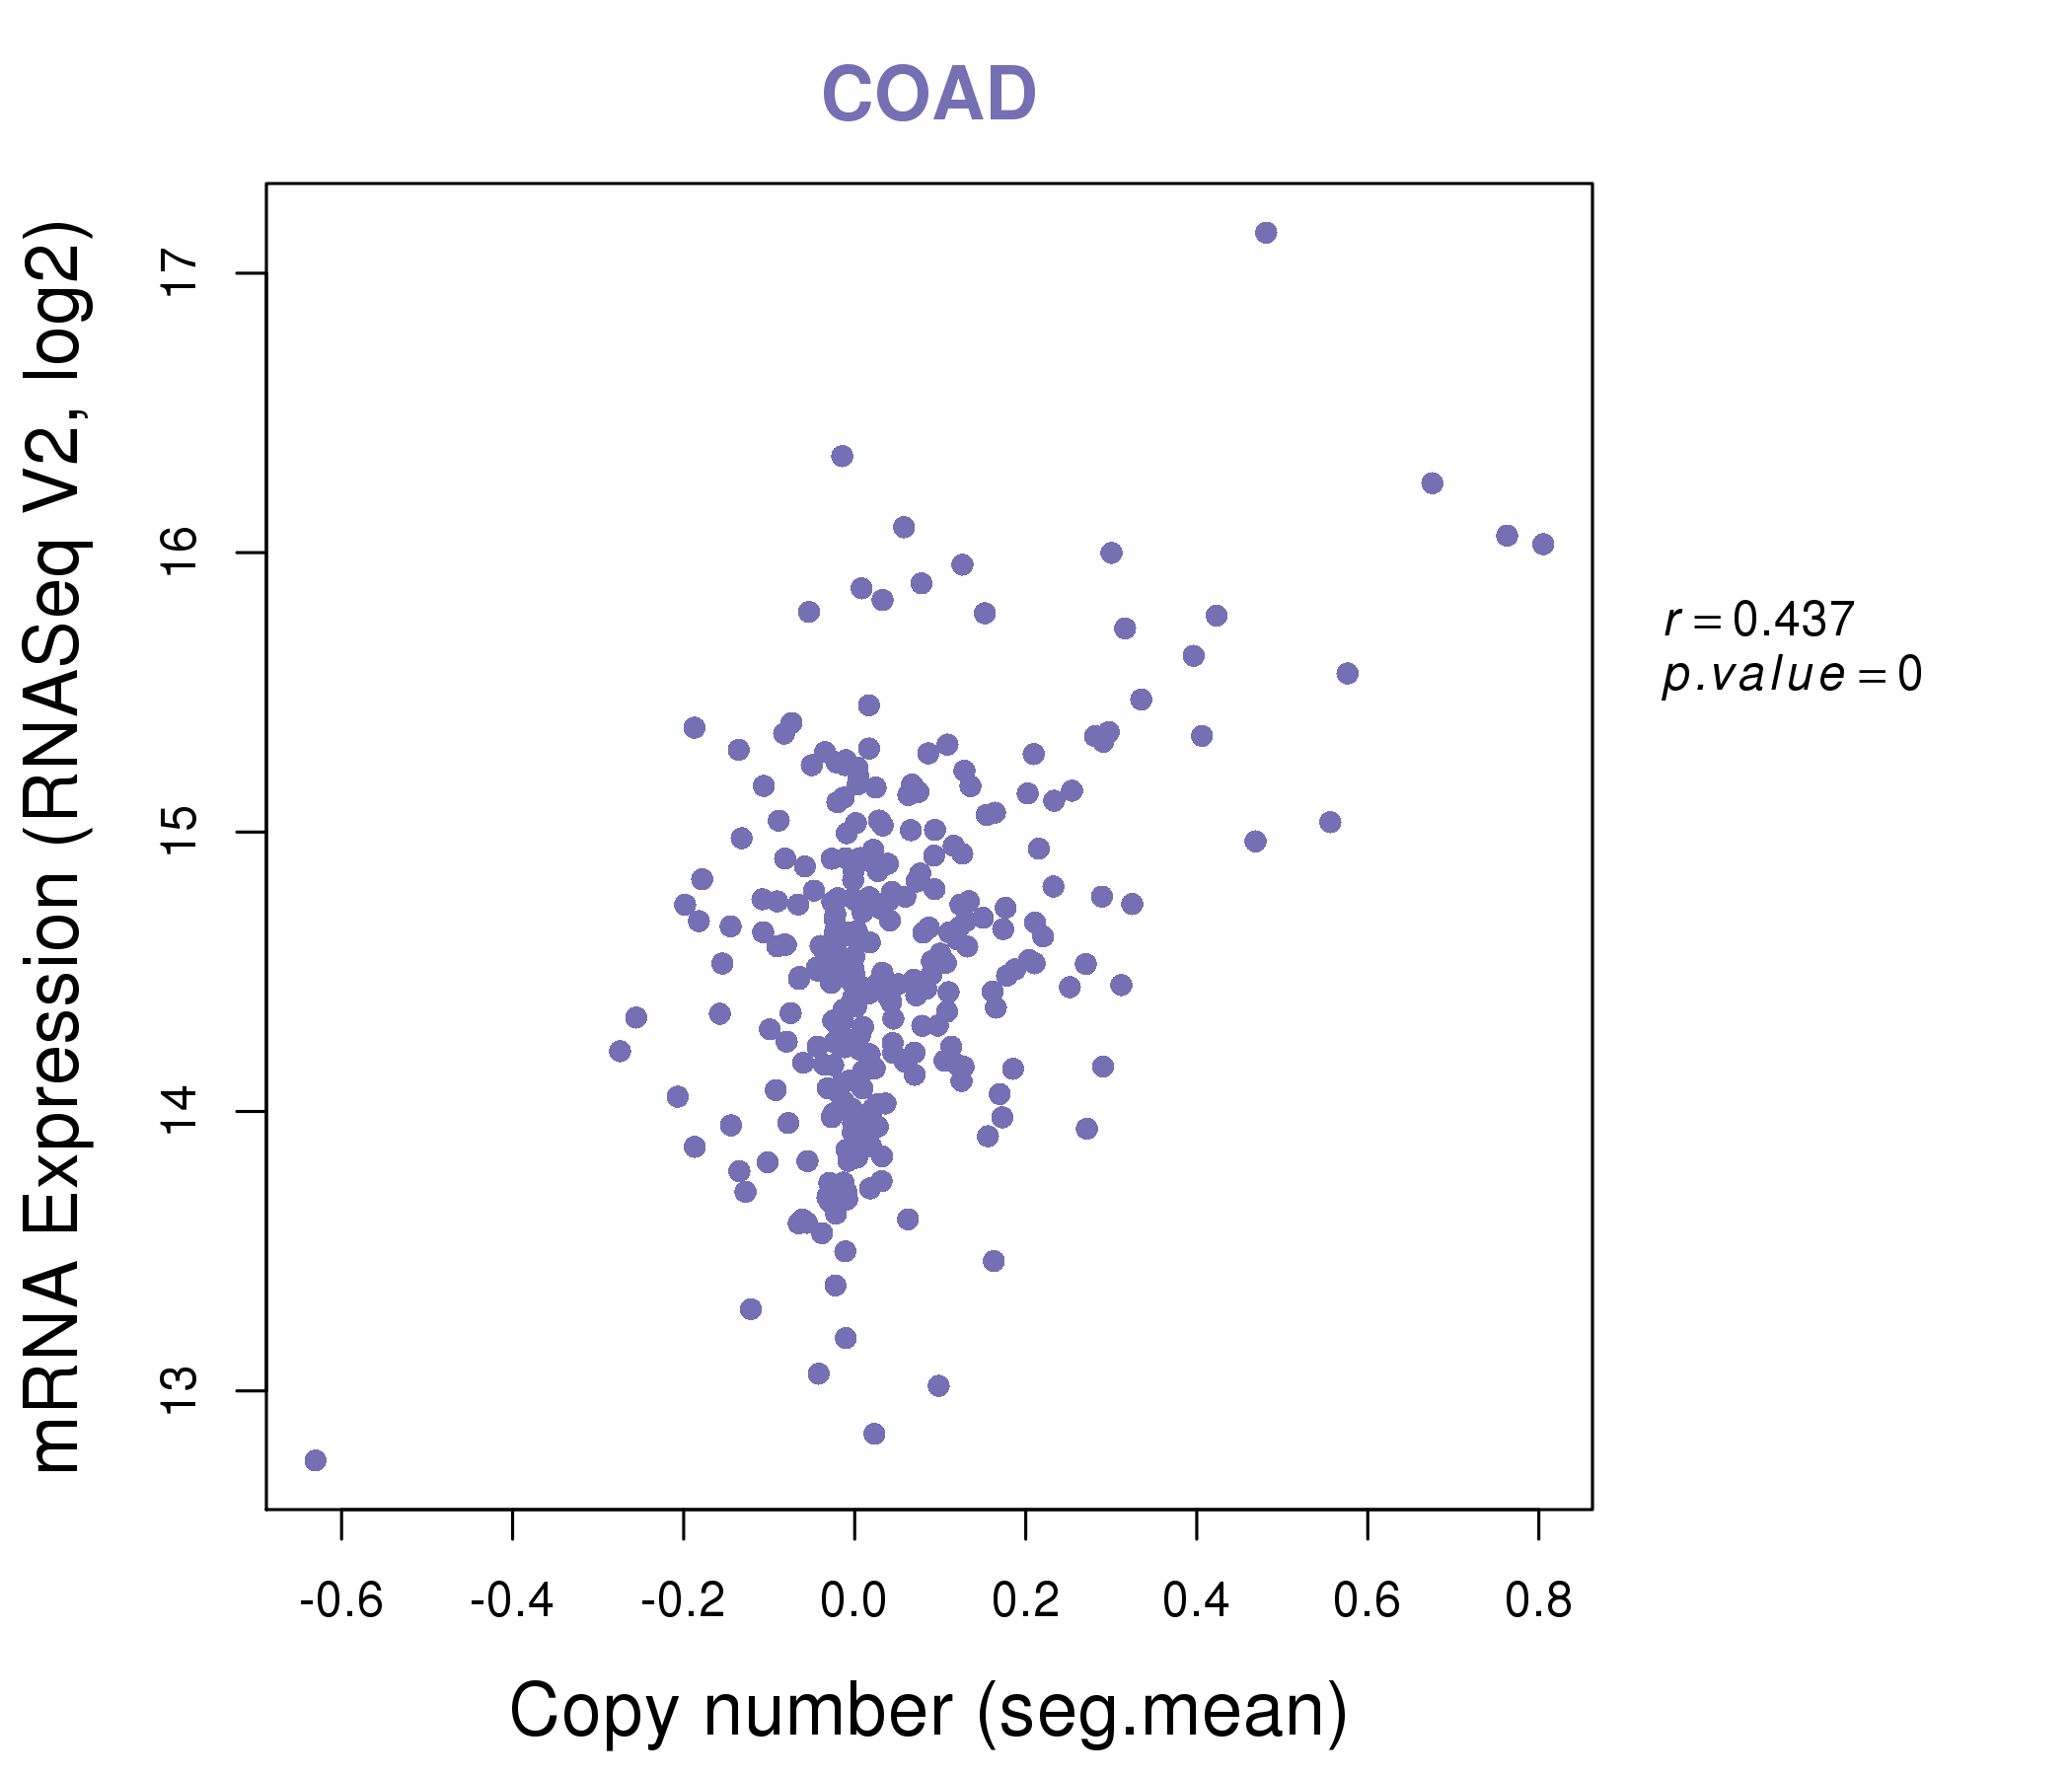
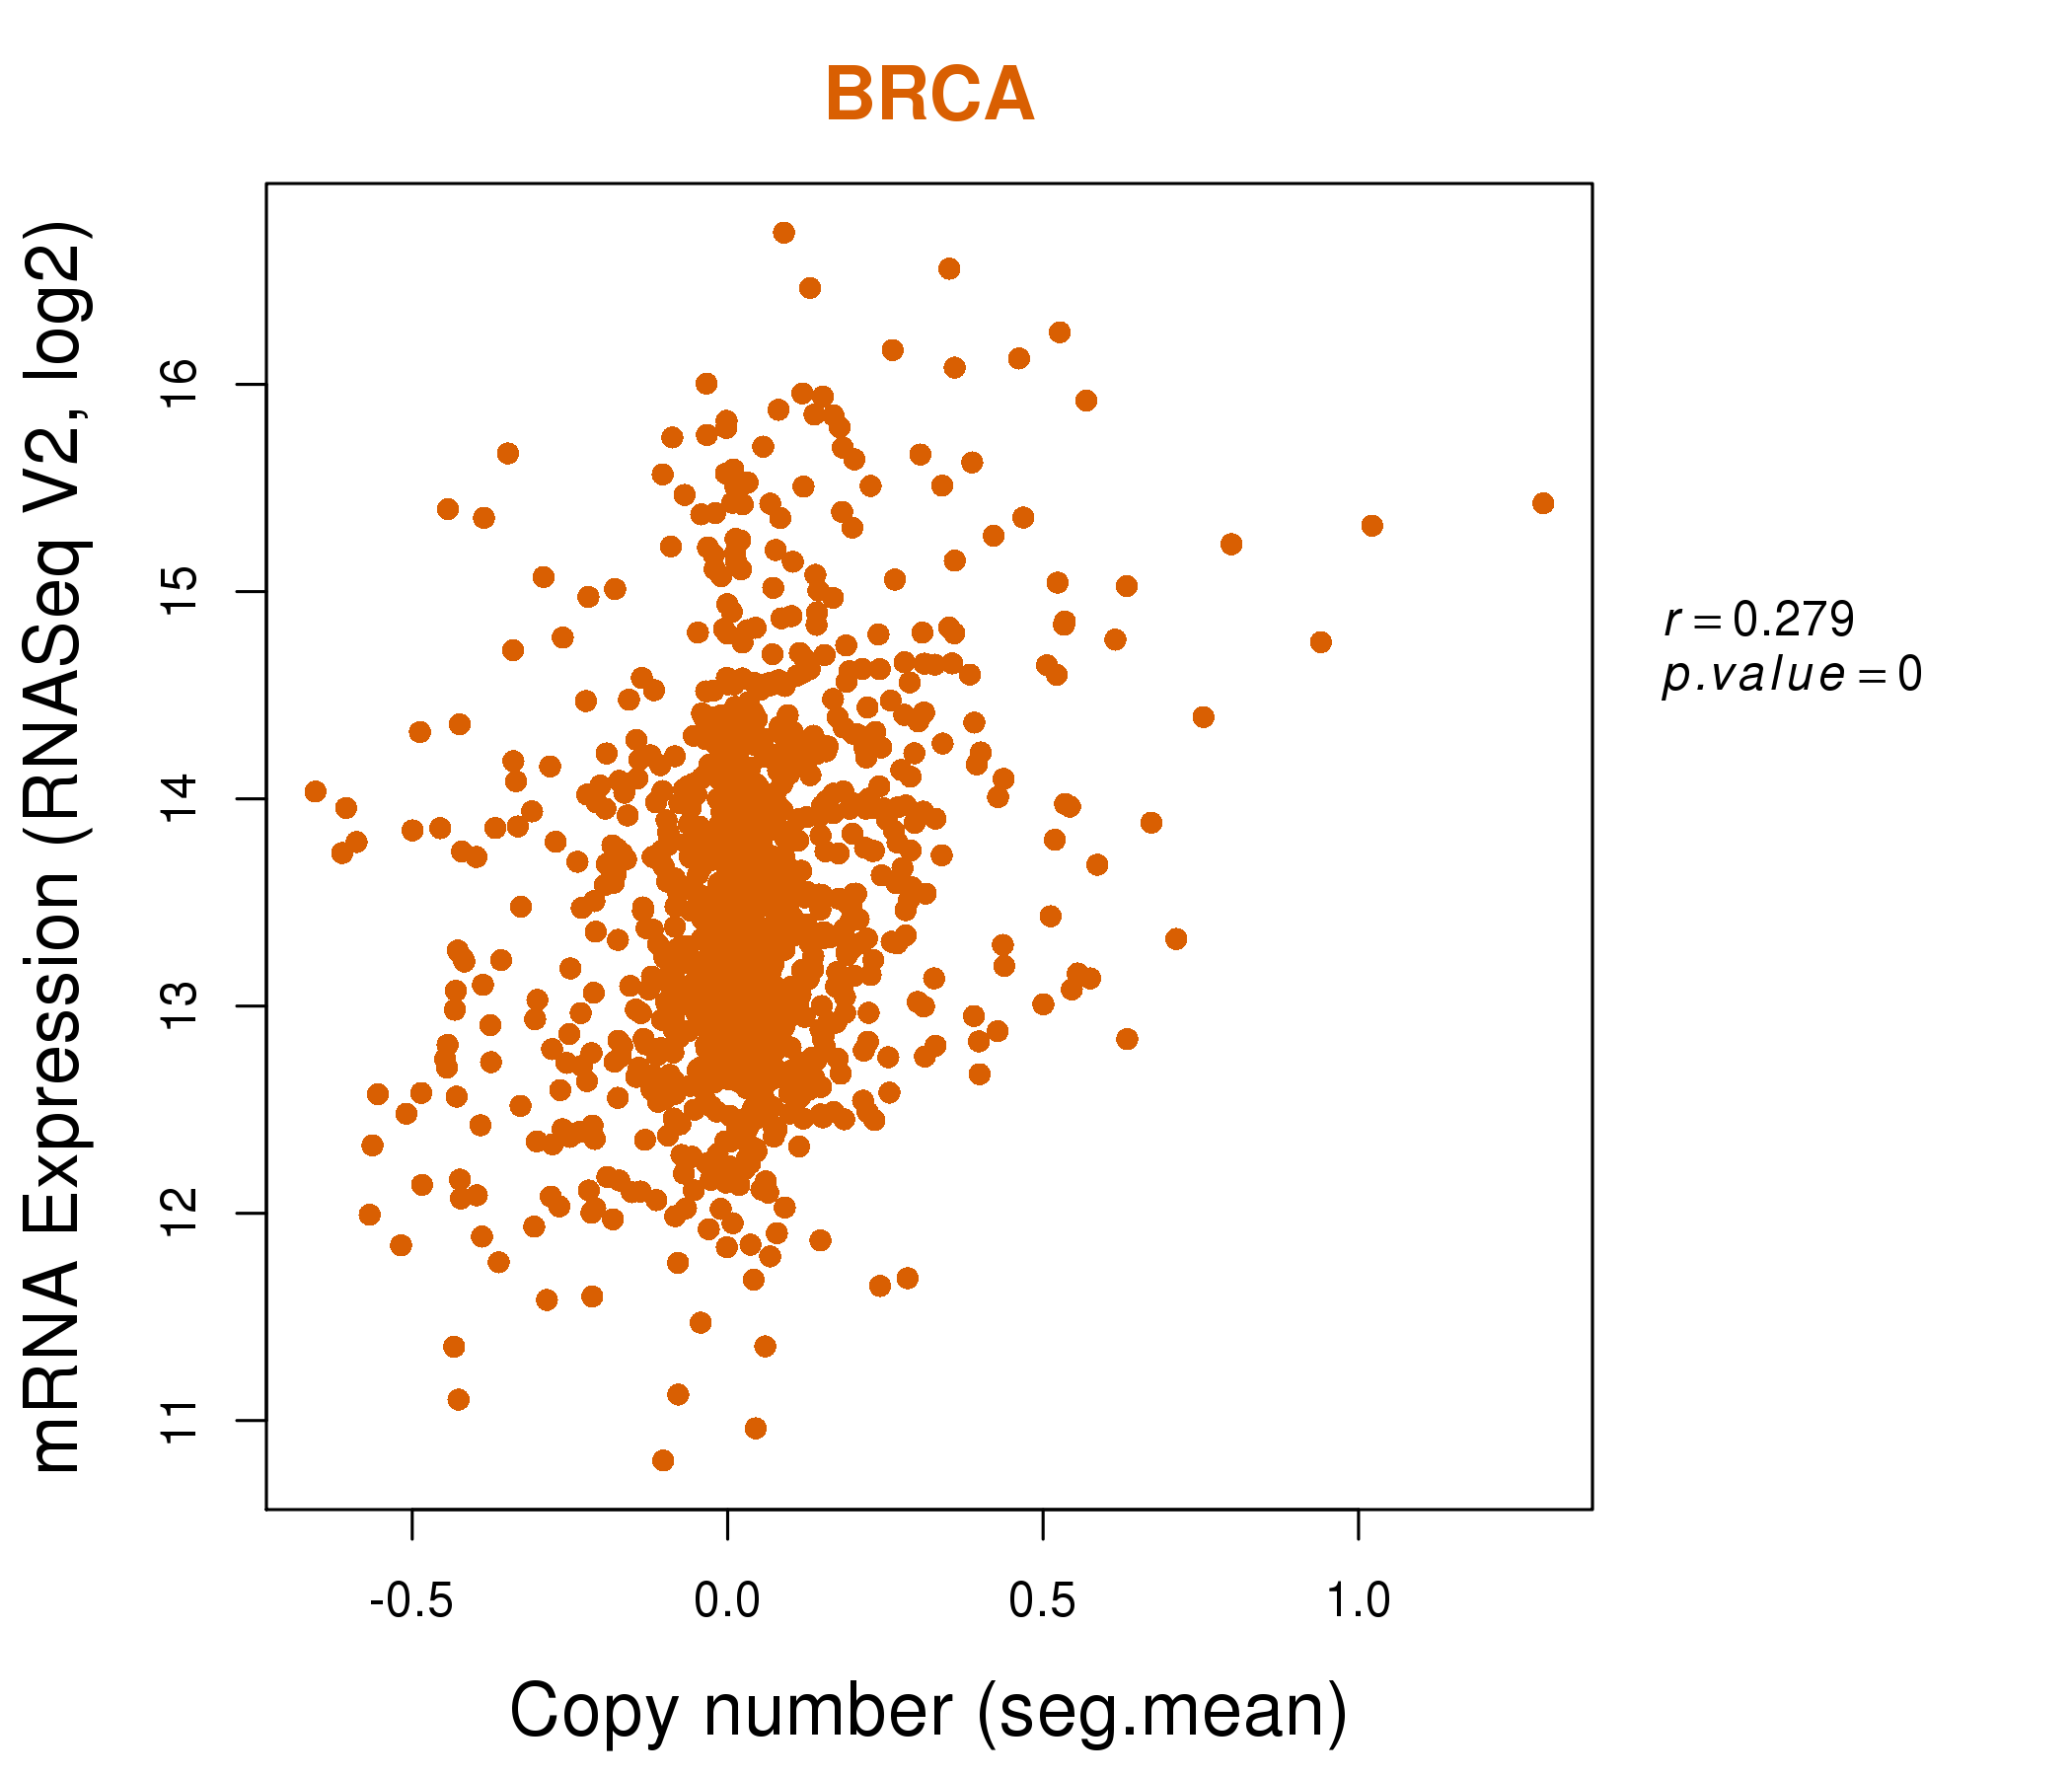
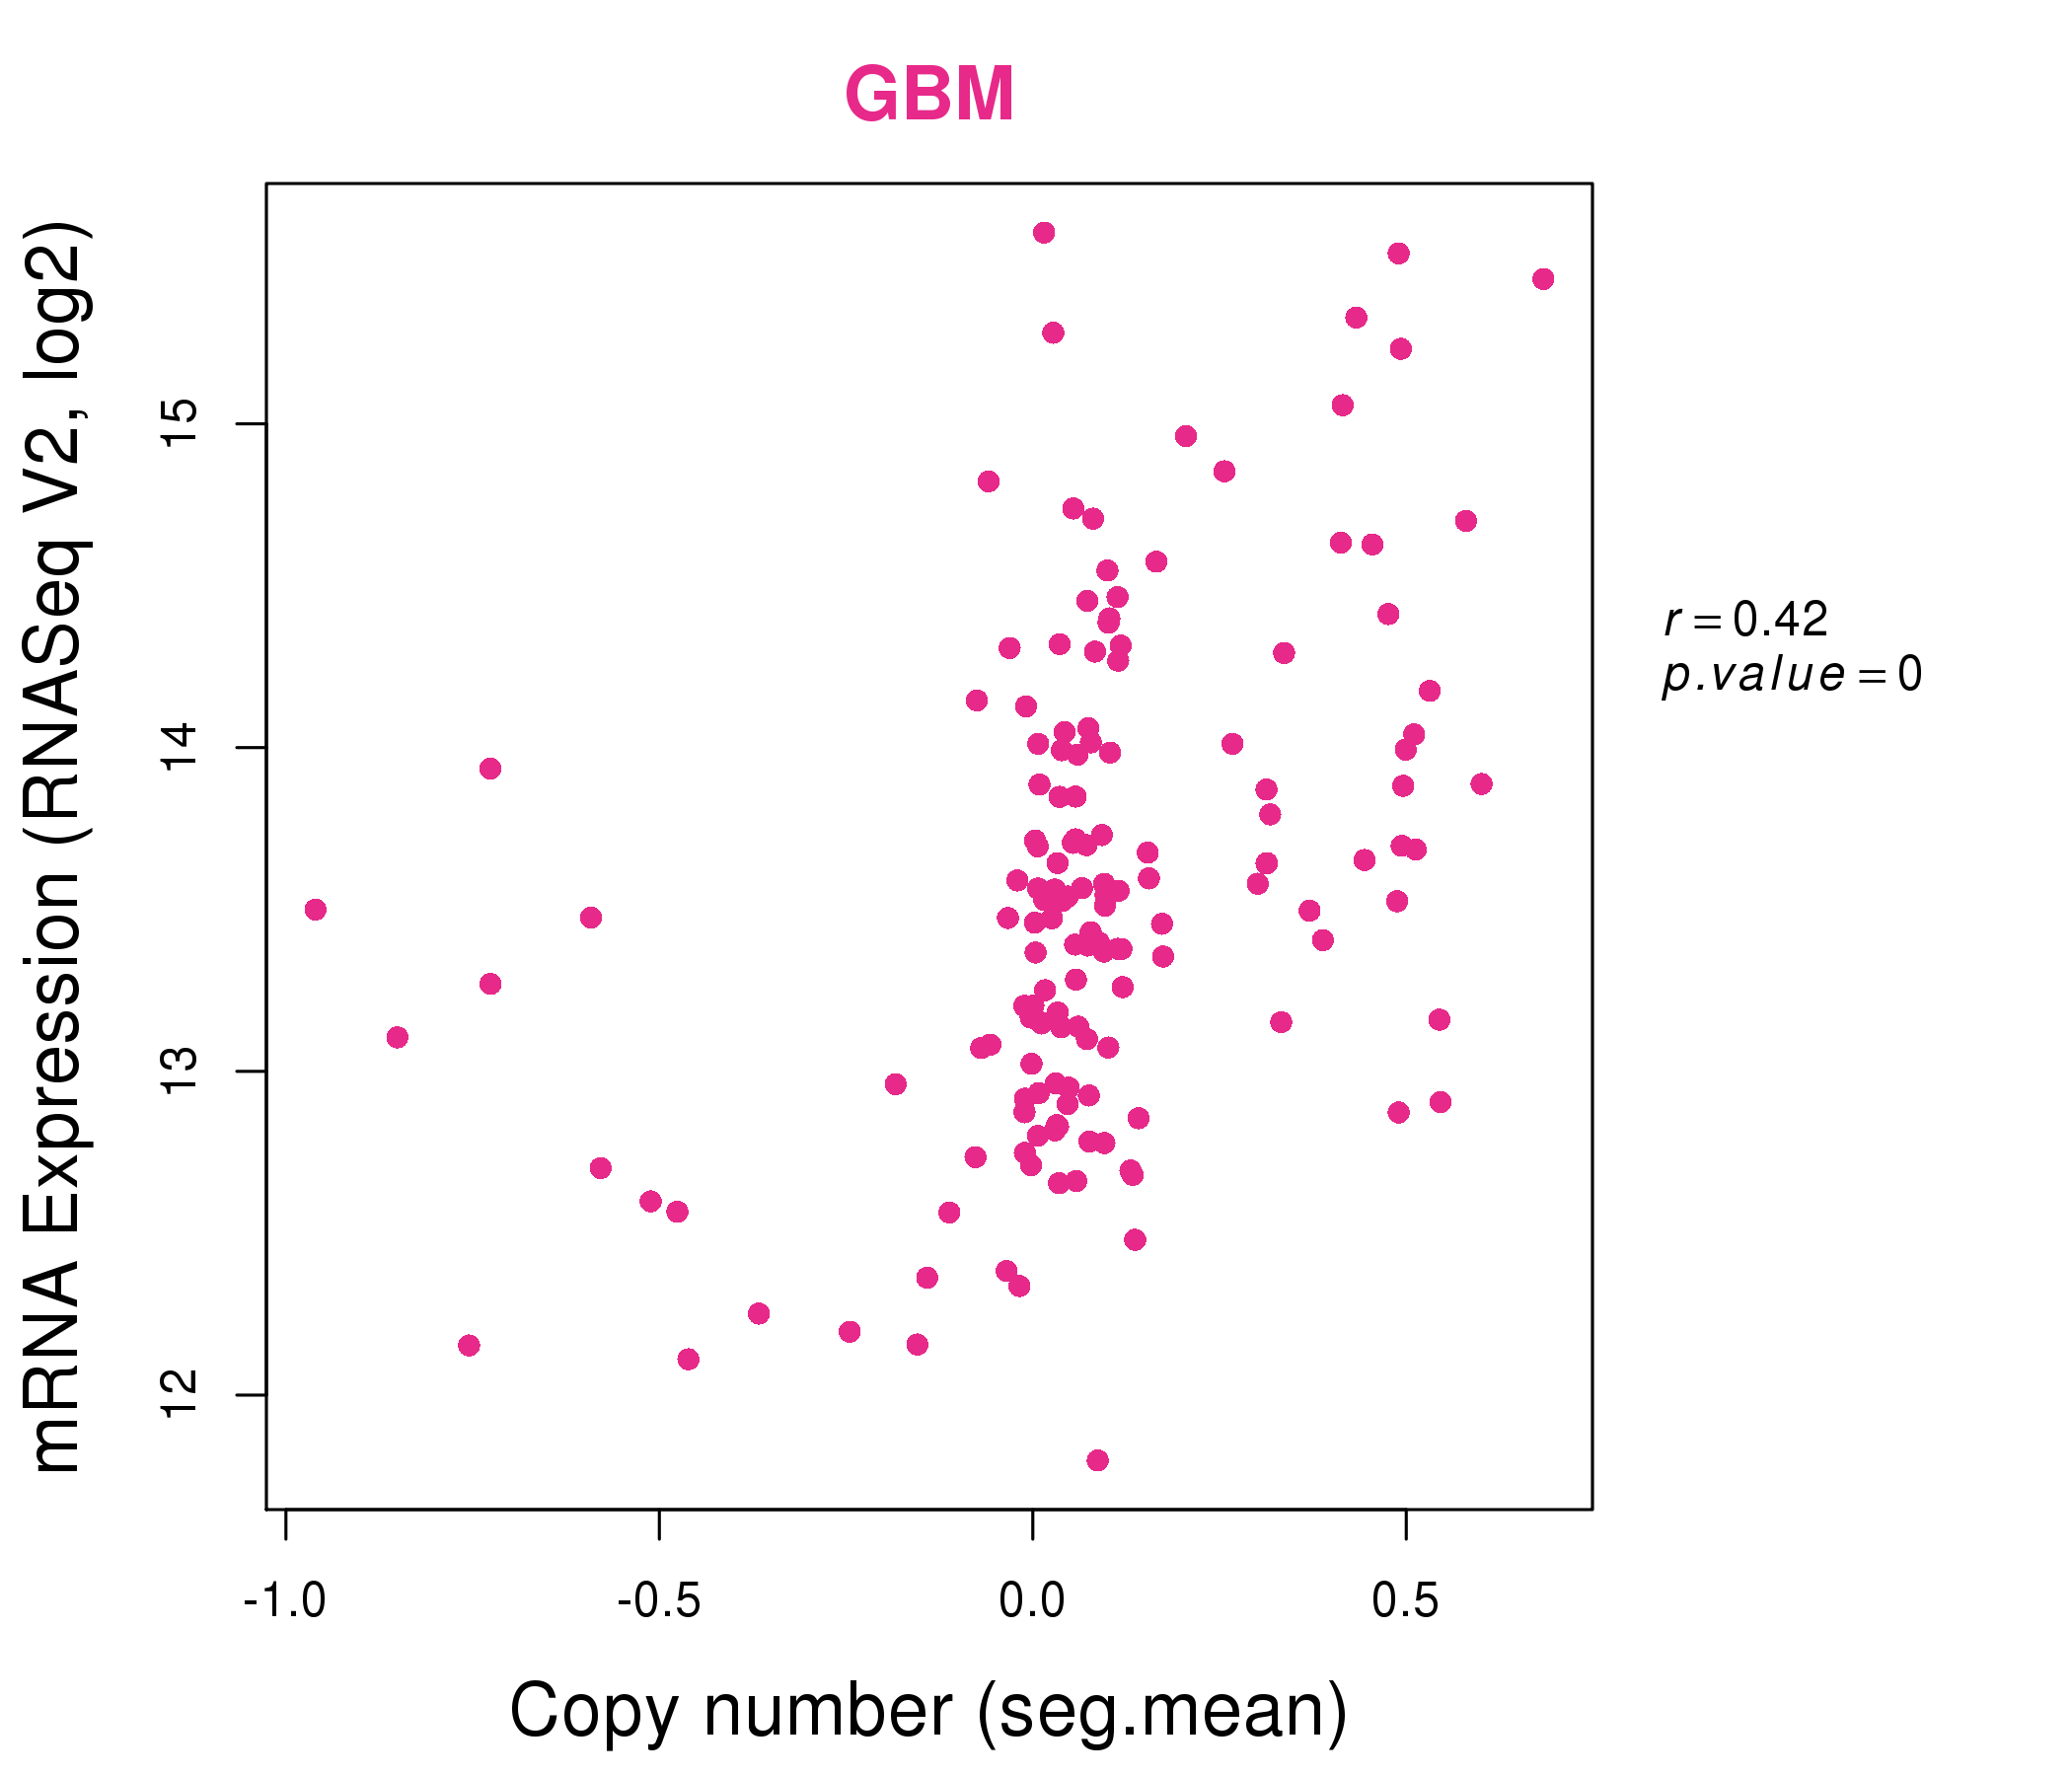
| * This plots show the correlation between CNV and gene expression. |
: Open all plots for all cancer types
 |
|
 |
|
| Top |
| Gene-Gene Network Information |
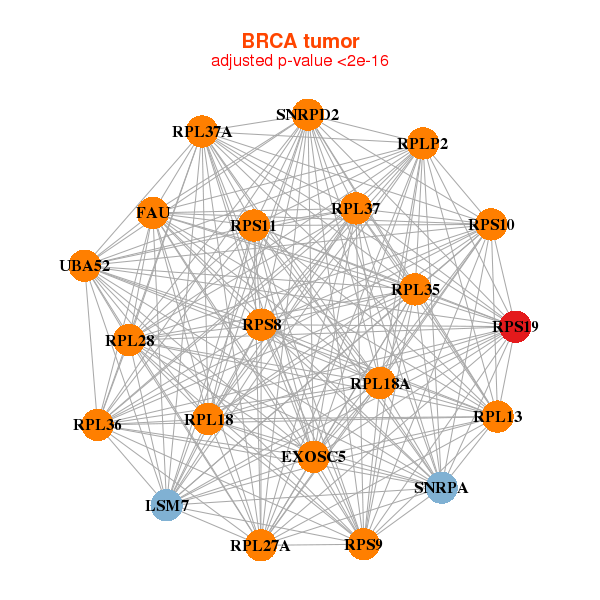
| * Co-Expression network figures were drawn using R package igraph. Only the top 20 genes with the highest correlations were shown. Red circle: input gene, orange circle: cell metabolism gene, sky circle: other gene |
: Open all plots for all cancer types
 |
|
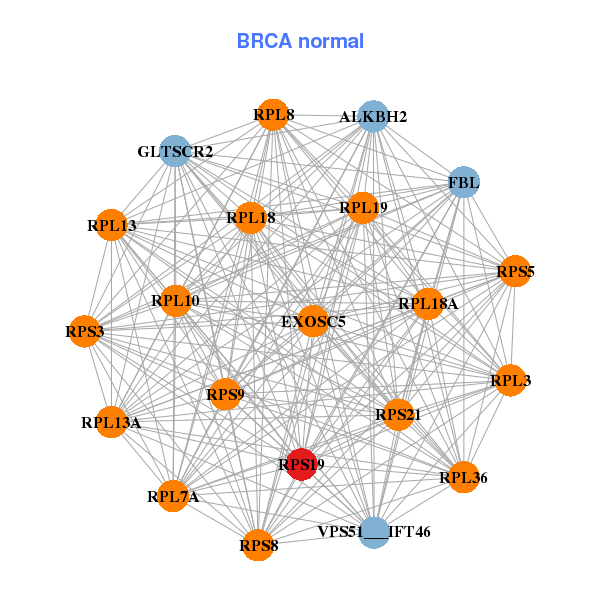
| EXOSC5,FAU,LSM7,RPL13,RPL18,RPL18A,RPL27A, RPL28,RPL35,RPL36,RPL37,RPL37A,RPLP2,RPS10, RPS11,RPS19,RPS8,RPS9,SNRPA,SNRPD2,UBA52 | ALKBH2,VPS51___IFT46,EXOSC5,FBL,GLTSCR2,RPL10,RPL13, RPL13A,RPL18,RPL18A,RPL19,RPL3,RPL36,RPL7A, RPL8,RPS19,RPS21,RPS3,RPS5,RPS8,RPS9 |
 |
|
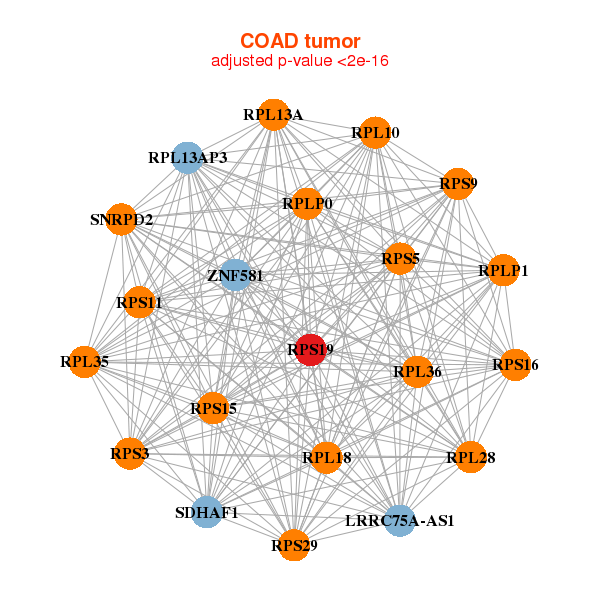
| LRRC75A-AS1,RPL10,RPL13A,RPL13AP3,RPL18,RPL28,RPL35, RPL36,RPLP0,RPLP1,RPS11,RPS15,RPS16,RPS19, RPS29,RPS3,RPS5,RPS9,SDHAF1,SNRPD2,ZNF581 | EEF1G,GNB2L1,RPL13,RPL18,RPL18A,RPL19,RPL23A, RPL32,RPL36,RPL37,RPL37A,RPL38,RPL8,RPLP0, RPS15,RPS16,RPS19,RPS23,RPS3,RPS9,UBA52 |
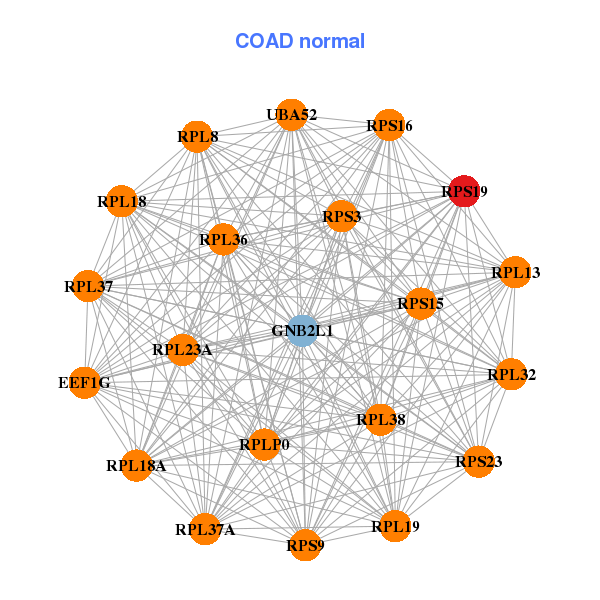
| * Co-Expression network figures were drawn using R package igraph. Only the top 20 genes with the highest correlations were shown. Red circle: input gene, orange circle: cell metabolism gene, sky circle: other gene |
: Open all plots for all cancer types
| Top |
: Open all interacting genes' information including KEGG pathway for all interacting genes from DAVID
| Top |
| Pharmacological Information for RPS19 |
| There's no related Drug. |
| Top |
| Cross referenced IDs for RPS19 |
| * We obtained these cross-references from Uniprot database. It covers 150 different DBs, 18 categories. http://www.uniprot.org/help/cross_references_section |
: Open all cross reference information
|
Copyright © 2016-Present - The Univsersity of Texas Health Science Center at Houston @ |