|
||||||||||||||||||||
| |
| Phenotypic Information (metabolism pathway, cancer, disease, phenome) |
| |
| |
| Gene-Gene Network Information: Co-Expression Network, Interacting Genes & KEGG |
| |
|


| Gene Summary for RPS23 |
| Basic gene info. | Gene symbol | RPS23 |
| Gene name | ribosomal protein S23 | |
| Synonyms | S23 | |
| Cytomap | UCSC genome browser: 5q14.2 | |
| Genomic location | chr5 :81569138-81574235 | |
| Type of gene | protein-coding | |
| RefGenes | NM_001025.4, | |
| Ensembl id | ENSG00000186468 | |
| Description | 40S ribosomal protein S23homolog of yeast ribosomal protein S28 | |
| Modification date | 20141207 | |
| dbXrefs | MIM : 603683 | |
| HGNC : HGNC | ||
| Ensembl : ENSG00000186468 | ||
| HPRD : 04729 | ||
| Vega : OTTHUMG00000162557 | ||
| Protein | UniProt: go to UniProt's Cross Reference DB Table | |
| Expression | CleanEX: HS_RPS23 | |
| BioGPS: 6228 | ||
| Gene Expression Atlas: ENSG00000186468 | ||
| The Human Protein Atlas: ENSG00000186468 | ||
| Pathway | NCI Pathway Interaction Database: RPS23 | |
| KEGG: RPS23 | ||
| REACTOME: RPS23 | ||
| ConsensusPathDB | ||
| Pathway Commons: RPS23 | ||
| Metabolism | MetaCyc: RPS23 | |
| HUMANCyc: RPS23 | ||
| Regulation | Ensembl's Regulation: ENSG00000186468 | |
| miRBase: chr5 :81,569,138-81,574,235 | ||
| TargetScan: NM_001025 | ||
| cisRED: ENSG00000186468 | ||
| Context | iHOP: RPS23 | |
| cancer metabolism search in PubMed: RPS23 | ||
| UCL Cancer Institute: RPS23 | ||
| Assigned class in ccmGDB | C | |
| Top |
| Phenotypic Information for RPS23(metabolism pathway, cancer, disease, phenome) |
| Cancer | CGAP: RPS23 |
| Familial Cancer Database: RPS23 | |
| * This gene is included in those cancer gene databases. |
|
|
|
|
|
| . | ||||||||||||||
Oncogene 1 | Significant driver gene in | |||||||||||||||||||
| cf) number; DB name 1 Oncogene; http://nar.oxfordjournals.org/content/35/suppl_1/D721.long, 2 Tumor Suppressor gene; https://bioinfo.uth.edu/TSGene/, 3 Cancer Gene Census; http://www.nature.com/nrc/journal/v4/n3/abs/nrc1299.html, 4 CancerGenes; http://nar.oxfordjournals.org/content/35/suppl_1/D721.long, 5 Network of Cancer Gene; http://ncg.kcl.ac.uk/index.php, 1Therapeutic Vulnerabilities in Cancer; http://cbio.mskcc.org/cancergenomics/statius/ |
| REACTOME_METABOLISM_OF_PROTEINS REACTOME_METABOLISM_OF_MRNA REACTOME_METABOLISM_OF_RNA | |
| OMIM | |
| Orphanet | |
| Disease | KEGG Disease: RPS23 |
| MedGen: RPS23 (Human Medical Genetics with Condition) | |
| ClinVar: RPS23 | |
| Phenotype | MGI: RPS23 (International Mouse Phenotyping Consortium) |
| PhenomicDB: RPS23 | |
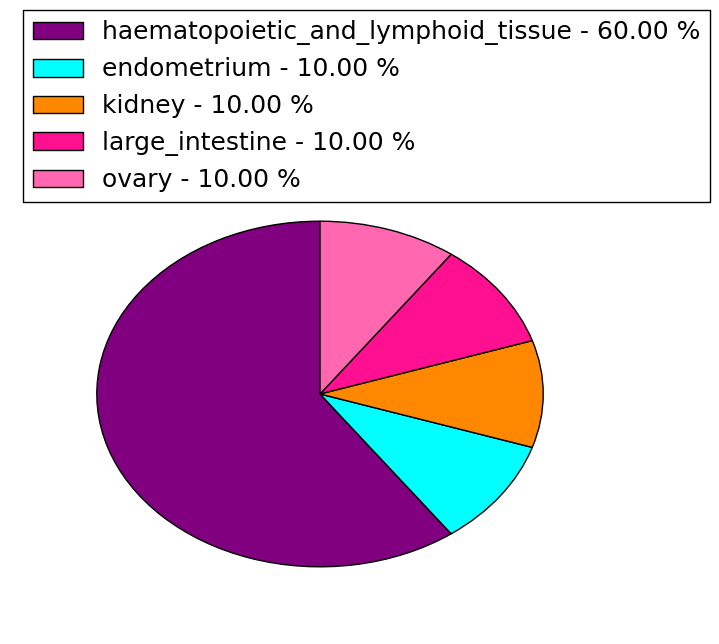
| Mutations for RPS23 |
| * Under tables are showing count per each tissue to give us broad intuition about tissue specific mutation patterns.You can go to the detailed page for each mutation database's web site. |
| There's no structural variation information in COSMIC data for this gene. |
| * From mRNA Sanger sequences, Chitars2.0 arranged chimeric transcripts. This table shows RPS23 related fusion information. |
| ID | Head Gene | Tail Gene | Accession | Gene_a | qStart_a | qEnd_a | Chromosome_a | tStart_a | tEnd_a | Gene_a | qStart_a | qEnd_a | Chromosome_a | tStart_a | tEnd_a |
| AI908980 | RPS23 | 14 | 188 | 5 | 81573514 | 81574155 | RPS24 | 189 | 253 | 10 | 79799960 | 79800413 | |
| BQ222647 | RPS23 | 1 | 497 | 5 | 81571879 | 81574158 | MRPL30 | 483 | 505 | 2 | 99879071 | 99879093 | |
| BM785206 | TUBA1C | 4 | 389 | 12 | 49658867 | 49663672 | RPS23 | 383 | 455 | 5 | 81571883 | 81571955 | |
| AI889745 | NLGN4X | 1 | 44 | X | 6143720 | 6143763 | RPS23 | 39 | 108 | 5 | 81571879 | 81571948 | |
| BF154662 | SNX19 | 1 | 246 | 11 | 130750593 | 130753340 | RPS23 | 238 | 380 | 5 | 81572280 | 81573597 | |
| CB217558 | MRPL30 | 21 | 43 | 2 | 99879071 | 99879093 | RPS23 | 29 | 345 | 5 | 81571879 | 81572337 | |
| CA429429 | RPS23 | 13 | 85 | 5 | 81571879 | 81571951 | CCDC80 | 83 | 596 | 3 | 112358666 | 112359590 | |
| AI982804 | EFNA5 | 1 | 137 | 5 | 106713905 | 106714041 | RPS23 | 124 | 486 | 5 | 81571295 | 81571656 | |
| H17554 | CUTA | 1 | 117 | 6 | 4865649 | 4866157 | RPS23 | 101 | 505 | 5 | 81569969 | 81570373 | |
| Top |
| There's no copy number variation information in COSMIC data for this gene. |
| Top |
|
 |
| Top |
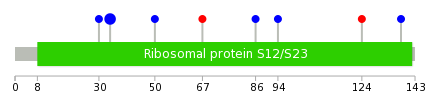
| Stat. for Non-Synonymous SNVs (# total SNVs=1) | (# total SNVs=10) |
 |  |
(# total SNVs=0) | (# total SNVs=0) |
| Top |
| * When you move the cursor on each content, you can see more deailed mutation information on the Tooltip. Those are primary_site,primary_histology,mutation(aa),pubmedID. |
| GRCh37 position | Mutation(aa) | Unique sampleID count |
| chr5:81573670-81573670 | p.G34G | 6 |
| chr5:81574149-81574149 | p.A30A | 1 |
| chr5:81572042-81572042 | p.G138G | 1 |
| chr5:81572228-81572228 | p.N124H | 1 |
| chr5:81572316-81572316 | p.P94P | 1 |
| chr5:81573514-81573514 | p.K86K | 1 |
| chr5:81573573-81573573 | p.A67T | 1 |
| chr5:81573622-81573622 | p.R50R | 1 |
| Top |
|
 |
| Point Mutation/ Tissue ID | 1 | 2 | 3 | 4 | 5 | 6 | 7 | 8 | 9 | 10 | 11 | 12 | 13 | 14 | 15 | 16 | 17 | 18 | 19 | 20 |
| # sample | 1 | 5 | 2 | 1 | ||||||||||||||||
| # mutation | 2 | 5 | 2 | 1 | ||||||||||||||||
| nonsynonymous SNV | 1 | 4 | 1 | |||||||||||||||||
| synonymous SNV | 1 | 1 | 1 | 1 |
| cf) Tissue ID; Tissue type (1; BLCA[Bladder Urothelial Carcinoma], 2; BRCA[Breast invasive carcinoma], 3; CESC[Cervical squamous cell carcinoma and endocervical adenocarcinoma], 4; COAD[Colon adenocarcinoma], 5; GBM[Glioblastoma multiforme], 6; Glioma Low Grade, 7; HNSC[Head and Neck squamous cell carcinoma], 8; KICH[Kidney Chromophobe], 9; KIRC[Kidney renal clear cell carcinoma], 10; KIRP[Kidney renal papillary cell carcinoma], 11; LAML[Acute Myeloid Leukemia], 12; LUAD[Lung adenocarcinoma], 13; LUSC[Lung squamous cell carcinoma], 14; OV[Ovarian serous cystadenocarcinoma ], 15; PAAD[Pancreatic adenocarcinoma], 16; PRAD[Prostate adenocarcinoma], 17; SKCM[Skin Cutaneous Melanoma], 18:STAD[Stomach adenocarcinoma], 19:THCA[Thyroid carcinoma], 20:UCEC[Uterine Corpus Endometrial Carcinoma]) |
| Top |
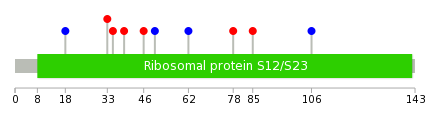
| * We represented just top 10 SNVs. When you move the cursor on each content, you can see more deailed mutation information on the Tooltip. Those are primary_site, primary_histology, mutation(aa), pubmedID. |
| Genomic Position | Mutation(aa) | Unique sampleID count |
| chr5:81573560 | p.G33D | 1 |
| chr5:81573573 | p.R18R | 1 |
| chr5:81573578 | p.G106G | 1 |
| chr5:81573622 | p.V85L | 1 |
| chr5:81572042 | p.G78D | 1 |
| chr5:81572249 | p.P62P | 1 |
| chr5:81572269 | p.I50I | 1 |
| chr5:81572316 | p.H46Y | 1 |
| chr5:81573526 | p.N39T | 1 |
| chr5:81573540 | p.A35T | 1 |
| * Copy number data were extracted from TCGA using R package TCGA-Assembler. The URLs of all public data files on TCGA DCC data server were gathered on Jan-05-2015. Function ProcessCNAData in TCGA-Assembler package was used to obtain gene-level copy number value which is calculated as the average copy number of the genomic region of a gene. |
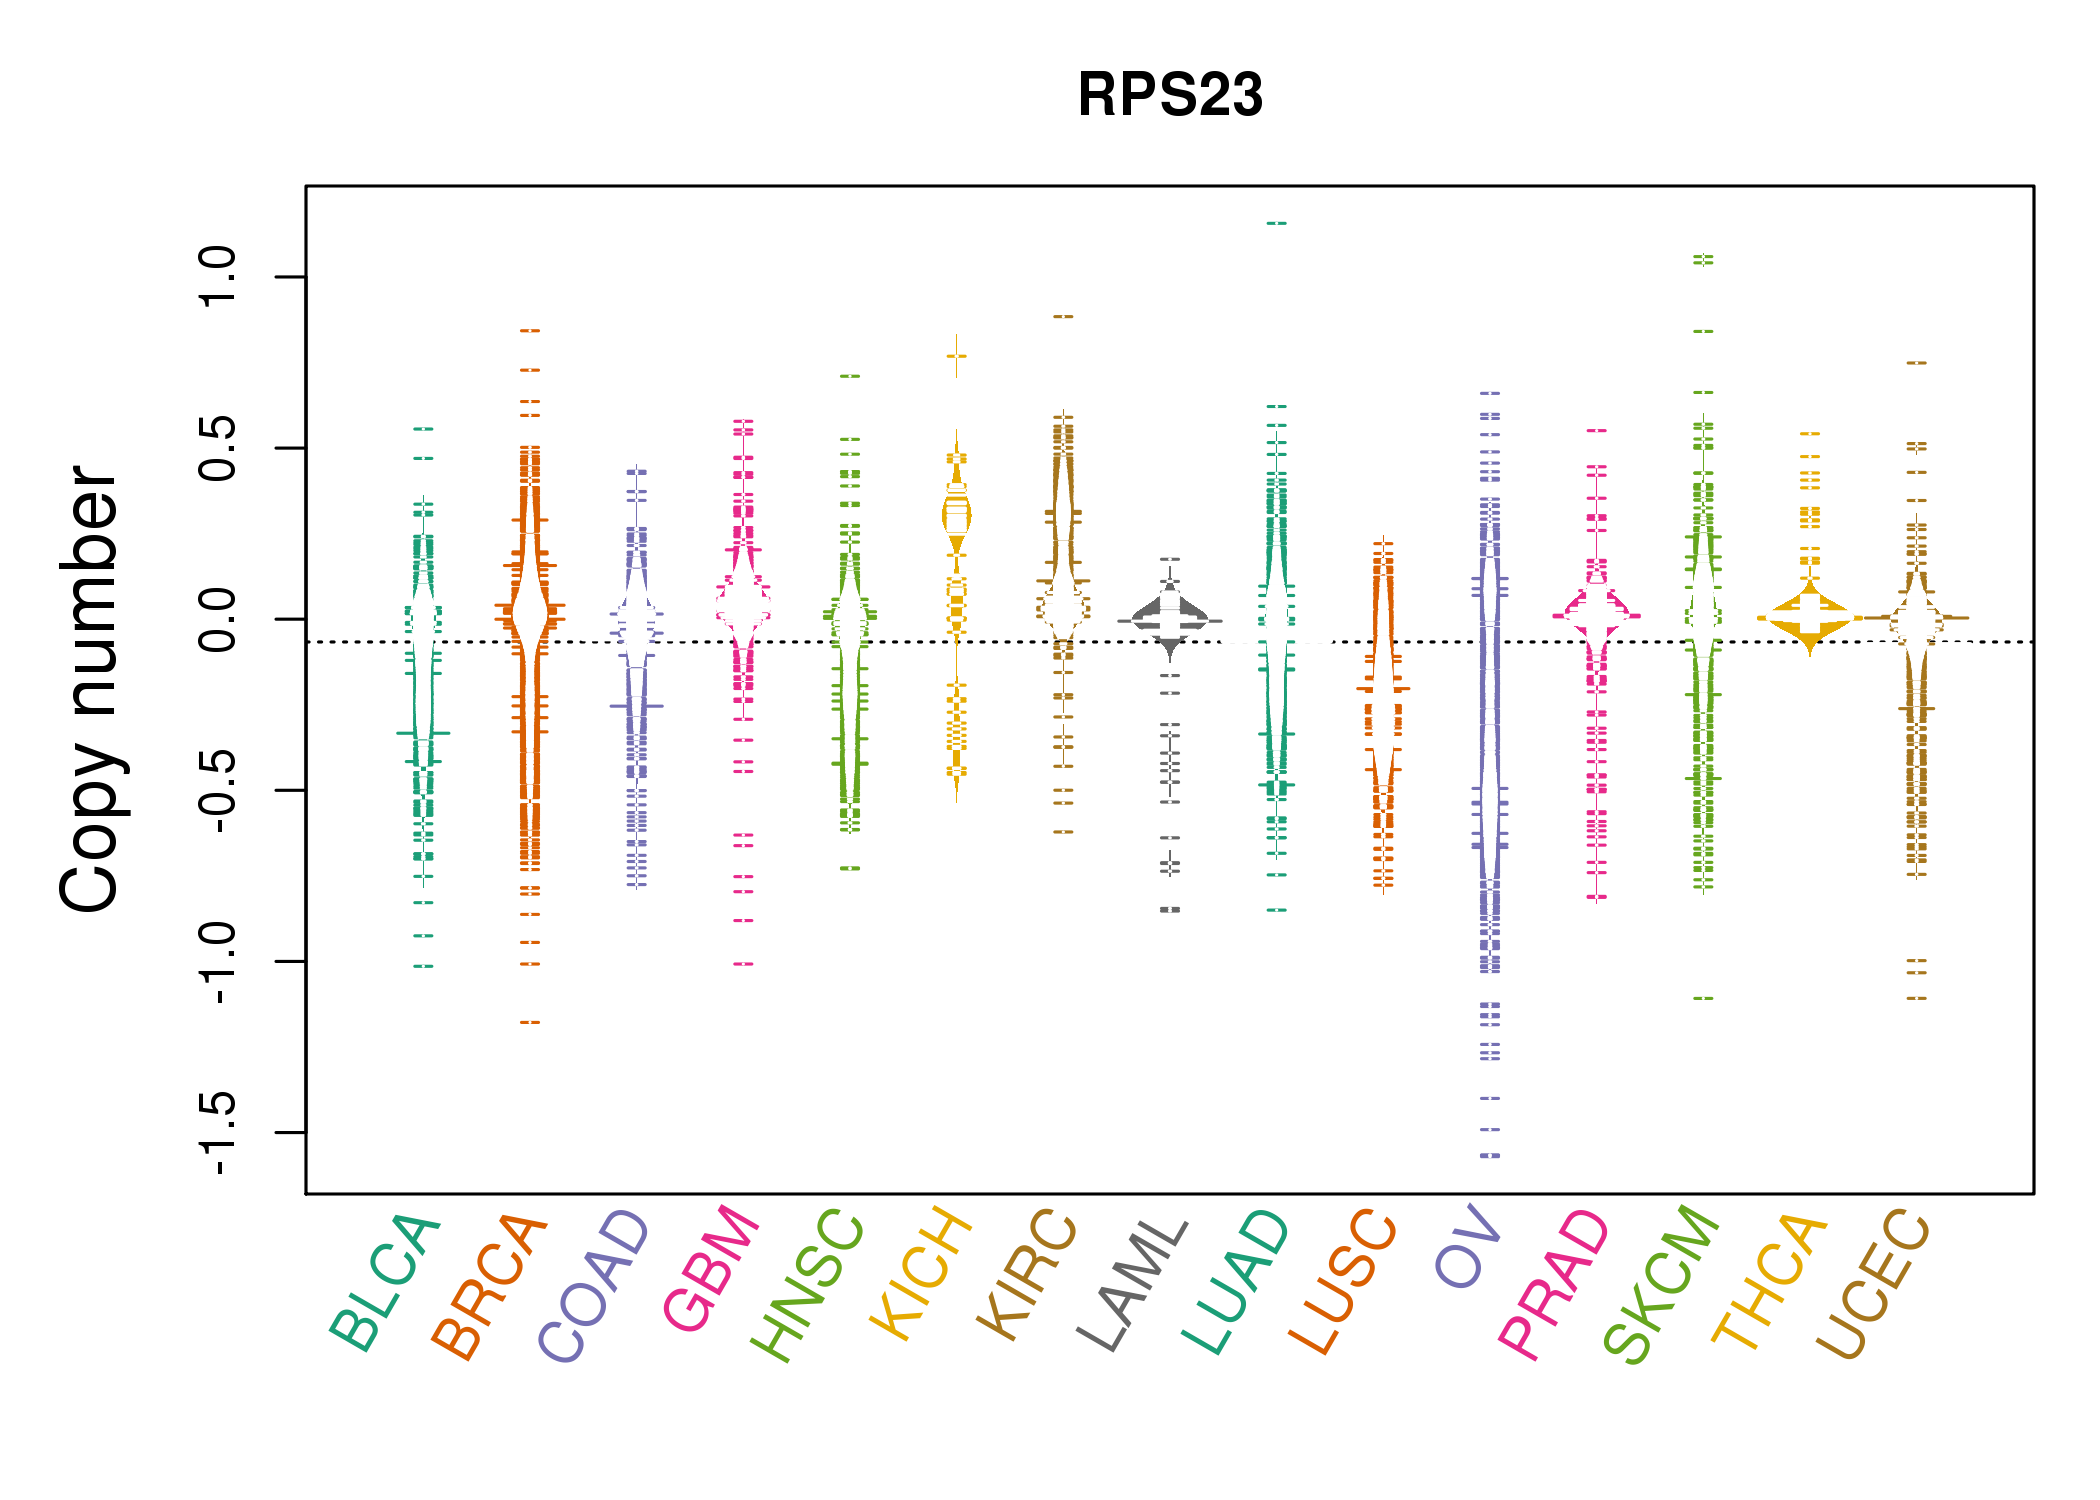 |
| cf) Tissue ID[Tissue type]: BLCA[Bladder Urothelial Carcinoma], BRCA[Breast invasive carcinoma], CESC[Cervical squamous cell carcinoma and endocervical adenocarcinoma], COAD[Colon adenocarcinoma], GBM[Glioblastoma multiforme], Glioma Low Grade, HNSC[Head and Neck squamous cell carcinoma], KICH[Kidney Chromophobe], KIRC[Kidney renal clear cell carcinoma], KIRP[Kidney renal papillary cell carcinoma], LAML[Acute Myeloid Leukemia], LUAD[Lung adenocarcinoma], LUSC[Lung squamous cell carcinoma], OV[Ovarian serous cystadenocarcinoma ], PAAD[Pancreatic adenocarcinoma], PRAD[Prostate adenocarcinoma], SKCM[Skin Cutaneous Melanoma], STAD[Stomach adenocarcinoma], THCA[Thyroid carcinoma], UCEC[Uterine Corpus Endometrial Carcinoma] |
| Top |
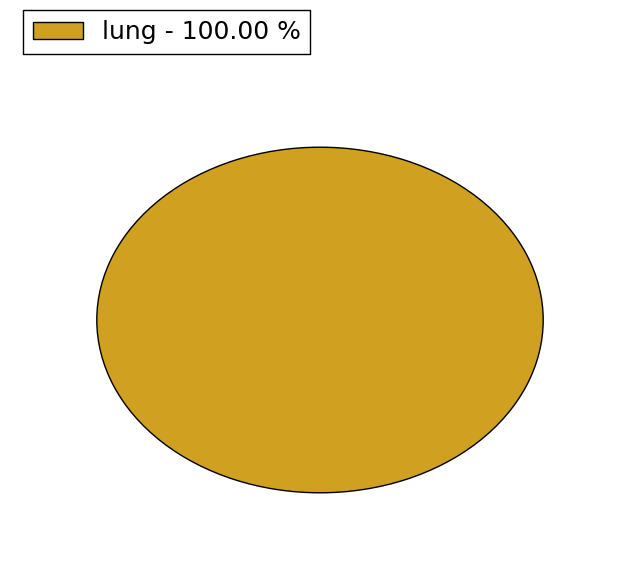
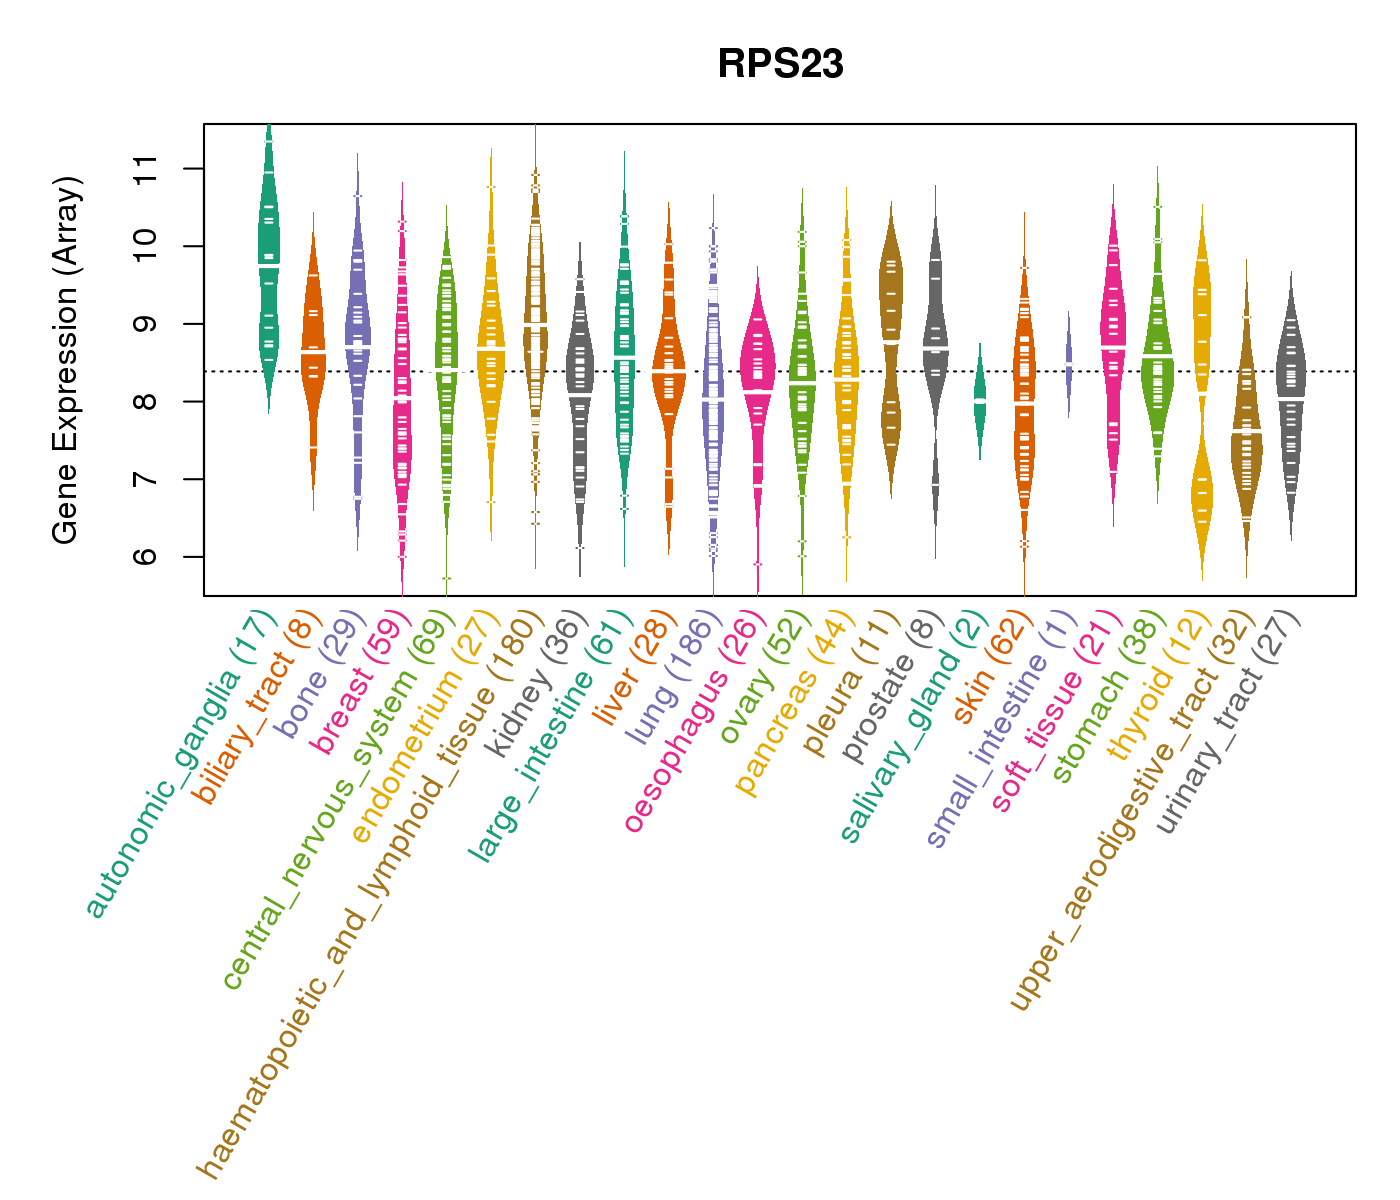
| Gene Expression for RPS23 |
| * CCLE gene expression data were extracted from CCLE_Expression_Entrez_2012-10-18.res: Gene-centric RMA-normalized mRNA expression data. |
 |
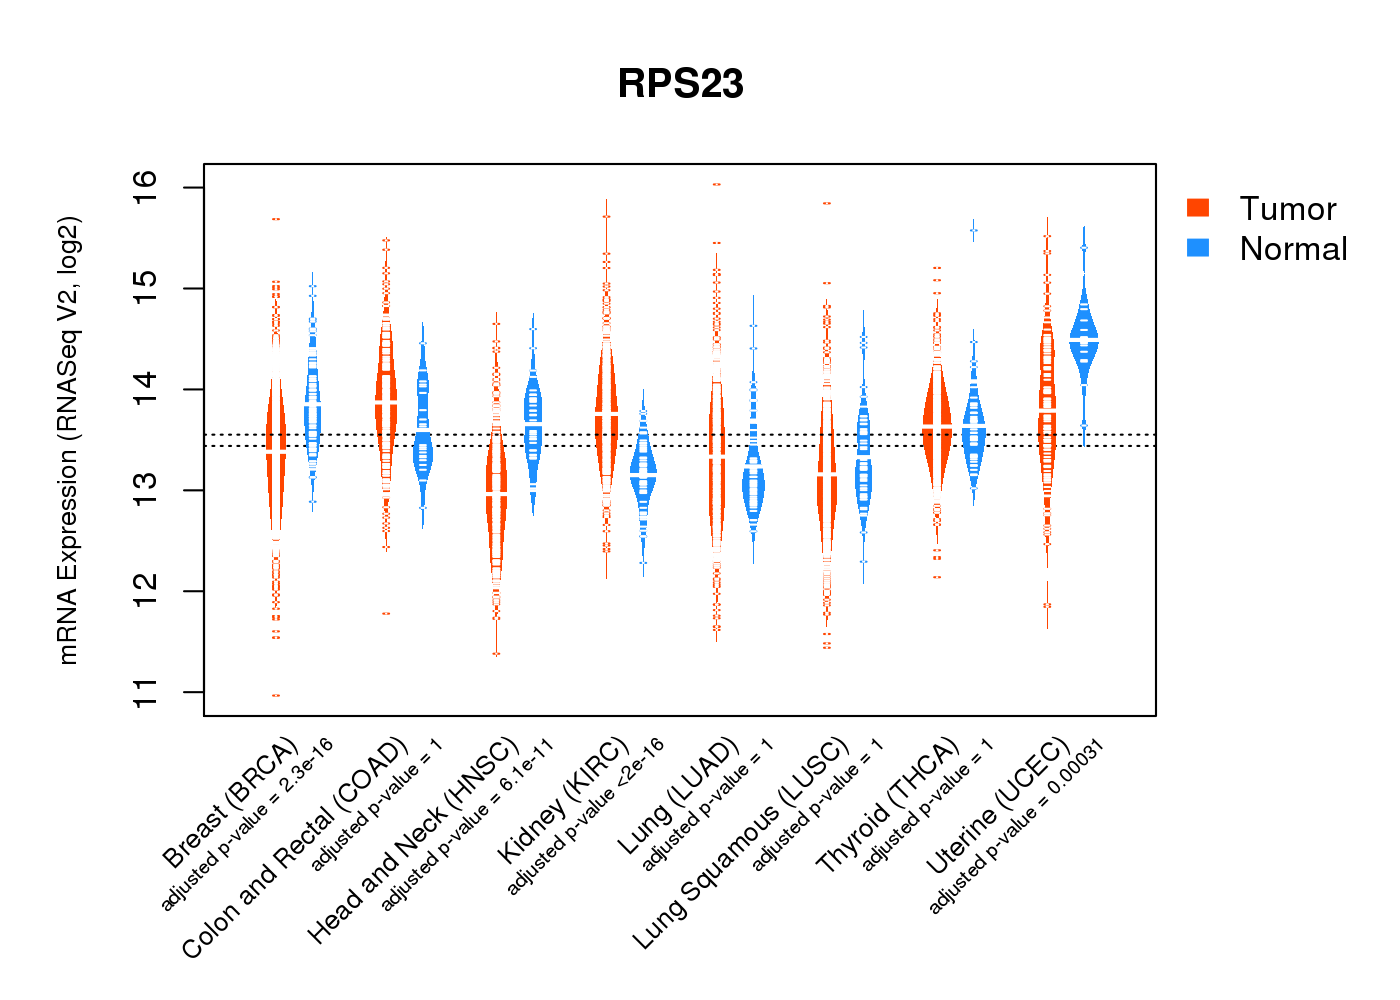
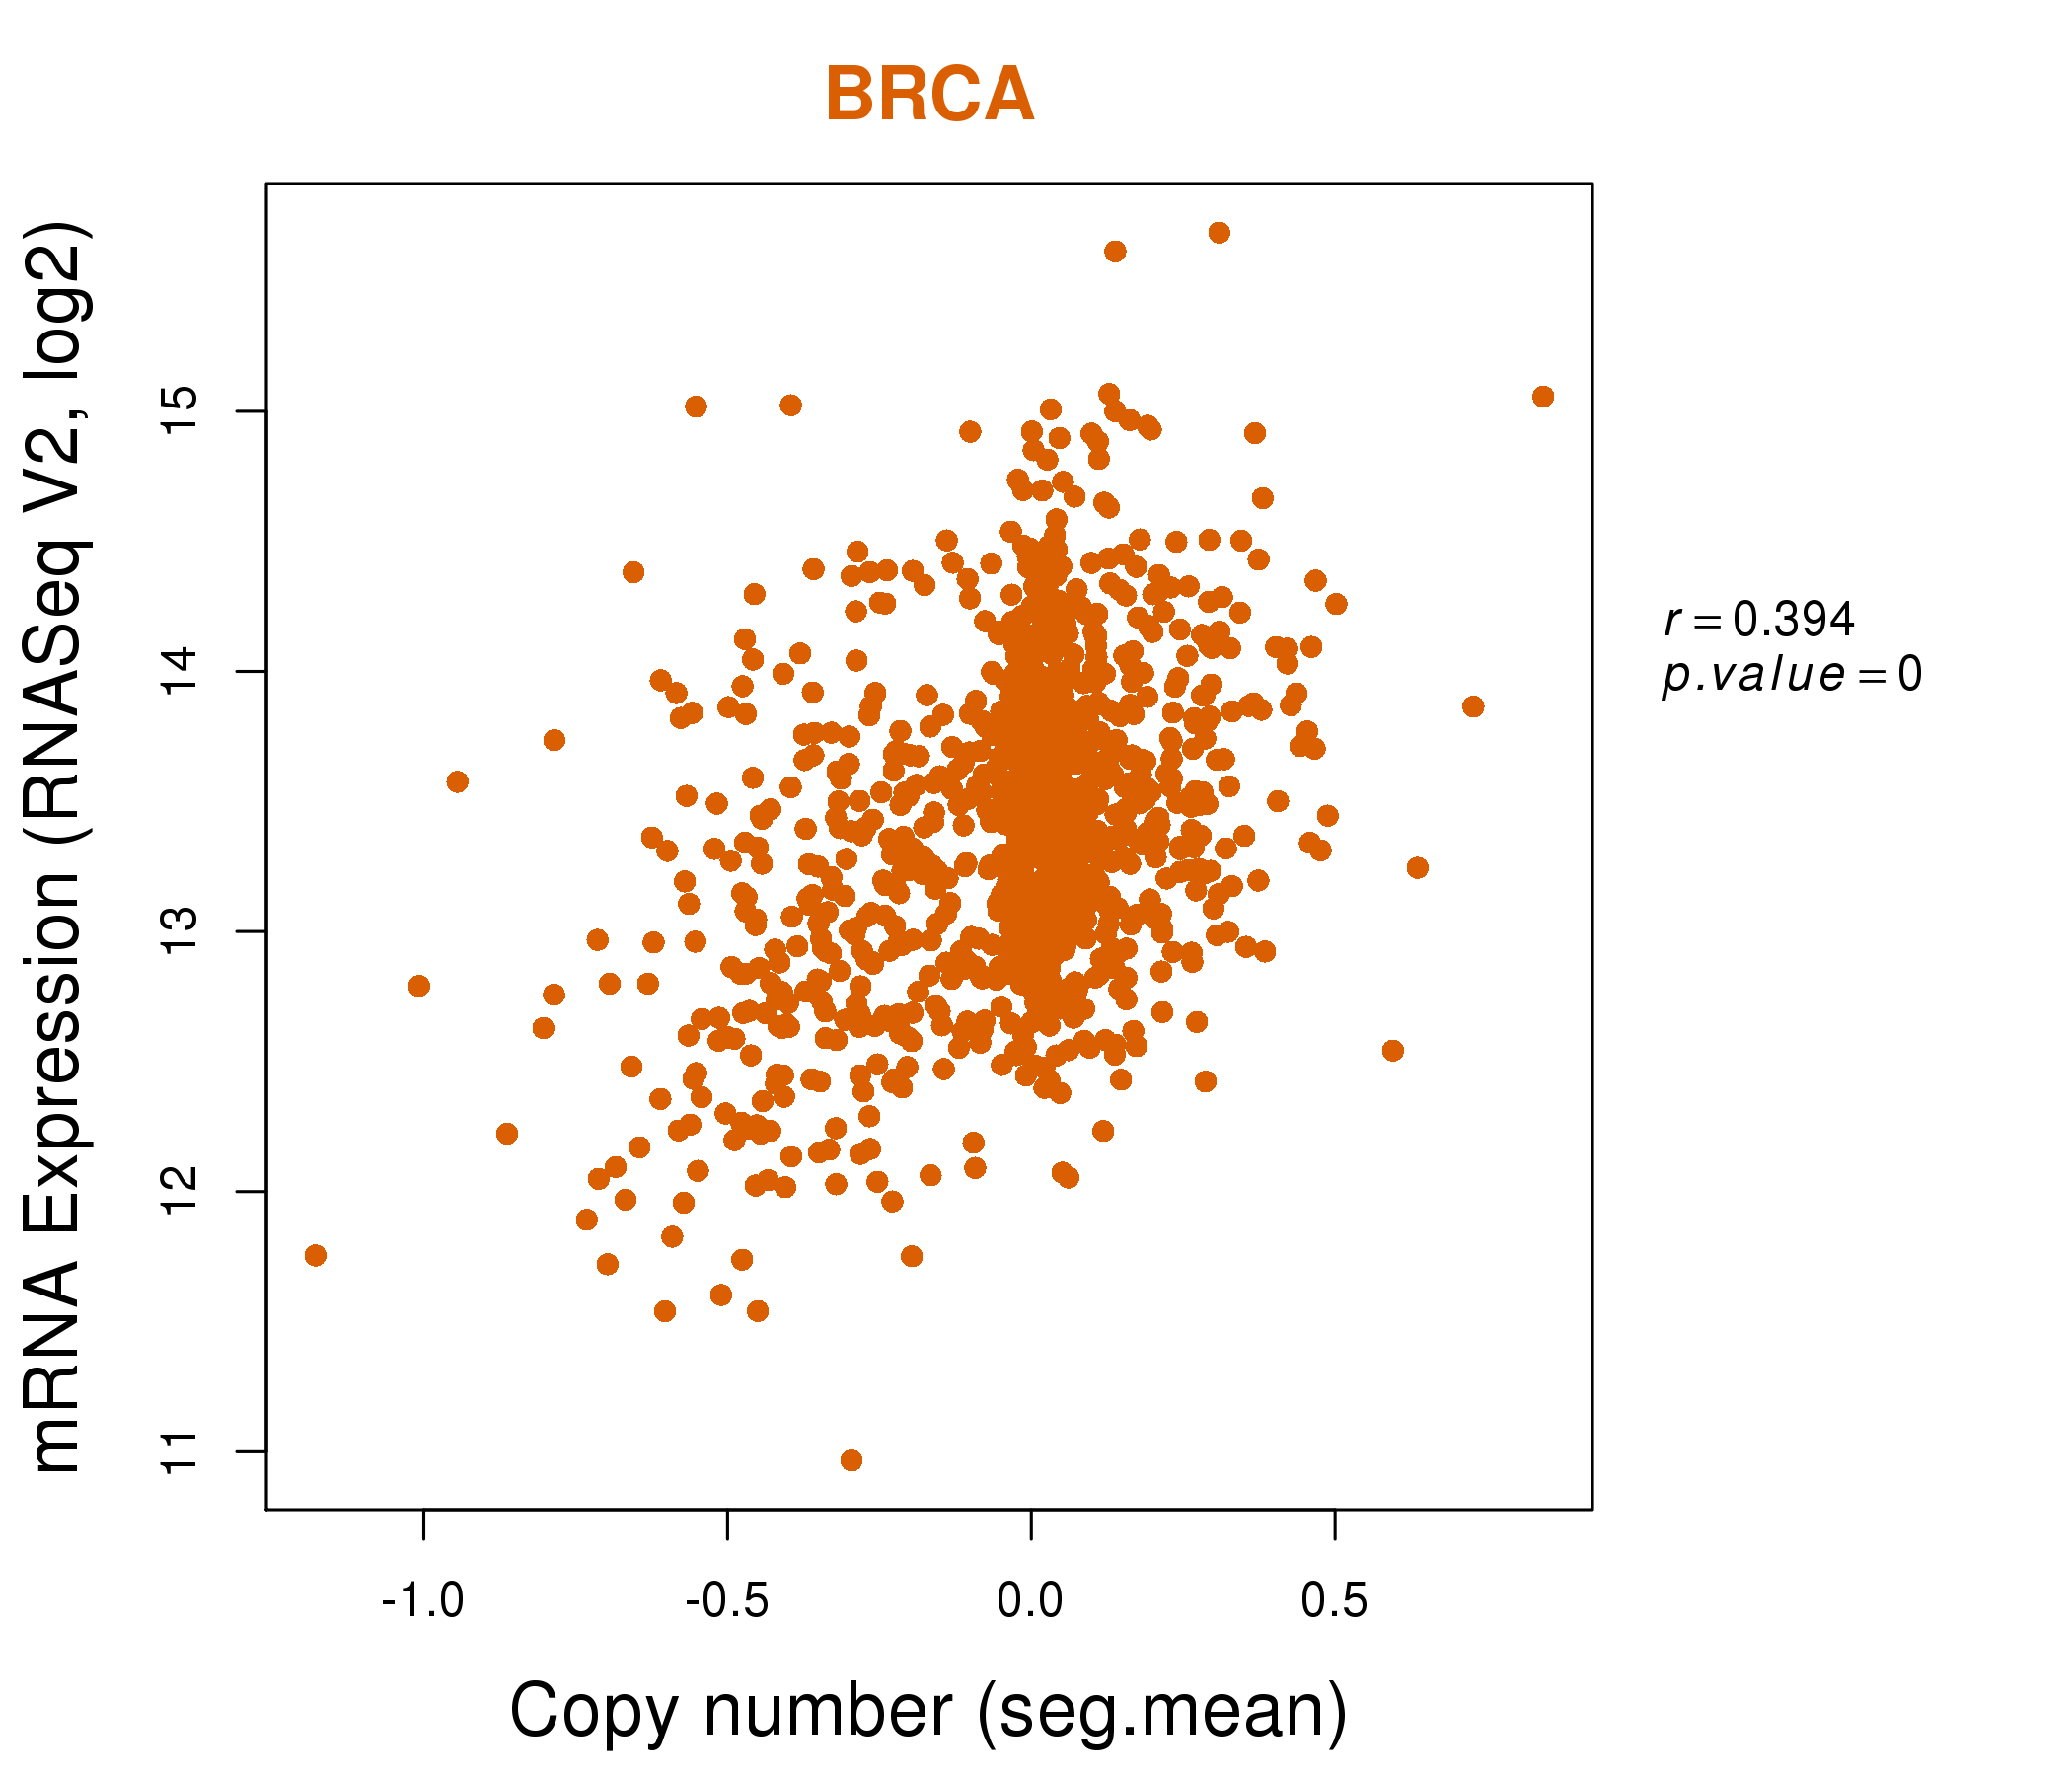
| * Normalized gene expression data of RNASeqV2 was extracted from TCGA using R package TCGA-Assembler. The URLs of all public data files on TCGA DCC data server were gathered at Jan-05-2015. Only eight cancer types have enough normal control samples for differential expression analysis. (t test, adjusted p<0.05 (using Benjamini-Hochberg FDR)) |
 |
| Top |
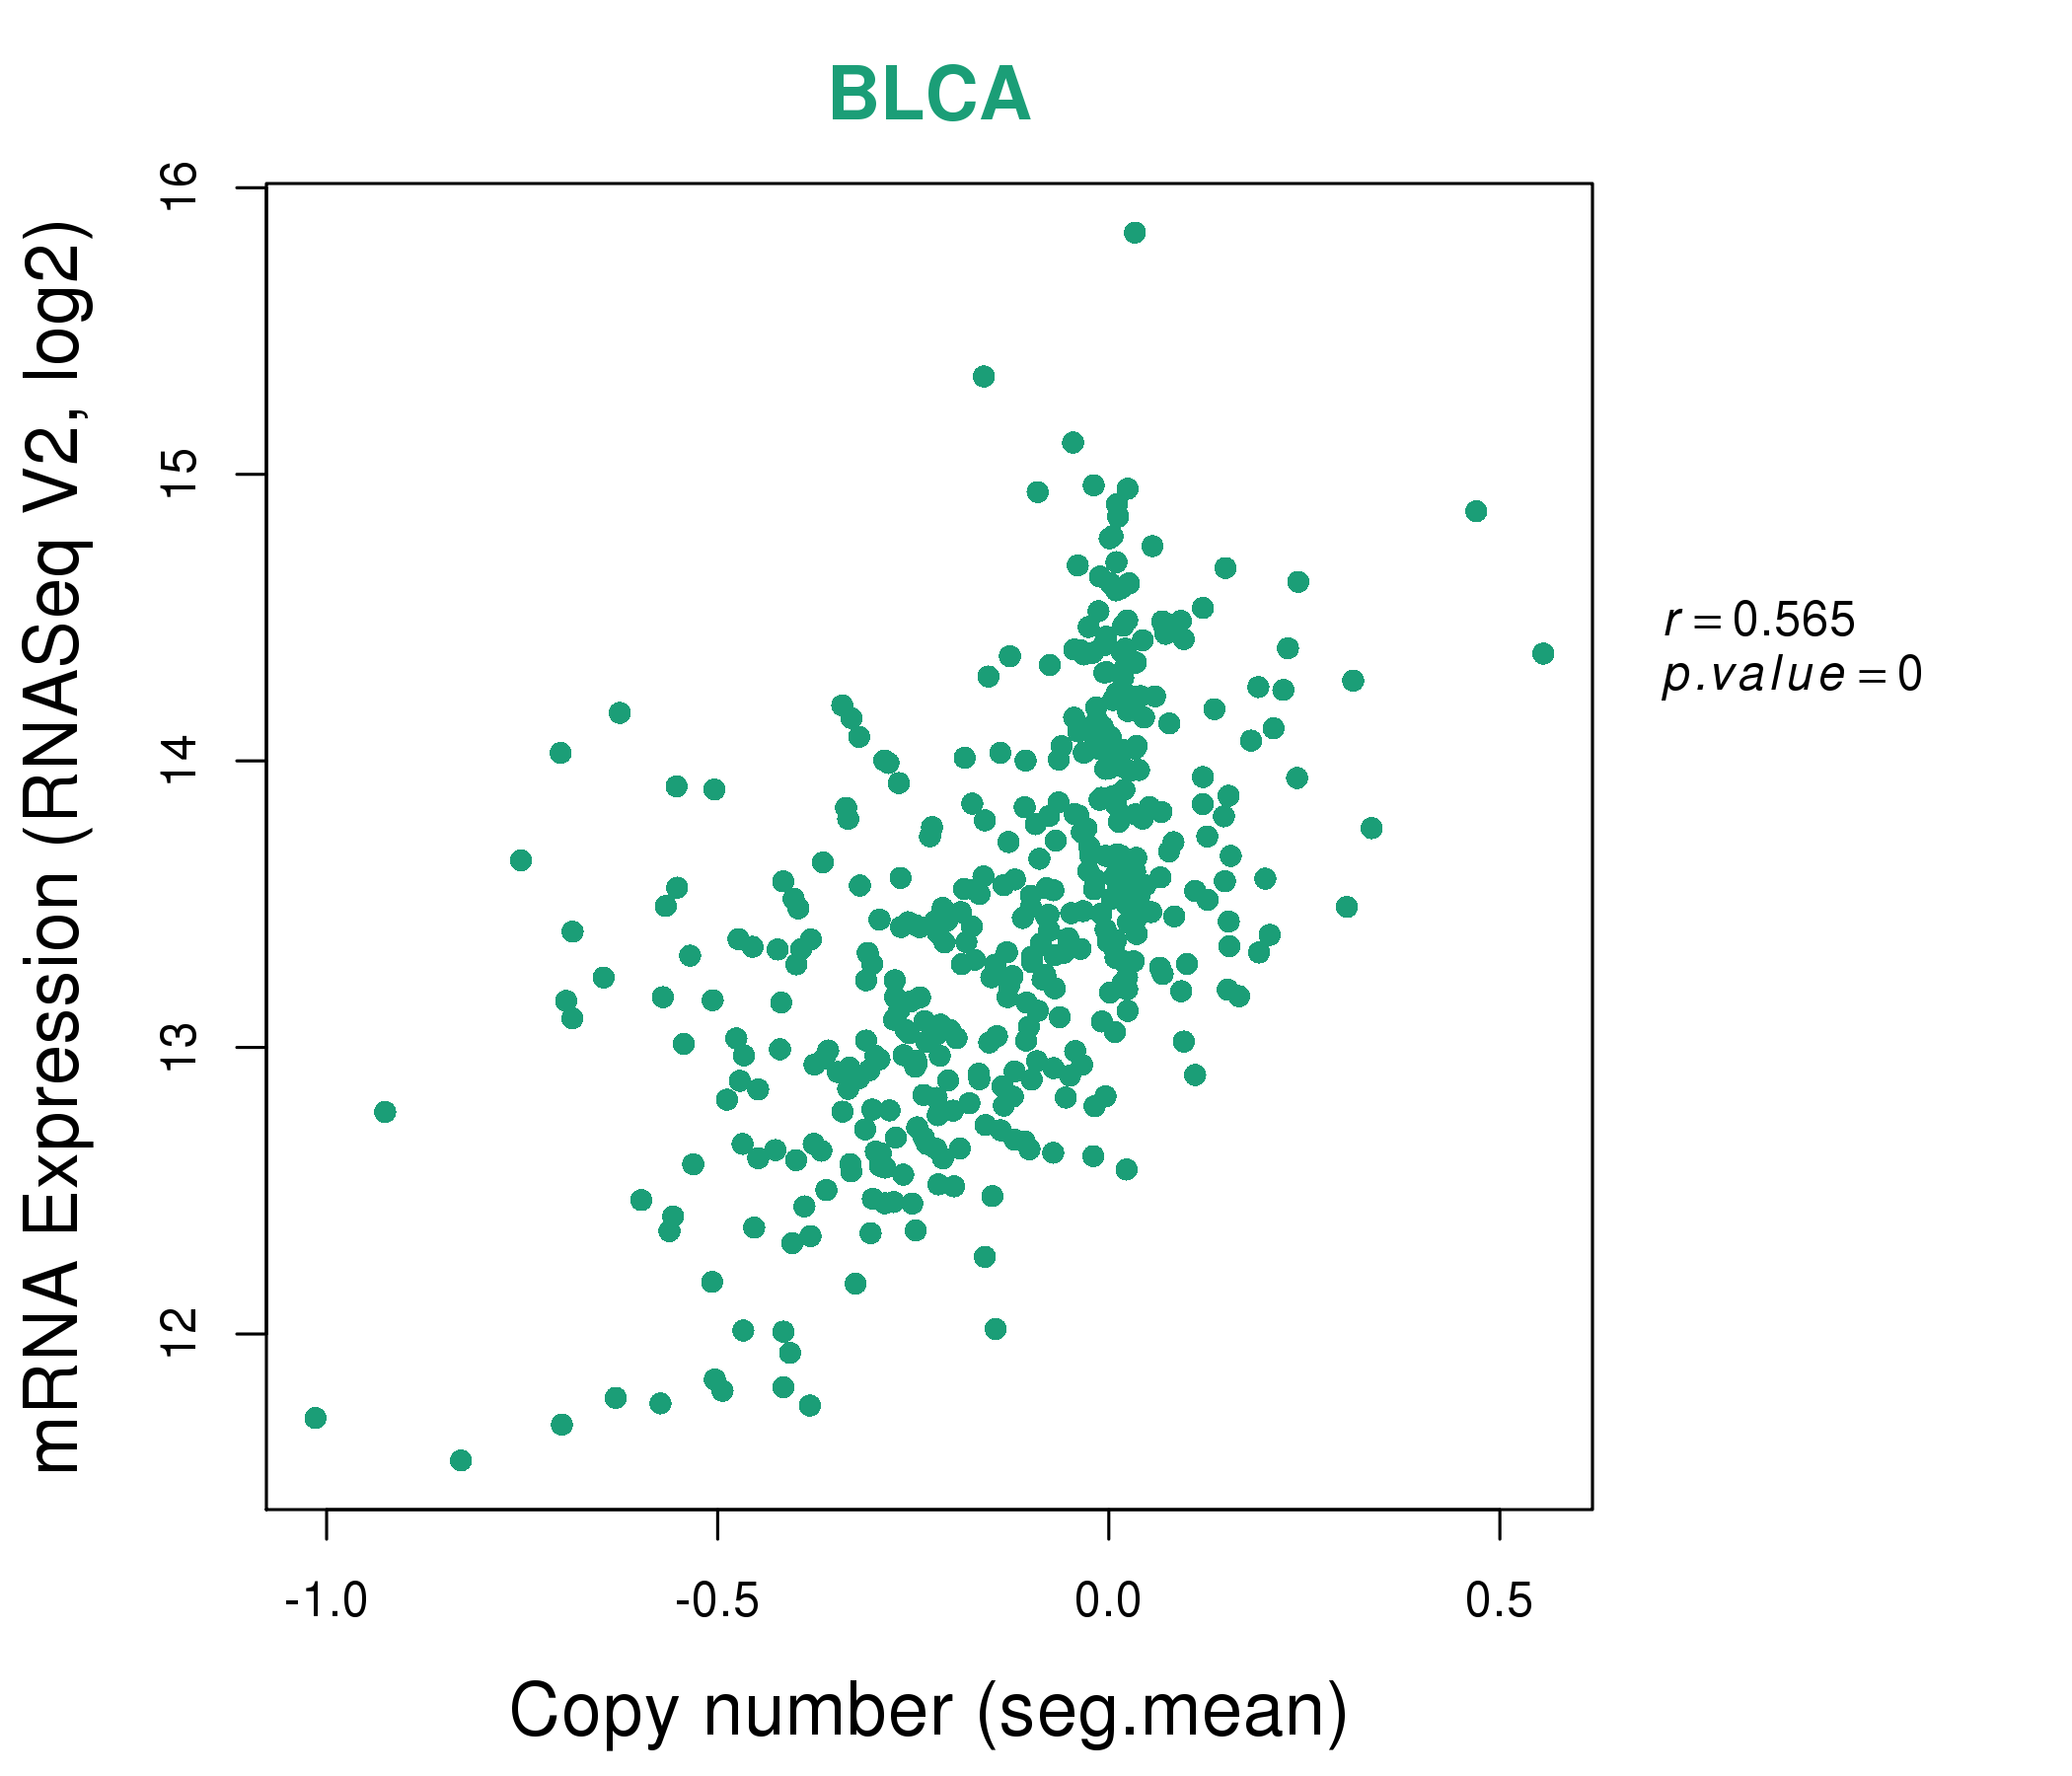
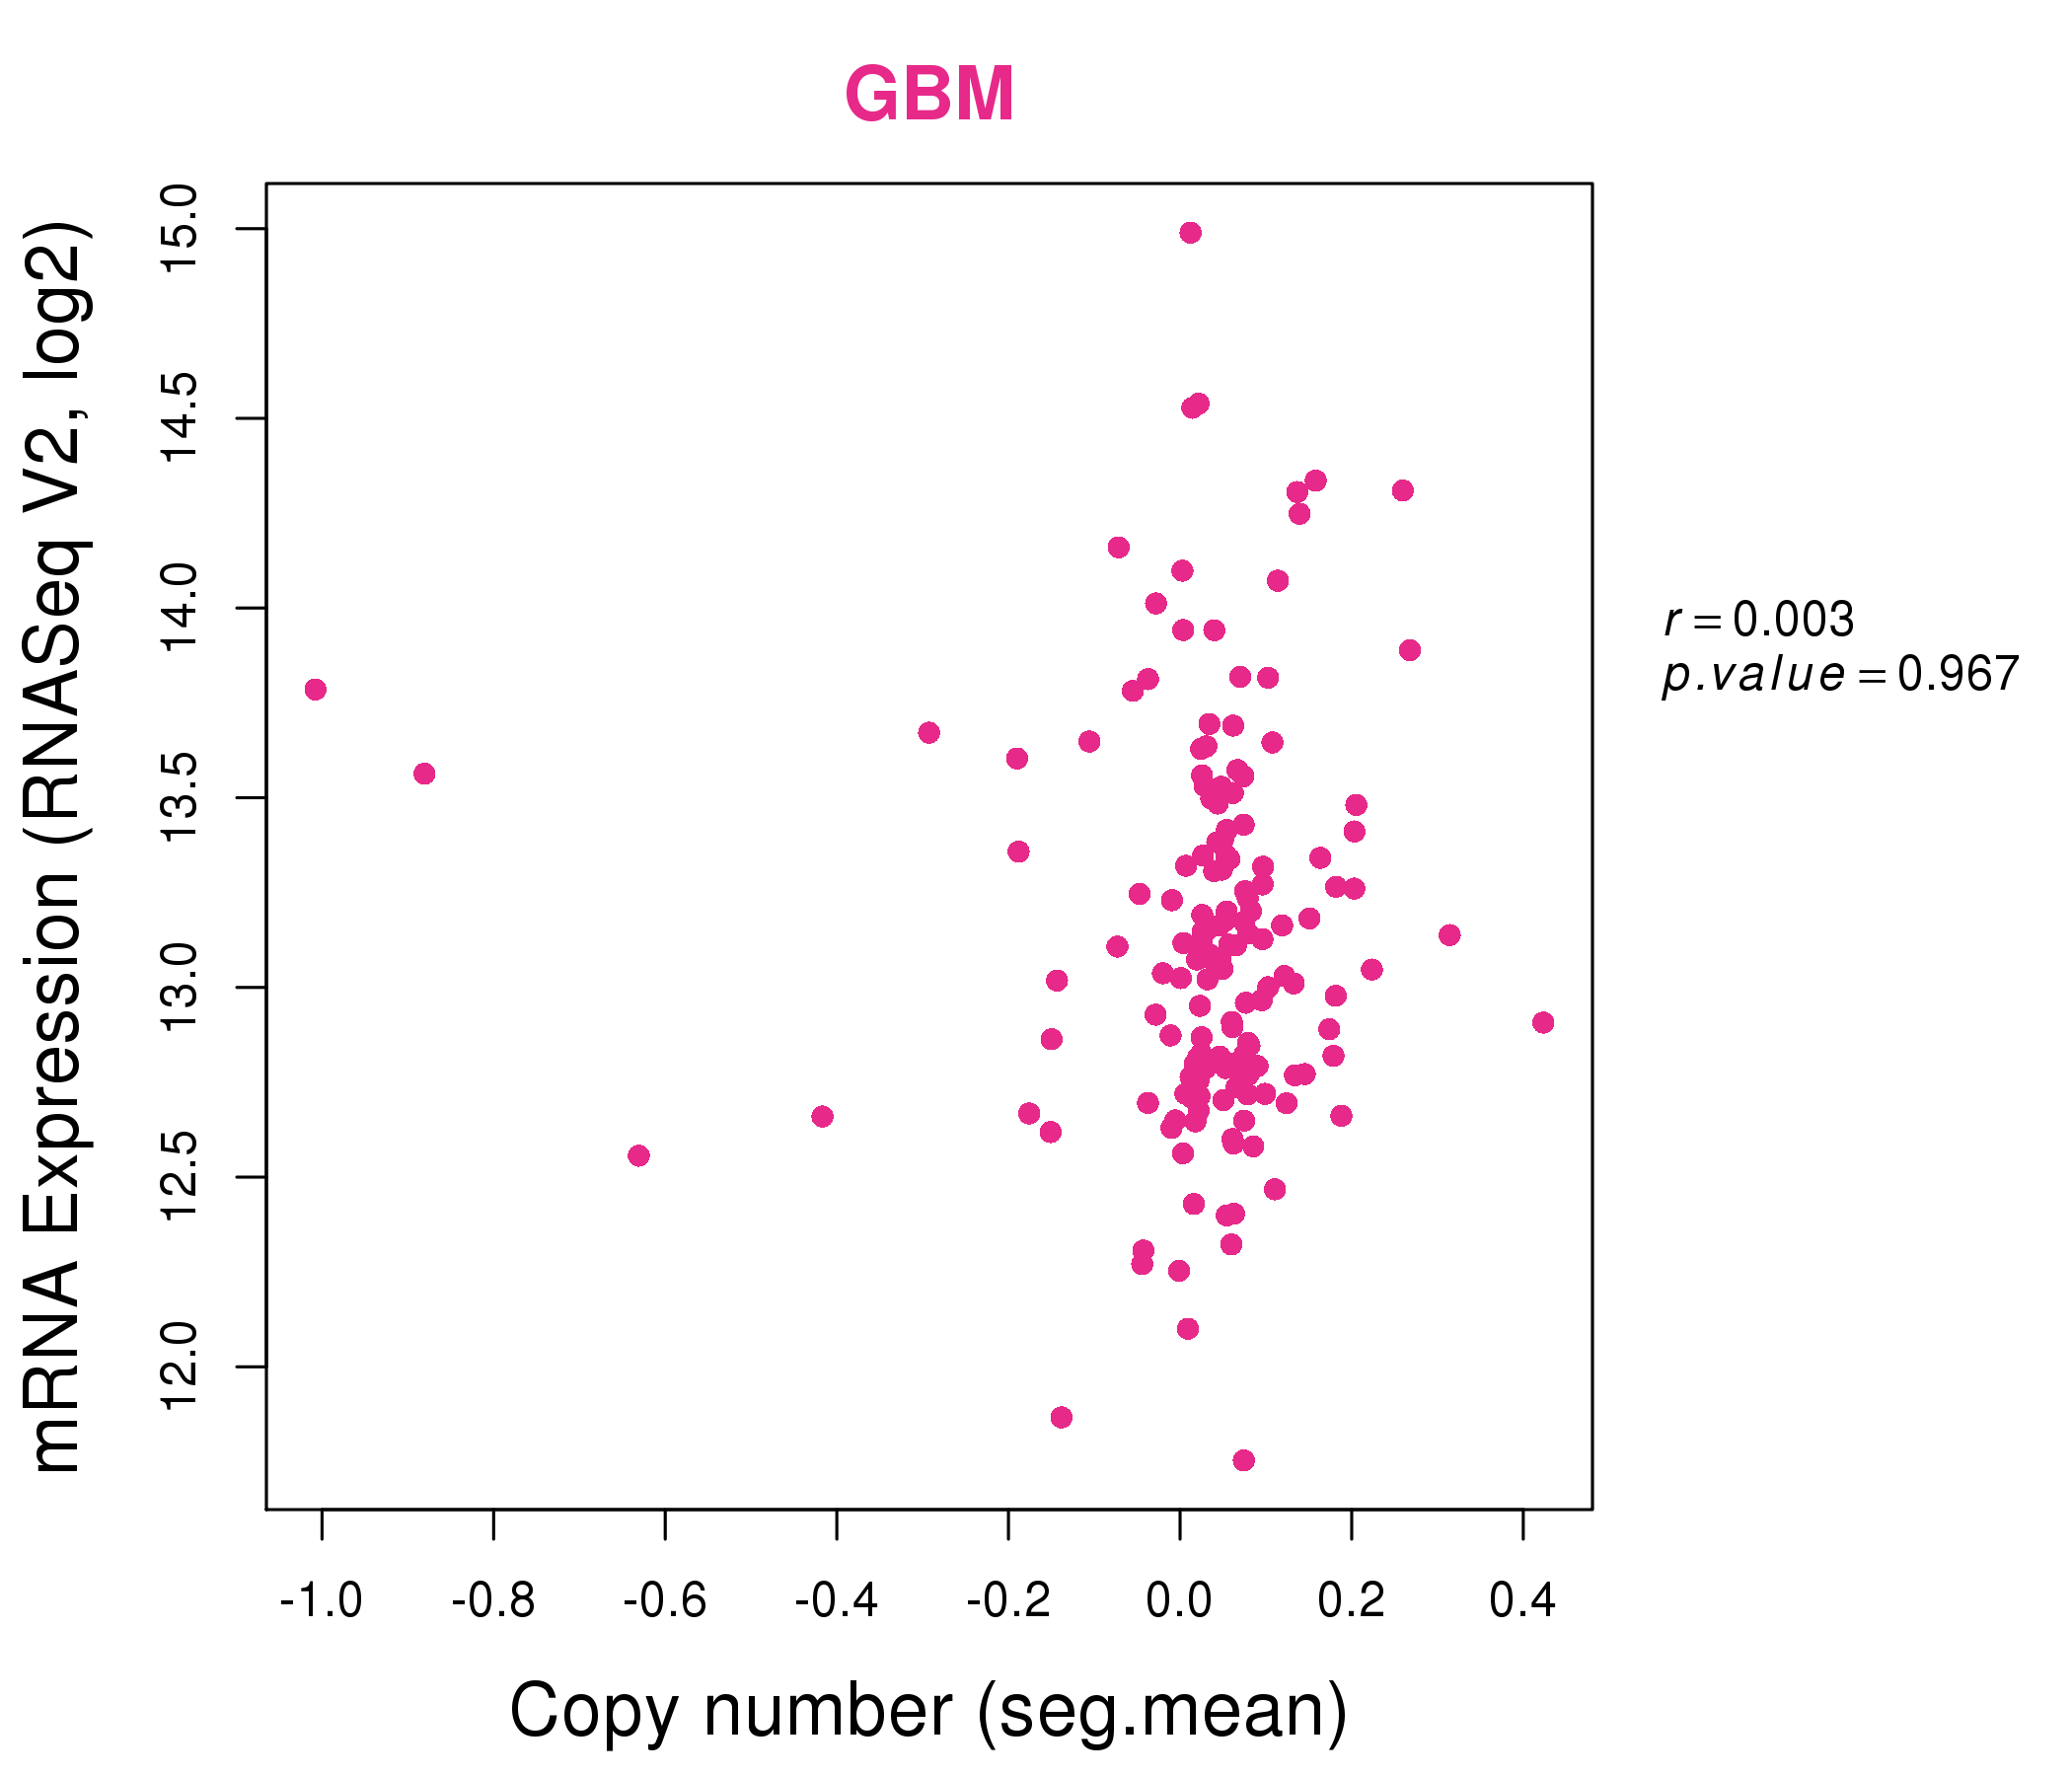
| * This plots show the correlation between CNV and gene expression. |
: Open all plots for all cancer types
 |
|
 |
|
| Top |
| Gene-Gene Network Information |
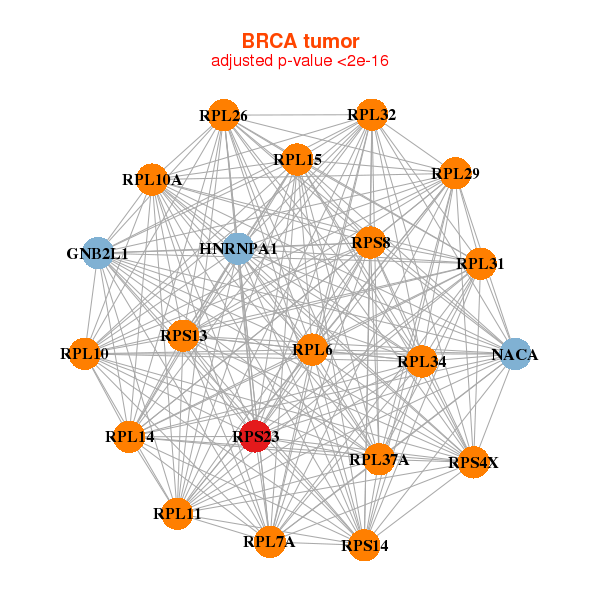
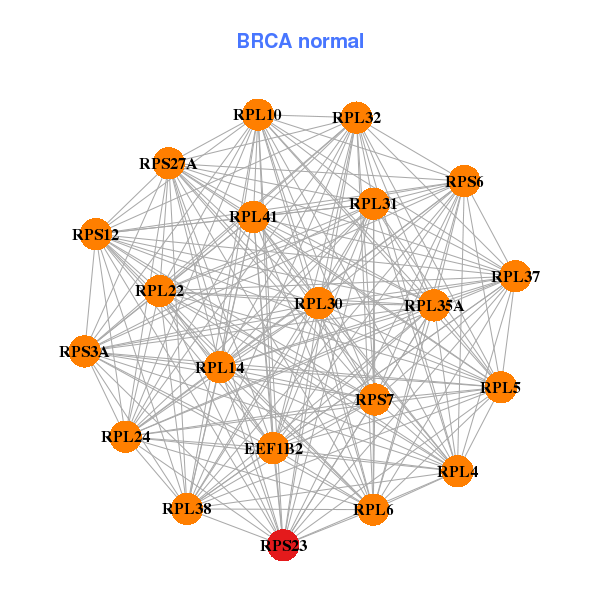
| * Co-Expression network figures were drawn using R package igraph. Only the top 20 genes with the highest correlations were shown. Red circle: input gene, orange circle: cell metabolism gene, sky circle: other gene |
: Open all plots for all cancer types
 |
|
| GNB2L1,HNRNPA1,NACA,RPL10,RPL10A,RPL11,RPL14, RPL15,RPL26,RPL29,RPL31,RPL32,RPL34,RPL37A, RPL6,RPL7A,RPS13,RPS14,RPS23,RPS4X,RPS8 | EEF1B2,RPL10,RPL14,RPL22,RPL24,RPL30,RPL31, RPL32,RPL35A,RPL37,RPL38,RPL41,RPL4,RPL5, RPL6,RPS12,RPS23,RPS27A,RPS3A,RPS6,RPS7 |
 |
|
| BTF3,GNB2L1,RPL10A,RPL12,RPL14,RPL15,RPL29, RPL31,RPL32,RPL35A,RPL36,RPL37,RPL37A,RPL5, RPL7A,RPS13,RPS14,RPS23,RPS6,RPS8,RPS9 | EEF1A1,RPL10,RPL12,RPL15,RPL19,RPL30,RPL32, RPL35A,RPL3,RPL38,RPL41,RPL6,RPL7A,RPLP1, RPS11,RPS12,RPS13,RPS23,RPS25,RPS3,RPS9 |
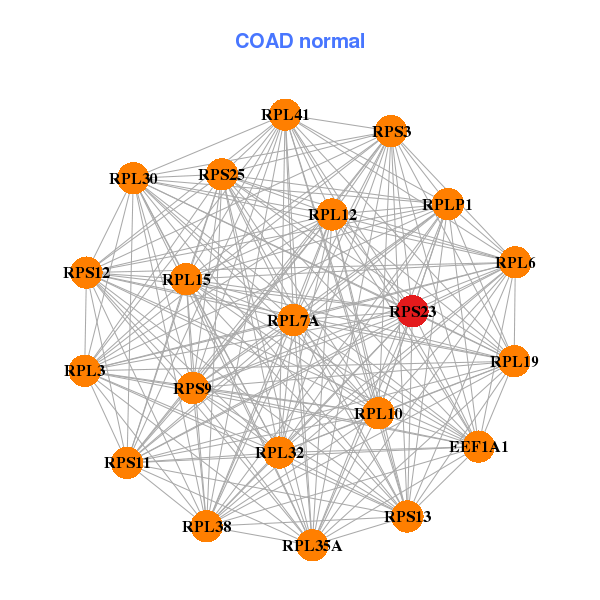
| * Co-Expression network figures were drawn using R package igraph. Only the top 20 genes with the highest correlations were shown. Red circle: input gene, orange circle: cell metabolism gene, sky circle: other gene |
: Open all plots for all cancer types
| Top |
: Open all interacting genes' information including KEGG pathway for all interacting genes from DAVID
| Top |
| Pharmacological Information for RPS23 |
| There's no related Drug. |
| Top |
| Cross referenced IDs for RPS23 |
| * We obtained these cross-references from Uniprot database. It covers 150 different DBs, 18 categories. http://www.uniprot.org/help/cross_references_section |
: Open all cross reference information
|
Copyright © 2016-Present - The Univsersity of Texas Health Science Center at Houston @ |