|
||||||||||||||||||||||||||||||||||||||||||||||||||||||||||||||||||||||||||||||||||||||||||||||||||||||||||||||||||||||||||||||||||||||||||||||||||||||||||||||||||||||||||||||||||||||||||||||||||||||||||||||||||||||||||||||||||||||||||||||||||||||||||||||||||||||||||||||||||||||||||||||||||||||||||||||||||||||||||
| |
| Phenotypic Information (metabolism pathway, cancer, disease, phenome) |
| |
| |
| Gene-Gene Network Information: Co-Expression Network, Interacting Genes & KEGG |
| |
|


| Gene Summary for RPS27A |
| Basic gene info. | Gene symbol | RPS27A |
| Gene name | ribosomal protein S27a | |
| Synonyms | CEP80|HEL112|S27A|UBA80|UBC|UBCEP1|UBCEP80 | |
| Cytomap | UCSC genome browser: 2p16 | |
| Genomic location | chr2 :55459813-55462989 | |
| Type of gene | protein-coding | |
| RefGenes | NM_001135592.2, NM_001177413.1,NM_002954.5, | |
| Ensembl id | ENSG00000143947 | |
| Description | 40S ribosomal protein S27aepididymis luminal protein 112ubiquitin Cubiquitin and ribosomal protein S27aubiquitin carboxyl extension protein 80ubiquitin-40S ribosomal protein S27aubiquitin-CEP80 | |
| Modification date | 20141207 | |
| dbXrefs | MIM : 191343 | |
| HGNC : HGNC | ||
| Ensembl : ENSG00000143947 | ||
| HPRD : 01878 | ||
| Vega : OTTHUMG00000151919 | ||
| Protein | UniProt: go to UniProt's Cross Reference DB Table | |
| Expression | CleanEX: HS_RPS27A | |
| BioGPS: 6233 | ||
| Gene Expression Atlas: ENSG00000143947 | ||
| The Human Protein Atlas: ENSG00000143947 | ||
| Pathway | NCI Pathway Interaction Database: RPS27A | |
| KEGG: RPS27A | ||
| REACTOME: RPS27A | ||
| ConsensusPathDB | ||
| Pathway Commons: RPS27A | ||
| Metabolism | MetaCyc: RPS27A | |
| HUMANCyc: RPS27A | ||
| Regulation | Ensembl's Regulation: ENSG00000143947 | |
| miRBase: chr2 :55,459,813-55,462,989 | ||
| TargetScan: NM_001135592 | ||
| cisRED: ENSG00000143947 | ||
| Context | iHOP: RPS27A | |
| cancer metabolism search in PubMed: RPS27A | ||
| UCL Cancer Institute: RPS27A | ||
| Assigned class in ccmGDB | C | |
| Top |
| Phenotypic Information for RPS27A(metabolism pathway, cancer, disease, phenome) |
| Cancer | CGAP: RPS27A |
| Familial Cancer Database: RPS27A | |
| * This gene is included in those cancer gene databases. |
|
|
|
|
|
| . | ||||||||||||||||||||||||||||||||||||||||||||||||||||||||||||||||||||||||||||||||||||||||||||||||||||||||||||||||||||||||||||||||||||||||||||||||||||||||||||||||||||||||||||||||||||||||||||||||||||||||||||||||||||||||||||||||||||||||||||||||||||||||||||||||||||||||||||||||||||||||||||||||||||||||||||||||||||
Oncogene 1 | Significant driver gene in | |||||||||||||||||||||||||||||||||||||||||||||||||||||||||||||||||||||||||||||||||||||||||||||||||||||||||||||||||||||||||||||||||||||||||||||||||||||||||||||||||||||||||||||||||||||||||||||||||||||||||||||||||||||||||||||||||||||||||||||||||||||||||||||||||||||||||||||||||||||||||||||||||||||||||||||||||||||||||
| cf) number; DB name 1 Oncogene; http://nar.oxfordjournals.org/content/35/suppl_1/D721.long, 2 Tumor Suppressor gene; https://bioinfo.uth.edu/TSGene/, 3 Cancer Gene Census; http://www.nature.com/nrc/journal/v4/n3/abs/nrc1299.html, 4 CancerGenes; http://nar.oxfordjournals.org/content/35/suppl_1/D721.long, 5 Network of Cancer Gene; http://ncg.kcl.ac.uk/index.php, 1Therapeutic Vulnerabilities in Cancer; http://cbio.mskcc.org/cancergenomics/statius/ |
| REACTOME_METABOLISM_OF_PROTEINS REACTOME_METABOLISM_OF_MRNA REACTOME_METABOLISM_OF_RNA | |
| OMIM | |
| Orphanet | |
| Disease | KEGG Disease: RPS27A |
| MedGen: RPS27A (Human Medical Genetics with Condition) | |
| ClinVar: RPS27A | |
| Phenotype | MGI: RPS27A (International Mouse Phenotyping Consortium) |
| PhenomicDB: RPS27A | |
| Mutations for RPS27A |
| * Under tables are showing count per each tissue to give us broad intuition about tissue specific mutation patterns.You can go to the detailed page for each mutation database's web site. |
| There's no structural variation information in COSMIC data for this gene. |
| * From mRNA Sanger sequences, Chitars2.0 arranged chimeric transcripts. This table shows RPS27A related fusion information. |
| ID | Head Gene | Tail Gene | Accession | Gene_a | qStart_a | qEnd_a | Chromosome_a | tStart_a | tEnd_a | Gene_a | qStart_a | qEnd_a | Chromosome_a | tStart_a | tEnd_a |
| BF375146 | RPS27A | 9 | 175 | 2 | 55461998 | 55462629 | LIPH | 168 | 499 | 3 | 185232431 | 185232763 | |
| DA583490 | TOX4 | 1 | 103 | 14 | 21946363 | 21946465 | RPS27A | 100 | 545 | 2 | 55460973 | 55461418 | |
| BM312306 | RPS27A | 24 | 193 | 2 | 55462574 | 55462743 | UBE3C | 189 | 358 | 7 | 156985035 | 156985204 | |
| Top |
| Mutation type/ Tissue ID | brca | cns | cerv | endome | haematopo | kidn | Lintest | liver | lung | ns | ovary | pancre | prost | skin | stoma | thyro | urina | |||
| Total # sample | 1 | |||||||||||||||||||
| GAIN (# sample) | 1 | |||||||||||||||||||
| LOSS (# sample) |
| cf) Tissue ID; Tissue type (1; Breast, 2; Central_nervous_system, 3; Cervix, 4; Endometrium, 5; Haematopoietic_and_lymphoid_tissue, 6; Kidney, 7; Large_intestine, 8; Liver, 9; Lung, 10; NS, 11; Ovary, 12; Pancreas, 13; Prostate, 14; Skin, 15; Stomach, 16; Thyroid, 17; Urinary_tract) |
| Top |
|
 |
| Top |
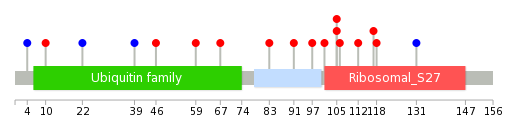
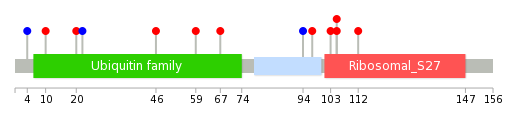
| Stat. for Non-Synonymous SNVs (# total SNVs=7) | (# total SNVs=3) |
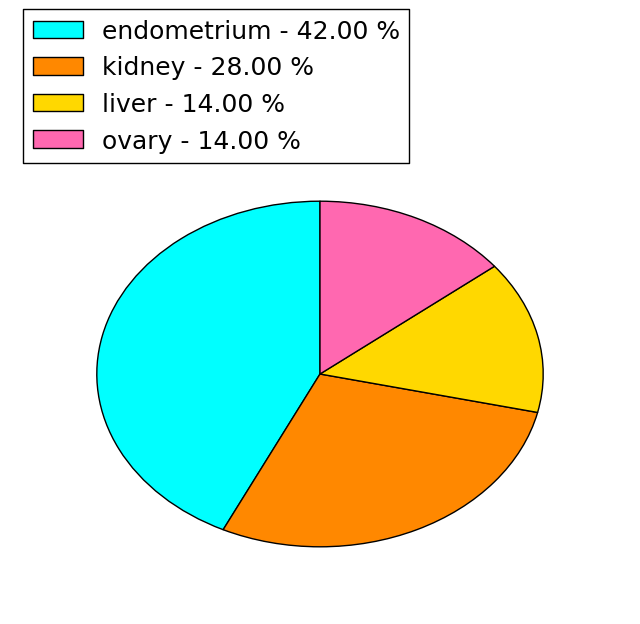 | 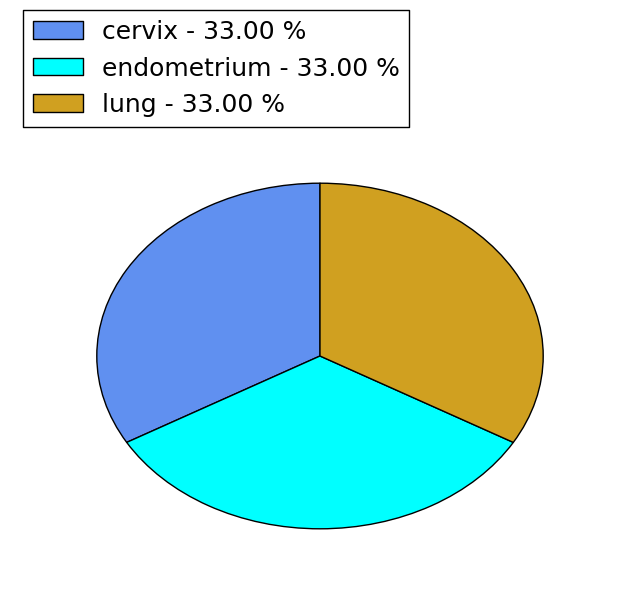 |
(# total SNVs=1) | (# total SNVs=1) |
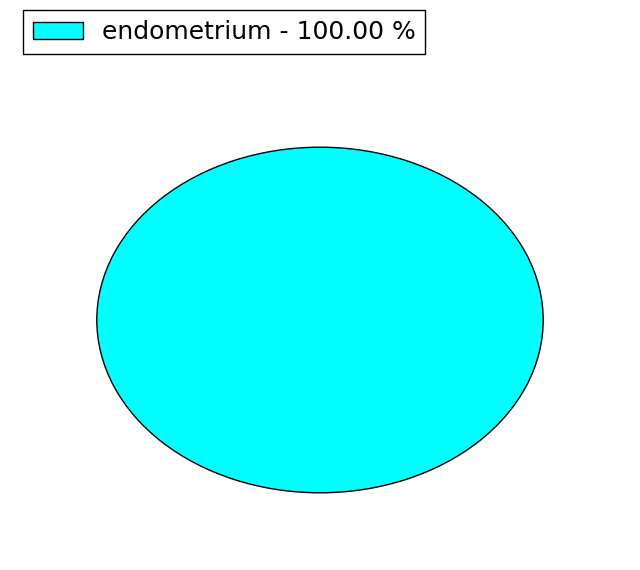 |  |
| Top |
| * When you move the cursor on each content, you can see more deailed mutation information on the Tooltip. Those are primary_site,primary_histology,mutation(aa),pubmedID. |
| GRCh37 position | Mutation(aa) | Unique sampleID count |
| chr2:55462577-55462577 | p.G112D | 1 |
| chr2:55461327-55461327 | p.Y59C | 1 |
| chr2:55462591-55462591 | p.L117I | 1 |
| chr2:55461976-55461976 | p.L67V | 1 |
| chr2:55462594-55462594 | p.R118C | 1 |
| chr2:55462017-55462019 | p.K83delK | 1 |
| chr2:55462635-55462635 | p.F131F | 1 |
| chr2:55462049-55462049 | p.N91S | 1 |
| chr2:55462068-55462068 | p.K97N | 1 |
| chr2:55459972-55459972 | p.F4F | 1 |
| Top |
|
 |
| Point Mutation/ Tissue ID | 1 | 2 | 3 | 4 | 5 | 6 | 7 | 8 | 9 | 10 | 11 | 12 | 13 | 14 | 15 | 16 | 17 | 18 | 19 | 20 |
| # sample | 1 | 1 | 2 | 1 | 1 | 1 | 1 | 1 | 3 | |||||||||||
| # mutation | 1 | 1 | 2 | 1 | 1 | 1 | 1 | 1 | 4 | |||||||||||
| nonsynonymous SNV | 1 | 1 | 1 | 1 | 1 | 1 | 1 | 3 | ||||||||||||
| synonymous SNV | 1 | 1 | 1 |
| cf) Tissue ID; Tissue type (1; BLCA[Bladder Urothelial Carcinoma], 2; BRCA[Breast invasive carcinoma], 3; CESC[Cervical squamous cell carcinoma and endocervical adenocarcinoma], 4; COAD[Colon adenocarcinoma], 5; GBM[Glioblastoma multiforme], 6; Glioma Low Grade, 7; HNSC[Head and Neck squamous cell carcinoma], 8; KICH[Kidney Chromophobe], 9; KIRC[Kidney renal clear cell carcinoma], 10; KIRP[Kidney renal papillary cell carcinoma], 11; LAML[Acute Myeloid Leukemia], 12; LUAD[Lung adenocarcinoma], 13; LUSC[Lung squamous cell carcinoma], 14; OV[Ovarian serous cystadenocarcinoma ], 15; PAAD[Pancreatic adenocarcinoma], 16; PRAD[Prostate adenocarcinoma], 17; SKCM[Skin Cutaneous Melanoma], 18:STAD[Stomach adenocarcinoma], 19:THCA[Thyroid carcinoma], 20:UCEC[Uterine Corpus Endometrial Carcinoma]) |
| Top |
| * We represented just top 10 SNVs. When you move the cursor on each content, you can see more deailed mutation information on the Tooltip. Those are primary_site, primary_histology, mutation(aa), pubmedID. |
| Genomic Position | Mutation(aa) | Unique sampleID count |
| chr2:55461976 | p.S20W,RPS27A | 1 |
| chr2:55462059 | p.T22T,RPS27A | 1 |
| chr2:55462068 | p.A46V,RPS27A | 1 |
| chr2:55462084 | p.Y59C,RPS27A | 1 |
| chr2:55462090 | p.L67V,RPS27A | 1 |
| chr2:55459972 | p.K94K,RPS27A | 1 |
| chr2:55462091 | p.K97N,RPS27A | 1 |
| chr2:55459989 | p.L103M,RPS27A | 1 |
| chr2:55462577 | p.Y105H,RPS27A | 1 |
| chr2:55460509 | p.Y105F,RPS27A | 1 |
| * Copy number data were extracted from TCGA using R package TCGA-Assembler. The URLs of all public data files on TCGA DCC data server were gathered on Jan-05-2015. Function ProcessCNAData in TCGA-Assembler package was used to obtain gene-level copy number value which is calculated as the average copy number of the genomic region of a gene. |
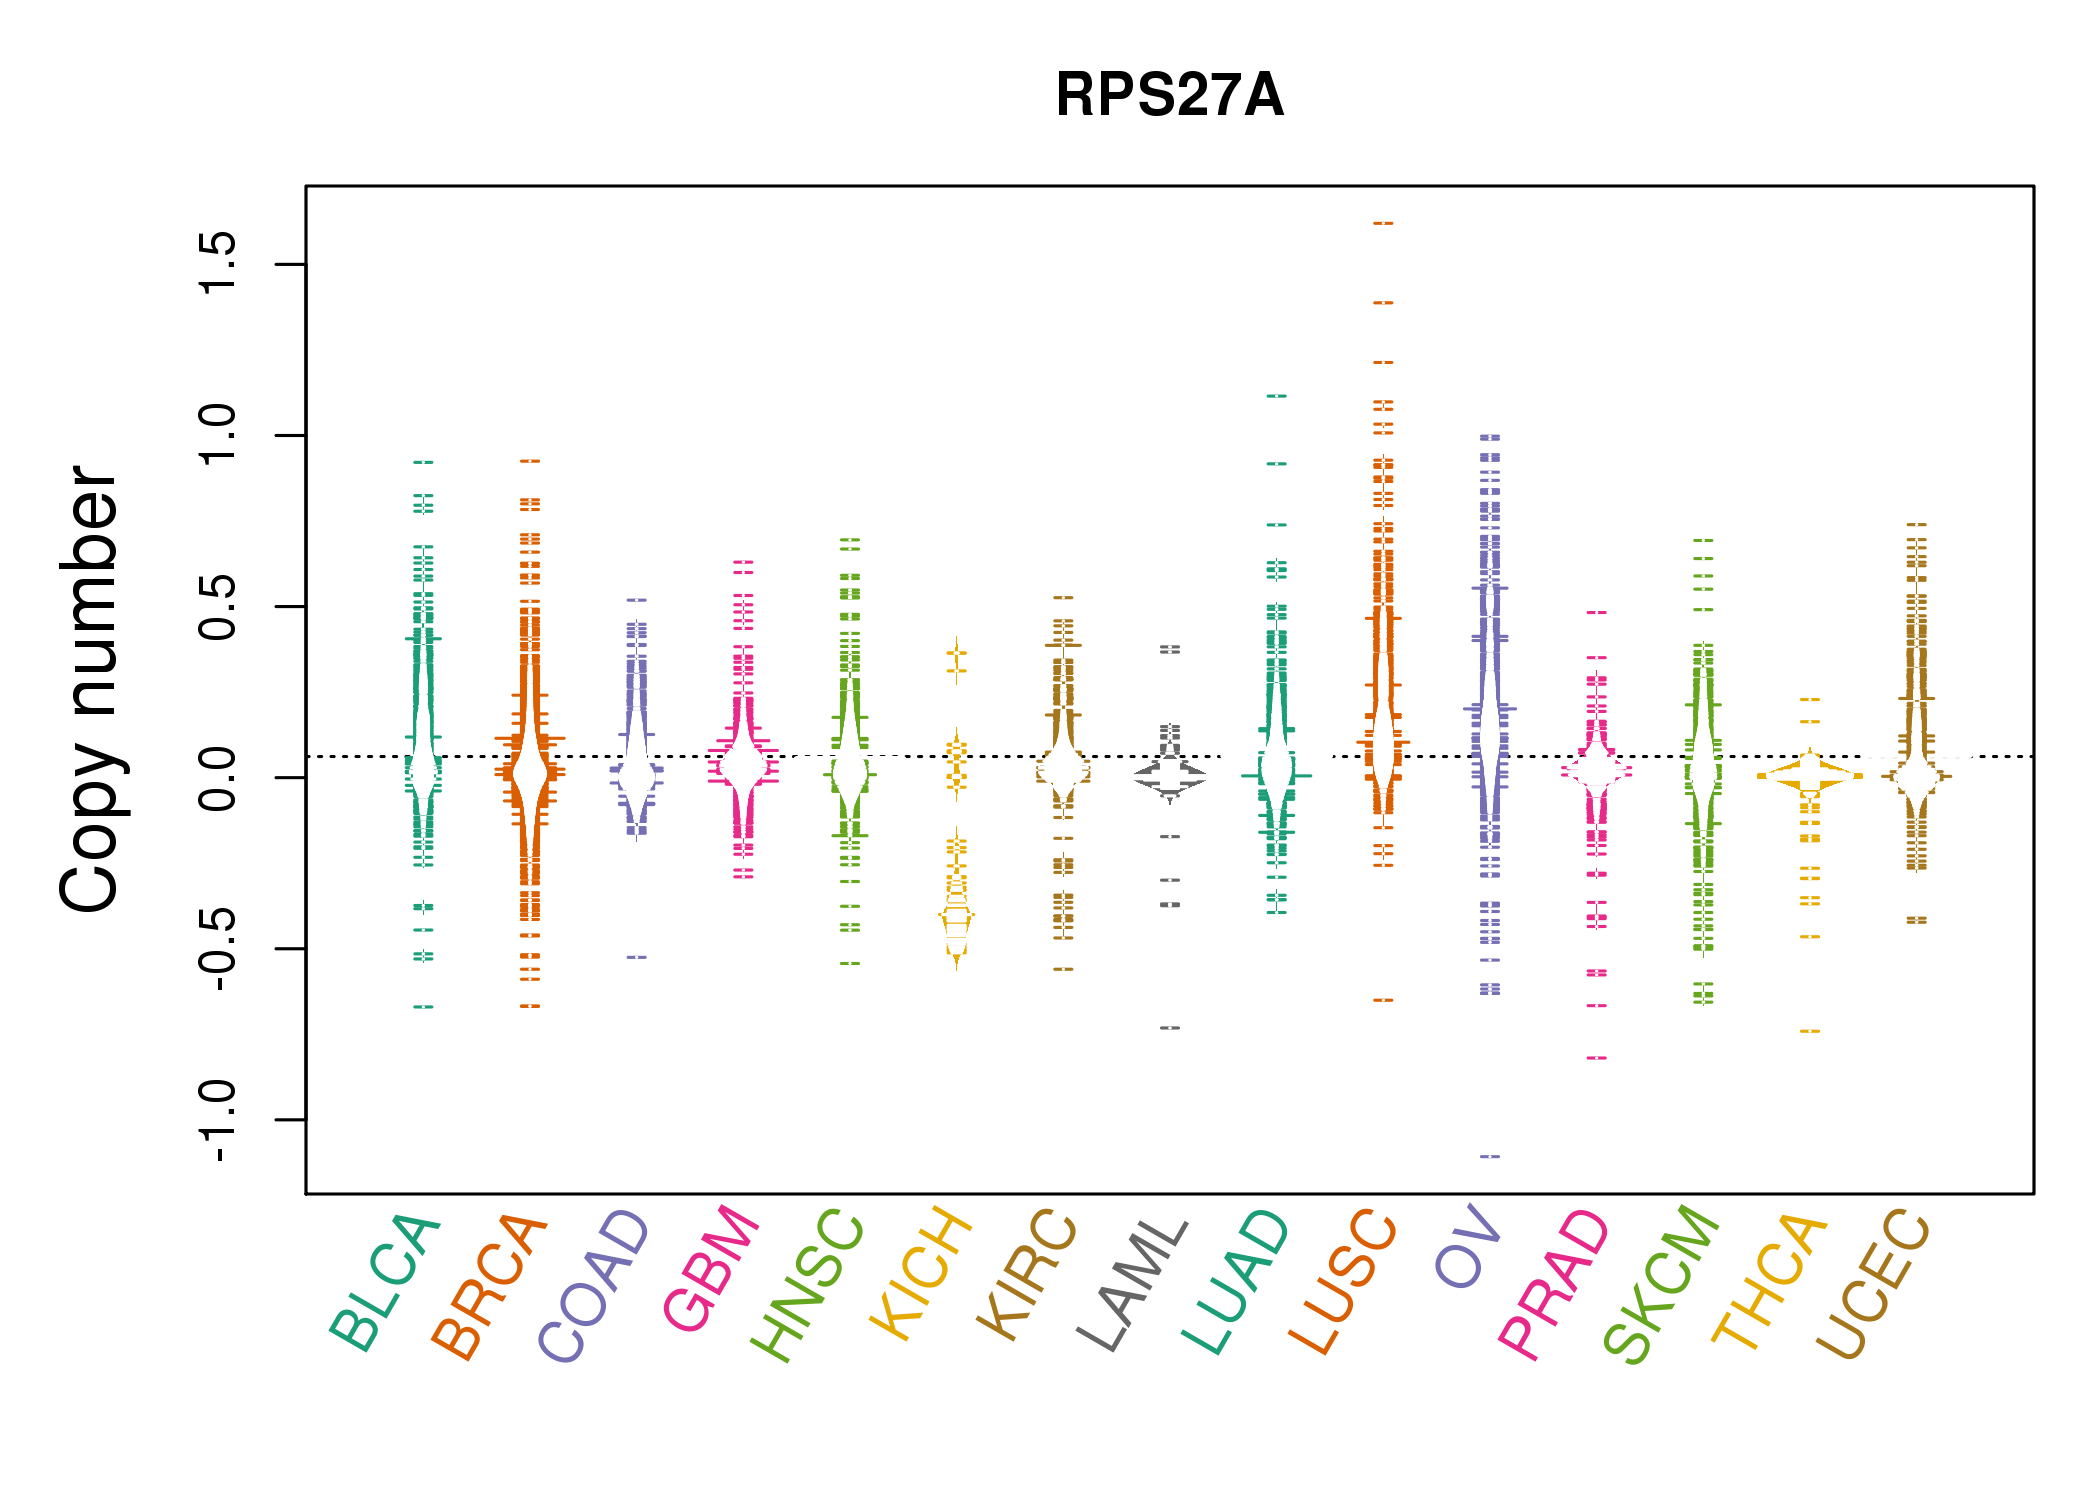 |
| cf) Tissue ID[Tissue type]: BLCA[Bladder Urothelial Carcinoma], BRCA[Breast invasive carcinoma], CESC[Cervical squamous cell carcinoma and endocervical adenocarcinoma], COAD[Colon adenocarcinoma], GBM[Glioblastoma multiforme], Glioma Low Grade, HNSC[Head and Neck squamous cell carcinoma], KICH[Kidney Chromophobe], KIRC[Kidney renal clear cell carcinoma], KIRP[Kidney renal papillary cell carcinoma], LAML[Acute Myeloid Leukemia], LUAD[Lung adenocarcinoma], LUSC[Lung squamous cell carcinoma], OV[Ovarian serous cystadenocarcinoma ], PAAD[Pancreatic adenocarcinoma], PRAD[Prostate adenocarcinoma], SKCM[Skin Cutaneous Melanoma], STAD[Stomach adenocarcinoma], THCA[Thyroid carcinoma], UCEC[Uterine Corpus Endometrial Carcinoma] |
| Top |
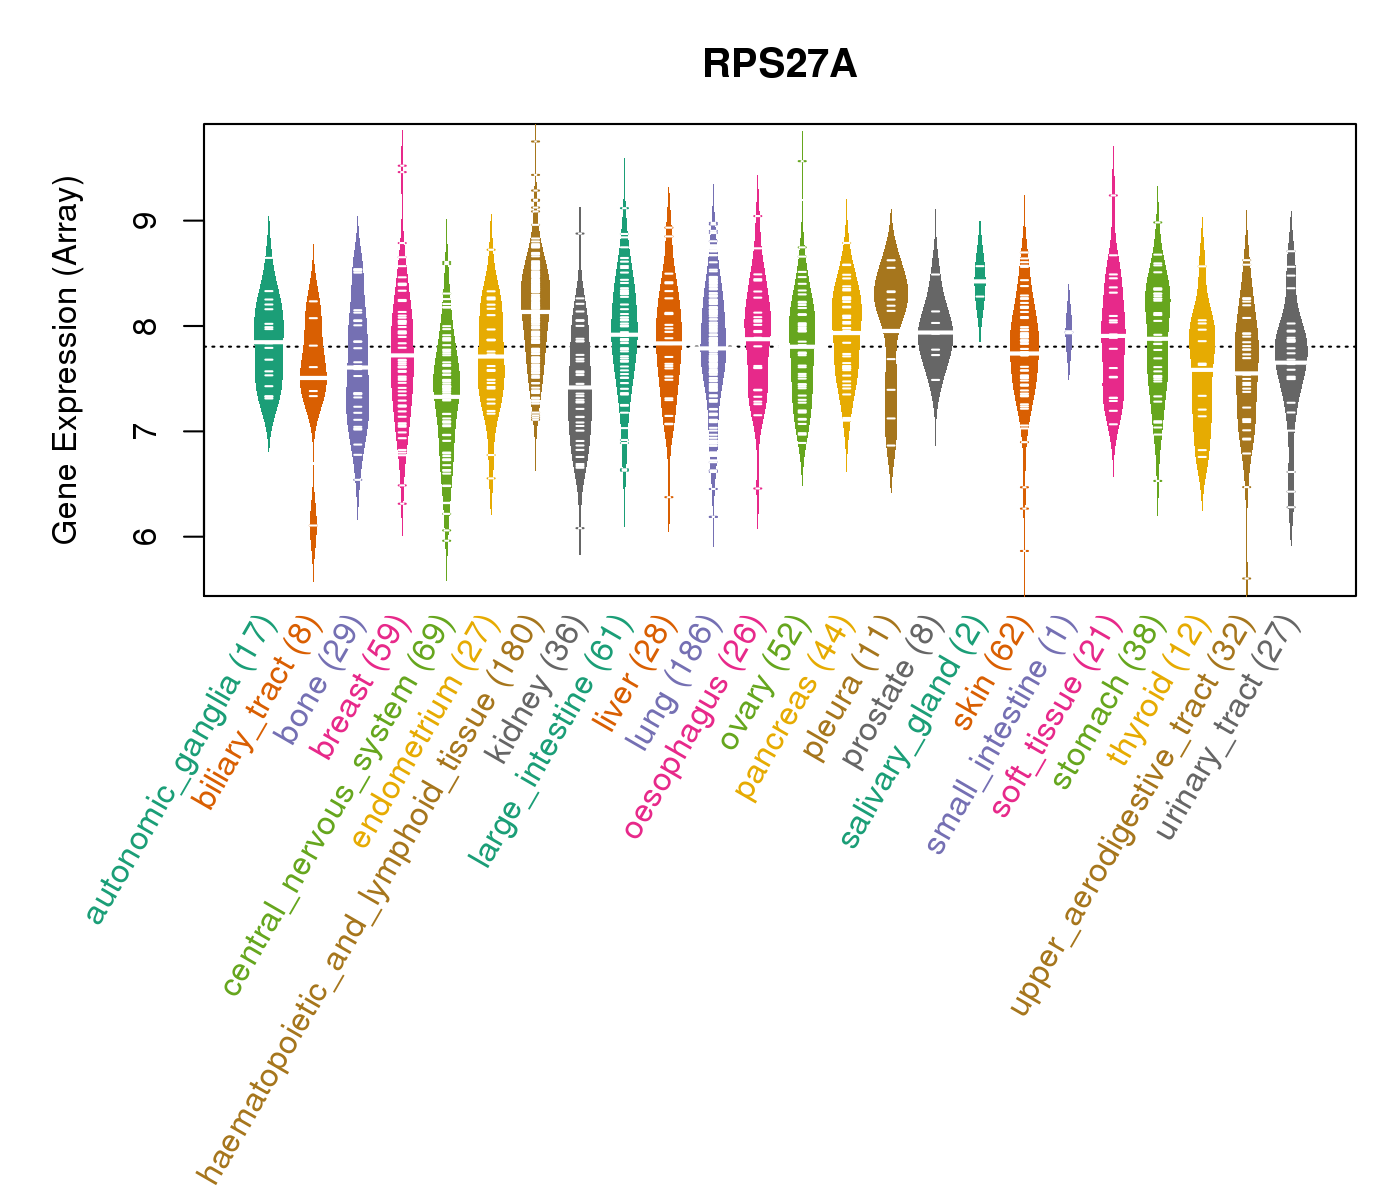
| Gene Expression for RPS27A |
| * CCLE gene expression data were extracted from CCLE_Expression_Entrez_2012-10-18.res: Gene-centric RMA-normalized mRNA expression data. |
 |
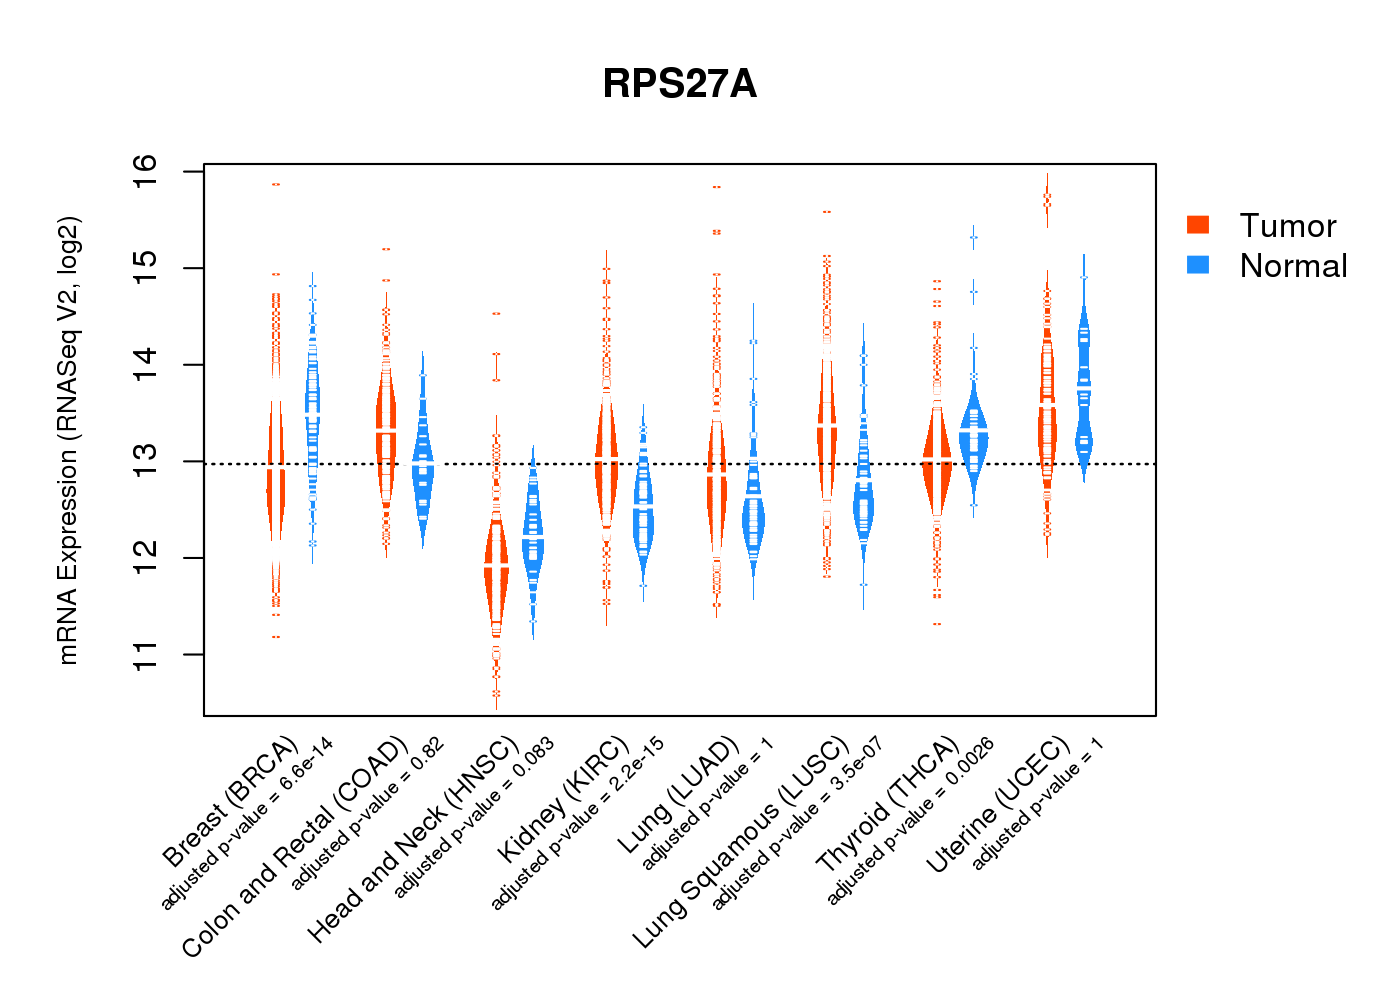
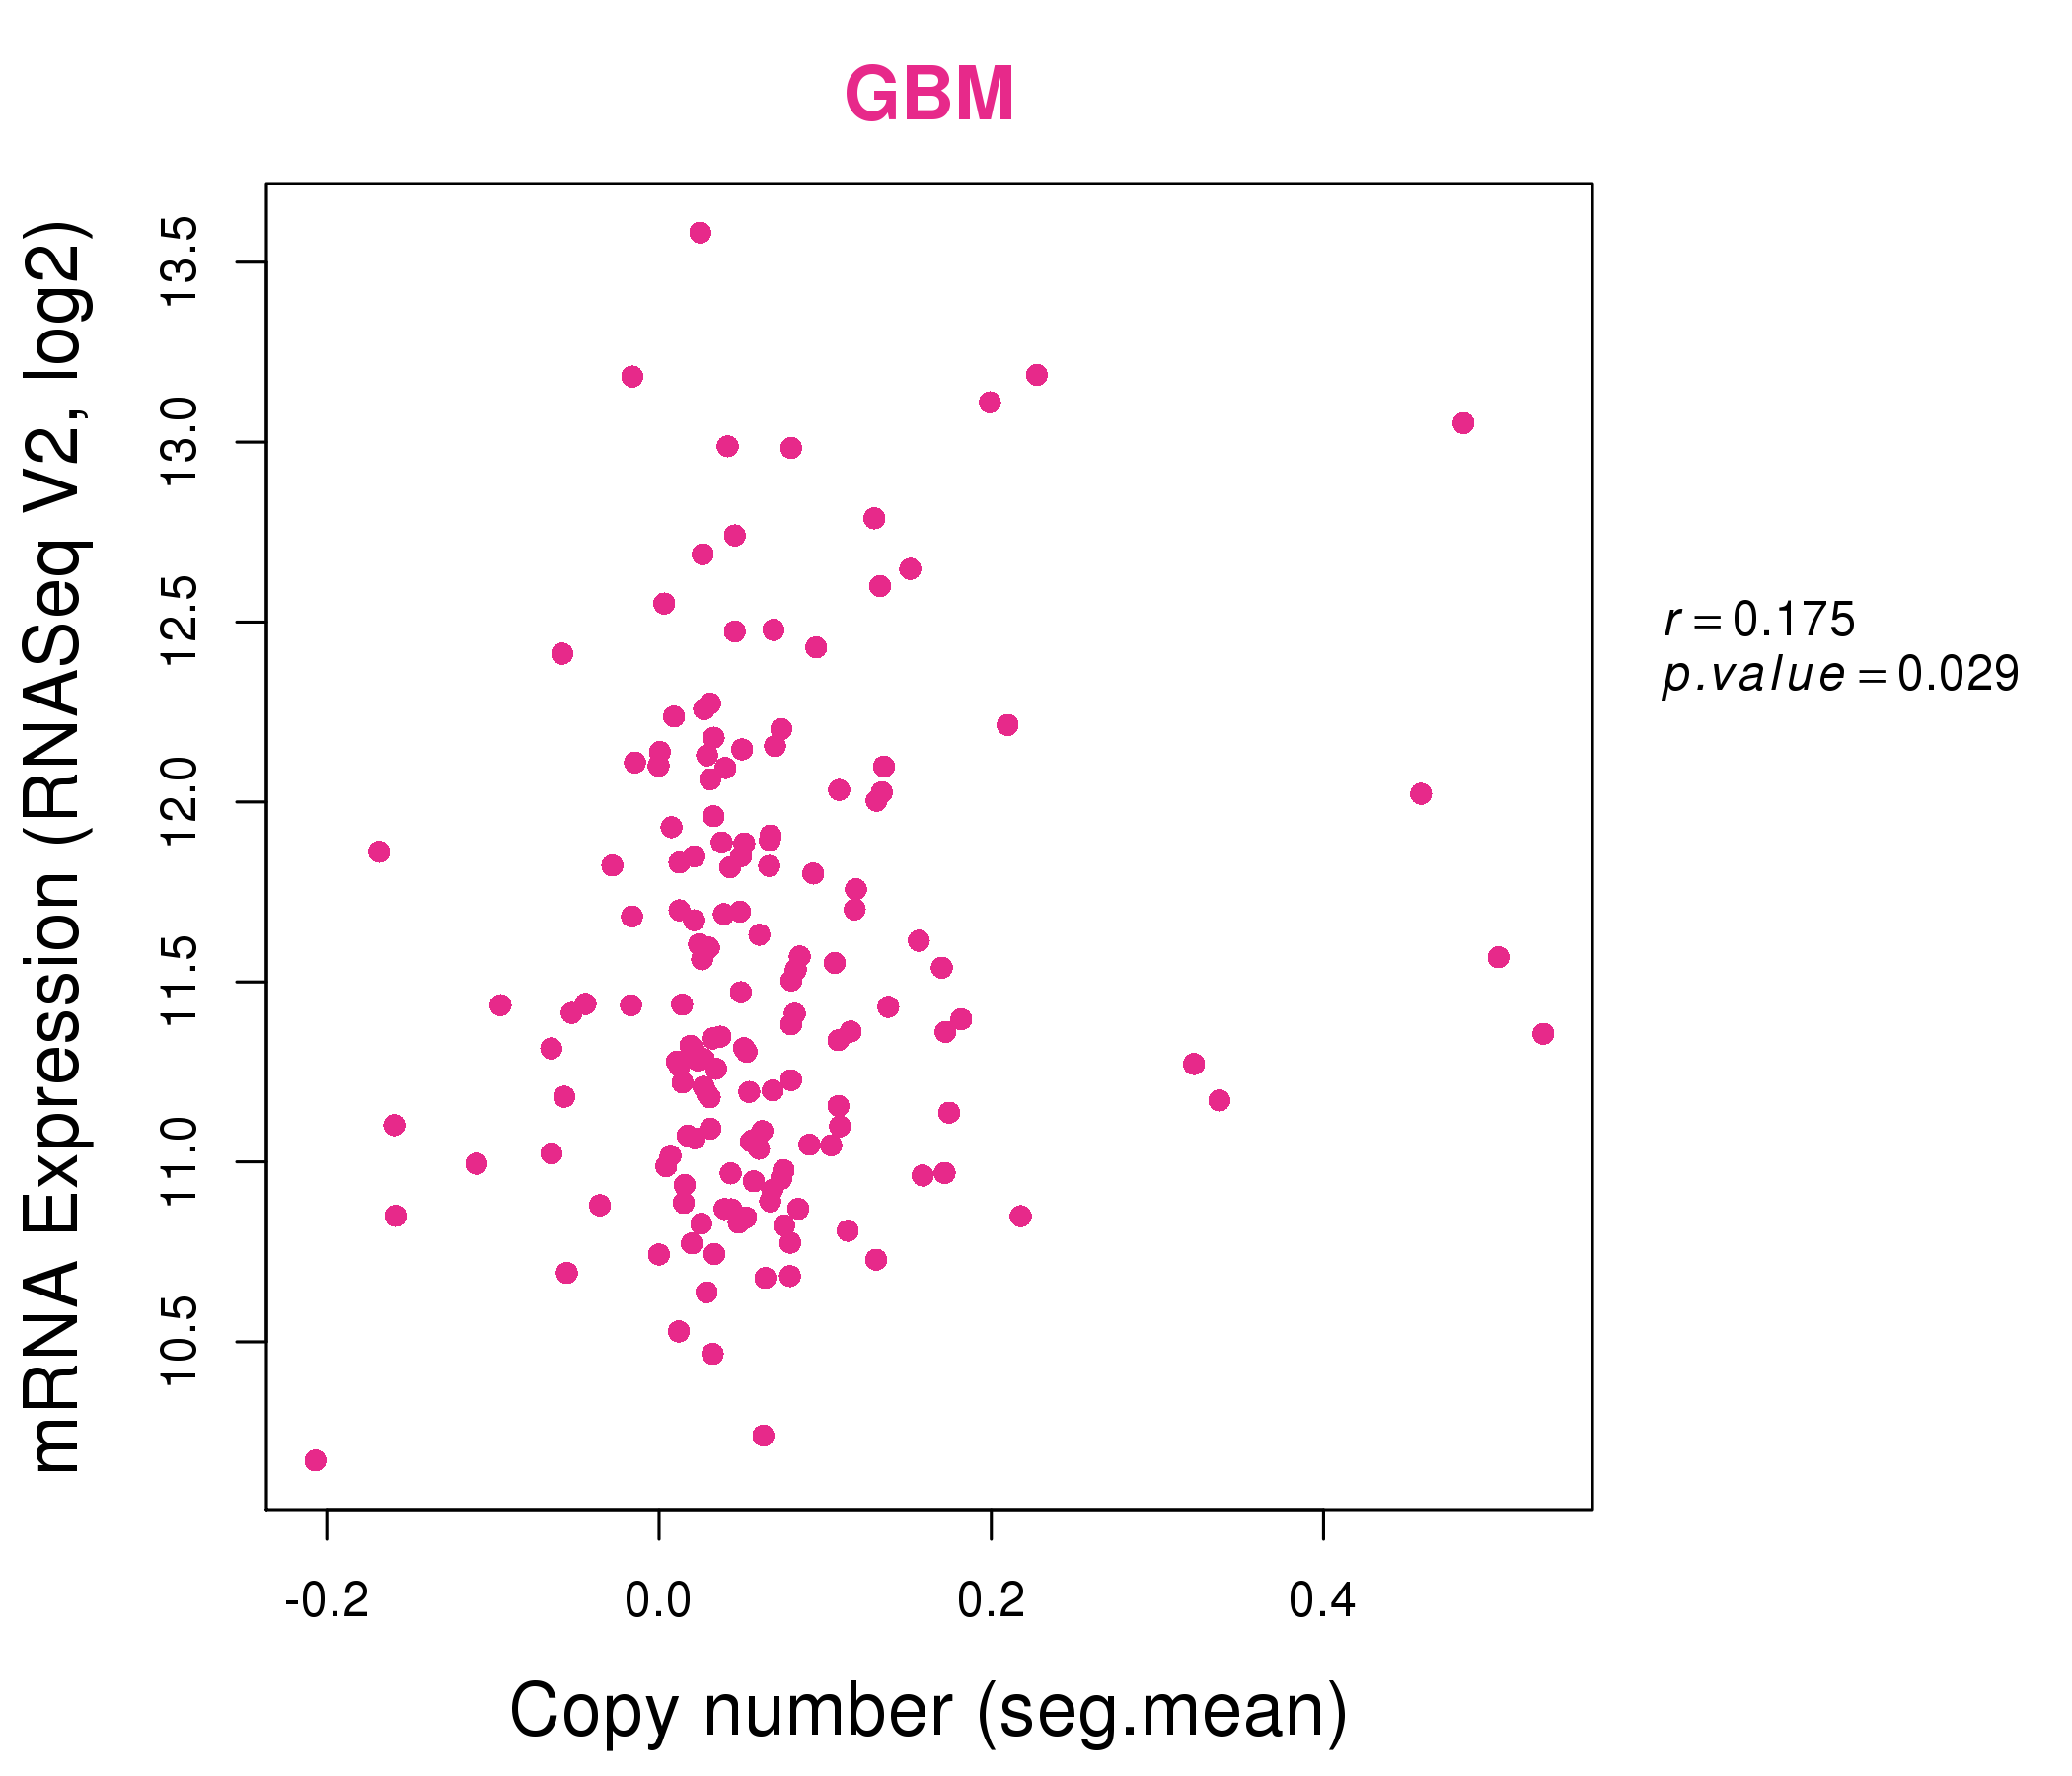
| * Normalized gene expression data of RNASeqV2 was extracted from TCGA using R package TCGA-Assembler. The URLs of all public data files on TCGA DCC data server were gathered at Jan-05-2015. Only eight cancer types have enough normal control samples for differential expression analysis. (t test, adjusted p<0.05 (using Benjamini-Hochberg FDR)) |
 |
| Top |
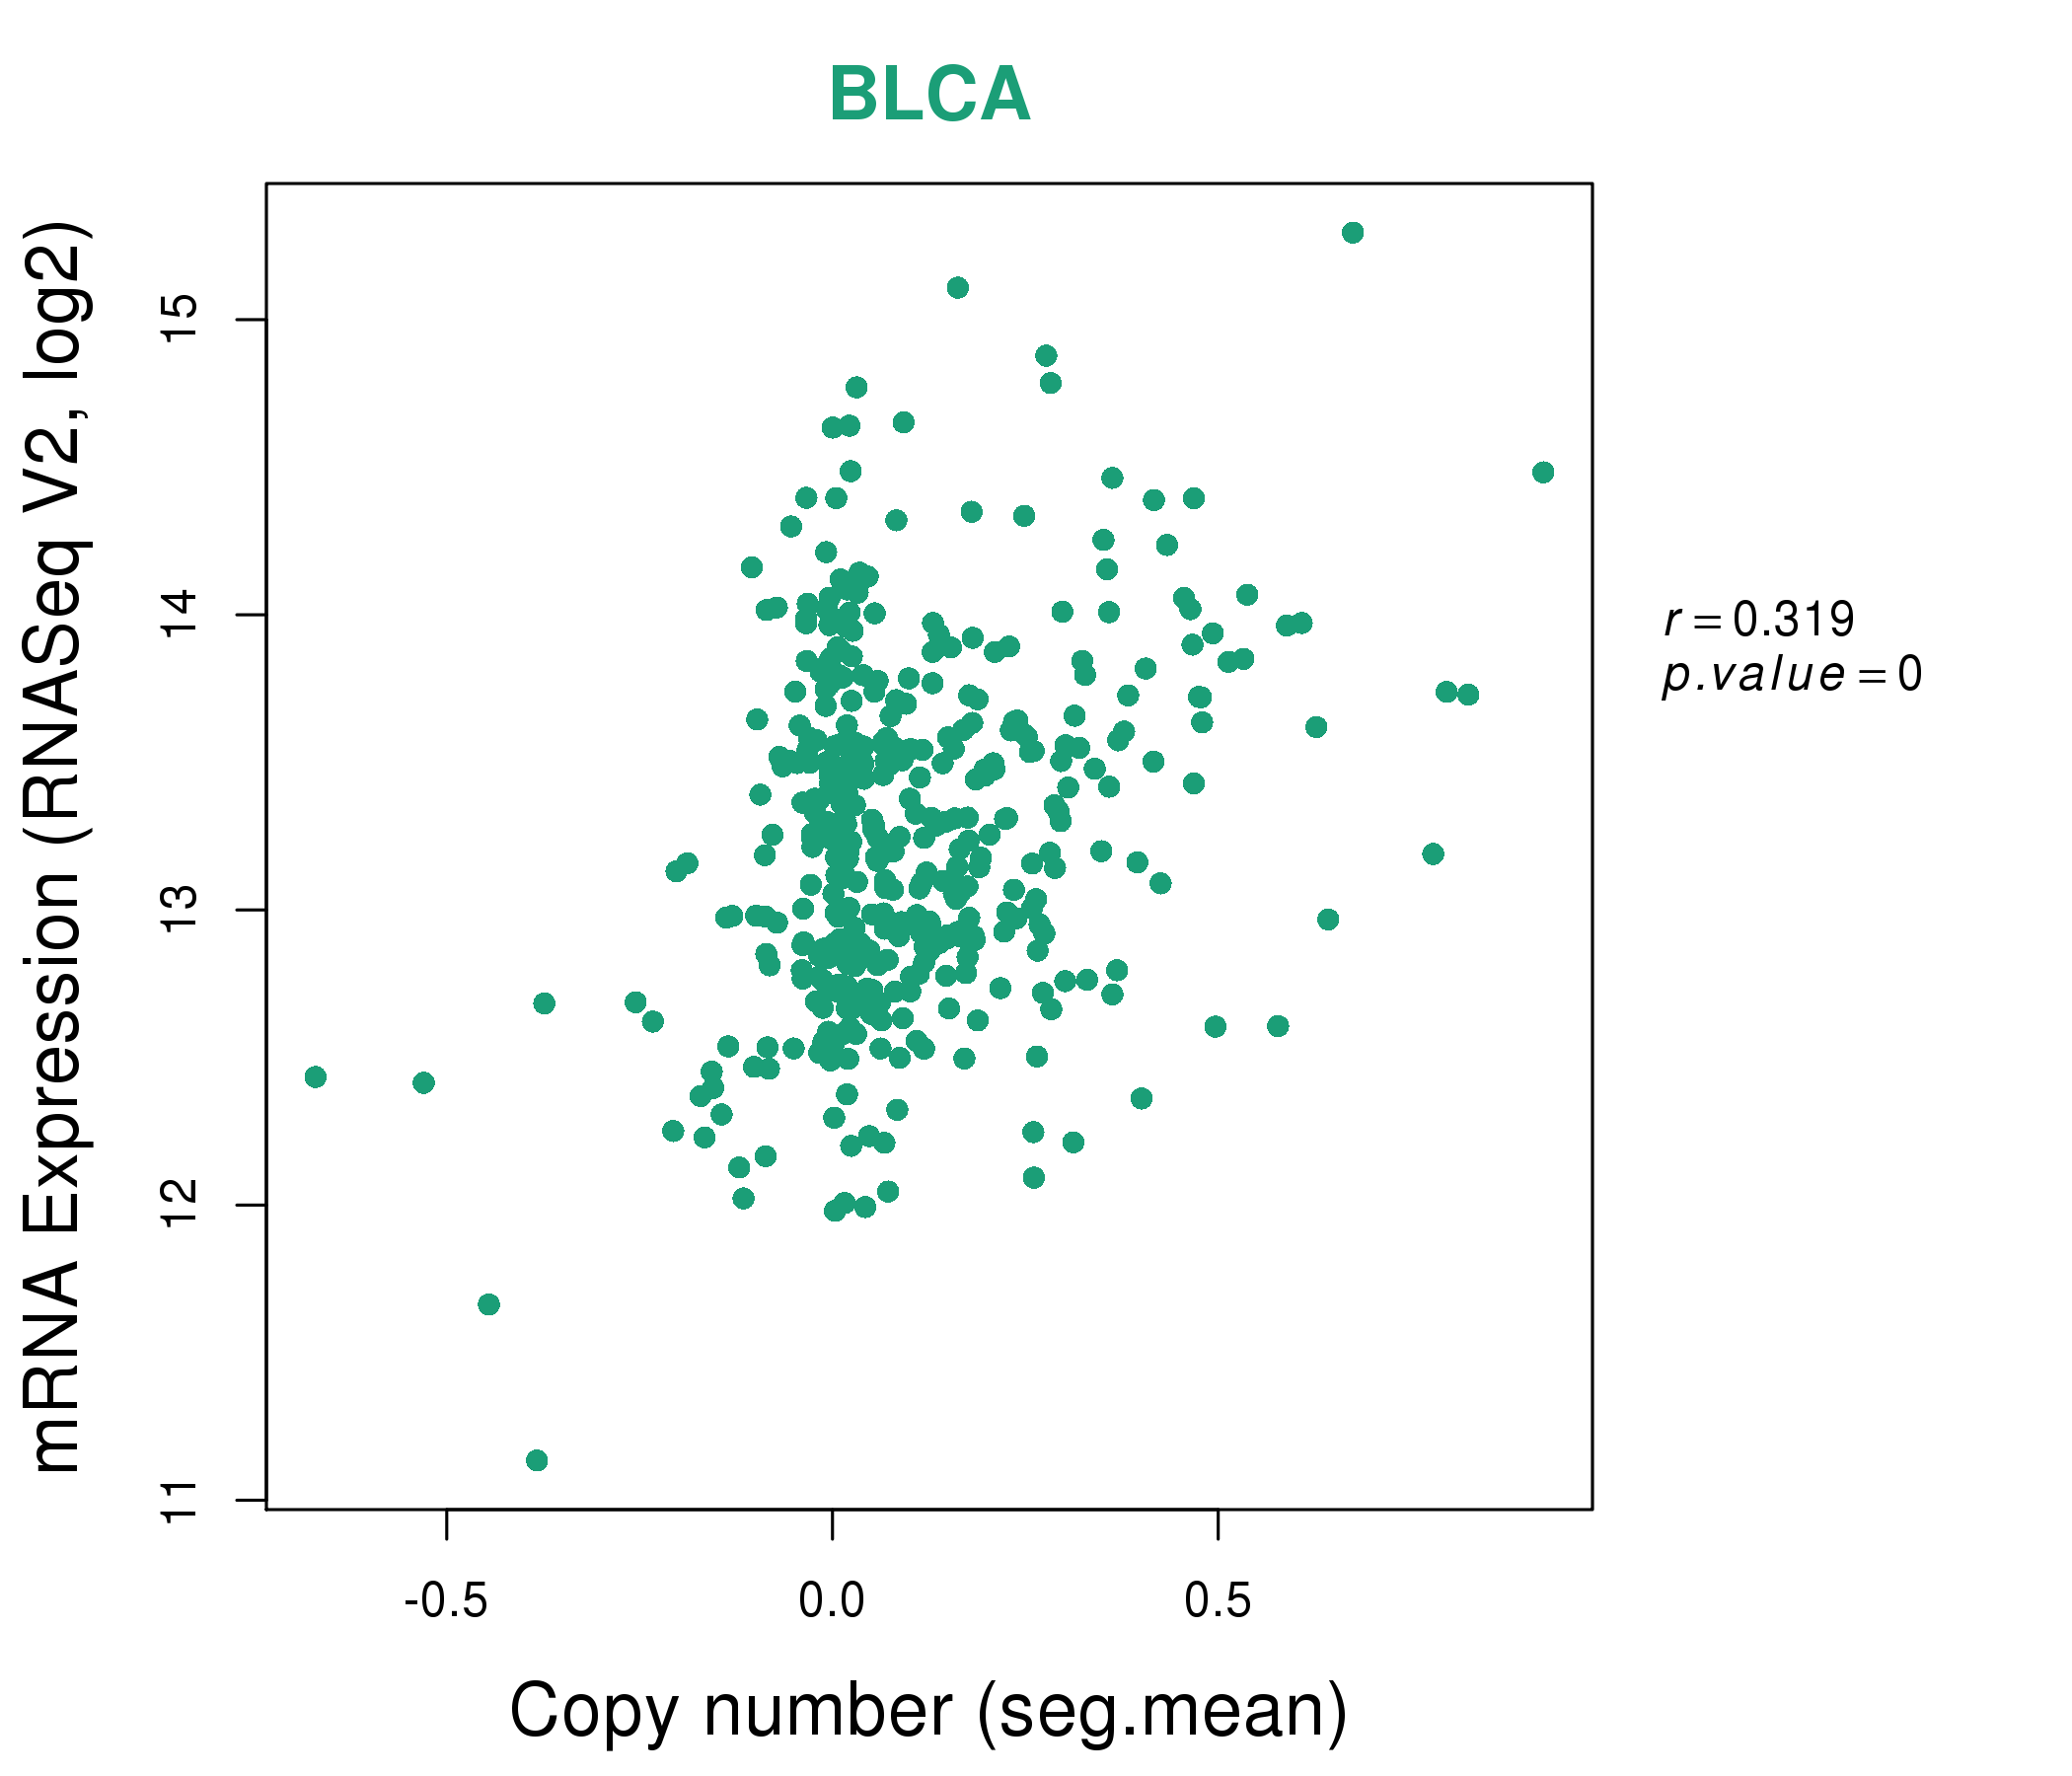
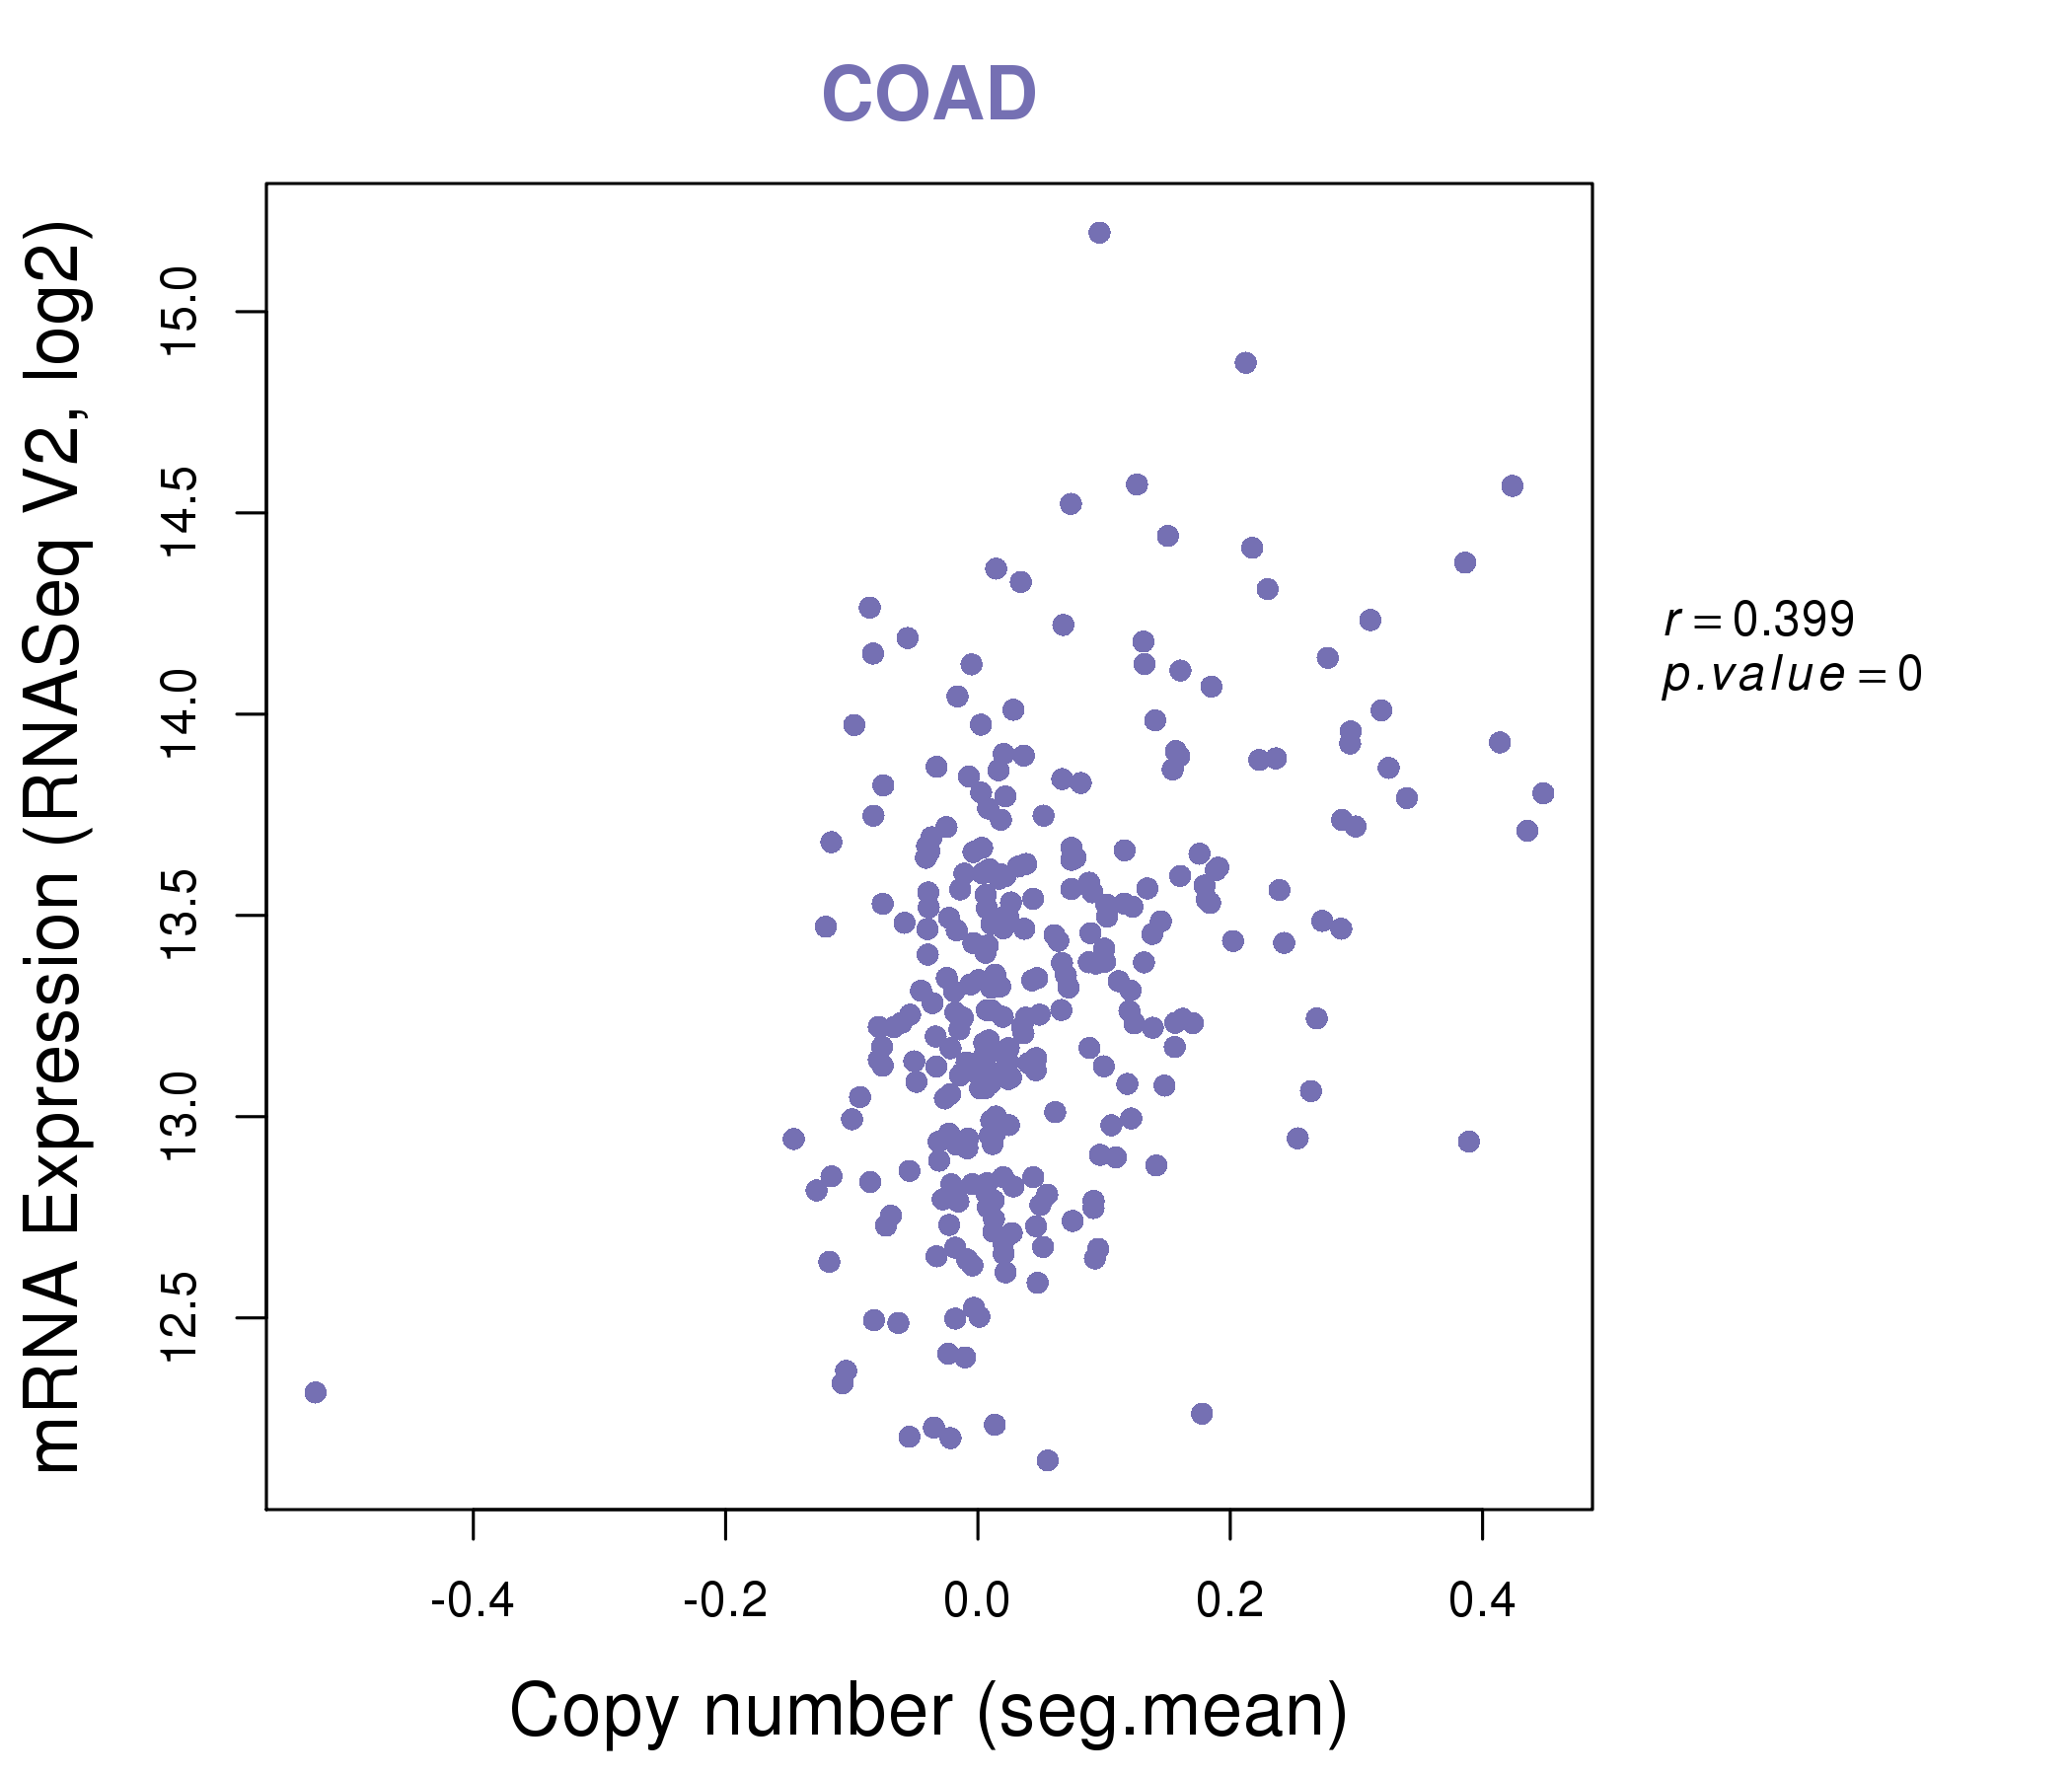
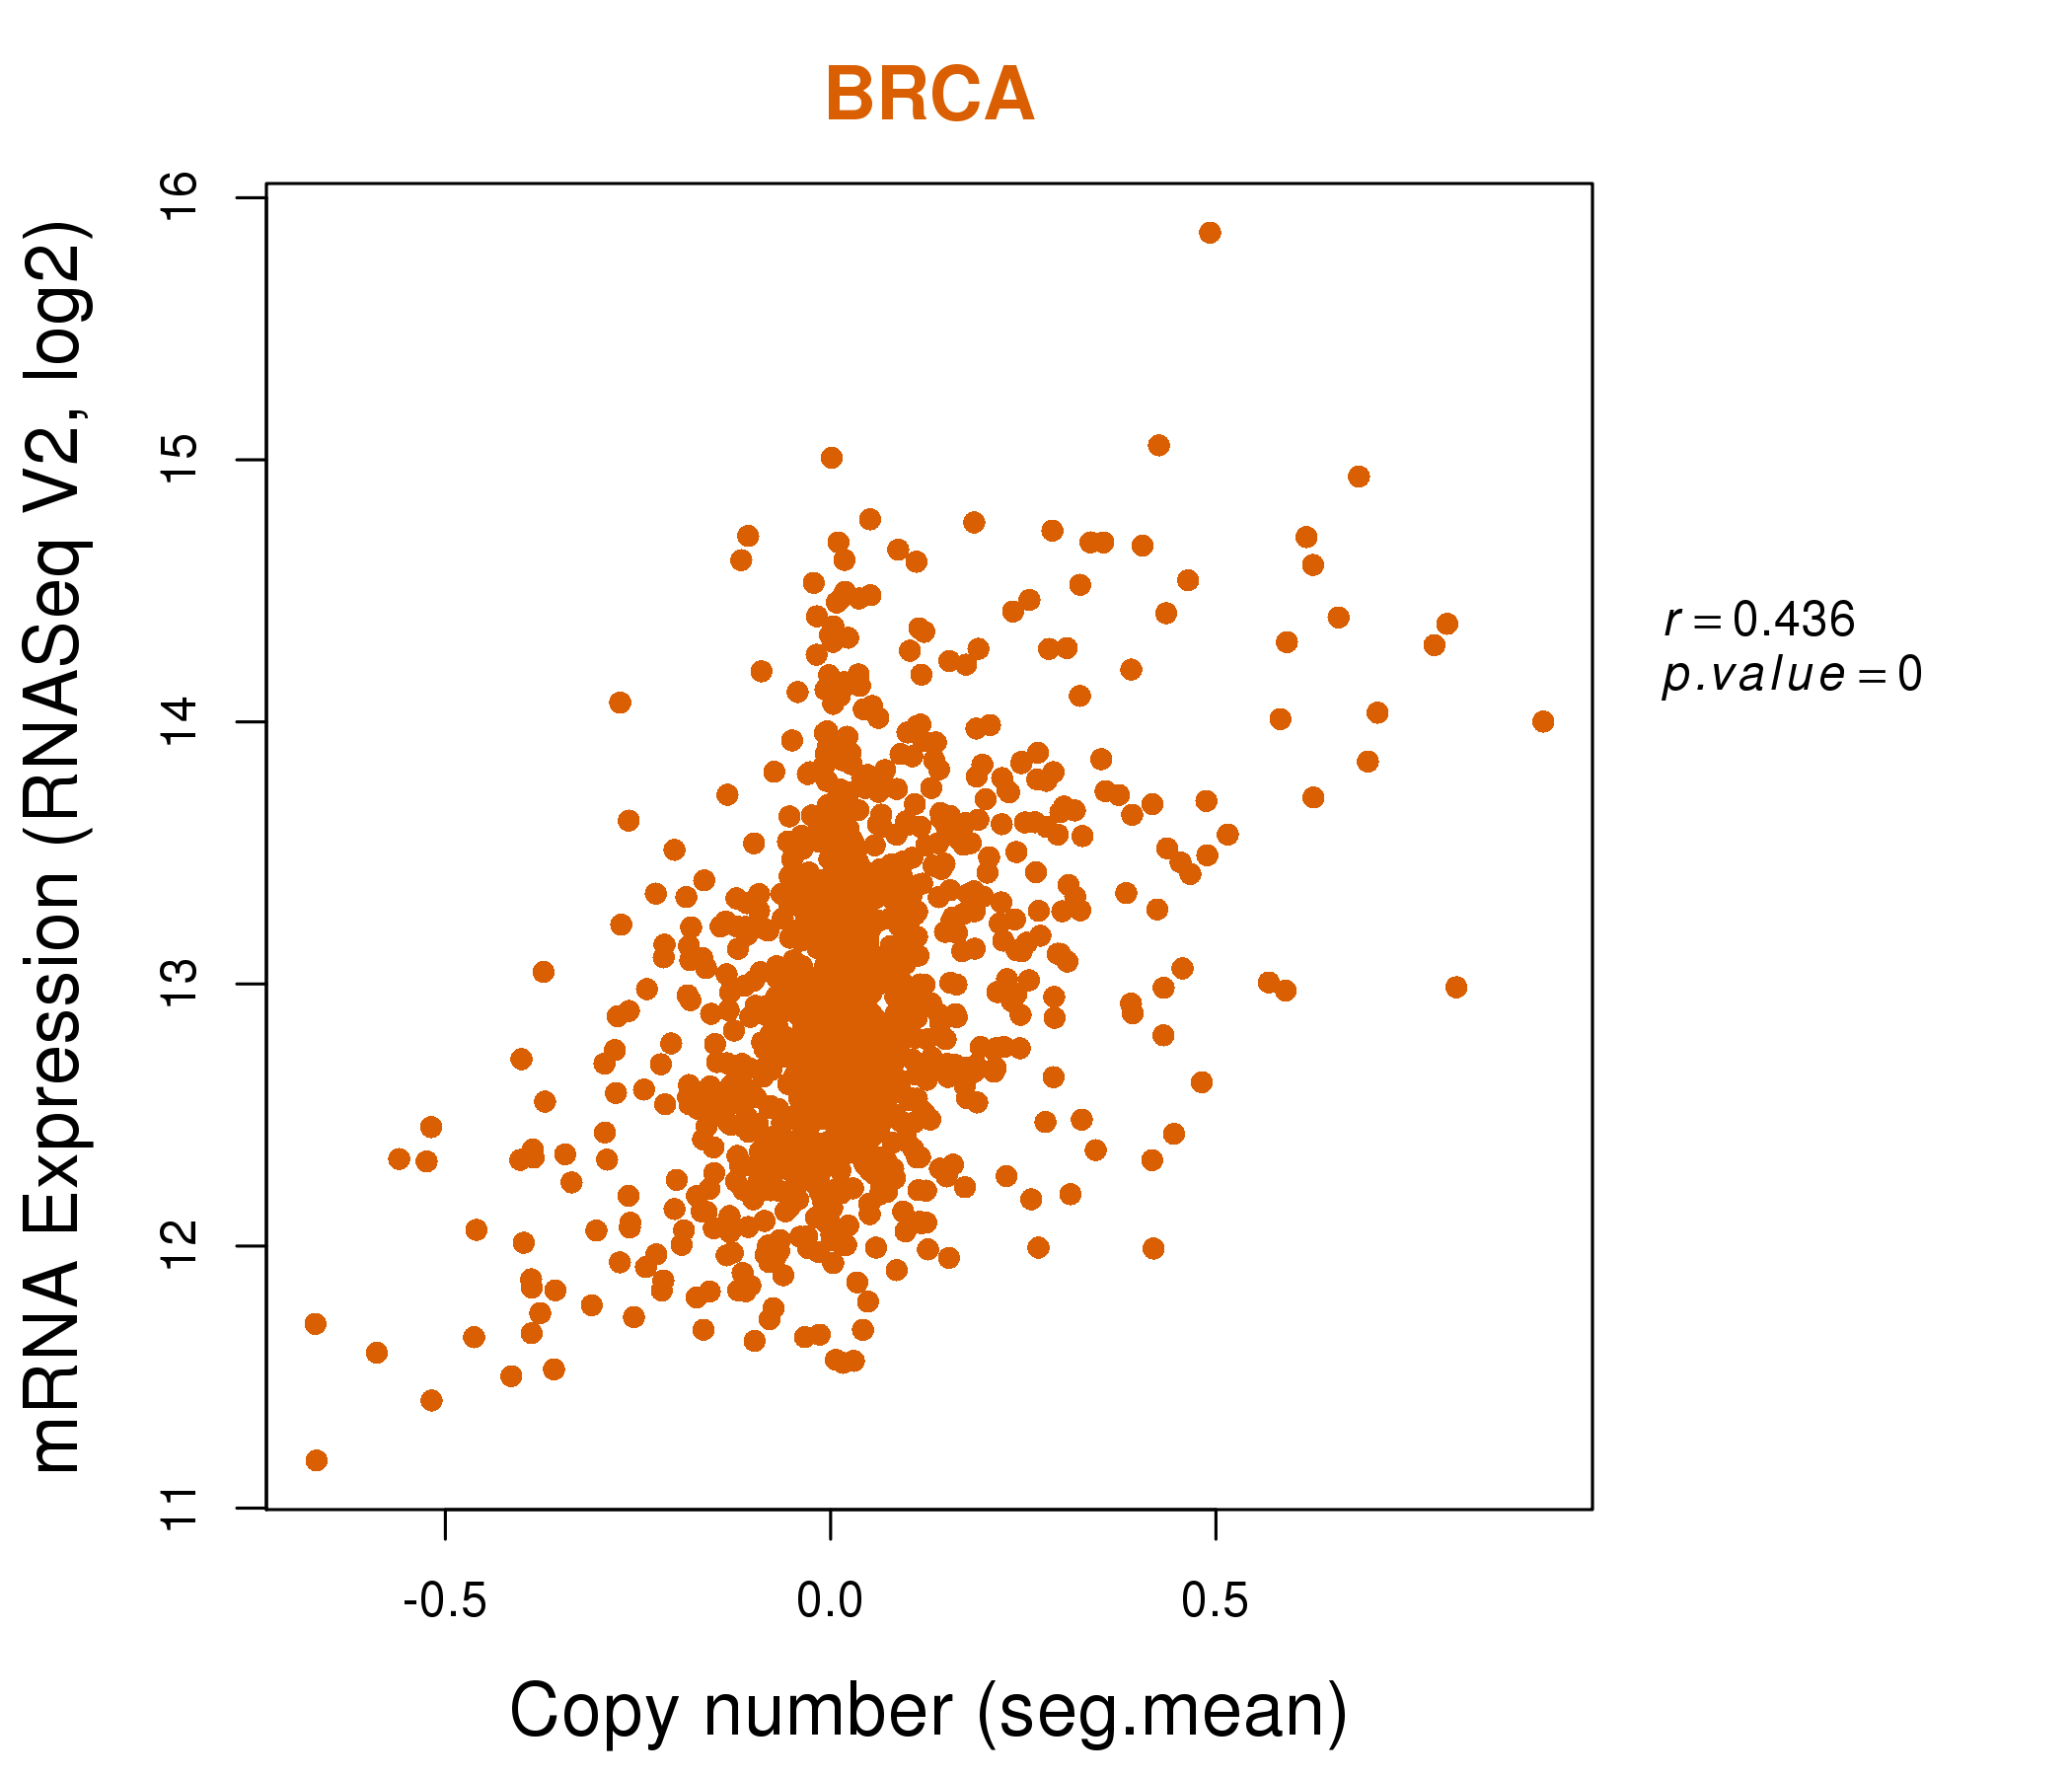
| * This plots show the correlation between CNV and gene expression. |
: Open all plots for all cancer types
 |
|
 |
|
| Top |
| Gene-Gene Network Information |
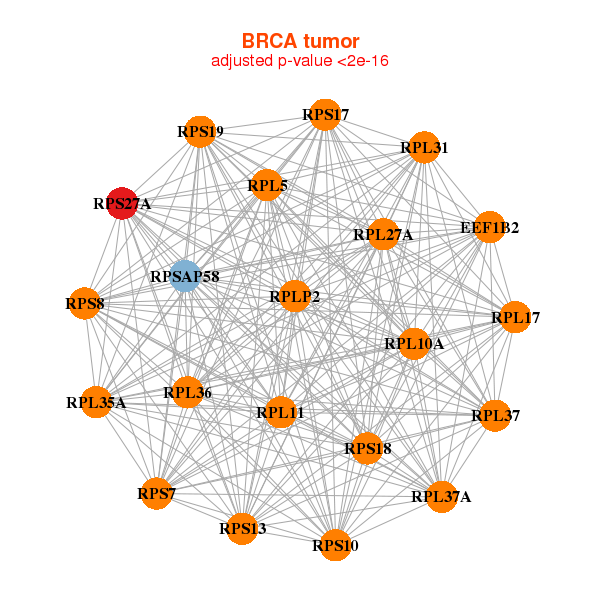
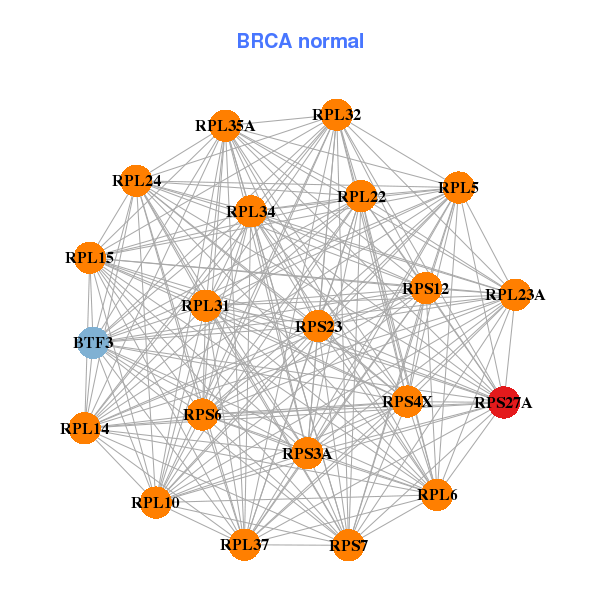
| * Co-Expression network figures were drawn using R package igraph. Only the top 20 genes with the highest correlations were shown. Red circle: input gene, orange circle: cell metabolism gene, sky circle: other gene |
: Open all plots for all cancer types
 |
|
| EEF1B2,RPL10A,RPL11,RPL17,RPL27A,RPL31,RPL35A, RPL36,RPL37,RPL37A,RPL5,RPLP2,RPS10,RPS13, RPS17,RPS18,RPS19,RPS27A,RPS7,RPS8,RPSAP58 | BTF3,RPL10,RPL14,RPL15,RPL22,RPL23A,RPL24, RPL31,RPL32,RPL34,RPL35A,RPL37,RPL5,RPL6, RPS12,RPS23,RPS27A,RPS3A,RPS4X,RPS6,RPS7 |
 |
|
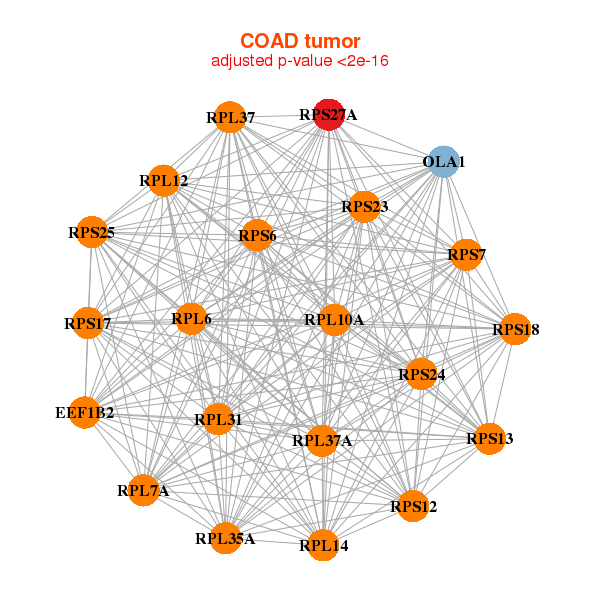
| EEF1B2,OLA1,RPL10A,RPL12,RPL14,RPL31,RPL35A, RPL37,RPL37A,RPL6,RPL7A,RPS12,RPS13,RPS17, RPS18,RPS23,RPS24,RPS25,RPS27A,RPS6,RPS7 | ALKBH2,EEF1A1,FAU,PFDN5,RPL15,RPL17,RPL24, RPL27,RPL31,RPL34,RPL35A,RPL38,RPL41,RPL5, RPS13,RPS20,RPS23,RPS24,RPS25,RPS27A,ZFAND1 |
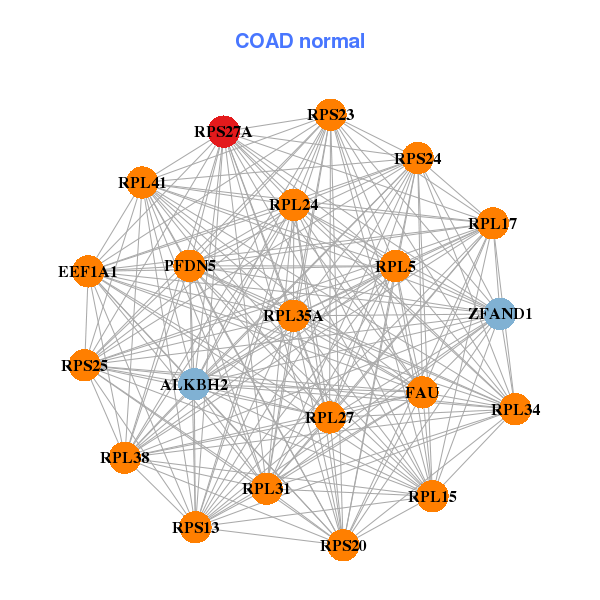
| * Co-Expression network figures were drawn using R package igraph. Only the top 20 genes with the highest correlations were shown. Red circle: input gene, orange circle: cell metabolism gene, sky circle: other gene |
: Open all plots for all cancer types
| Top |
: Open all interacting genes' information including KEGG pathway for all interacting genes from DAVID
| Top |
| Pharmacological Information for RPS27A |
| There's no related Drug. |
| Top |
| Cross referenced IDs for RPS27A |
| * We obtained these cross-references from Uniprot database. It covers 150 different DBs, 18 categories. http://www.uniprot.org/help/cross_references_section |
: Open all cross reference information
|
Copyright © 2016-Present - The Univsersity of Texas Health Science Center at Houston @ |