|
||||||||||||||||||||
| |
| Phenotypic Information (metabolism pathway, cancer, disease, phenome) |
| |
| |
| Gene-Gene Network Information: Co-Expression Network, Interacting Genes & KEGG |
| |
|


| Gene Summary for RPS28 |
| Basic gene info. | Gene symbol | RPS28 |
| Gene name | ribosomal protein S28 | |
| Synonyms | S28 | |
| Cytomap | UCSC genome browser: 19p13.2 | |
| Genomic location | chr19 :8386383-8387280 | |
| Type of gene | protein-coding | |
| RefGenes | NM_001031.4, | |
| Ensembl id | ENSG00000233927 | |
| Description | 40S ribosomal protein S28 | |
| Modification date | 20141207 | |
| dbXrefs | MIM : 603685 | |
| HGNC : HGNC | ||
| HPRD : 04731 | ||
| Protein | UniProt: go to UniProt's Cross Reference DB Table | |
| Expression | CleanEX: HS_RPS28 | |
| BioGPS: 6234 | ||
| Gene Expression Atlas: ENSG00000233927 | ||
| The Human Protein Atlas: ENSG00000233927 | ||
| Pathway | NCI Pathway Interaction Database: RPS28 | |
| KEGG: RPS28 | ||
| REACTOME: RPS28 | ||
| ConsensusPathDB | ||
| Pathway Commons: RPS28 | ||
| Metabolism | MetaCyc: RPS28 | |
| HUMANCyc: RPS28 | ||
| Regulation | Ensembl's Regulation: ENSG00000233927 | |
| miRBase: chr19 :8,386,383-8,387,280 | ||
| TargetScan: NM_001031 | ||
| cisRED: ENSG00000233927 | ||
| Context | iHOP: RPS28 | |
| cancer metabolism search in PubMed: RPS28 | ||
| UCL Cancer Institute: RPS28 | ||
| Assigned class in ccmGDB | C | |
| Top |
| Phenotypic Information for RPS28(metabolism pathway, cancer, disease, phenome) |
| Cancer | CGAP: RPS28 |
| Familial Cancer Database: RPS28 | |
| * This gene is included in those cancer gene databases. |
|
|
|
|
|
| . | ||||||||||||||
Oncogene 1 | Significant driver gene in | |||||||||||||||||||
| cf) number; DB name 1 Oncogene; http://nar.oxfordjournals.org/content/35/suppl_1/D721.long, 2 Tumor Suppressor gene; https://bioinfo.uth.edu/TSGene/, 3 Cancer Gene Census; http://www.nature.com/nrc/journal/v4/n3/abs/nrc1299.html, 4 CancerGenes; http://nar.oxfordjournals.org/content/35/suppl_1/D721.long, 5 Network of Cancer Gene; http://ncg.kcl.ac.uk/index.php, 1Therapeutic Vulnerabilities in Cancer; http://cbio.mskcc.org/cancergenomics/statius/ |
| REACTOME_METABOLISM_OF_PROTEINS REACTOME_METABOLISM_OF_MRNA REACTOME_METABOLISM_OF_RNA | |
| OMIM | |
| Orphanet | |
| Disease | KEGG Disease: RPS28 |
| MedGen: RPS28 (Human Medical Genetics with Condition) | |
| ClinVar: RPS28 | |
| Phenotype | MGI: RPS28 (International Mouse Phenotyping Consortium) |
| PhenomicDB: RPS28 | |
| Mutations for RPS28 |
| * Under tables are showing count per each tissue to give us broad intuition about tissue specific mutation patterns.You can go to the detailed page for each mutation database's web site. |
| There's no structural variation information in COSMIC data for this gene. |
| * From mRNA Sanger sequences, Chitars2.0 arranged chimeric transcripts. This table shows RPS28 related fusion information. |
| ID | Head Gene | Tail Gene | Accession | Gene_a | qStart_a | qEnd_a | Chromosome_a | tStart_a | tEnd_a | Gene_a | qStart_a | qEnd_a | Chromosome_a | tStart_a | tEnd_a |
| Top |
| There's no copy number variation information in COSMIC data for this gene. |
| Top |
|
 |
| Top |
| Stat. for Non-Synonymous SNVs (# total SNVs=2) | (# total SNVs=0) |
 | |
(# total SNVs=0) | (# total SNVs=0) |
| Top |
| * When you move the cursor on each content, you can see more deailed mutation information on the Tooltip. Those are primary_site,primary_histology,mutation(aa),pubmedID. |
| GRCh37 position | Mutation(aa) | Unique sampleID count |
| chr11:82400713-82400713 | p.T38M | 2 |
| Top |
|
 |
| Point Mutation/ Tissue ID | 1 | 2 | 3 | 4 | 5 | 6 | 7 | 8 | 9 | 10 | 11 | 12 | 13 | 14 | 15 | 16 | 17 | 18 | 19 | 20 |
| # sample | 1 | 1 | 1 | 1 | ||||||||||||||||
| # mutation | 1 | 1 | 1 | 1 | ||||||||||||||||
| nonsynonymous SNV | 1 | 1 | 1 | |||||||||||||||||
| synonymous SNV | 1 |
| cf) Tissue ID; Tissue type (1; BLCA[Bladder Urothelial Carcinoma], 2; BRCA[Breast invasive carcinoma], 3; CESC[Cervical squamous cell carcinoma and endocervical adenocarcinoma], 4; COAD[Colon adenocarcinoma], 5; GBM[Glioblastoma multiforme], 6; Glioma Low Grade, 7; HNSC[Head and Neck squamous cell carcinoma], 8; KICH[Kidney Chromophobe], 9; KIRC[Kidney renal clear cell carcinoma], 10; KIRP[Kidney renal papillary cell carcinoma], 11; LAML[Acute Myeloid Leukemia], 12; LUAD[Lung adenocarcinoma], 13; LUSC[Lung squamous cell carcinoma], 14; OV[Ovarian serous cystadenocarcinoma ], 15; PAAD[Pancreatic adenocarcinoma], 16; PRAD[Prostate adenocarcinoma], 17; SKCM[Skin Cutaneous Melanoma], 18:STAD[Stomach adenocarcinoma], 19:THCA[Thyroid carcinoma], 20:UCEC[Uterine Corpus Endometrial Carcinoma]) |
| Top |
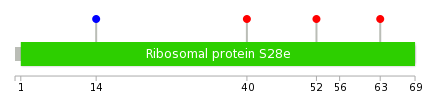
| * We represented just top 10 SNVs. When you move the cursor on each content, you can see more deailed mutation information on the Tooltip. Those are primary_site, primary_histology, mutation(aa), pubmedID. |
| Genomic Position | Mutation(aa) | Unique sampleID count |
| chr19:8386903 | p.V14V | 1 |
| chr19:8386936 | p.R40Q | 1 |
| chr19:8386542 | p.E52Q | 1 |
| chr19:8386868 | p.R63G | 1 |
| * Copy number data were extracted from TCGA using R package TCGA-Assembler. The URLs of all public data files on TCGA DCC data server were gathered on Jan-05-2015. Function ProcessCNAData in TCGA-Assembler package was used to obtain gene-level copy number value which is calculated as the average copy number of the genomic region of a gene. |
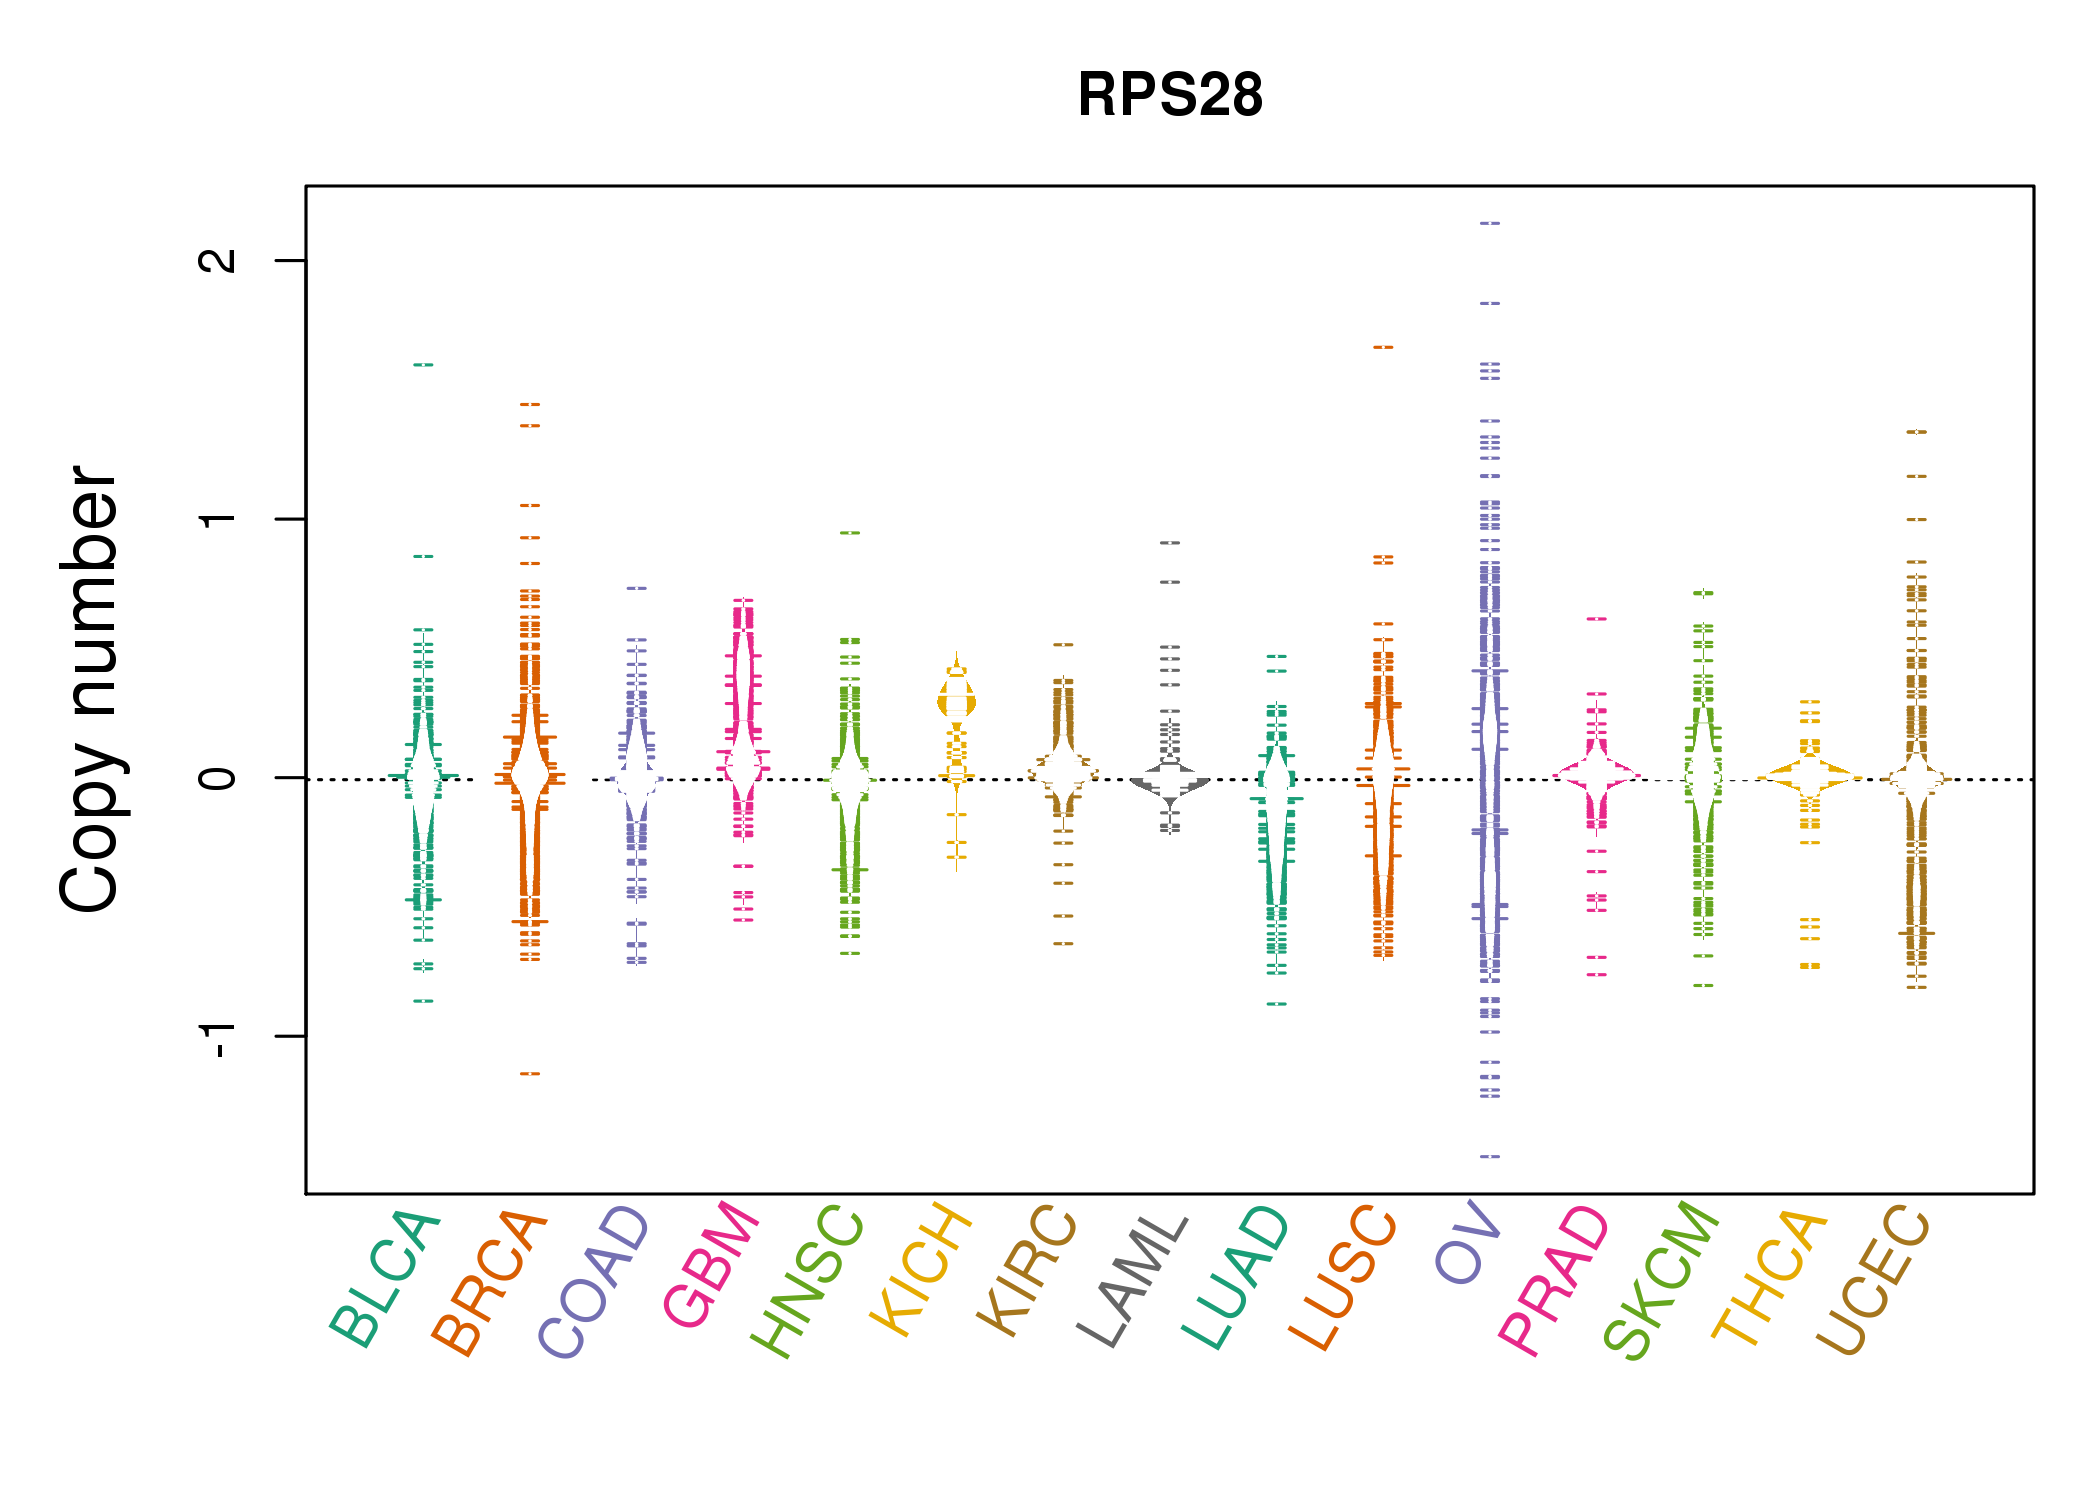 |
| cf) Tissue ID[Tissue type]: BLCA[Bladder Urothelial Carcinoma], BRCA[Breast invasive carcinoma], CESC[Cervical squamous cell carcinoma and endocervical adenocarcinoma], COAD[Colon adenocarcinoma], GBM[Glioblastoma multiforme], Glioma Low Grade, HNSC[Head and Neck squamous cell carcinoma], KICH[Kidney Chromophobe], KIRC[Kidney renal clear cell carcinoma], KIRP[Kidney renal papillary cell carcinoma], LAML[Acute Myeloid Leukemia], LUAD[Lung adenocarcinoma], LUSC[Lung squamous cell carcinoma], OV[Ovarian serous cystadenocarcinoma ], PAAD[Pancreatic adenocarcinoma], PRAD[Prostate adenocarcinoma], SKCM[Skin Cutaneous Melanoma], STAD[Stomach adenocarcinoma], THCA[Thyroid carcinoma], UCEC[Uterine Corpus Endometrial Carcinoma] |
| Top |
| Gene Expression for RPS28 |
| * CCLE gene expression data were extracted from CCLE_Expression_Entrez_2012-10-18.res: Gene-centric RMA-normalized mRNA expression data. |
 |
| * Normalized gene expression data of RNASeqV2 was extracted from TCGA using R package TCGA-Assembler. The URLs of all public data files on TCGA DCC data server were gathered at Jan-05-2015. Only eight cancer types have enough normal control samples for differential expression analysis. (t test, adjusted p<0.05 (using Benjamini-Hochberg FDR)) |
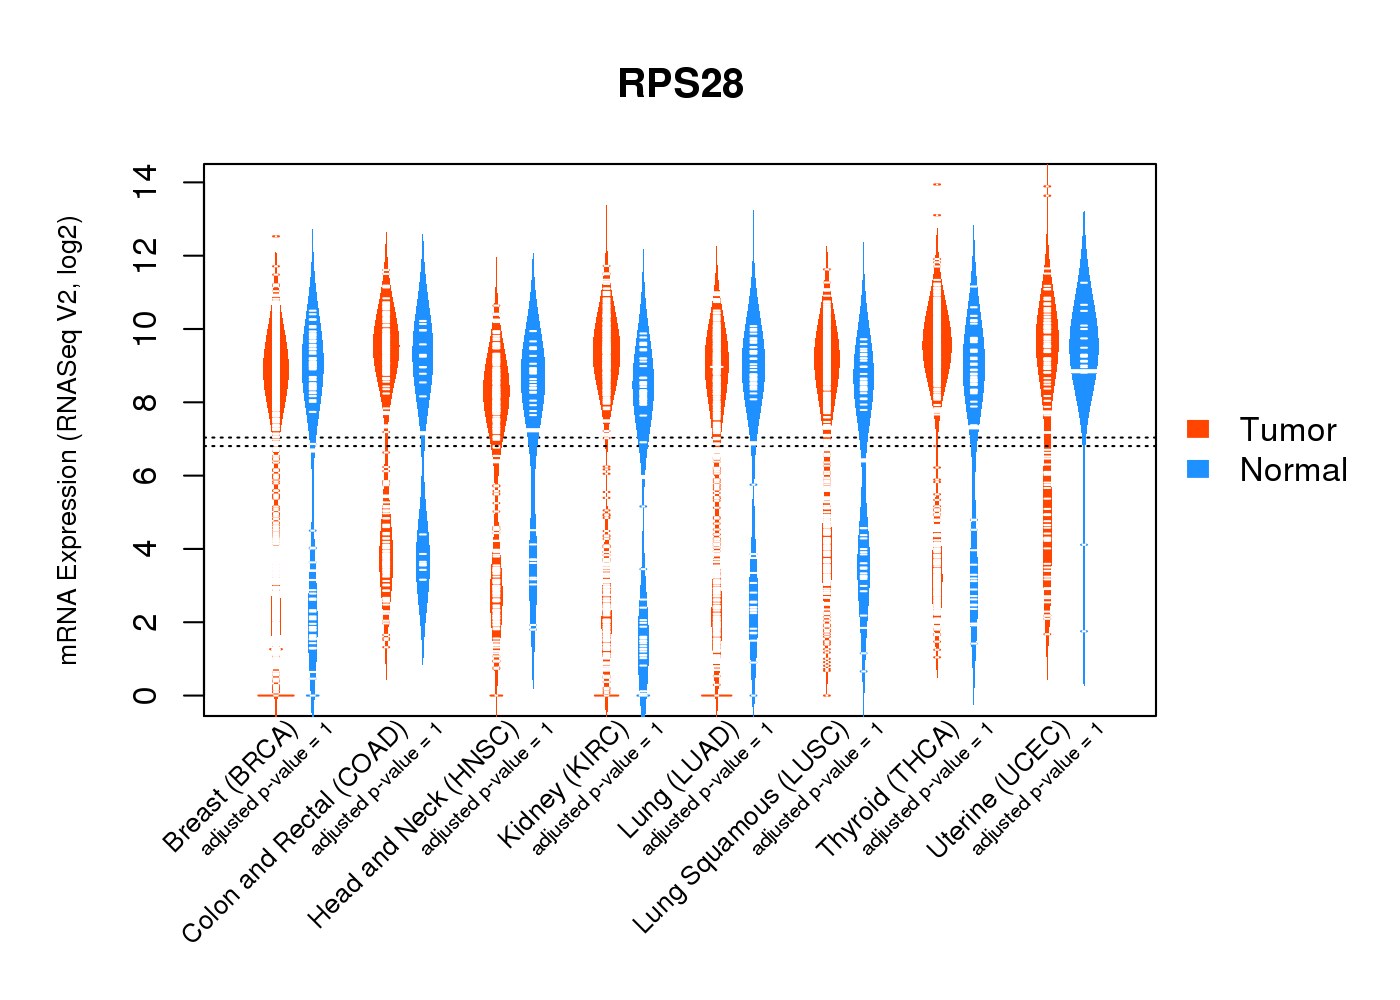 |
| Top |
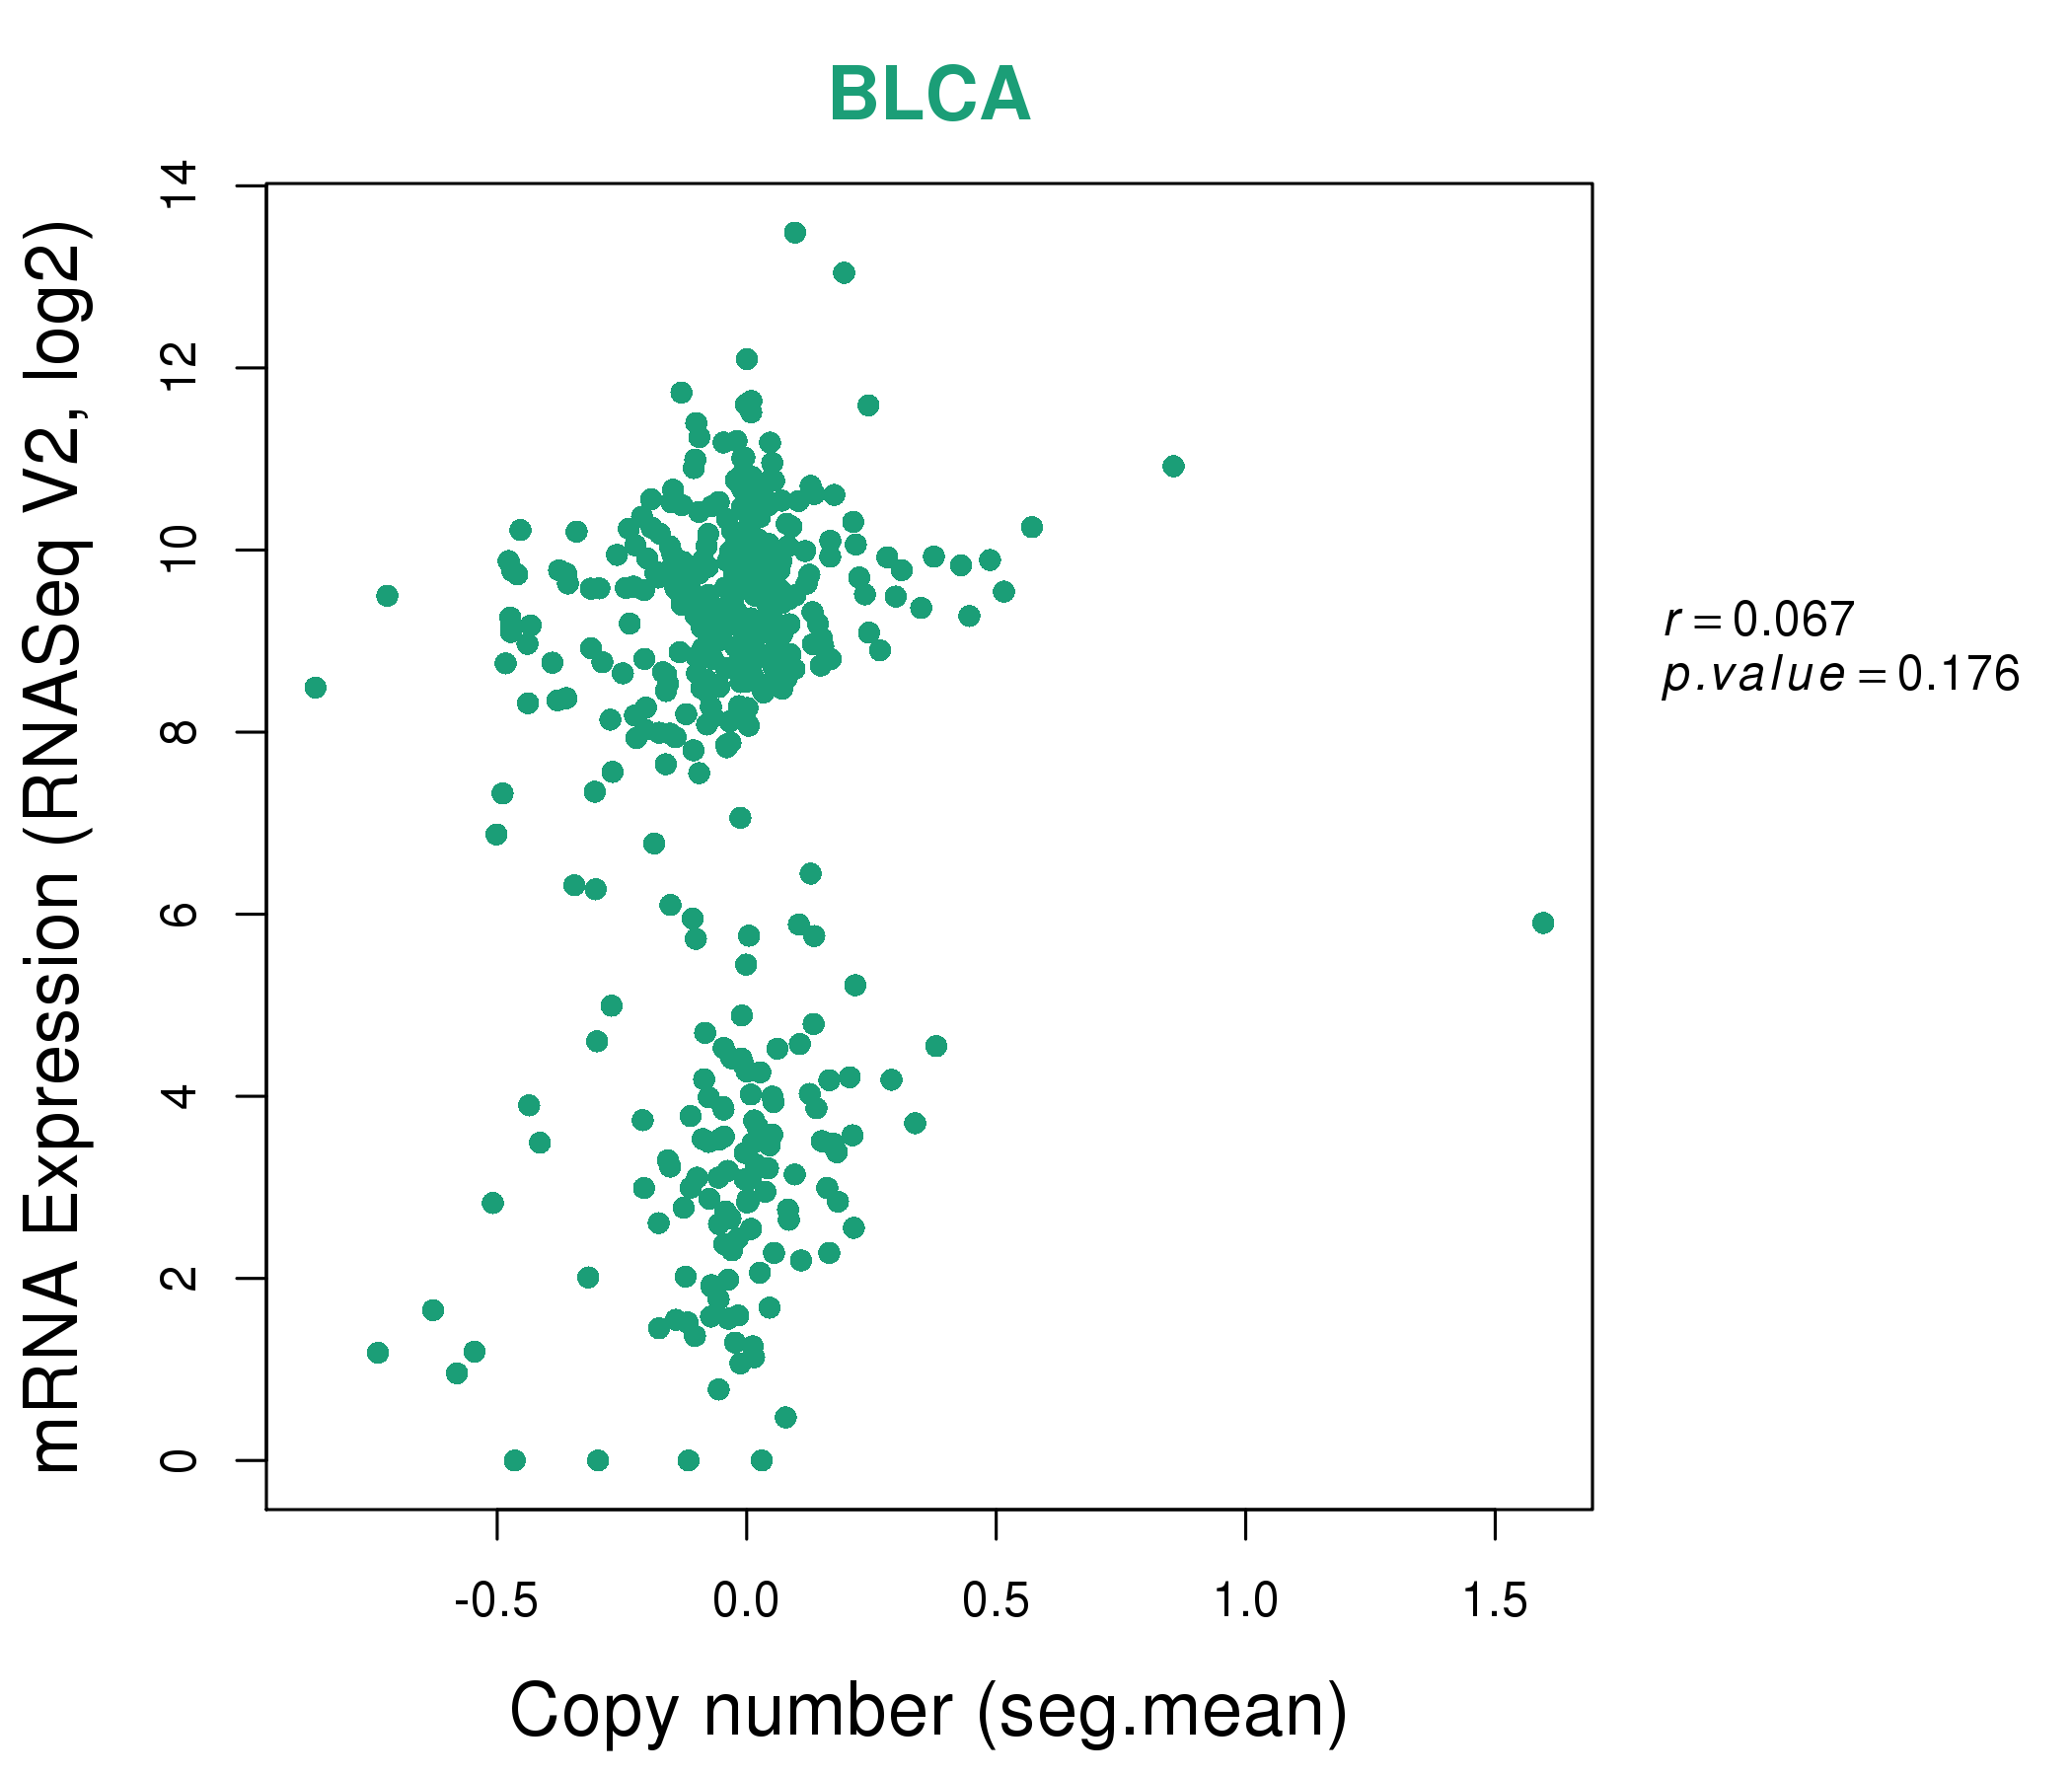
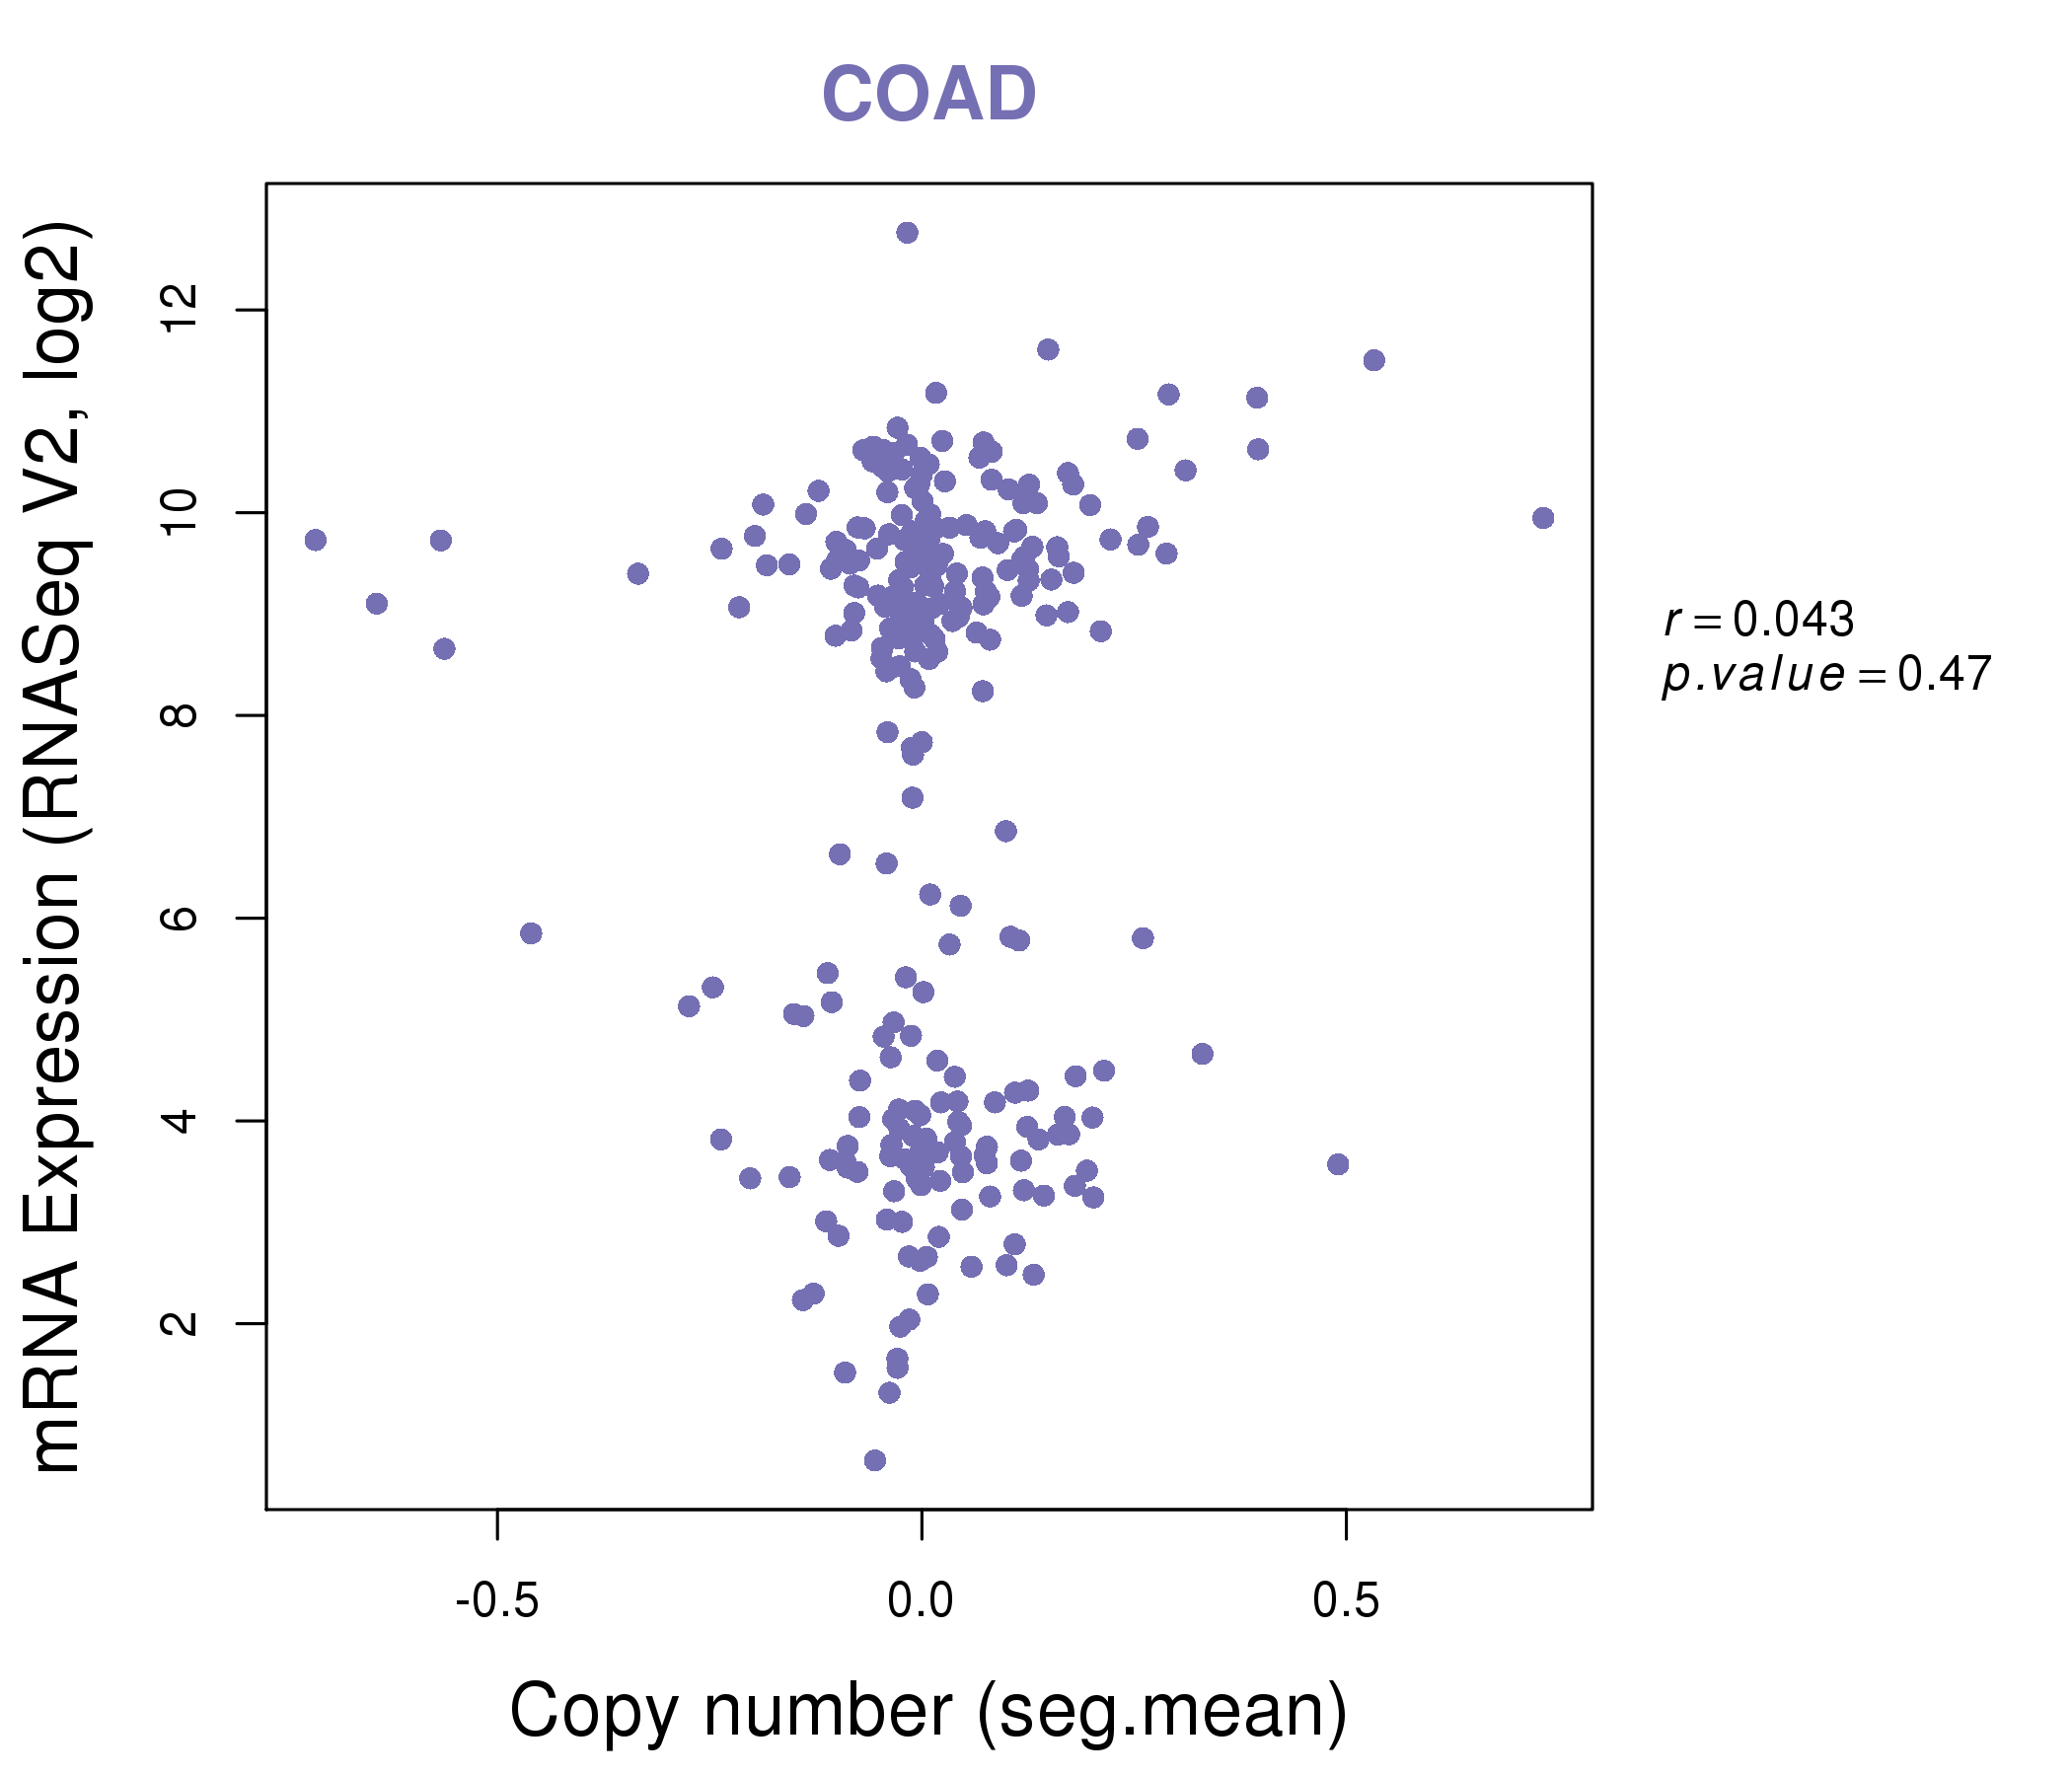
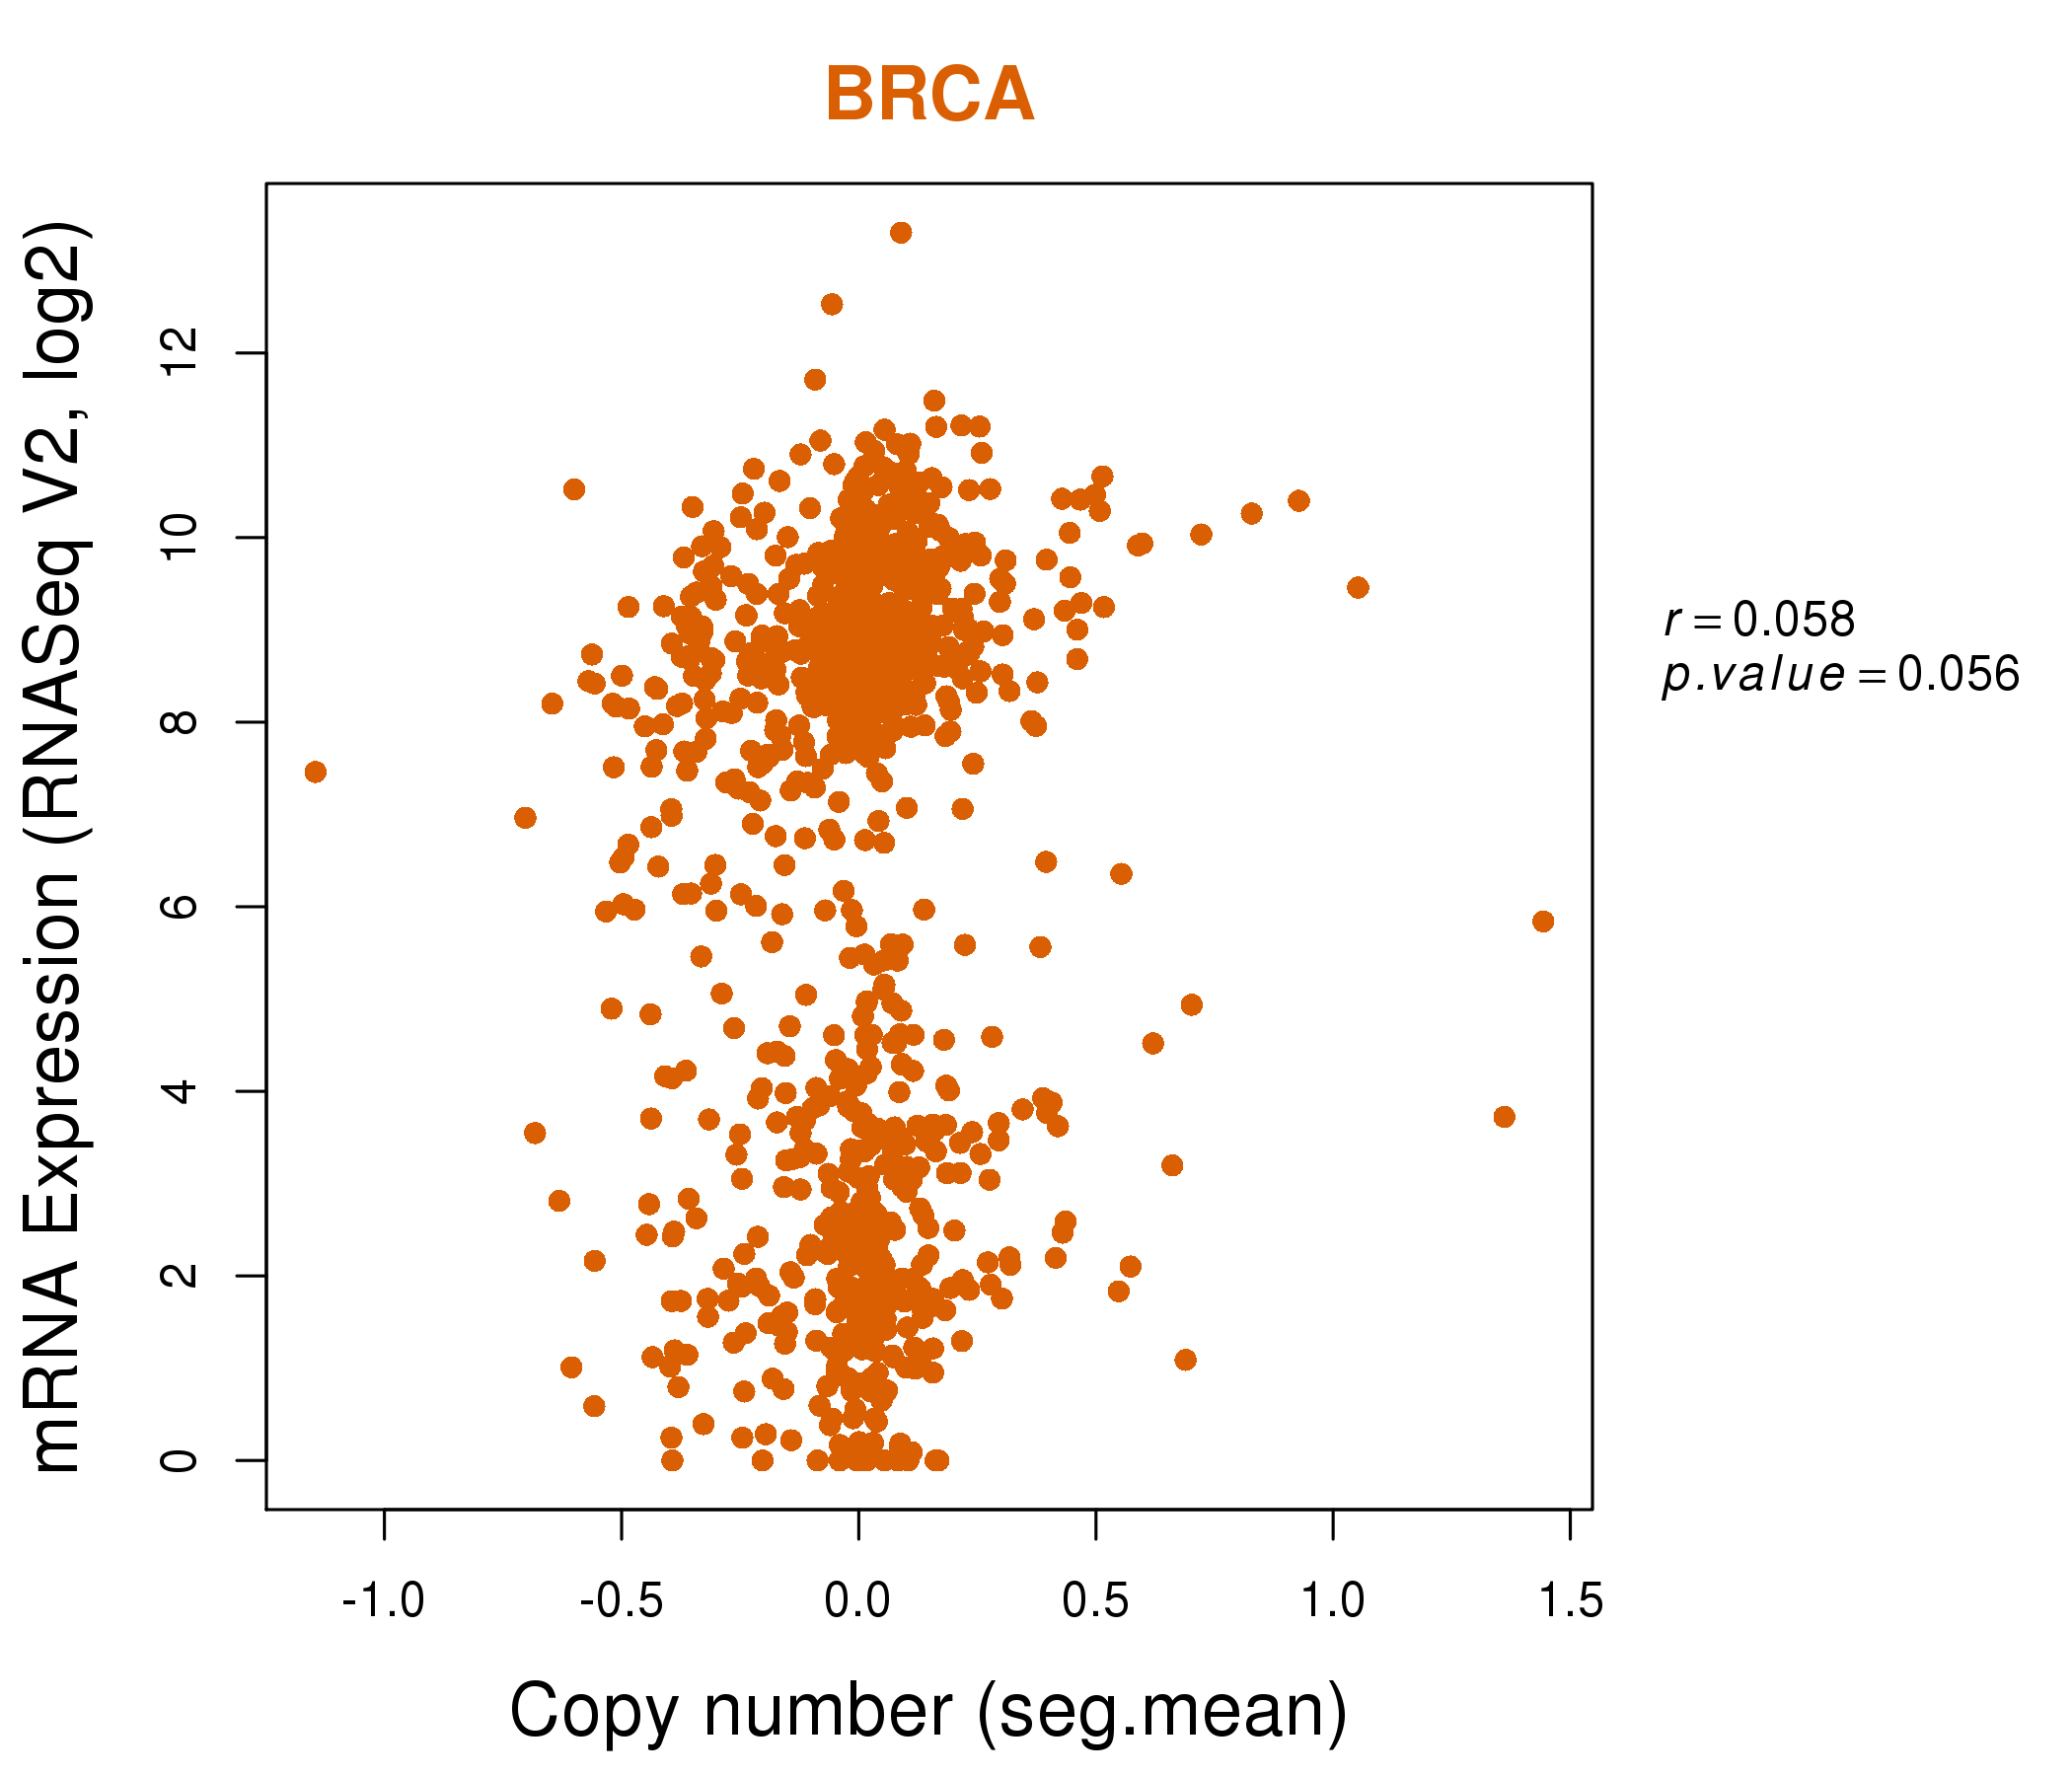
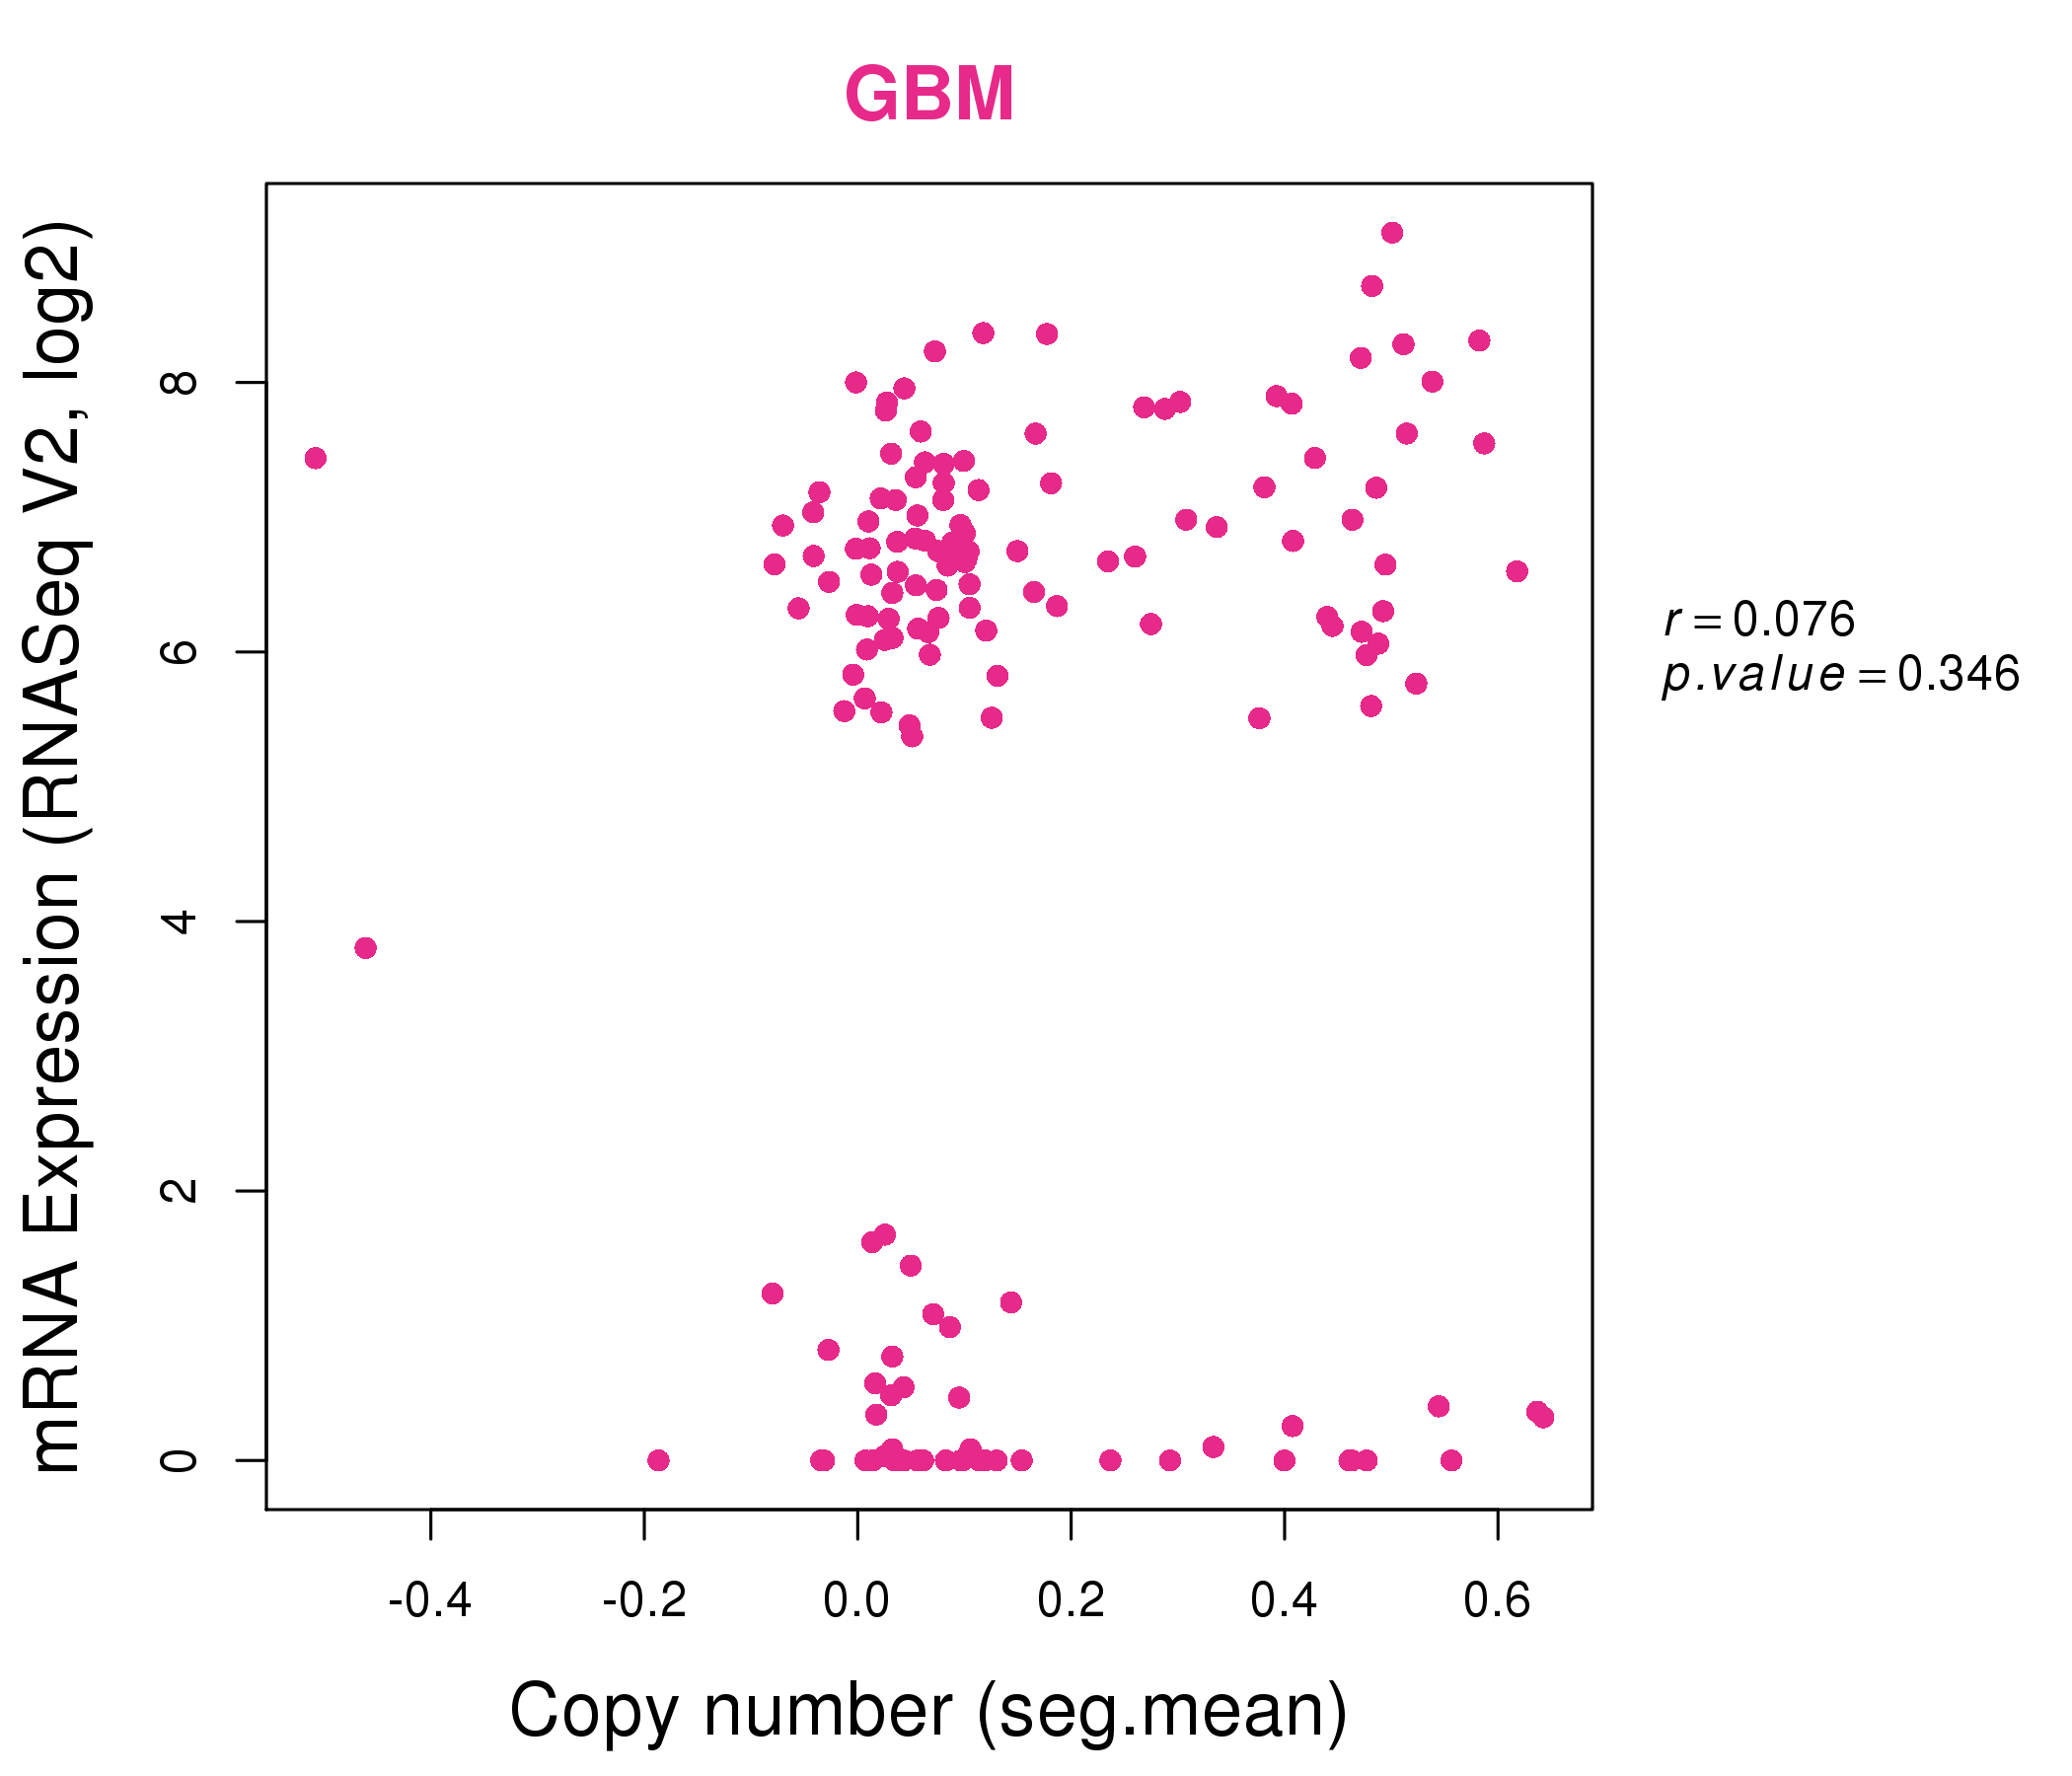
| * This plots show the correlation between CNV and gene expression. |
: Open all plots for all cancer types
 |
|
 |
|
| Top |
| Gene-Gene Network Information |
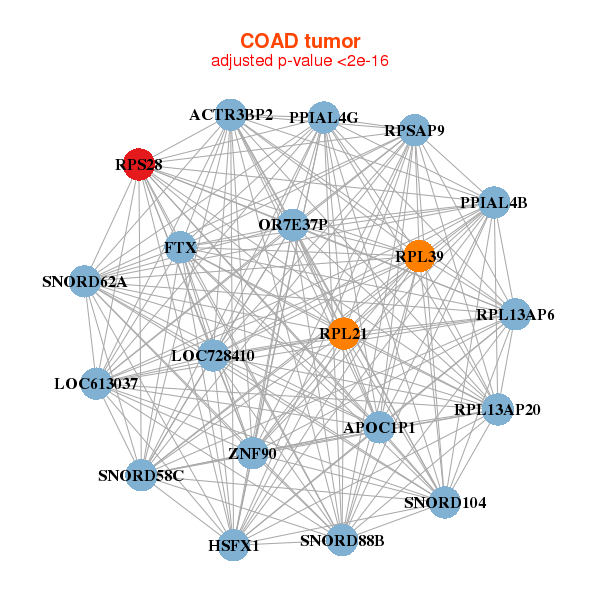
| * Co-Expression network figures were drawn using R package igraph. Only the top 20 genes with the highest correlations were shown. Red circle: input gene, orange circle: cell metabolism gene, sky circle: other gene |
: Open all plots for all cancer types
 |
|
| ATP5D,FAU,PPIAL4B,RPL13,RPL14,RPL18,RPL29, RPL32,RPL35,RPL39,RPL4,RPLP1,RPS15,RPS17, RPS2,RPS28,SCARNA2,SNORA10,SNORA28,SNORA38,SNORA71A | C10orf2,CHST10,FAM3B,GEMIN4,GOLGA7B,GPR27,HSD11B2, LOC100133669,LRRC41,NCK2,NLE1,PRSS21,RPS28,RPS5, SF1,SH3YL1,SLC7A3,TMEM177,TRNP1,USH1G,USP11 |
 |
|
| APOC1P1,ACTR3BP2,HSFX1,LOC613037,LOC728410,FTX,OR7E37P, PPIAL4B,PPIAL4G,RPL13AP20,RPL13AP6,RPL21,RPL39,RPS28, RPSAP9,SNORD104,SNORD58C,SNORD62A,SNORD88B,Z | ASPG,C16orf70,ZNF252P-AS1,DIO3OS,FLJ40852,HES5,CCDC183, LOC100130872,LOC285359,MACROD1,PPFIBP2,RPS28,SELV,SYTL4, TDRD3,TMCO6,TMEM44,TMEM69,VSTM2A,XAGE1D,ZNF100 |
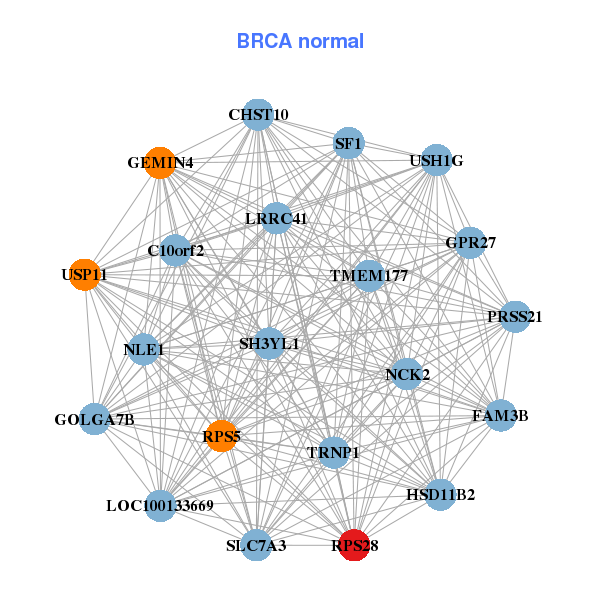
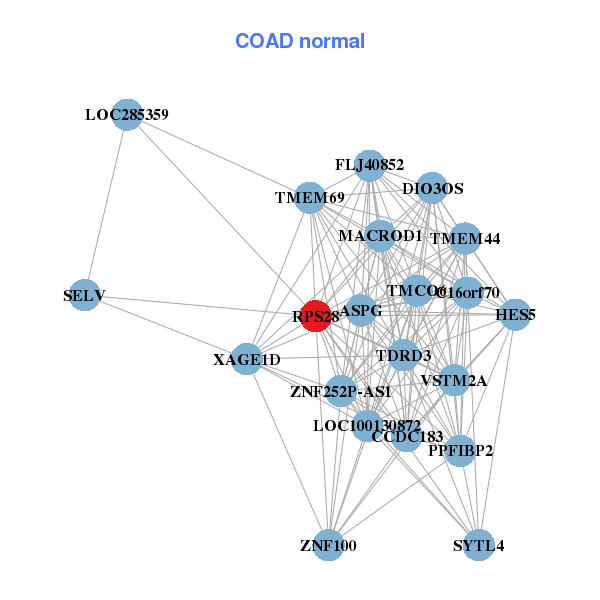
| * Co-Expression network figures were drawn using R package igraph. Only the top 20 genes with the highest correlations were shown. Red circle: input gene, orange circle: cell metabolism gene, sky circle: other gene |
: Open all plots for all cancer types
| Top |
: Open all interacting genes' information including KEGG pathway for all interacting genes from DAVID
| Top |
| Pharmacological Information for RPS28 |
| There's no related Drug. |
| Top |
| Cross referenced IDs for RPS28 |
| * We obtained these cross-references from Uniprot database. It covers 150 different DBs, 18 categories. http://www.uniprot.org/help/cross_references_section |
: Open all cross reference information
|
Copyright © 2016-Present - The Univsersity of Texas Health Science Center at Houston @ |