|
||||||||||||||||||||
| |
| Phenotypic Information (metabolism pathway, cancer, disease, phenome) |
| |
| |
| Gene-Gene Network Information: Co-Expression Network, Interacting Genes & KEGG |
| |
|


| Gene Summary for SAT1 |
| Basic gene info. | Gene symbol | SAT1 |
| Gene name | spermidine/spermine N1-acetyltransferase 1 | |
| Synonyms | DC21|KFSD|KFSDX|SAT|SSAT|SSAT-1 | |
| Cytomap | UCSC genome browser: Xp22.1 | |
| Genomic location | chrX :23801274-23804327 | |
| Type of gene | protein-coding | |
| RefGenes | NM_002970.3, NR_027783.2, | |
| Ensembl id | ENSG00000130066 | |
| Description | diamine N-acetyltransferase 1diamine acetyltransferase 1polyamine N-acetyltransferase 1putrescine acetyltransferasespermidine/spermine N1-acetyltransferase alpha | |
| Modification date | 20141222 | |
| dbXrefs | MIM : 313020 | |
| HGNC : HGNC | ||
| Ensembl : ENSG00000130066 | ||
| HPRD : 02431 | ||
| Vega : OTTHUMG00000021256 | ||
| Protein | UniProt: go to UniProt's Cross Reference DB Table | |
| Expression | CleanEX: HS_SAT1 | |
| BioGPS: 6303 | ||
| Gene Expression Atlas: ENSG00000130066 | ||
| The Human Protein Atlas: ENSG00000130066 | ||
| Pathway | NCI Pathway Interaction Database: SAT1 | |
| KEGG: SAT1 | ||
| REACTOME: SAT1 | ||
| ConsensusPathDB | ||
| Pathway Commons: SAT1 | ||
| Metabolism | MetaCyc: SAT1 | |
| HUMANCyc: SAT1 | ||
| Regulation | Ensembl's Regulation: ENSG00000130066 | |
| miRBase: chrX :23,801,274-23,804,327 | ||
| TargetScan: NM_002970 | ||
| cisRED: ENSG00000130066 | ||
| Context | iHOP: SAT1 | |
| cancer metabolism search in PubMed: SAT1 | ||
| UCL Cancer Institute: SAT1 | ||
| Assigned class in ccmGDB | C | |
| Top |
| Phenotypic Information for SAT1(metabolism pathway, cancer, disease, phenome) |
| Cancer | CGAP: SAT1 |
| Familial Cancer Database: SAT1 | |
| * This gene is included in those cancer gene databases. |
|
|
|
|
|
|
| ||||||||||||||
Oncogene 1 | Significant driver gene in | |||||||||||||||||||
| cf) number; DB name 1 Oncogene; http://nar.oxfordjournals.org/content/35/suppl_1/D721.long, 2 Tumor Suppressor gene; https://bioinfo.uth.edu/TSGene/, 3 Cancer Gene Census; http://www.nature.com/nrc/journal/v4/n3/abs/nrc1299.html, 4 CancerGenes; http://nar.oxfordjournals.org/content/35/suppl_1/D721.long, 5 Network of Cancer Gene; http://ncg.kcl.ac.uk/index.php, 1Therapeutic Vulnerabilities in Cancer; http://cbio.mskcc.org/cancergenomics/statius/ |
| KEGG_ARGININE_AND_PROLINE_METABOLISM REACTOME_METABOLISM_OF_AMINO_ACIDS_AND_DERIVATIVES REACTOME_METABOLISM_OF_POLYAMINES | |
| OMIM | |
| Orphanet | |
| Disease | KEGG Disease: SAT1 |
| MedGen: SAT1 (Human Medical Genetics with Condition) | |
| ClinVar: SAT1 | |
| Phenotype | MGI: SAT1 (International Mouse Phenotyping Consortium) |
| PhenomicDB: SAT1 | |
| Mutations for SAT1 |
| * Under tables are showing count per each tissue to give us broad intuition about tissue specific mutation patterns.You can go to the detailed page for each mutation database's web site. |
| There's no structural variation information in COSMIC data for this gene. |
| * From mRNA Sanger sequences, Chitars2.0 arranged chimeric transcripts. This table shows SAT1 related fusion information. |
| ID | Head Gene | Tail Gene | Accession | Gene_a | qStart_a | qEnd_a | Chromosome_a | tStart_a | tEnd_a | Gene_a | qStart_a | qEnd_a | Chromosome_a | tStart_a | tEnd_a |
| BM263653 | MPHOSPH8 | 17 | 178 | 13 | 20224144 | 20224305 | SAT1 | 173 | 560 | X | 23803938 | 23804325 | |
| CA848235 | SAT1 | 14 | 403 | X | 23803938 | 23804327 | MPHOSPH8 | 398 | 555 | 13 | 20224148 | 20224305 | |
| H56980 | FYCO1 | 1 | 136 | 3 | 46000973 | 46003790 | SAT1 | 130 | 426 | X | 23803976 | 23804269 | |
| BQ023122 | SAT1 | 20 | 258 | X | 23804087 | 23804325 | FNDC3B | 257 | 444 | 3 | 172117517 | 172117705 | |
| BM263362 | SAT1 | 22 | 403 | X | 23803938 | 23804319 | MPHOSPH8 | 398 | 558 | 13 | 20224145 | 20224305 | |
| BE765420 | SAT1 | 17 | 280 | X | 23804055 | 23804318 | SERPINE1 | 277 | 445 | 7 | 100781379 | 100781547 | |
| BE180881 | SAT1 | 9 | 102 | X | 23803088 | 23803181 | SAT1 | 98 | 273 | X | 23802946 | 23803121 | |
| AW582417 | SAT1 | 8 | 171 | X | 23803948 | 23804110 | SAT1 | 165 | 267 | X | 23803841 | 23803943 | |
| W39276 | SAT1 | 1 | 111 | X | 23803945 | 23804055 | SAT1 | 109 | 341 | X | 23804095 | 23804326 | |
| W31613 | SAT1 | 1 | 232 | X | 23804095 | 23804326 | SAT1 | 230 | 304 | X | 23803945 | 23804019 | |
| AW361033 | SAT1 | 12 | 270 | X | 23802021 | 23802281 | ANKH | 265 | 565 | 5 | 14710193 | 14710493 | |
| BU674743 | SAT1 | 17 | 96 | X | 23804248 | 23804327 | SAT1 | 92 | 253 | X | 23803954 | 23804115 | |
| Top |
| There's no copy number variation information in COSMIC data for this gene. |
| Top |
|
 |
| Top |
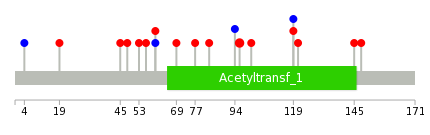
| Stat. for Non-Synonymous SNVs (# total SNVs=14) | (# total SNVs=4) |
 |  |
(# total SNVs=0) | (# total SNVs=0) |
| Top |
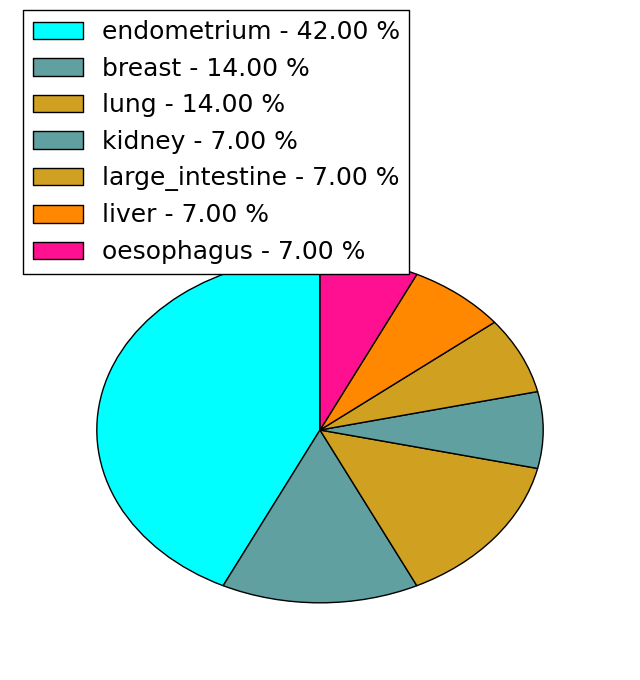
| * When you move the cursor on each content, you can see more deailed mutation information on the Tooltip. Those are primary_site,primary_histology,mutation(aa),pubmedID. |
| GRCh37 position | Mutation(aa) | Unique sampleID count |
| chr23:23803528-23803528 | p.V96M | 2 |
| chr23:23801821-23801821 | p.D40fs*3 | 1 |
| chr23:23801932-23801932 | p.G45D | 1 |
| chr23:23803544-23803544 | p.R101T | 1 |
| chr23:23801942-23801942 | p.E48D | 1 |
| chr23:23803813-23803813 | p.R119K | 1 |
| chr23:23801955-23801955 | p.H53Y | 1 |
| chr23:23803814-23803814 | p.R119R | 1 |
| chr23:23801965-23801965 | p.V56A | 1 |
| chr23:23803819-23803819 | p.R121H | 1 |
| Top |
|
 |
| Point Mutation/ Tissue ID | 1 | 2 | 3 | 4 | 5 | 6 | 7 | 8 | 9 | 10 | 11 | 12 | 13 | 14 | 15 | 16 | 17 | 18 | 19 | 20 |
| # sample | 2 | 1 | 2 | 1 | 3 | 1 | 7 | |||||||||||||
| # mutation | 2 | 1 | 2 | 2 | 3 | 1 | 7 | |||||||||||||
| nonsynonymous SNV | 2 | 1 | 2 | 1 | 2 | 1 | 6 | |||||||||||||
| synonymous SNV | 1 | 1 | 1 |
| cf) Tissue ID; Tissue type (1; BLCA[Bladder Urothelial Carcinoma], 2; BRCA[Breast invasive carcinoma], 3; CESC[Cervical squamous cell carcinoma and endocervical adenocarcinoma], 4; COAD[Colon adenocarcinoma], 5; GBM[Glioblastoma multiforme], 6; Glioma Low Grade, 7; HNSC[Head and Neck squamous cell carcinoma], 8; KICH[Kidney Chromophobe], 9; KIRC[Kidney renal clear cell carcinoma], 10; KIRP[Kidney renal papillary cell carcinoma], 11; LAML[Acute Myeloid Leukemia], 12; LUAD[Lung adenocarcinoma], 13; LUSC[Lung squamous cell carcinoma], 14; OV[Ovarian serous cystadenocarcinoma ], 15; PAAD[Pancreatic adenocarcinoma], 16; PRAD[Prostate adenocarcinoma], 17; SKCM[Skin Cutaneous Melanoma], 18:STAD[Stomach adenocarcinoma], 19:THCA[Thyroid carcinoma], 20:UCEC[Uterine Corpus Endometrial Carcinoma]) |
| Top |
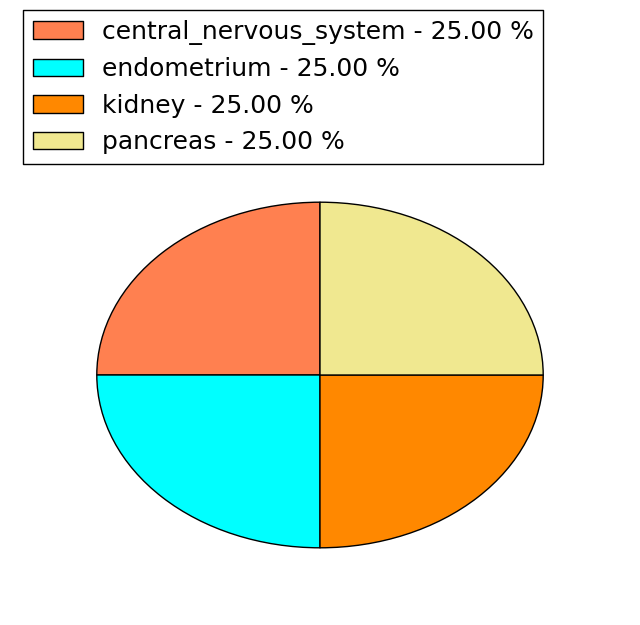
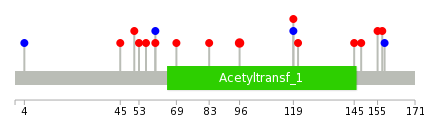
| * We represented just top 10 SNVs. When you move the cursor on each content, you can see more deailed mutation information on the Tooltip. Those are primary_site, primary_histology, mutation(aa), pubmedID. |
| Genomic Position | Mutation(aa) | Unique sampleID count |
| chrX:23803528 | p.V96M | 2 |
| chrX:23801949 | p.V56A | 1 |
| chrX:23803891 | p.P60L | 1 |
| chrX:23801955 | p.P60P | 1 |
| chrX:23803899 | p.H69R | 1 |
| chrX:23801965 | p.P83L | 1 |
| chrX:23803921 | p.R119K | 1 |
| chrX:23801977 | p.R119R | 1 |
| chrX:23803928 | p.R121H | 1 |
| chrX:23801978 | p.A145V | 1 |
| * Copy number data were extracted from TCGA using R package TCGA-Assembler. The URLs of all public data files on TCGA DCC data server were gathered on Jan-05-2015. Function ProcessCNAData in TCGA-Assembler package was used to obtain gene-level copy number value which is calculated as the average copy number of the genomic region of a gene. |
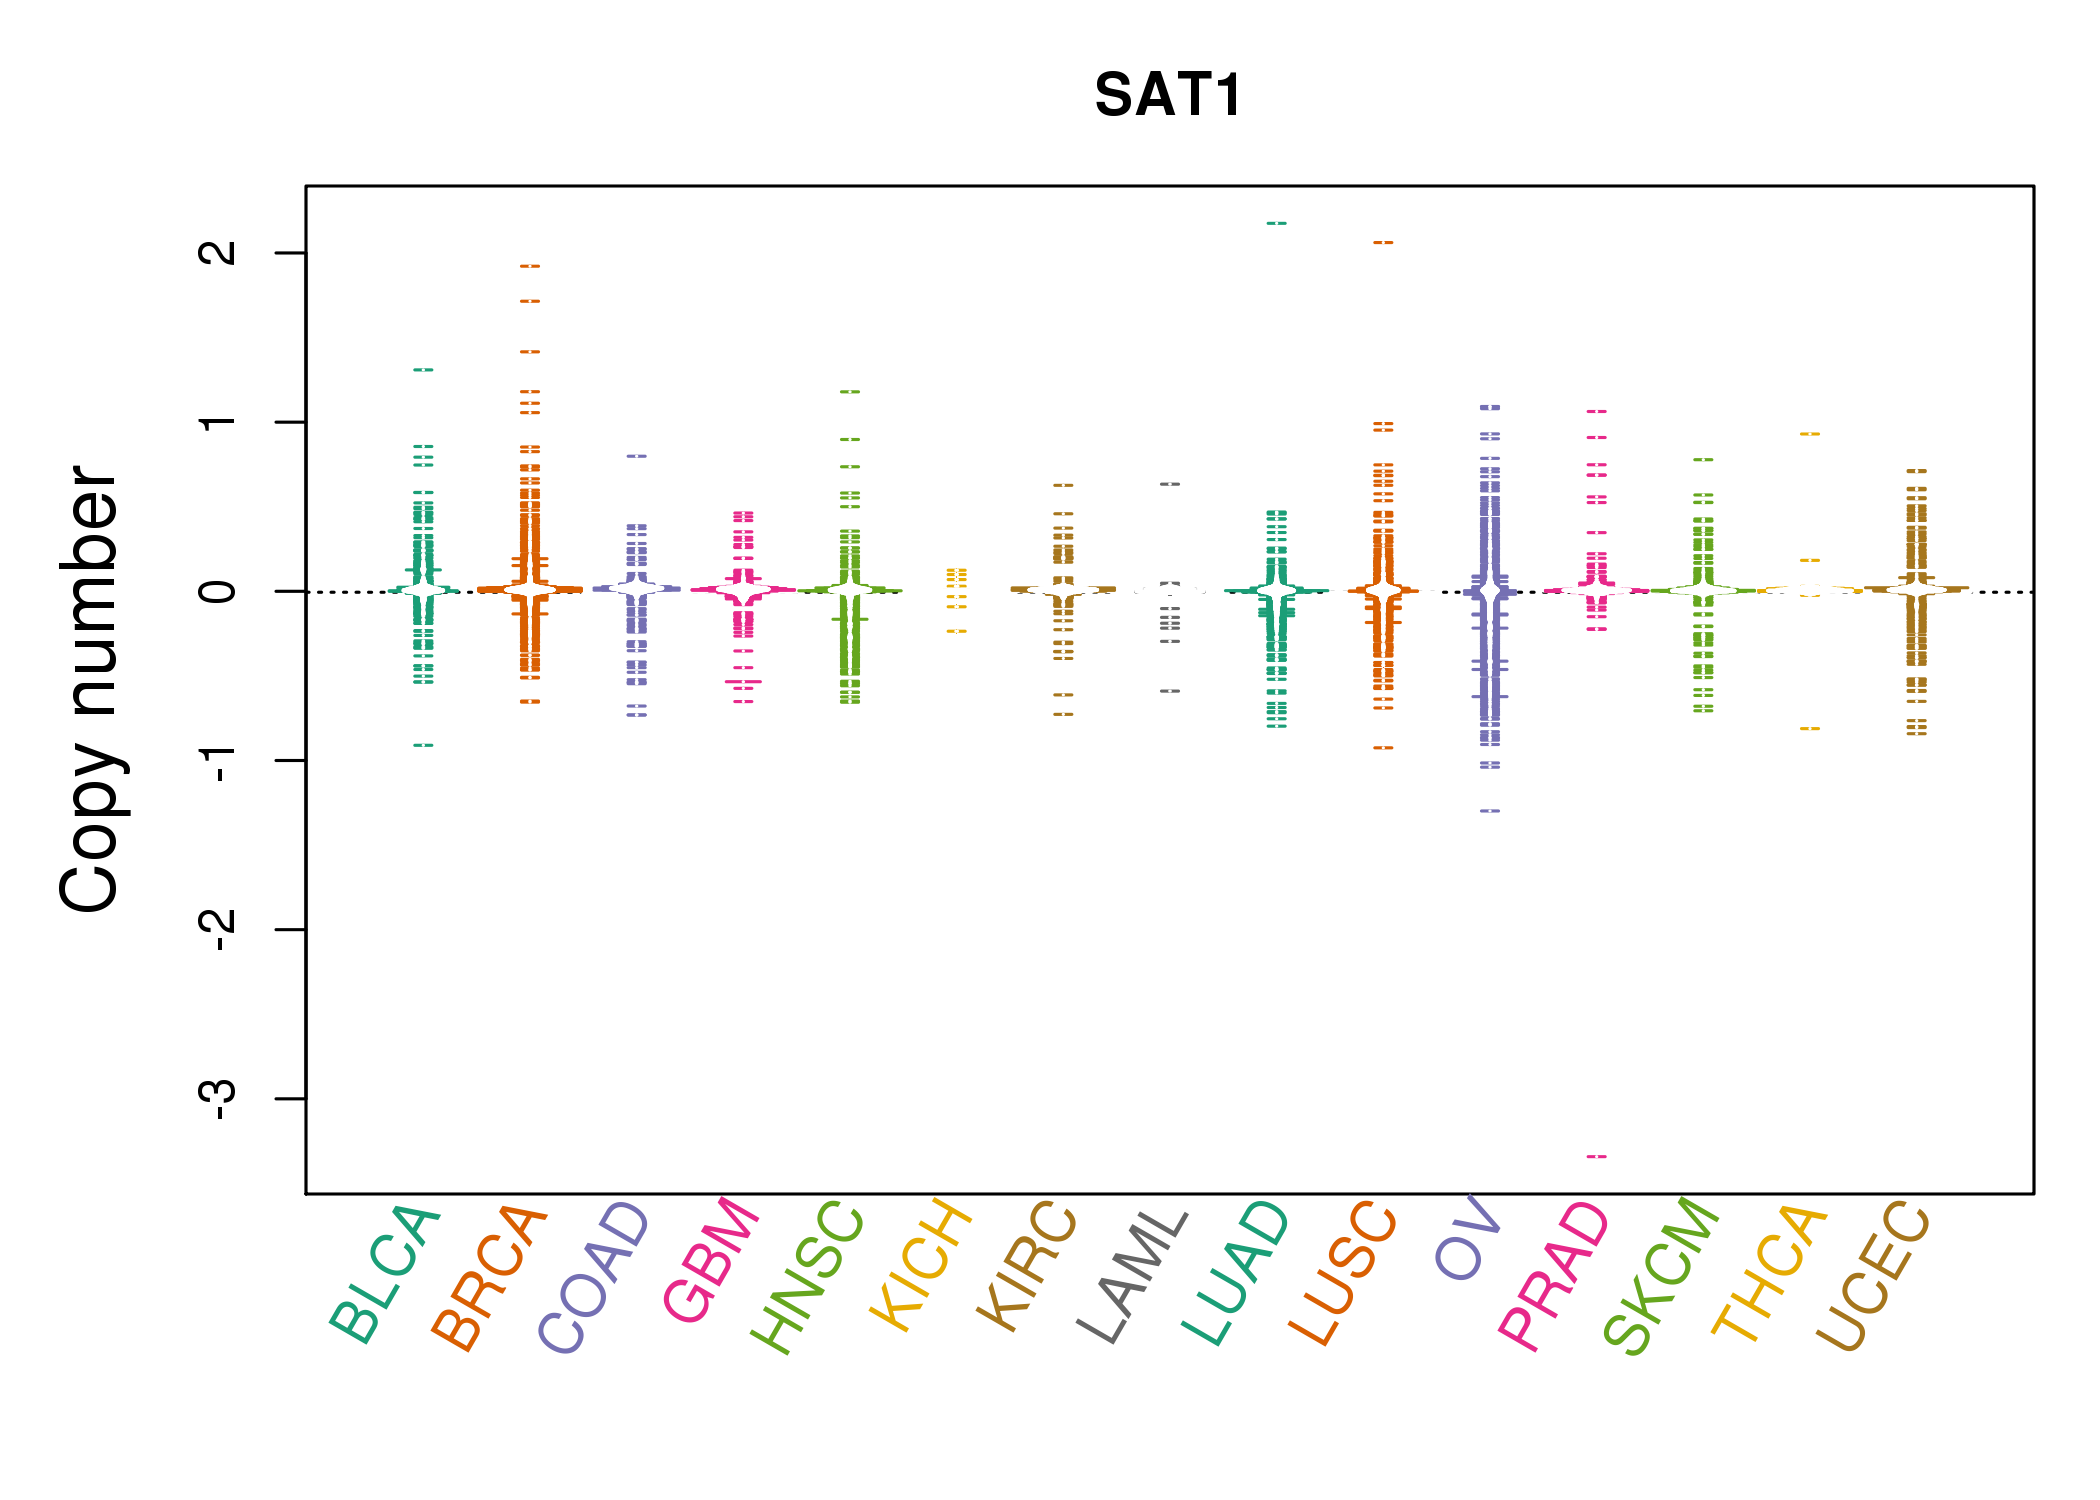 |
| cf) Tissue ID[Tissue type]: BLCA[Bladder Urothelial Carcinoma], BRCA[Breast invasive carcinoma], CESC[Cervical squamous cell carcinoma and endocervical adenocarcinoma], COAD[Colon adenocarcinoma], GBM[Glioblastoma multiforme], Glioma Low Grade, HNSC[Head and Neck squamous cell carcinoma], KICH[Kidney Chromophobe], KIRC[Kidney renal clear cell carcinoma], KIRP[Kidney renal papillary cell carcinoma], LAML[Acute Myeloid Leukemia], LUAD[Lung adenocarcinoma], LUSC[Lung squamous cell carcinoma], OV[Ovarian serous cystadenocarcinoma ], PAAD[Pancreatic adenocarcinoma], PRAD[Prostate adenocarcinoma], SKCM[Skin Cutaneous Melanoma], STAD[Stomach adenocarcinoma], THCA[Thyroid carcinoma], UCEC[Uterine Corpus Endometrial Carcinoma] |
| Top |
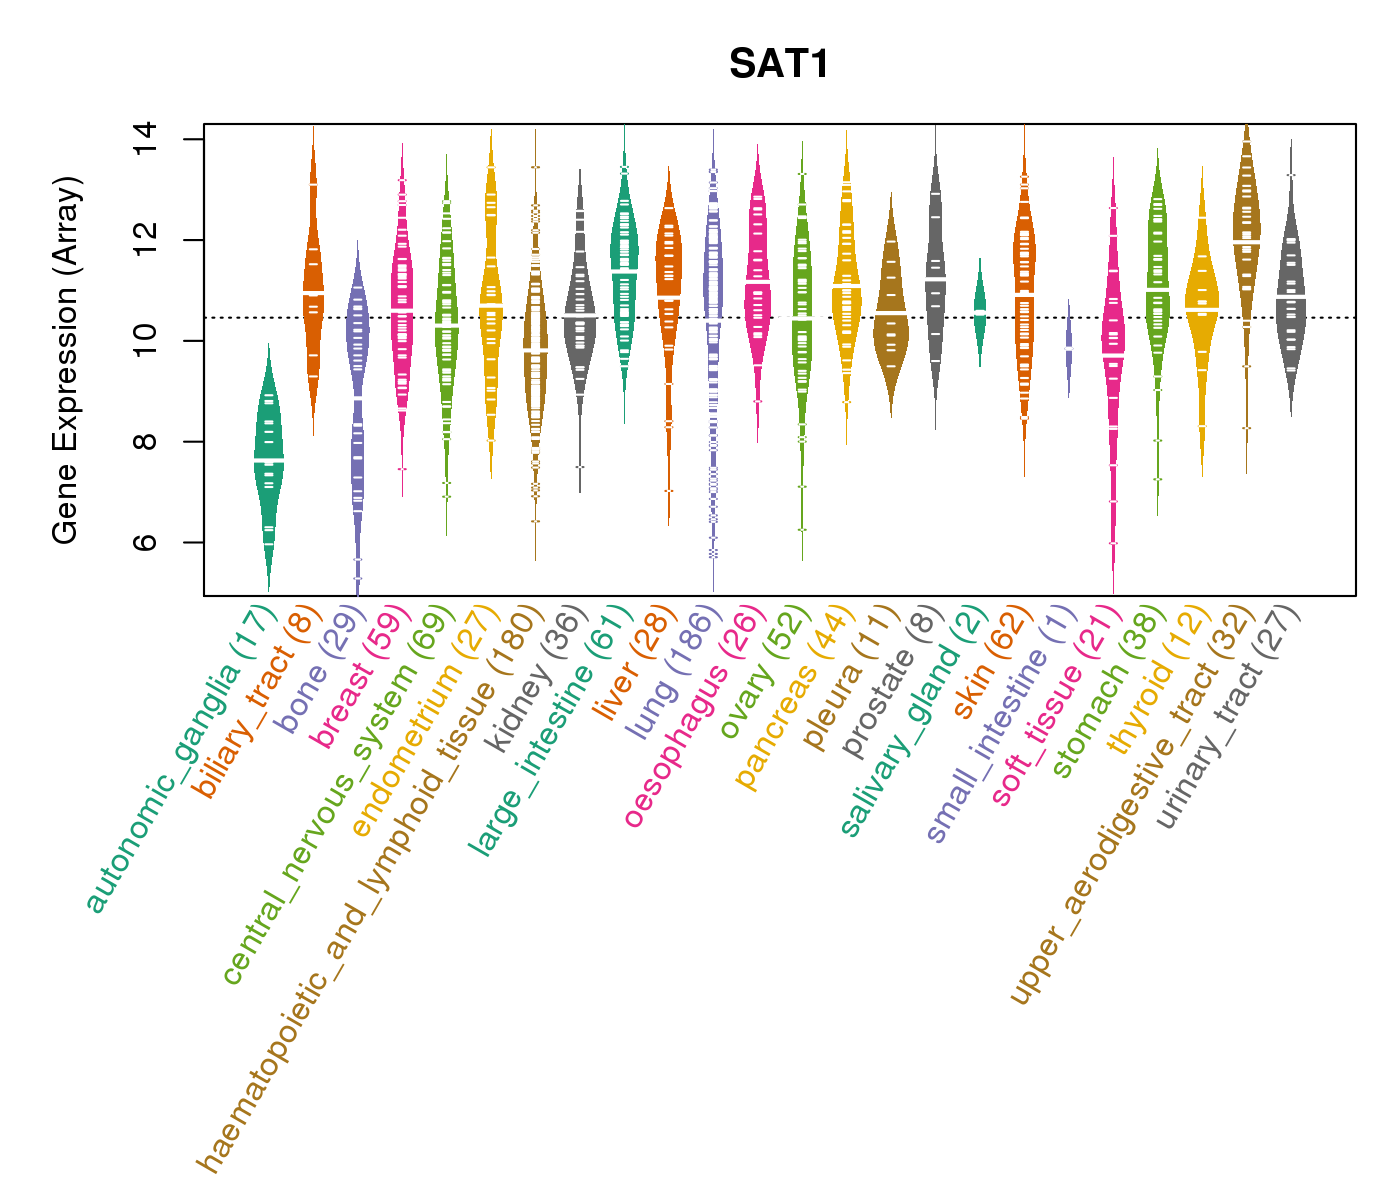
| Gene Expression for SAT1 |
| * CCLE gene expression data were extracted from CCLE_Expression_Entrez_2012-10-18.res: Gene-centric RMA-normalized mRNA expression data. |
 |
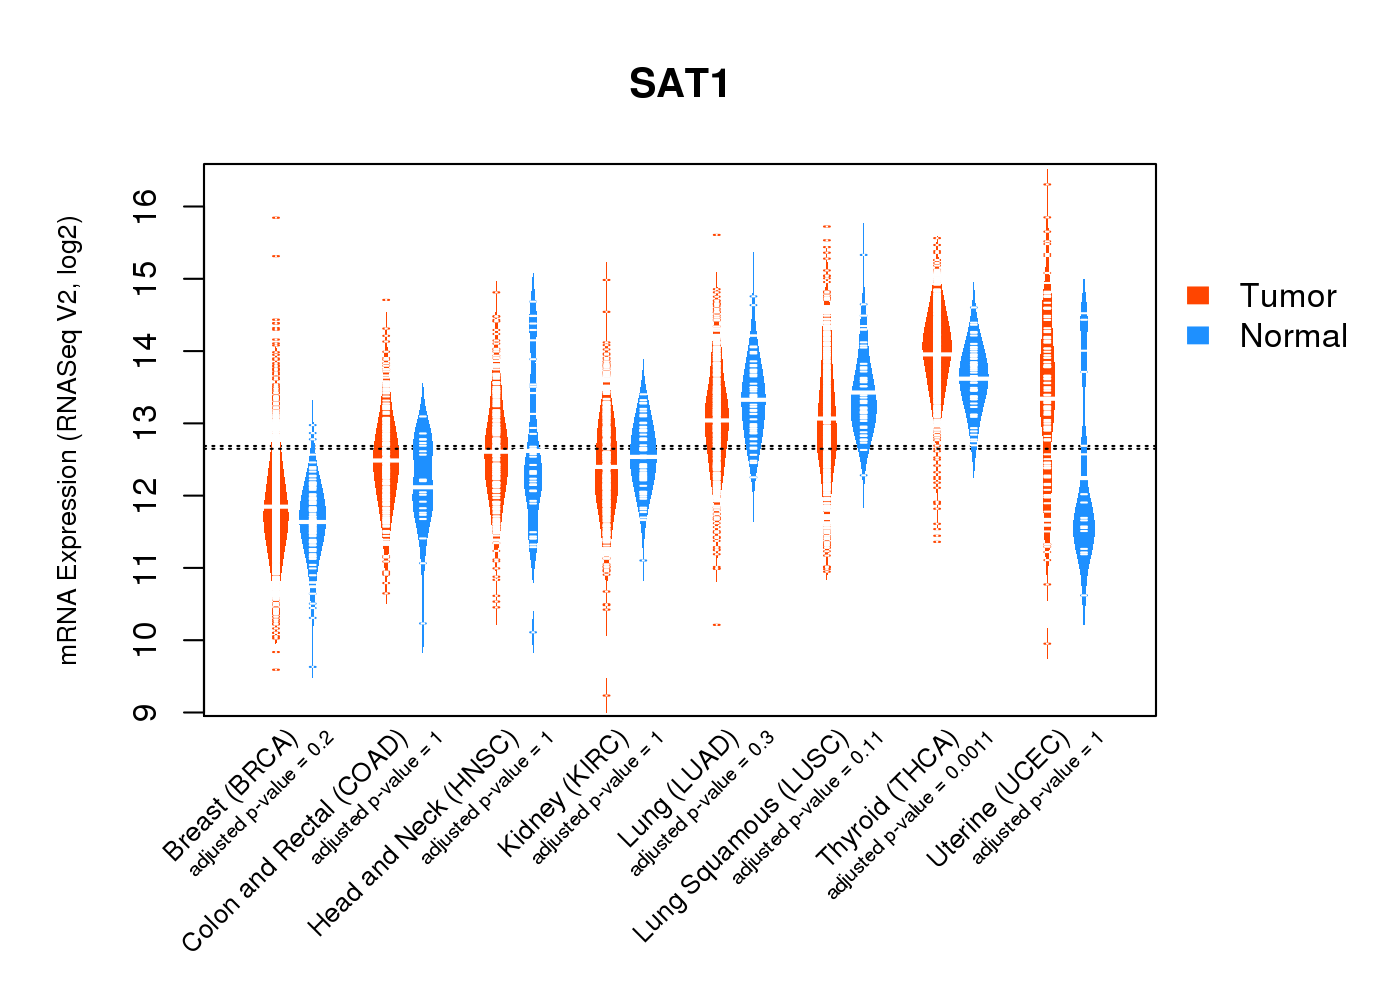
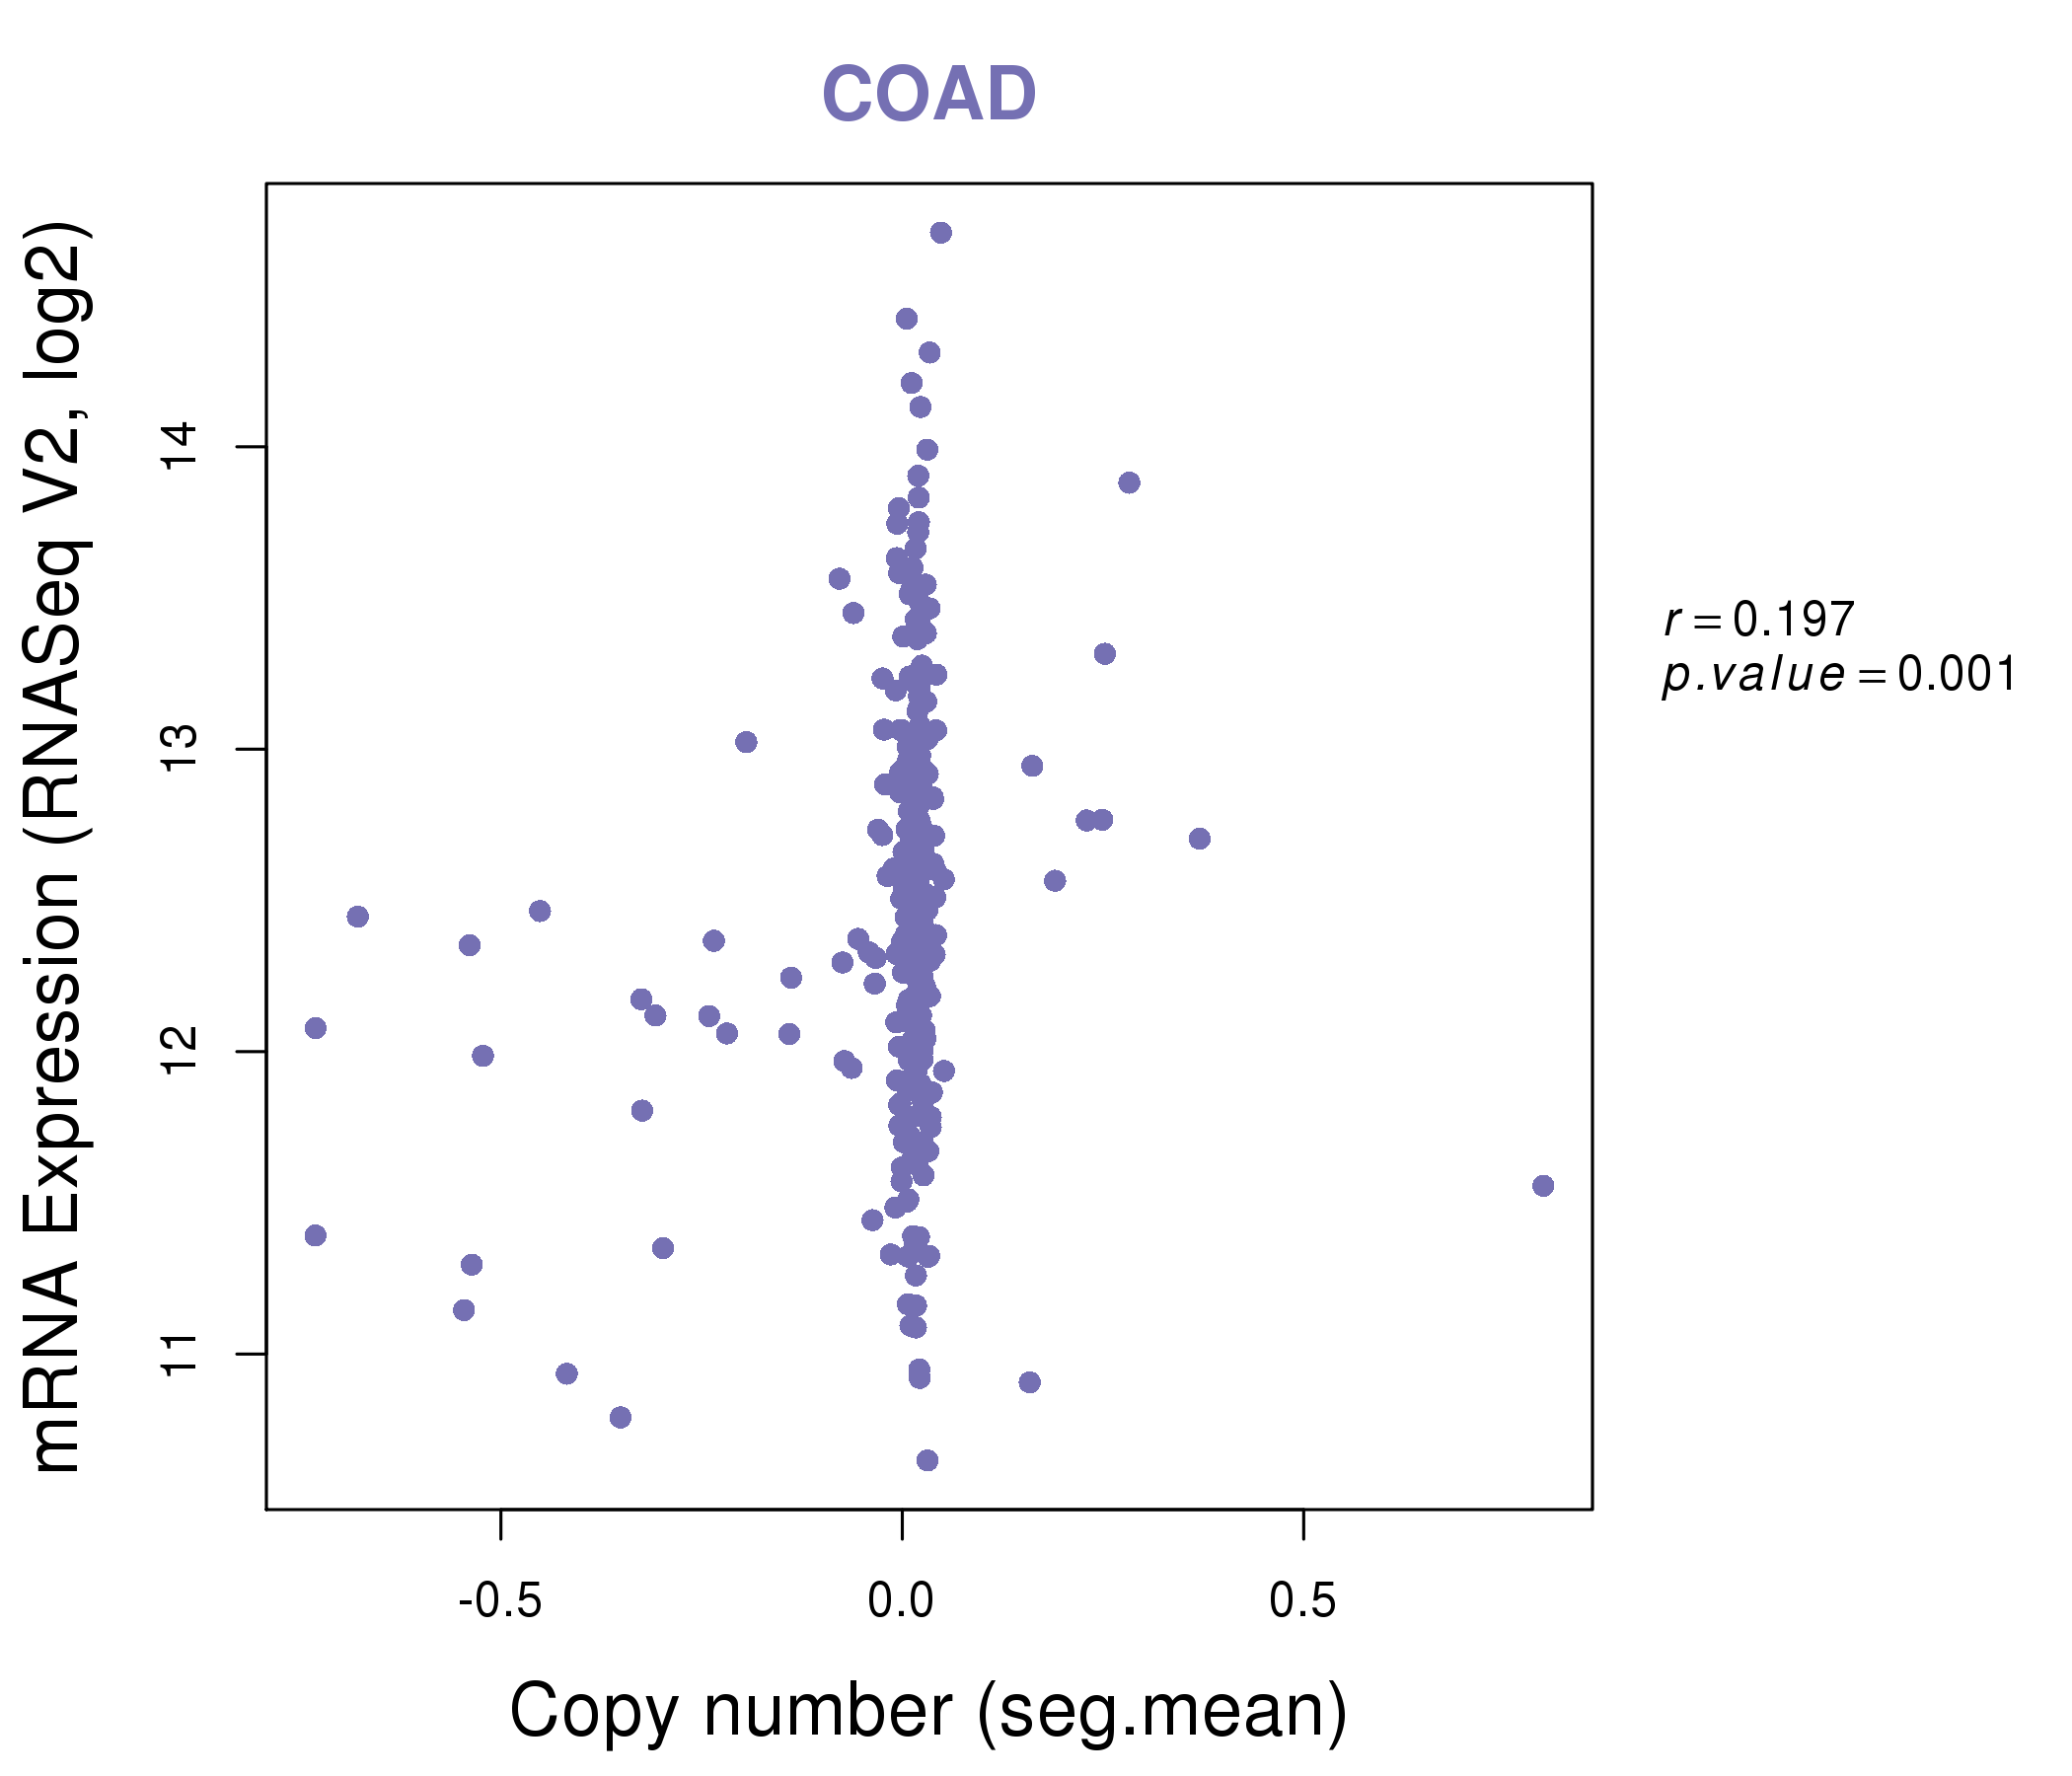
| * Normalized gene expression data of RNASeqV2 was extracted from TCGA using R package TCGA-Assembler. The URLs of all public data files on TCGA DCC data server were gathered at Jan-05-2015. Only eight cancer types have enough normal control samples for differential expression analysis. (t test, adjusted p<0.05 (using Benjamini-Hochberg FDR)) |
 |
| Top |
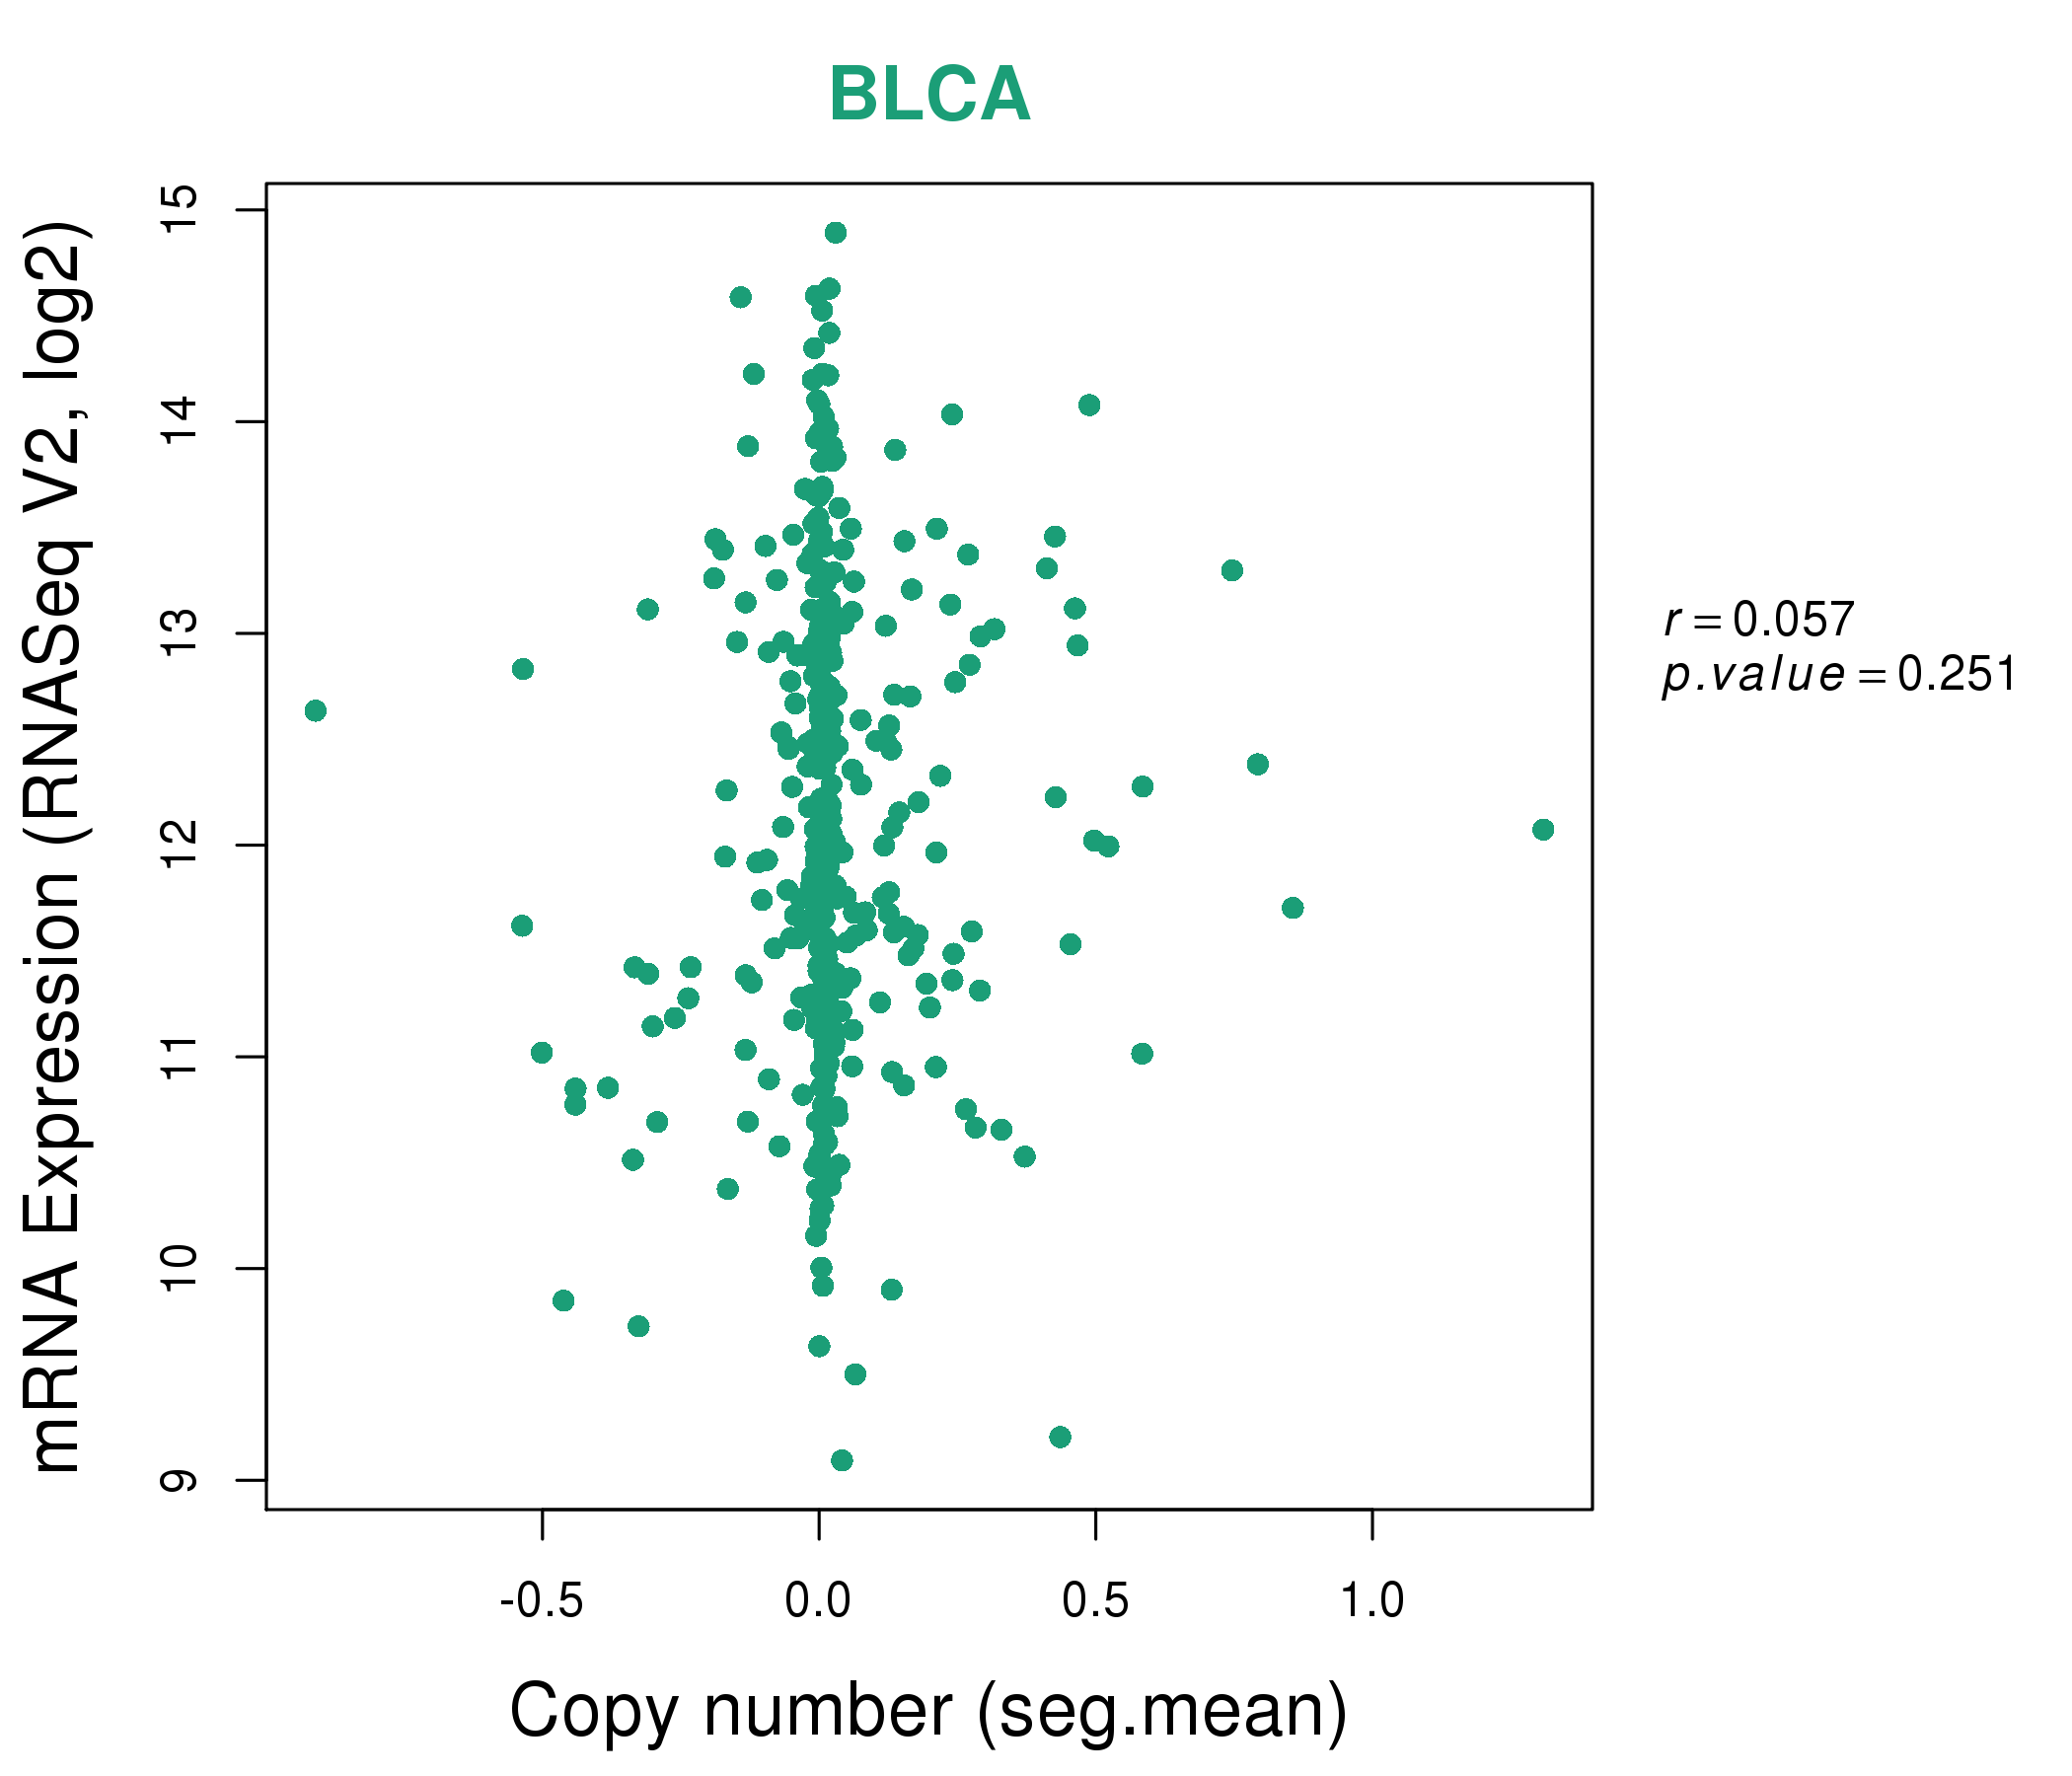
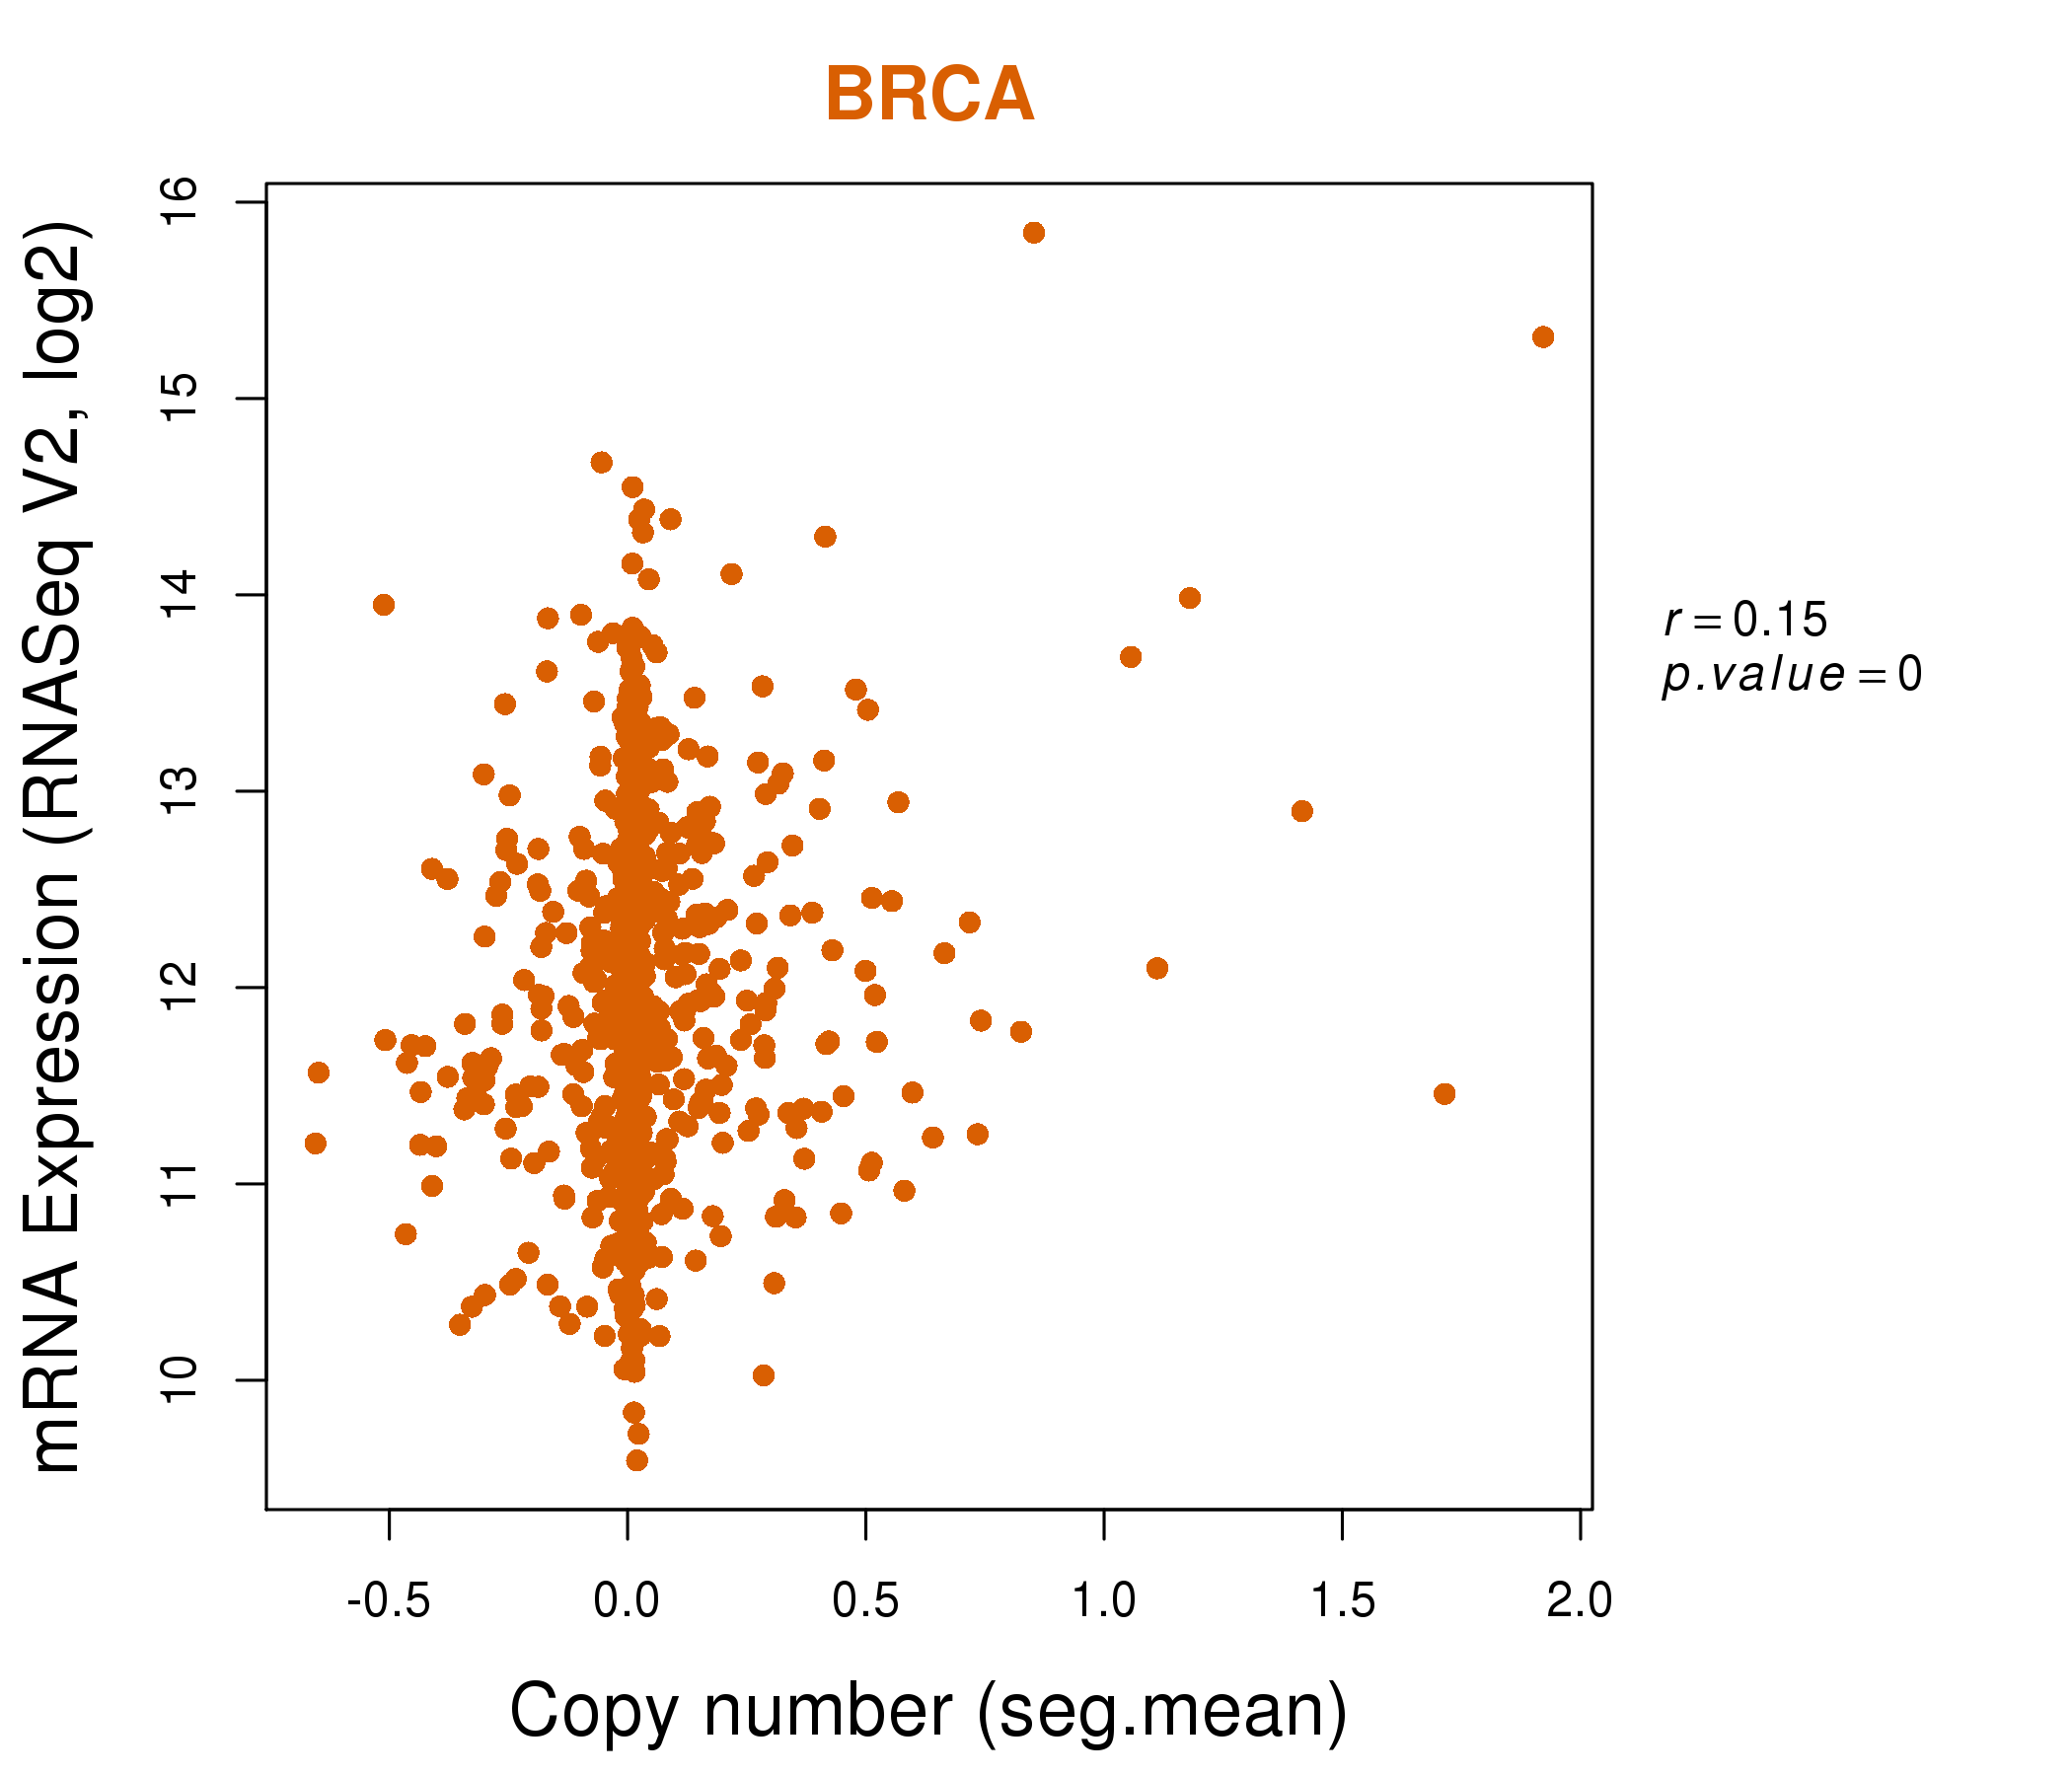
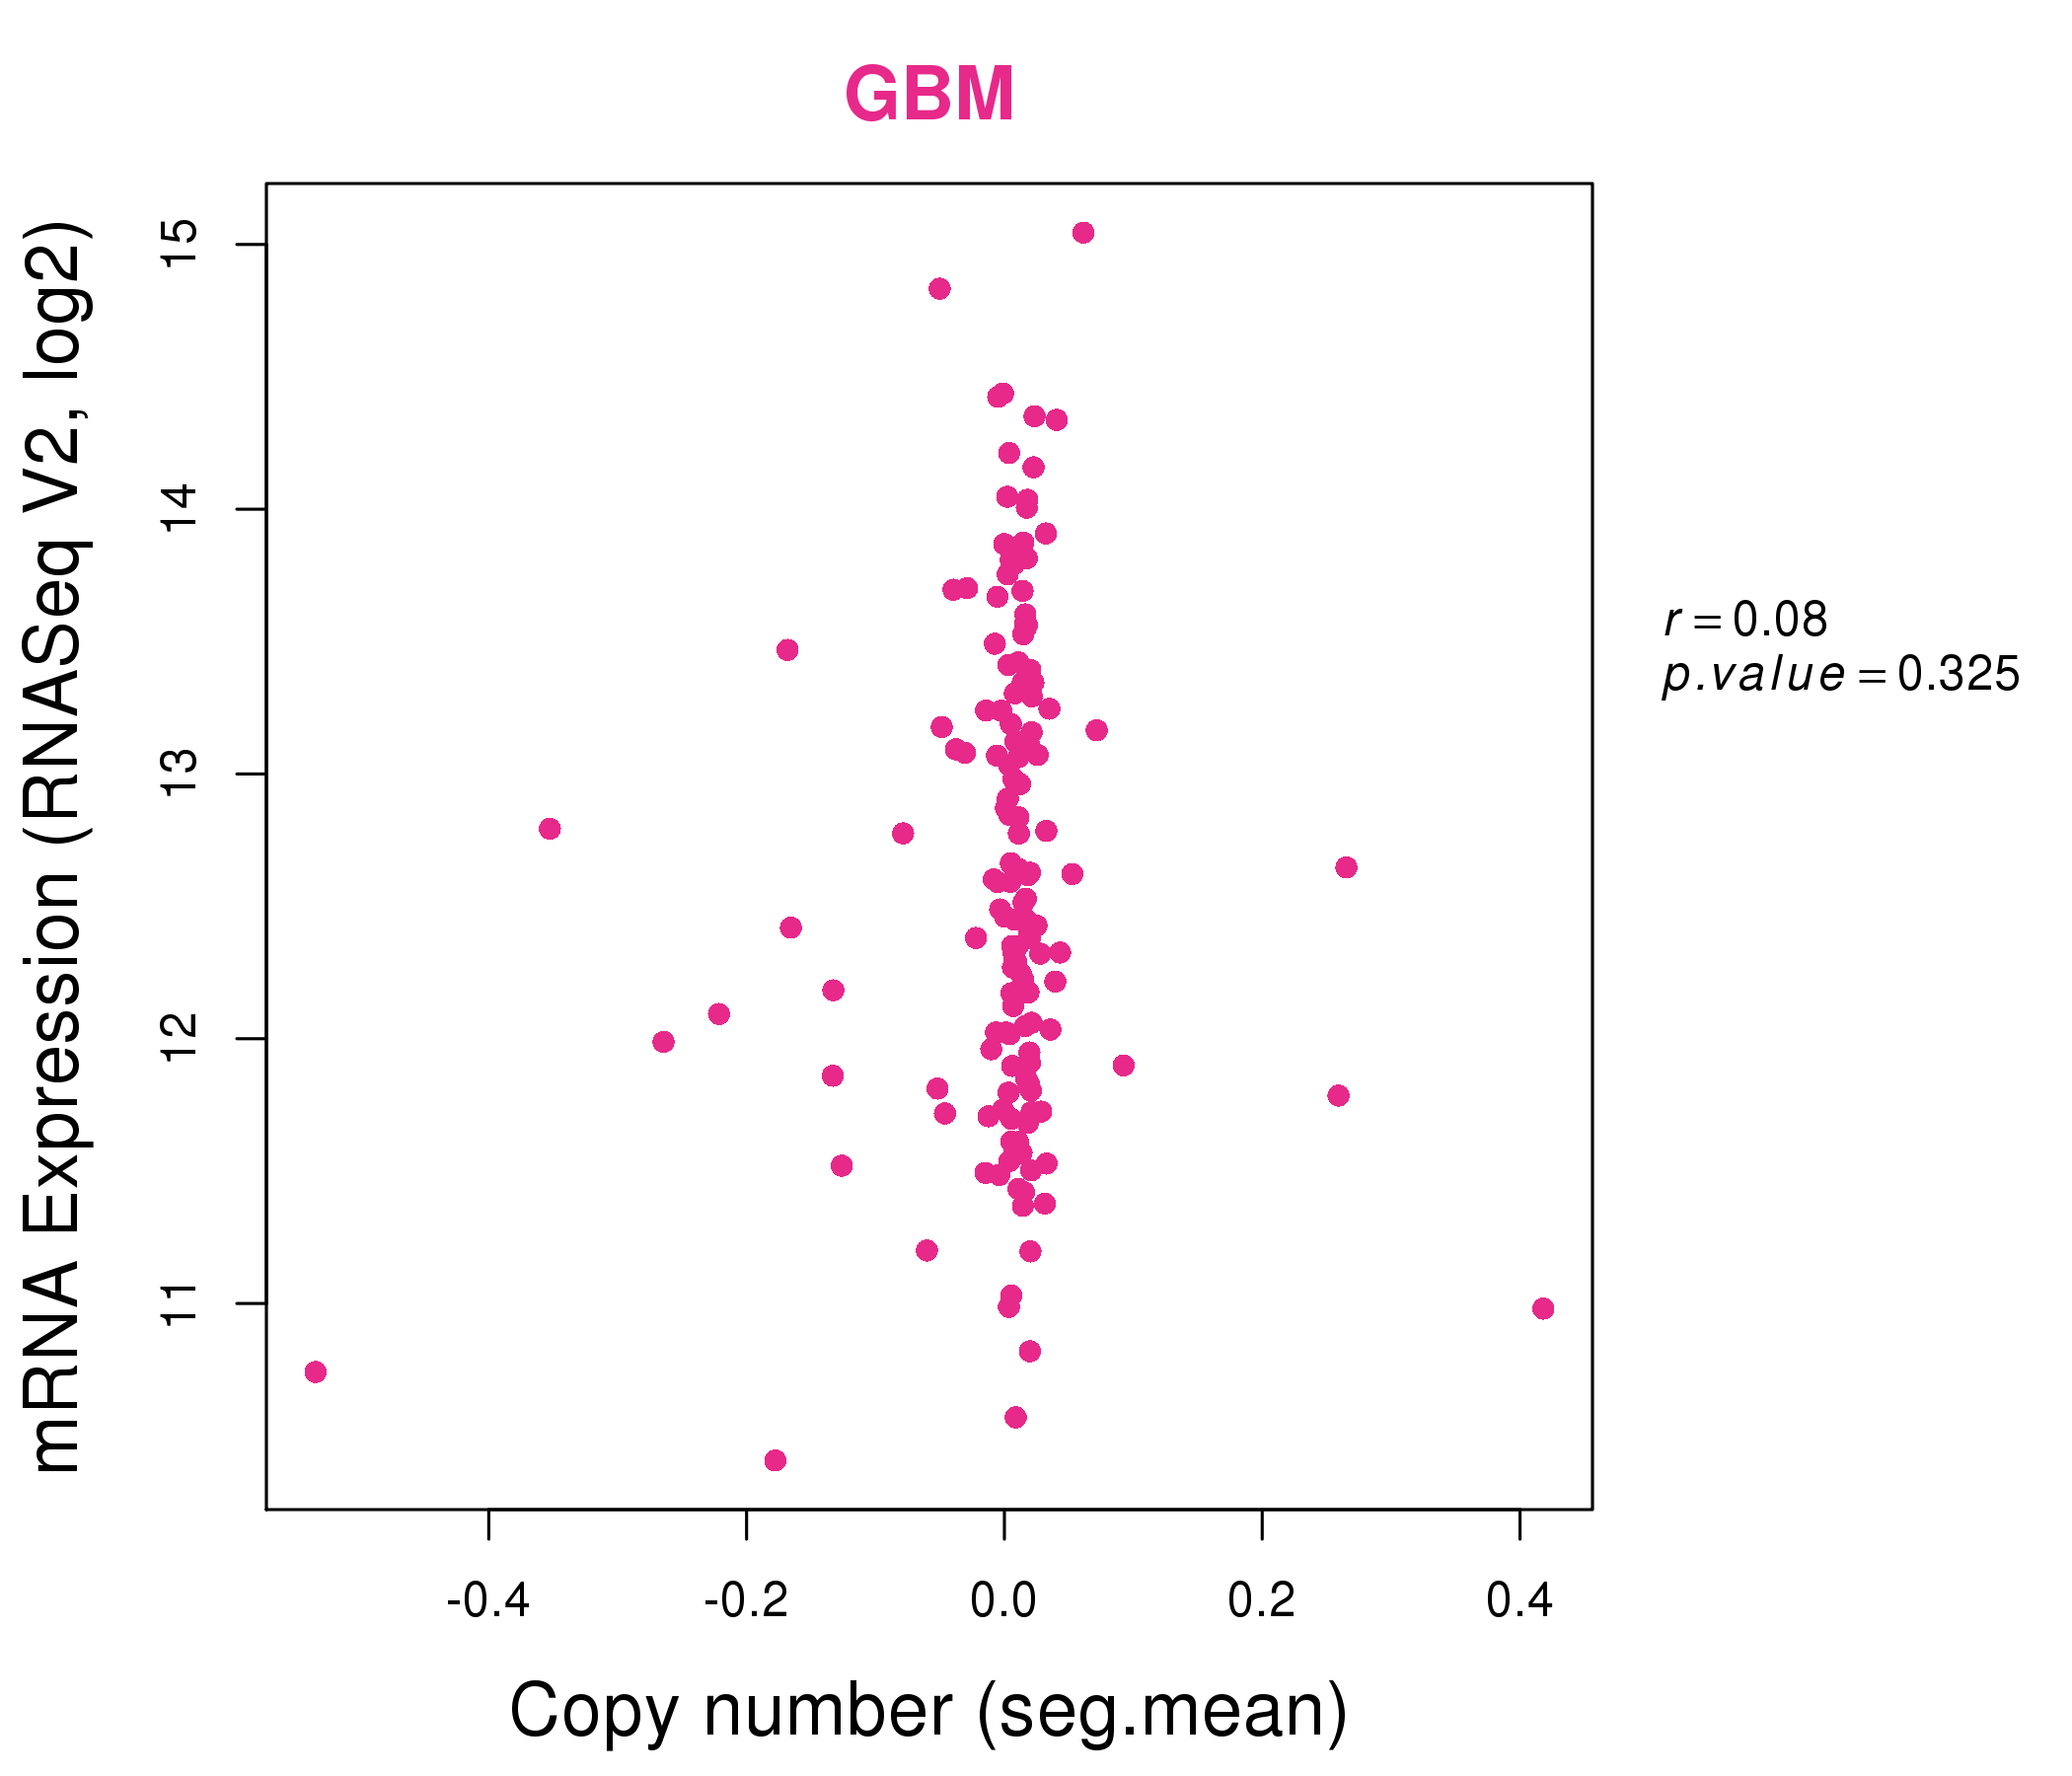
| * This plots show the correlation between CNV and gene expression. |
: Open all plots for all cancer types
 |
|
 |
|
| Top |
| Gene-Gene Network Information |
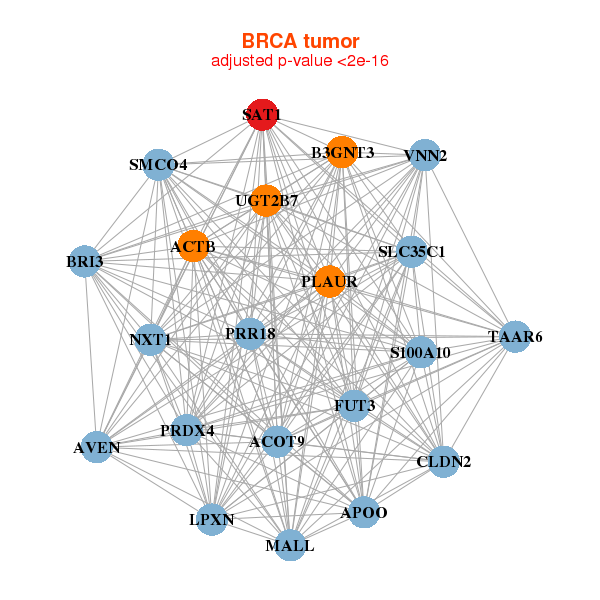
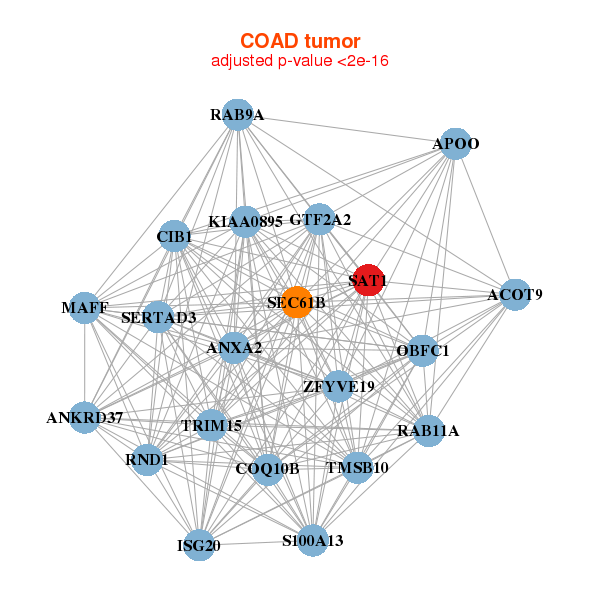
| * Co-Expression network figures were drawn using R package igraph. Only the top 20 genes with the highest correlations were shown. Red circle: input gene, orange circle: cell metabolism gene, sky circle: other gene |
: Open all plots for all cancer types
 |
|
| ACOT9,ACTB,APOO,AVEN,B3GNT3,BRI3,SMCO4, CLDN2,FUT3,LPXN,MALL,NXT1,PLAUR,PRDX4, PRR18,S100A10,SAT1,SLC35C1,TAAR6,UGT2B7,VNN2 | ADAP2,AIF1,CD86,GMFG,HCK,HLA-DMA,HLA-DMB, IRF8,LAPTM5,LILRB4,LOC541471,NPL,OSTF1,PLEK, RAB32,RAP2B,SAMSN1,SAT1,SLC11A1,SRGN,TMSB4XP8 |
 |
|
| ACOT9,ANKRD37,ANXA2,APOO,CIB1,COQ10B,GTF2A2, ISG20,KIAA0895,MAFF,OBFC1,RAB11A,RAB9A,RND1, S100A13,SAT1,SEC61B,SERTAD3,TMSB10,TRIM15,ZFYVE19 | LINC00483,NMRK1,CCNDBP1,CLRN3,DERA,DNAJC17,DNAJC22, GRAMD1C,HTATIP2,NDFIP2,NIT1,OCIAD2,PRSS3,RAB20, SAT1,SEPHS2,SLC25A20,SLC25A5,SLC35D2,TRAF4,ZFAND2B |
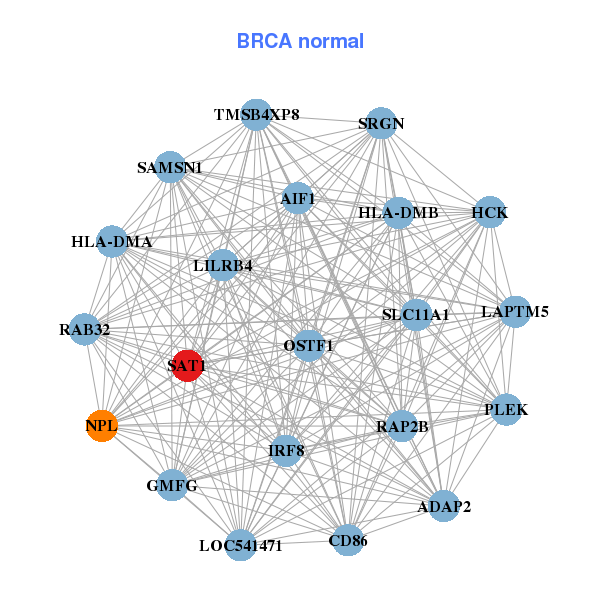
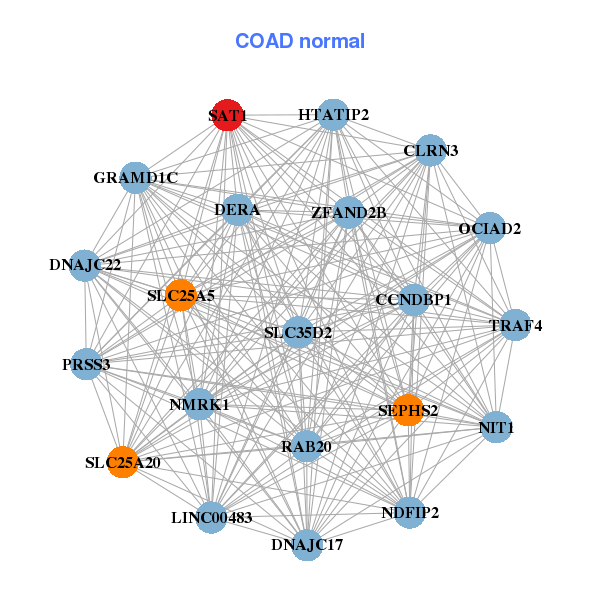
| * Co-Expression network figures were drawn using R package igraph. Only the top 20 genes with the highest correlations were shown. Red circle: input gene, orange circle: cell metabolism gene, sky circle: other gene |
: Open all plots for all cancer types
| Top |
: Open all interacting genes' information including KEGG pathway for all interacting genes from DAVID
| Top |
| Pharmacological Information for SAT1 |
| There's no related Drug. |
| Top |
| Cross referenced IDs for SAT1 |
| * We obtained these cross-references from Uniprot database. It covers 150 different DBs, 18 categories. http://www.uniprot.org/help/cross_references_section |
: Open all cross reference information
|
Copyright © 2016-Present - The Univsersity of Texas Health Science Center at Houston @ |