|
||||||||||||||||||||||||||||||||||||||||||||||||||||||||||||||||||||||||||||||||||||||||||||||||||||||||||||||||||||||||||||||||||||||||||||||||||||||||||||||||||||||||||||||||||||||||||||||||||||||||||||||||||||||||||||||||||||||||||||||||||||||||||||||||||||||||||||||||||||||||||||||||||||||||||||||||||||||||||
| |
| Phenotypic Information (metabolism pathway, cancer, disease, phenome) |
| |
| |
| Gene-Gene Network Information: Co-Expression Network, Interacting Genes & KEGG |
| |
|


| Gene Summary for SDC1 |
| Top |
| Phenotypic Information for SDC1(metabolism pathway, cancer, disease, phenome) |
| Cancer | CGAP: SDC1 |
| Familial Cancer Database: SDC1 | |
| * This gene is included in those cancer gene databases. |
|
|
|
|
|
| . | ||||||||||||||||||||||||||||||||||||||||||||||||||||||||||||||||||||||||||||||||||||||||||||||||||||||||||||||||||||||||||||||||||||||||||||||||||||||||||||||||||||||||||||||||||||||||||||||||||||||||||||||||||||||||||||||||||||||||||||||||||||||||||||||||||||||||||||||||||||||||||||||||||||||||||||||||||||
Oncogene 1 | Significant driver gene in | |||||||||||||||||||||||||||||||||||||||||||||||||||||||||||||||||||||||||||||||||||||||||||||||||||||||||||||||||||||||||||||||||||||||||||||||||||||||||||||||||||||||||||||||||||||||||||||||||||||||||||||||||||||||||||||||||||||||||||||||||||||||||||||||||||||||||||||||||||||||||||||||||||||||||||||||||||||||||
| cf) number; DB name 1 Oncogene; http://nar.oxfordjournals.org/content/35/suppl_1/D721.long, 2 Tumor Suppressor gene; https://bioinfo.uth.edu/TSGene/, 3 Cancer Gene Census; http://www.nature.com/nrc/journal/v4/n3/abs/nrc1299.html, 4 CancerGenes; http://nar.oxfordjournals.org/content/35/suppl_1/D721.long, 5 Network of Cancer Gene; http://ncg.kcl.ac.uk/index.php, 1Therapeutic Vulnerabilities in Cancer; http://cbio.mskcc.org/cancergenomics/statius/ |
| REACTOME_METABOLISM_OF_LIPIDS_AND_LIPOPROTEINS REACTOME_METABOLISM_OF_CARBOHYDRATES REACTOME_LIPOPROTEIN_METABOLISM | |
| OMIM | |
| Orphanet | |
| Disease | KEGG Disease: SDC1 |
| MedGen: SDC1 (Human Medical Genetics with Condition) | |
| ClinVar: SDC1 | |
| Phenotype | MGI: SDC1 (International Mouse Phenotyping Consortium) |
| PhenomicDB: SDC1 | |
| Mutations for SDC1 |
| * Under tables are showing count per each tissue to give us broad intuition about tissue specific mutation patterns.You can go to the detailed page for each mutation database's web site. |
| - Statistics for Tissue and Mutation type | Top |
 |
| - For Inter-chromosomal Variations |
| There's no inter-chromosomal structural variation. |
| - For Intra-chromosomal Variations |
| * Intra-chromosomal variantions includes 'intrachromosomal amplicon to amplicon', 'intrachromosomal amplicon to non-amplified dna', 'intrachromosomal deletion', 'intrachromosomal fold-back inversion', 'intrachromosomal inversion', 'intrachromosomal tandem duplication', 'Intrachromosomal unknown type', 'intrachromosomal with inverted orientation', 'intrachromosomal with non-inverted orientation'. |
 |
| Sample | Symbol_a | Chr_a | Start_a | End_a | Symbol_b | Chr_b | Start_b | End_b |
| pancreas | SDC1 | chr2 | 20405804 | 20405824 | SDC1 | chr2 | 20405916 | 20405936 |
| cf) Tissue number; Tissue name (1;Breast, 2;Central_nervous_system, 3;Haematopoietic_and_lymphoid_tissue, 4;Large_intestine, 5;Liver, 6;Lung, 7;Ovary, 8;Pancreas, 9;Prostate, 10;Skin, 11;Soft_tissue, 12;Upper_aerodigestive_tract) |
| * From mRNA Sanger sequences, Chitars2.0 arranged chimeric transcripts. This table shows SDC1 related fusion information. |
| ID | Head Gene | Tail Gene | Accession | Gene_a | qStart_a | qEnd_a | Chromosome_a | tStart_a | tEnd_a | Gene_a | qStart_a | qEnd_a | Chromosome_a | tStart_a | tEnd_a |
| BI055855 | TRIM29 | 10 | 229 | 11 | 119986046 | 119991324 | SDC1 | 217 | 319 | 2 | 20403811 | 20403913 | |
| BG002190 | ERVV-2 | 26 | 597 | 19 | 53552336 | 53552907 | SDC1 | 590 | 732 | 2 | 20417153 | 20417299 | |
| BE185151 | SDC1 | 12 | 180 | 2 | 20401901 | 20402069 | PROS1 | 176 | 433 | 3 | 93628822 | 93629079 | |
| AA368147 | SDC1 | 1 | 61 | 2 | 20401748 | 20401808 | PRRC2B | 60 | 256 | 9 | 134374752 | 134374948 | |
| Top |
| Mutation type/ Tissue ID | brca | cns | cerv | endome | haematopo | kidn | Lintest | liver | lung | ns | ovary | pancre | prost | skin | stoma | thyro | urina | |||
| Total # sample | 1 | 1 | ||||||||||||||||||
| GAIN (# sample) | 1 | 1 | ||||||||||||||||||
| LOSS (# sample) |
| cf) Tissue ID; Tissue type (1; Breast, 2; Central_nervous_system, 3; Cervix, 4; Endometrium, 5; Haematopoietic_and_lymphoid_tissue, 6; Kidney, 7; Large_intestine, 8; Liver, 9; Lung, 10; NS, 11; Ovary, 12; Pancreas, 13; Prostate, 14; Skin, 15; Stomach, 16; Thyroid, 17; Urinary_tract) |
| Top |
|
 |
| Top |
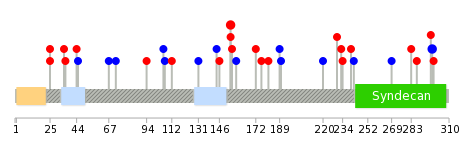
| Stat. for Non-Synonymous SNVs (# total SNVs=23) | (# total SNVs=11) |
 |  |
(# total SNVs=0) | (# total SNVs=1) |
 |
| Top |
| * When you move the cursor on each content, you can see more deailed mutation information on the Tooltip. Those are primary_site,primary_histology,mutation(aa),pubmedID. |
| GRCh37 position | Mutation(aa) | Unique sampleID count |
| chr2:20403822-20403822 | p.E127K | 3 |
| chr2:20403949-20403949 | p.E84E | 2 |
| chr2:20403831-20403831 | p.R124* | 2 |
| chr2:20403674-20403674 | p.H176R | 2 |
| chr2:20403740-20403740 | p.H154R | 2 |
| chr2:20402566-20402566 | p.A298A | 2 |
| chr2:20402587-20402587 | p.P291P | 1 |
| chr2:20405178-20405178 | p.V25A | 1 |
| chr2:20402978-20402978 | p.F211L | 1 |
| chr2:20403769-20403769 | p.T144T | 1 |
| Top |
|
 |
| Point Mutation/ Tissue ID | 1 | 2 | 3 | 4 | 5 | 6 | 7 | 8 | 9 | 10 | 11 | 12 | 13 | 14 | 15 | 16 | 17 | 18 | 19 | 20 |
| # sample | 2 | 7 | 1 | 1 | 3 | 5 | 2 | 5 | 4 | 4 | 1 | |||||||||
| # mutation | 2 | 6 | 1 | 1 | 3 | 6 | 3 | 5 | 4 | 4 | 1 | |||||||||
| nonsynonymous SNV | 1 | 5 | 1 | 1 | 5 | 5 | 1 | 1 | 1 | |||||||||||
| synonymous SNV | 1 | 1 | 3 | 1 | 3 | 3 | 3 |
| cf) Tissue ID; Tissue type (1; BLCA[Bladder Urothelial Carcinoma], 2; BRCA[Breast invasive carcinoma], 3; CESC[Cervical squamous cell carcinoma and endocervical adenocarcinoma], 4; COAD[Colon adenocarcinoma], 5; GBM[Glioblastoma multiforme], 6; Glioma Low Grade, 7; HNSC[Head and Neck squamous cell carcinoma], 8; KICH[Kidney Chromophobe], 9; KIRC[Kidney renal clear cell carcinoma], 10; KIRP[Kidney renal papillary cell carcinoma], 11; LAML[Acute Myeloid Leukemia], 12; LUAD[Lung adenocarcinoma], 13; LUSC[Lung squamous cell carcinoma], 14; OV[Ovarian serous cystadenocarcinoma ], 15; PAAD[Pancreatic adenocarcinoma], 16; PRAD[Prostate adenocarcinoma], 17; SKCM[Skin Cutaneous Melanoma], 18:STAD[Stomach adenocarcinoma], 19:THCA[Thyroid carcinoma], 20:UCEC[Uterine Corpus Endometrial Carcinoma]) |
| Top |
| * We represented just top 10 SNVs. When you move the cursor on each content, you can see more deailed mutation information on the Tooltip. Those are primary_site, primary_histology, mutation(aa), pubmedID. |
| Genomic Position | Mutation(aa) | Unique sampleID count |
| chr2:20403740 | p.H154R,SDC1 | 2 |
| chr2:20402566 | p.A298A,SDC1 | 2 |
| chr2:20405178 | p.V25L,SDC1 | 1 |
| chr2:20402571 | p.S287Y,SDC1 | 1 |
| chr2:20403634 | p.E283K,SDC1 | 1 |
| chr2:20403867 | p.H154Y,SDC1 | 1 |
| chr2:20405179 | p.C269C,SDC1 | 1 |
| chr2:20402600 | p.Q146H,SDC1 | 1 |
| chr2:20403660 | p.T144T,SDC1 | 1 |
| chr2:20403882 | p.A242A,SDC1 | 1 |
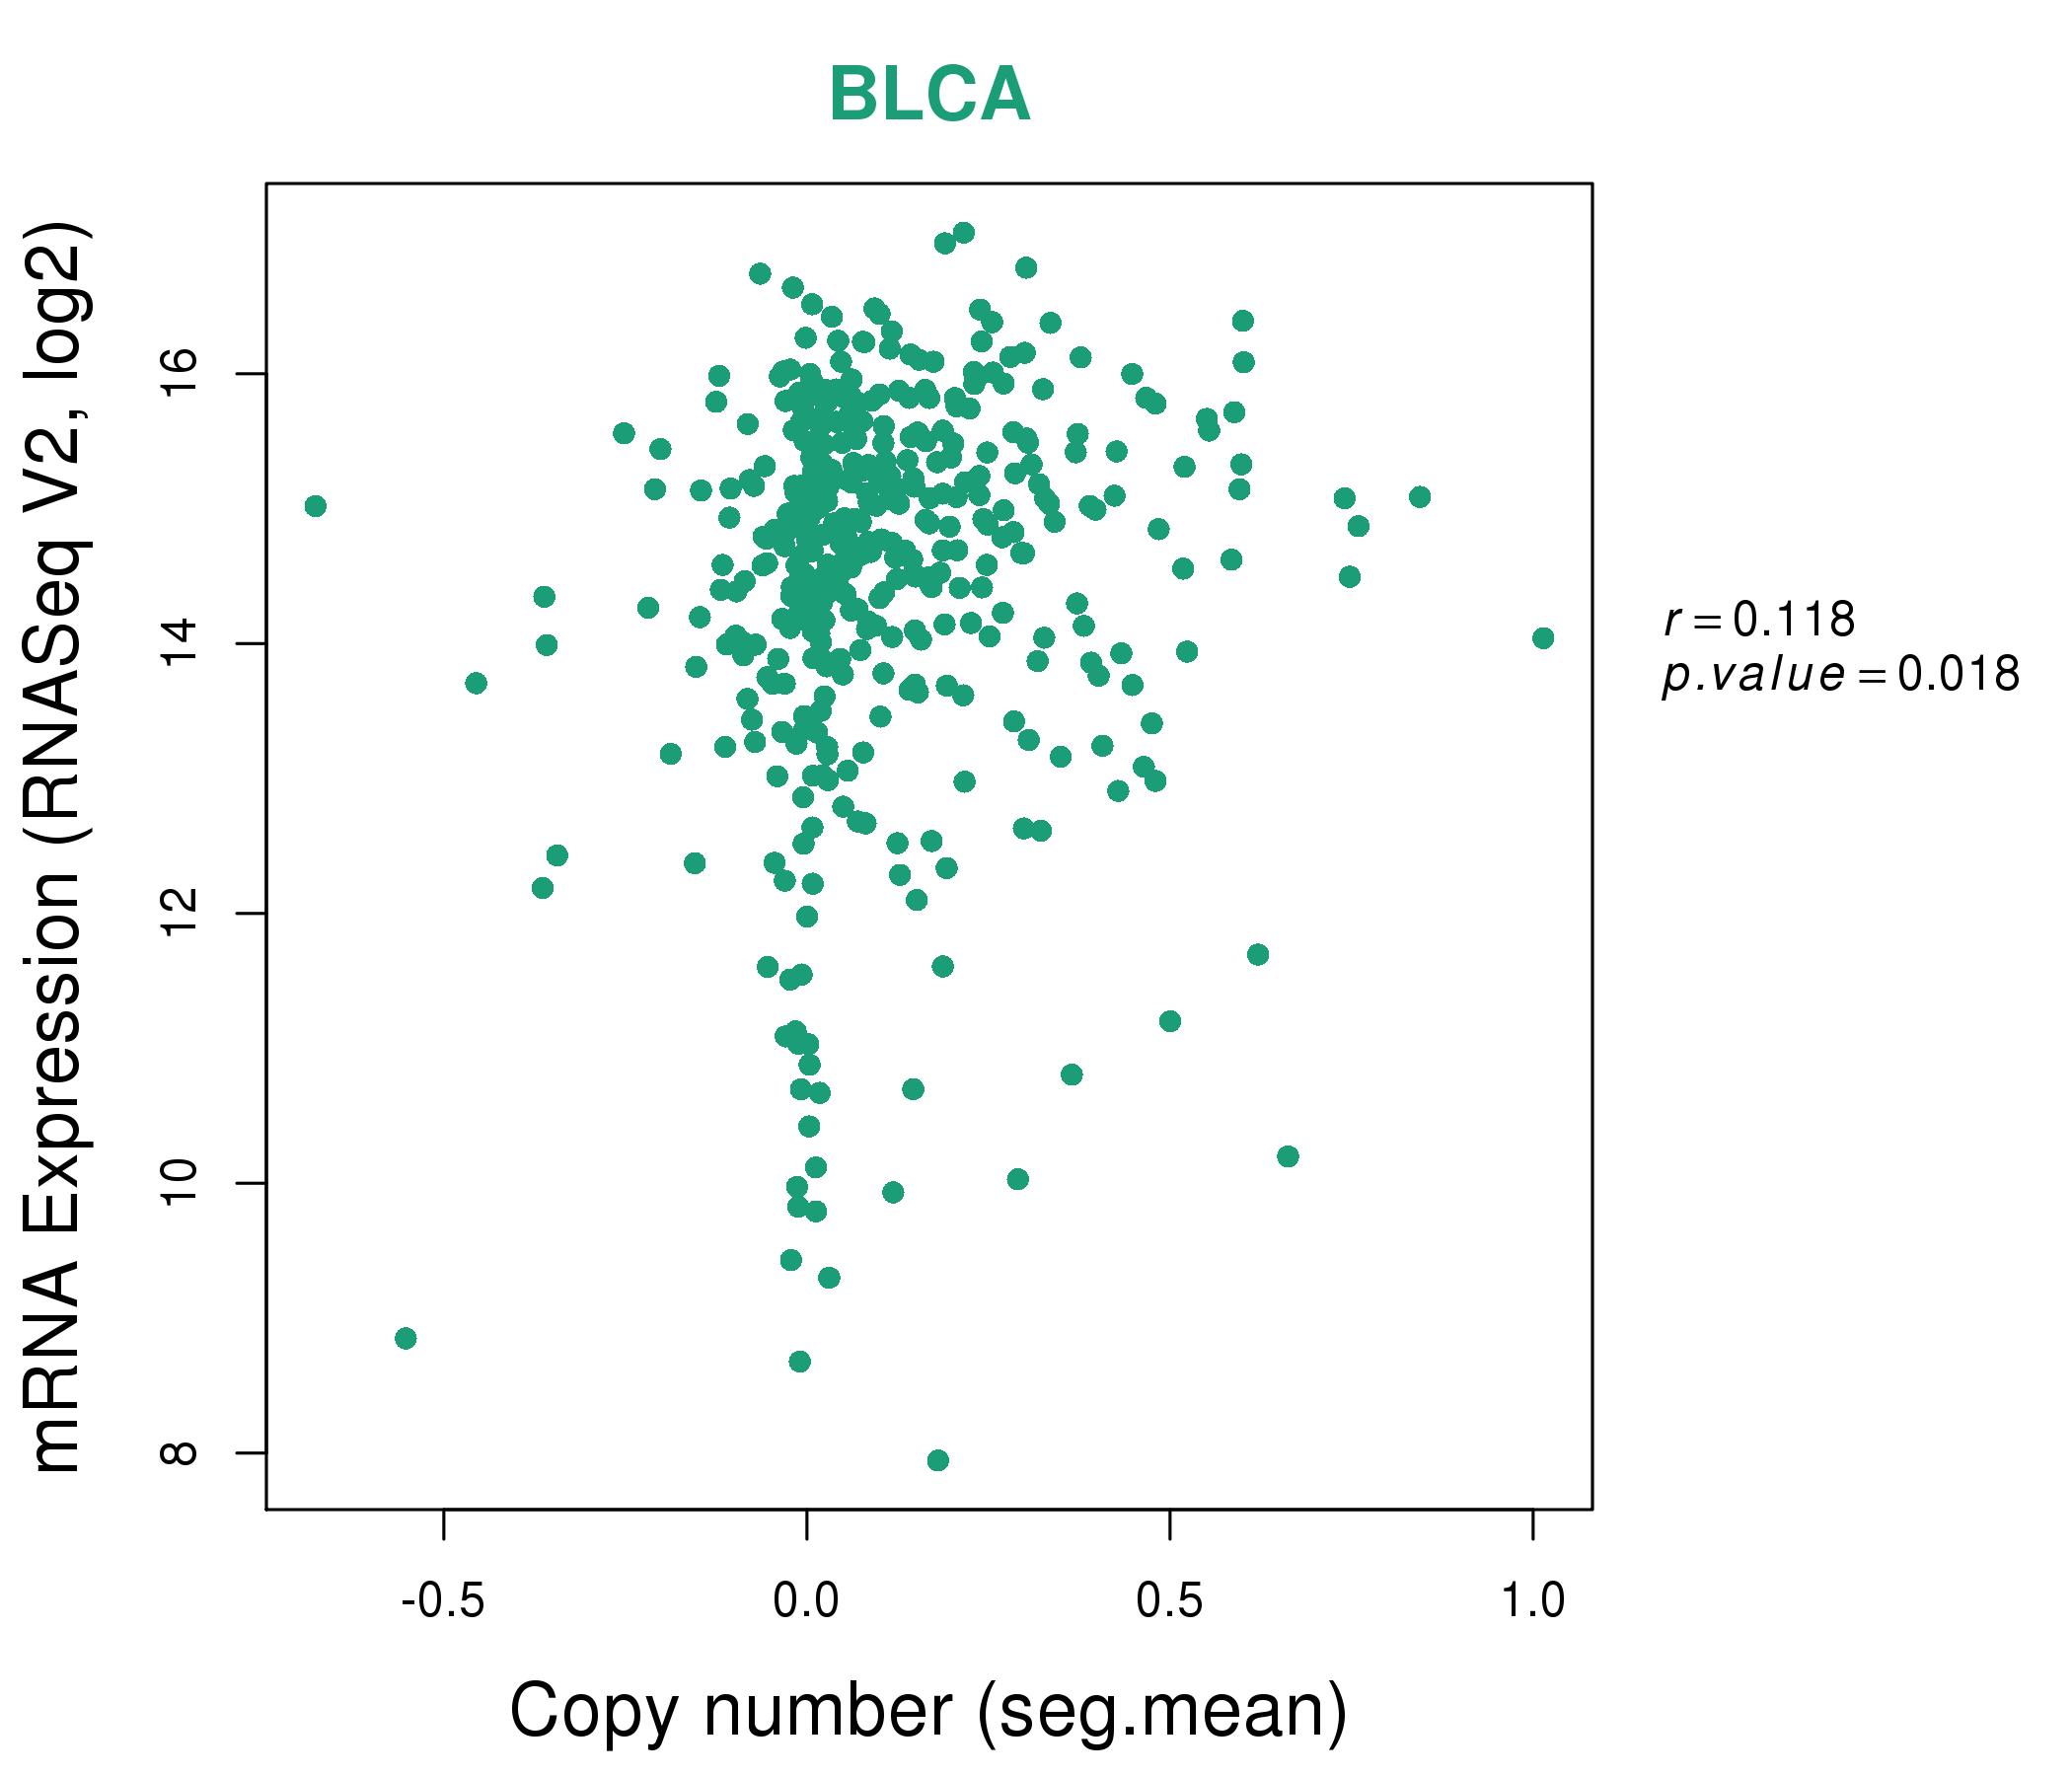
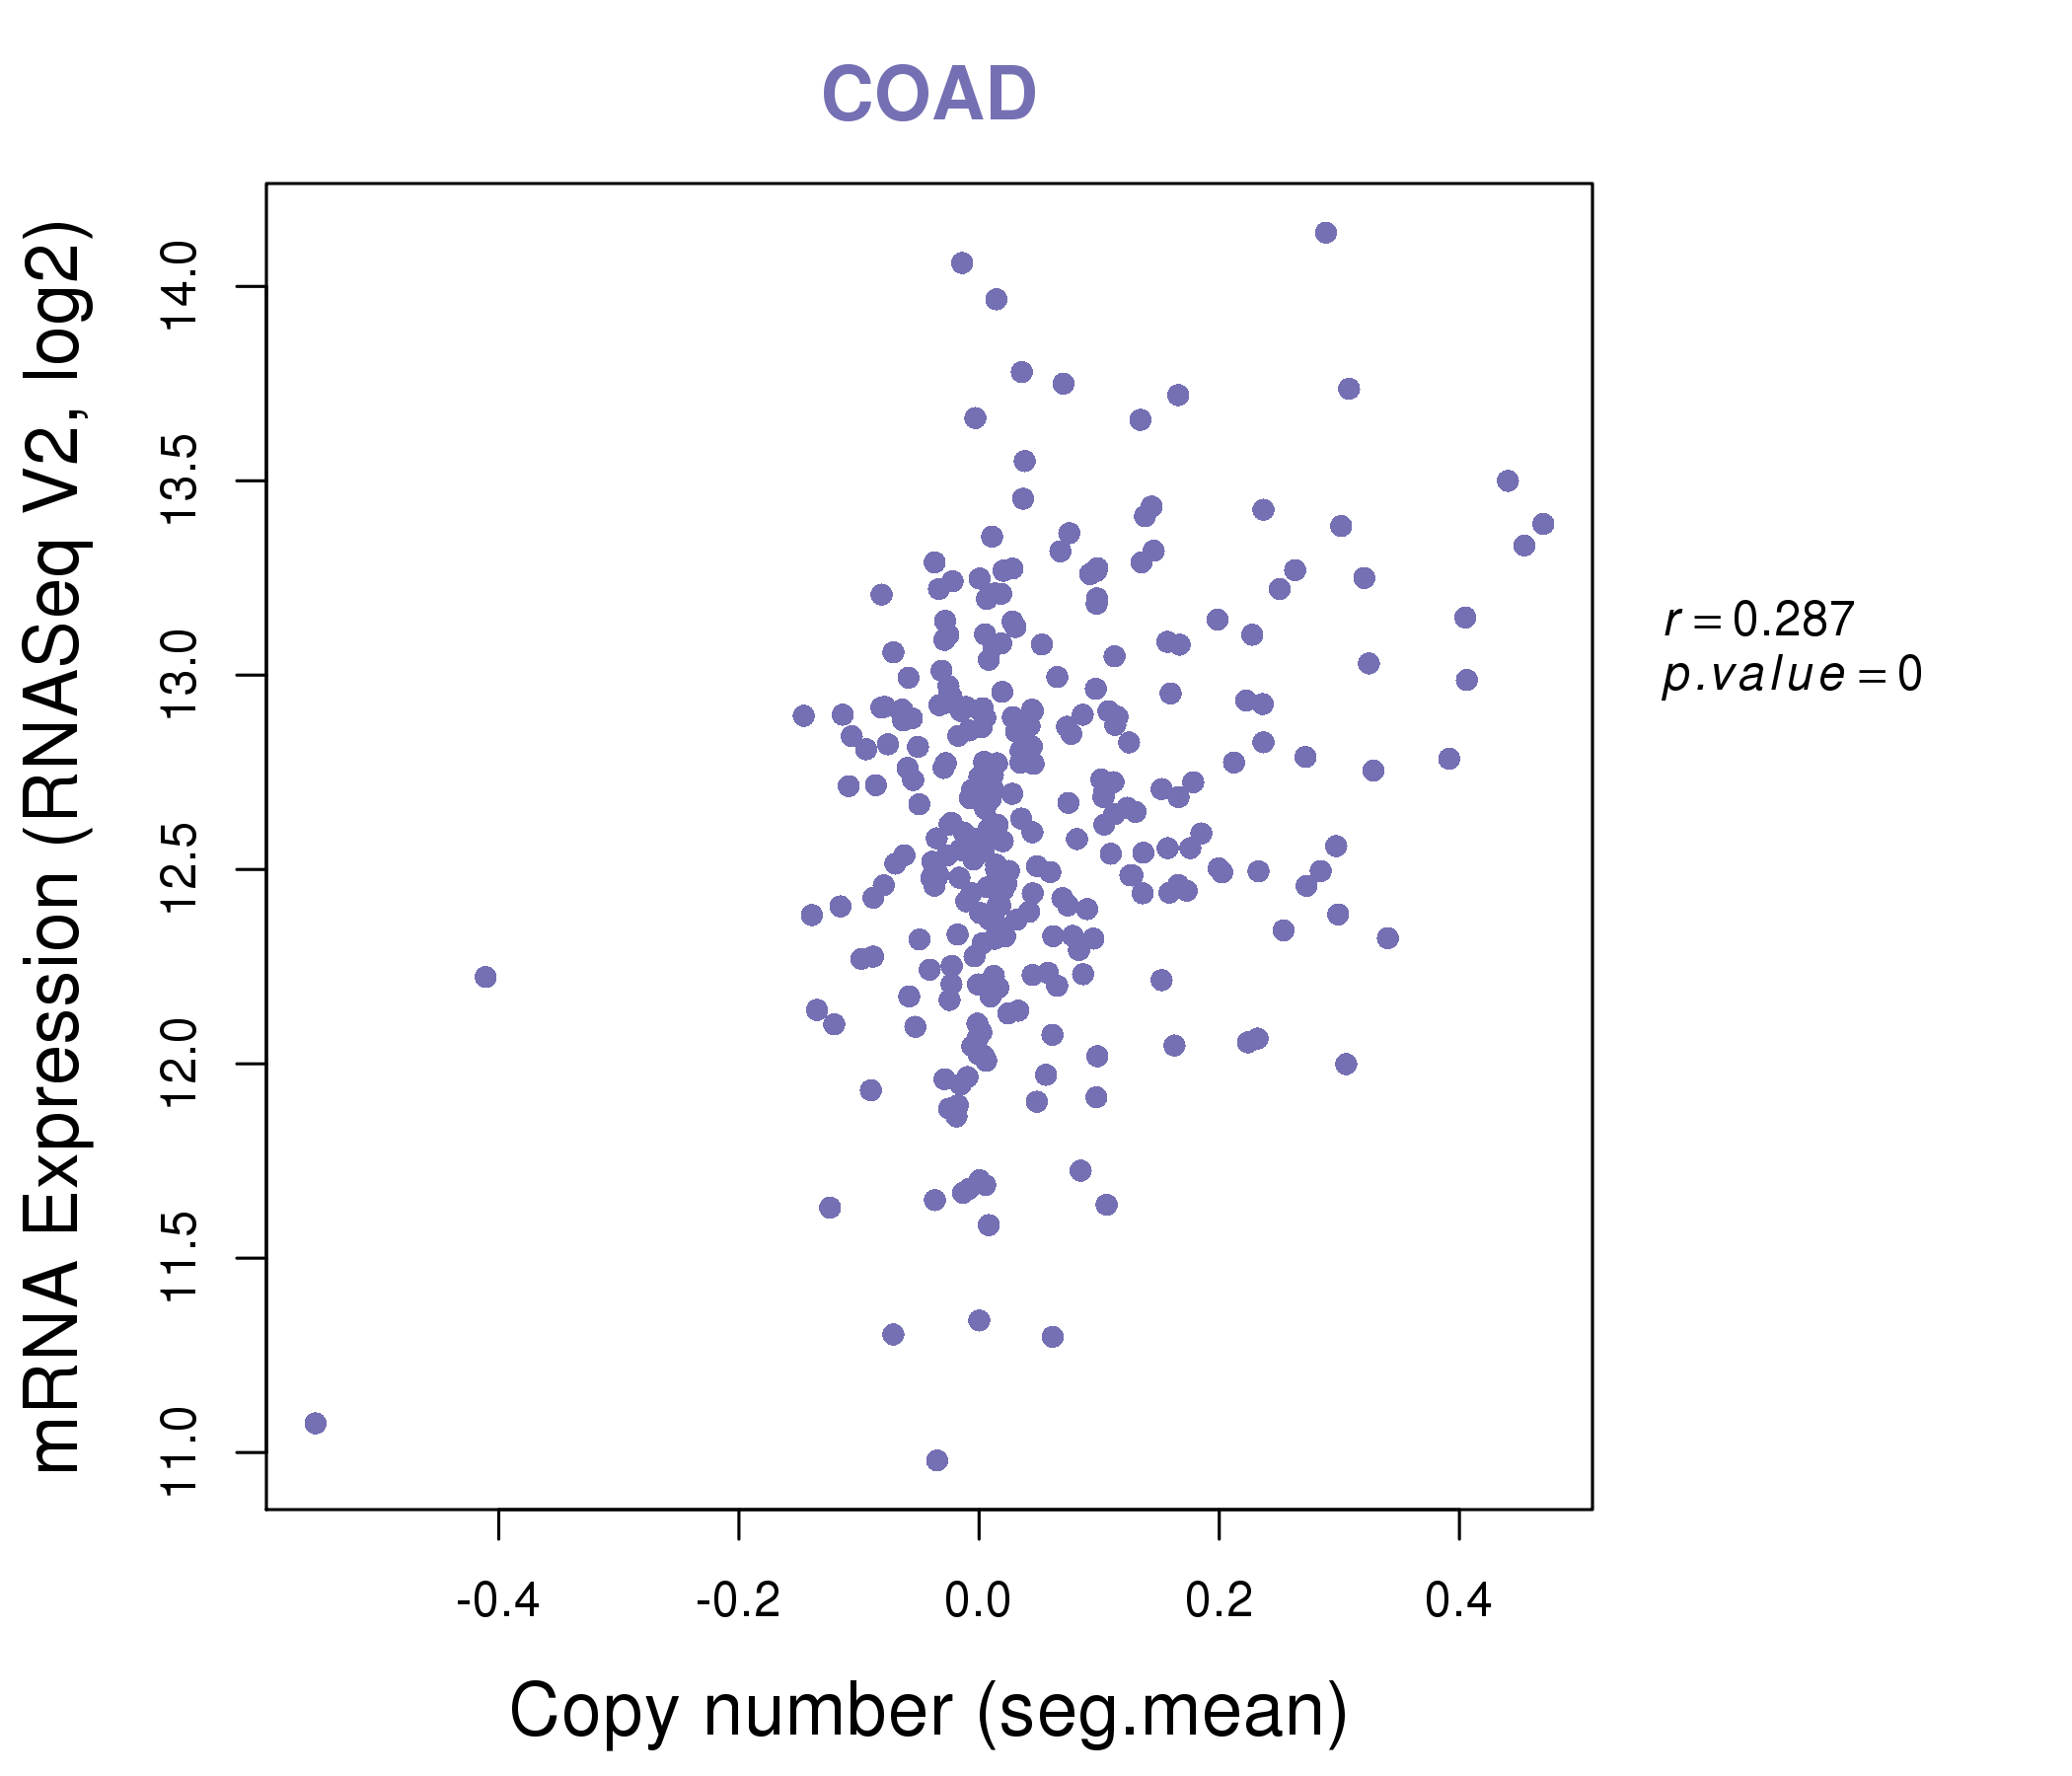
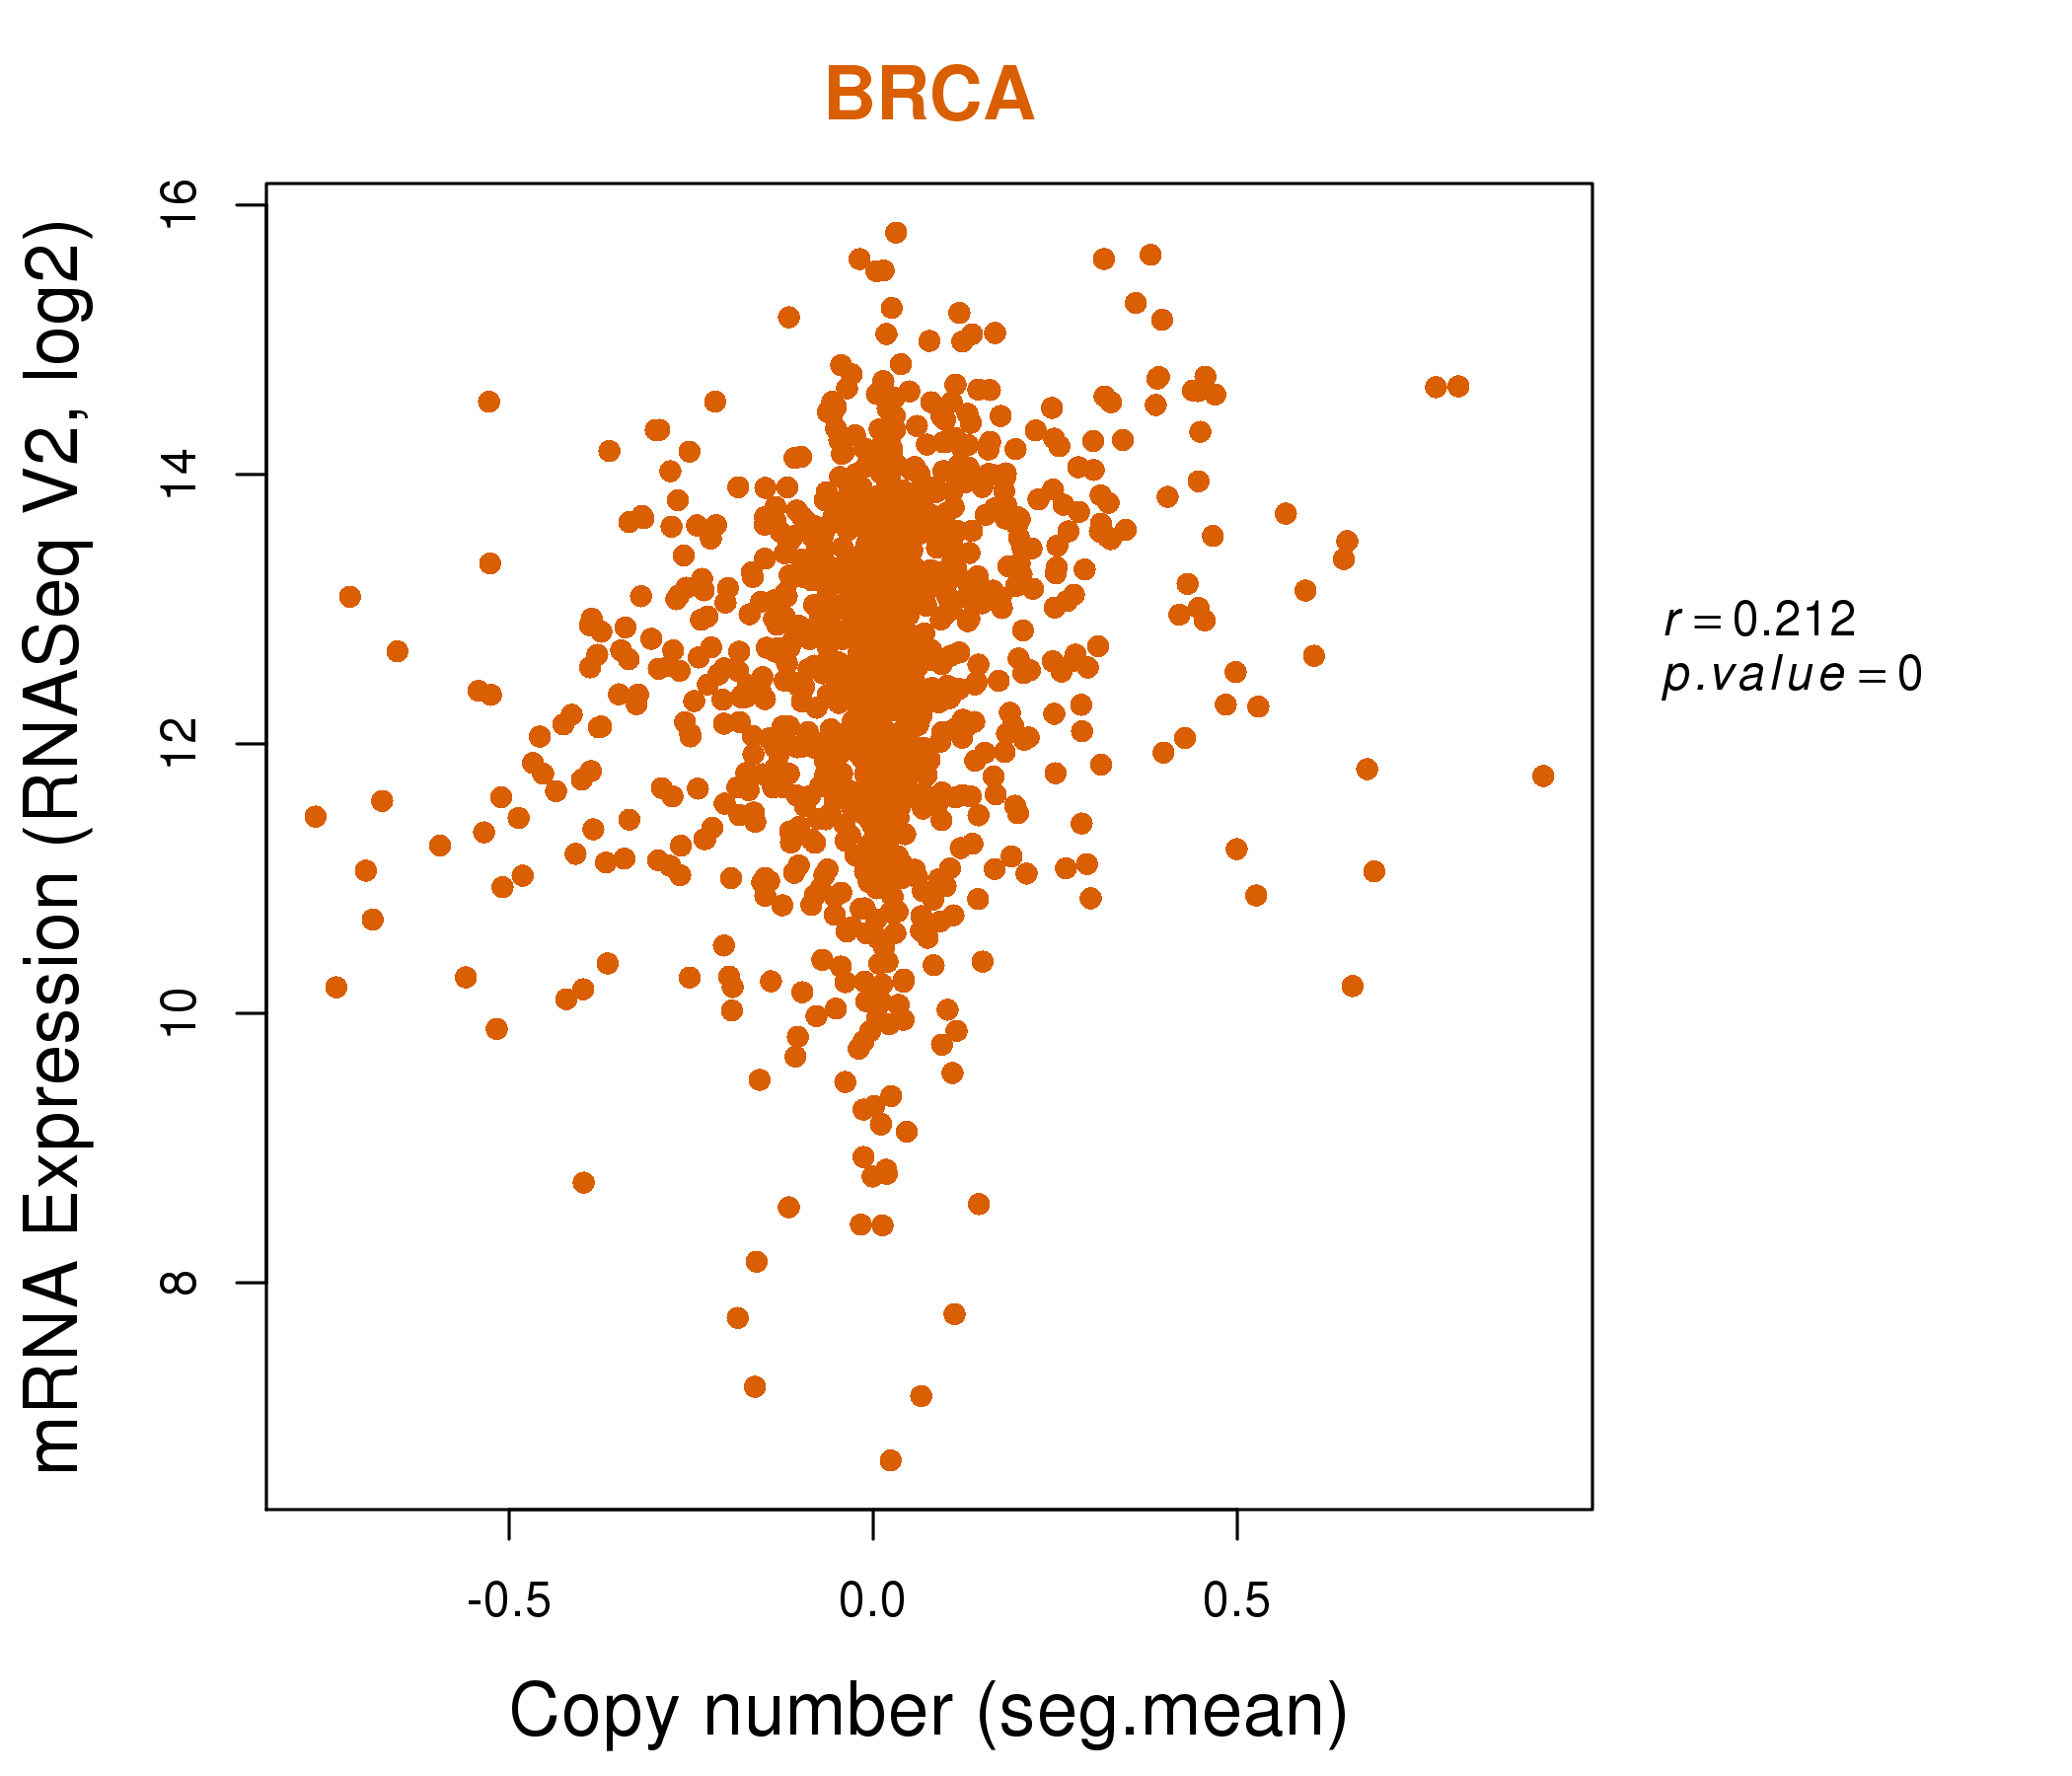
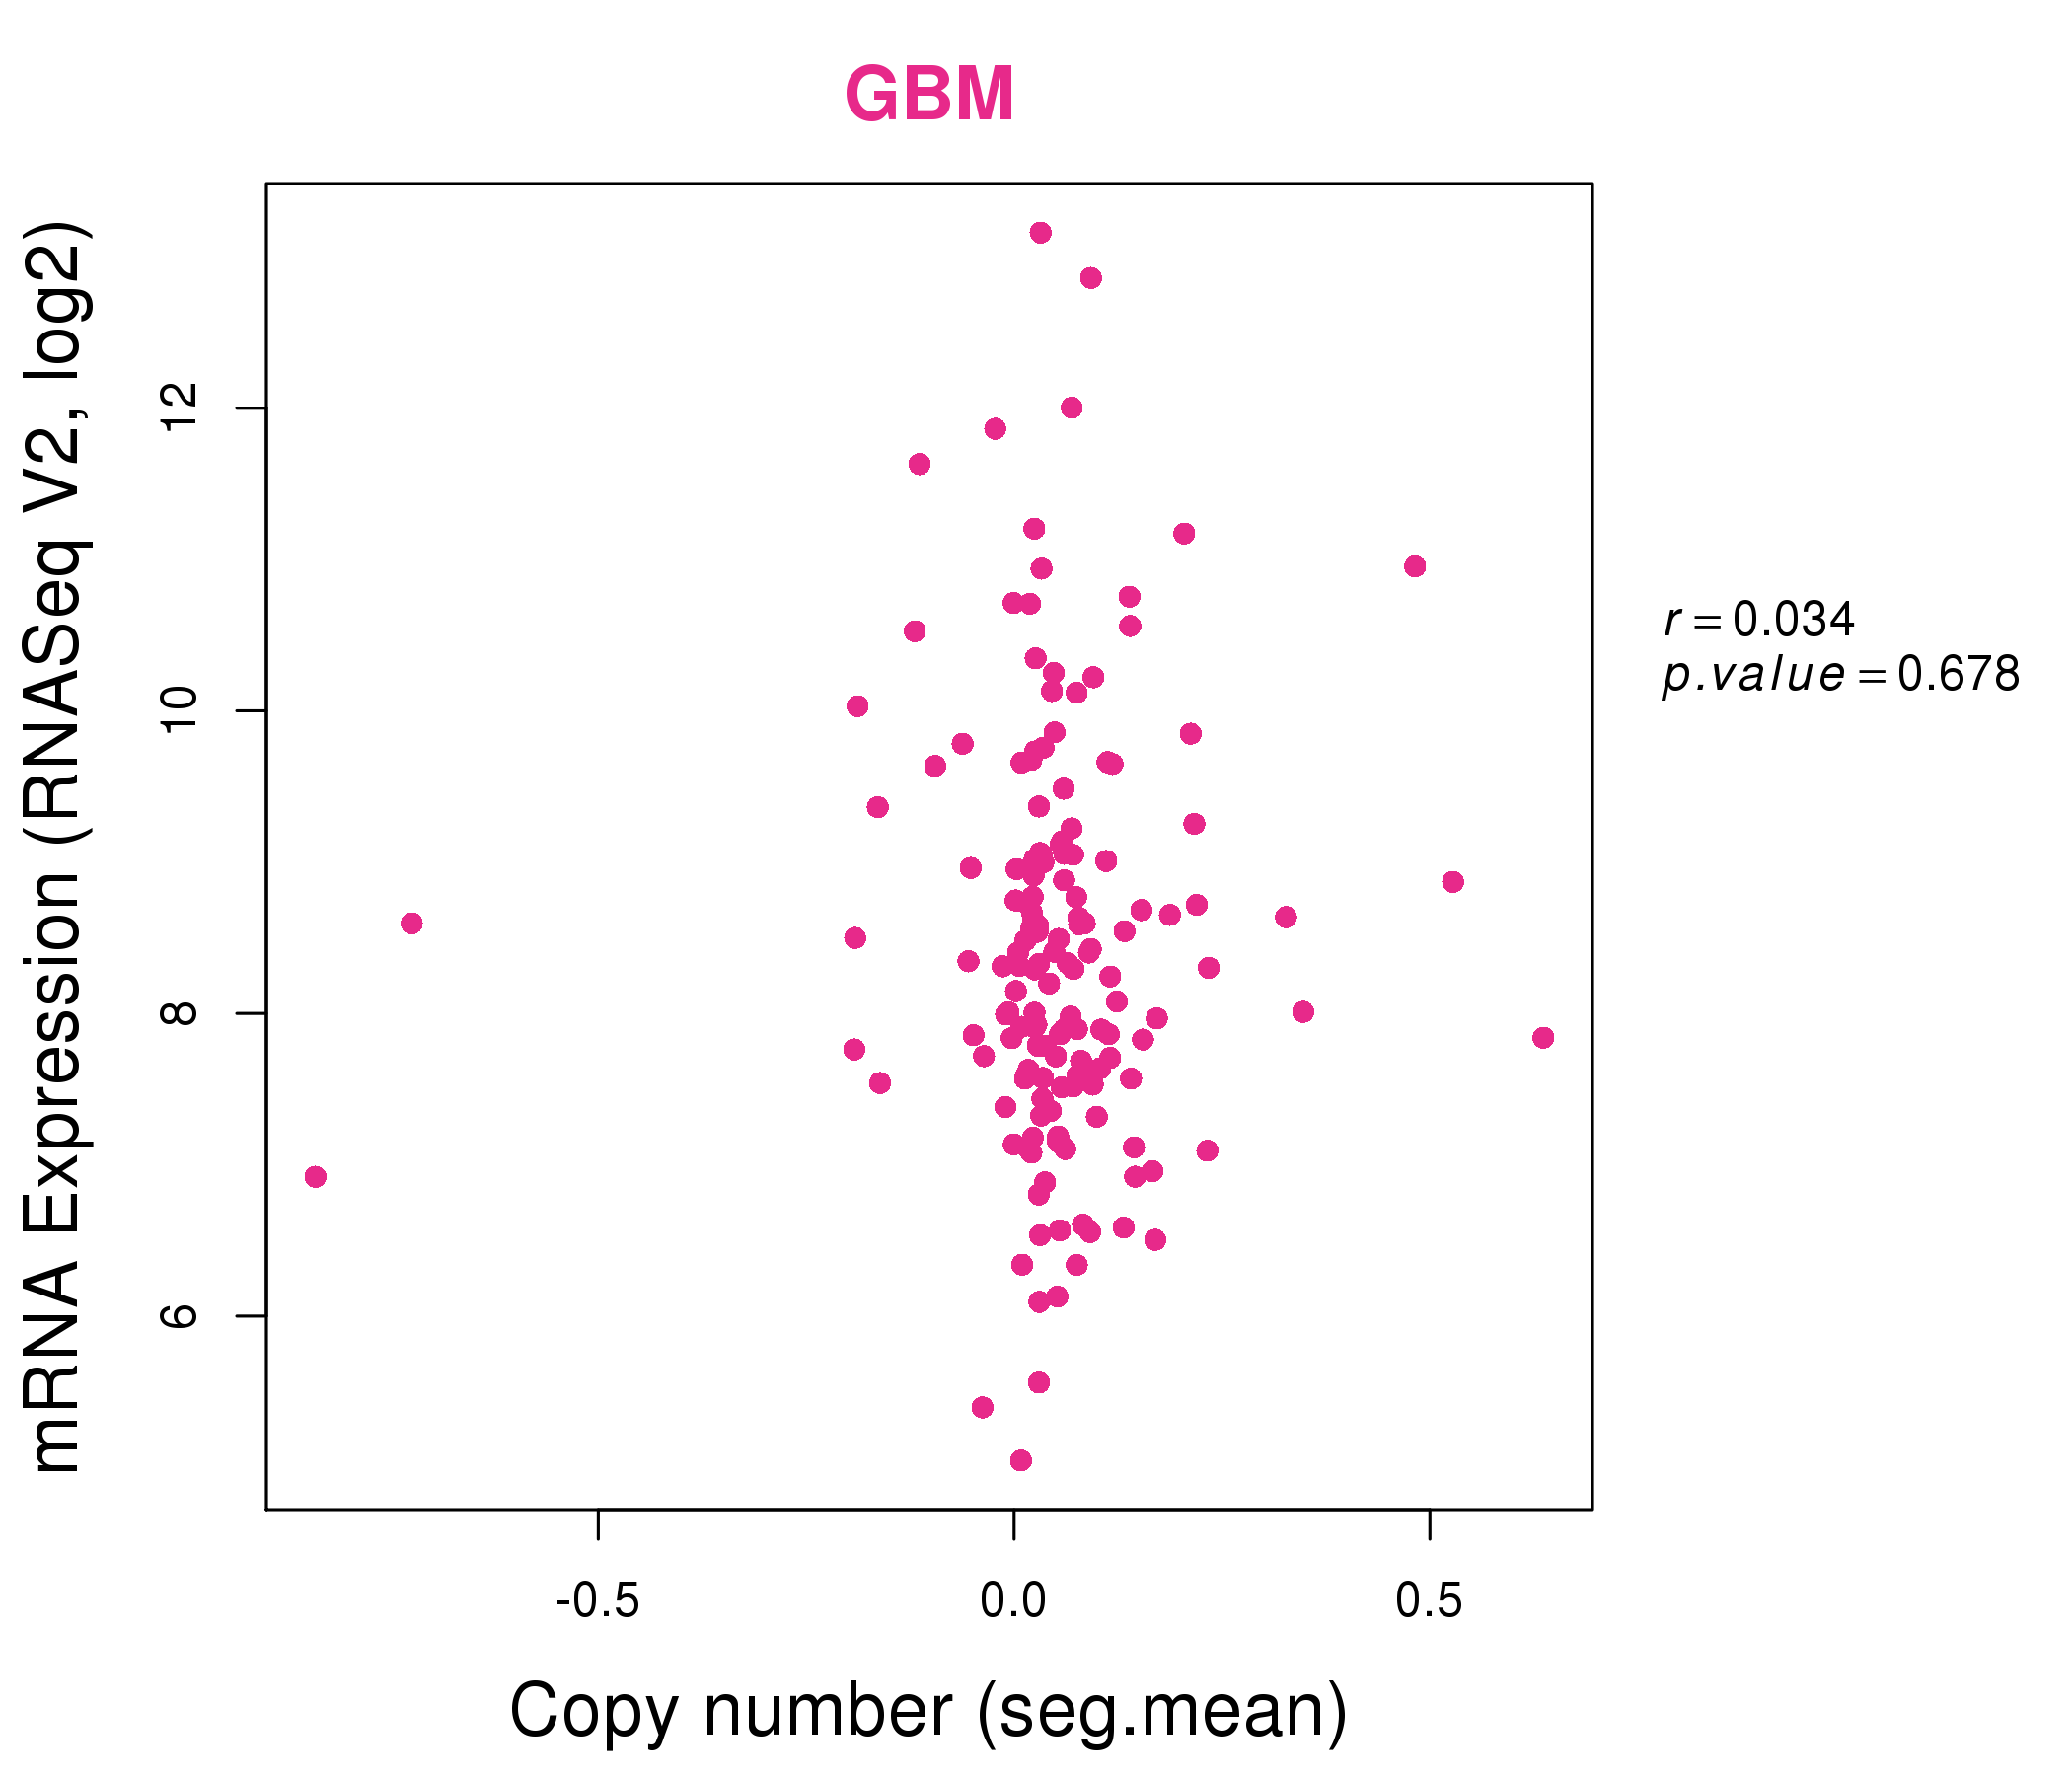
| * Copy number data were extracted from TCGA using R package TCGA-Assembler. The URLs of all public data files on TCGA DCC data server were gathered on Jan-05-2015. Function ProcessCNAData in TCGA-Assembler package was used to obtain gene-level copy number value which is calculated as the average copy number of the genomic region of a gene. |
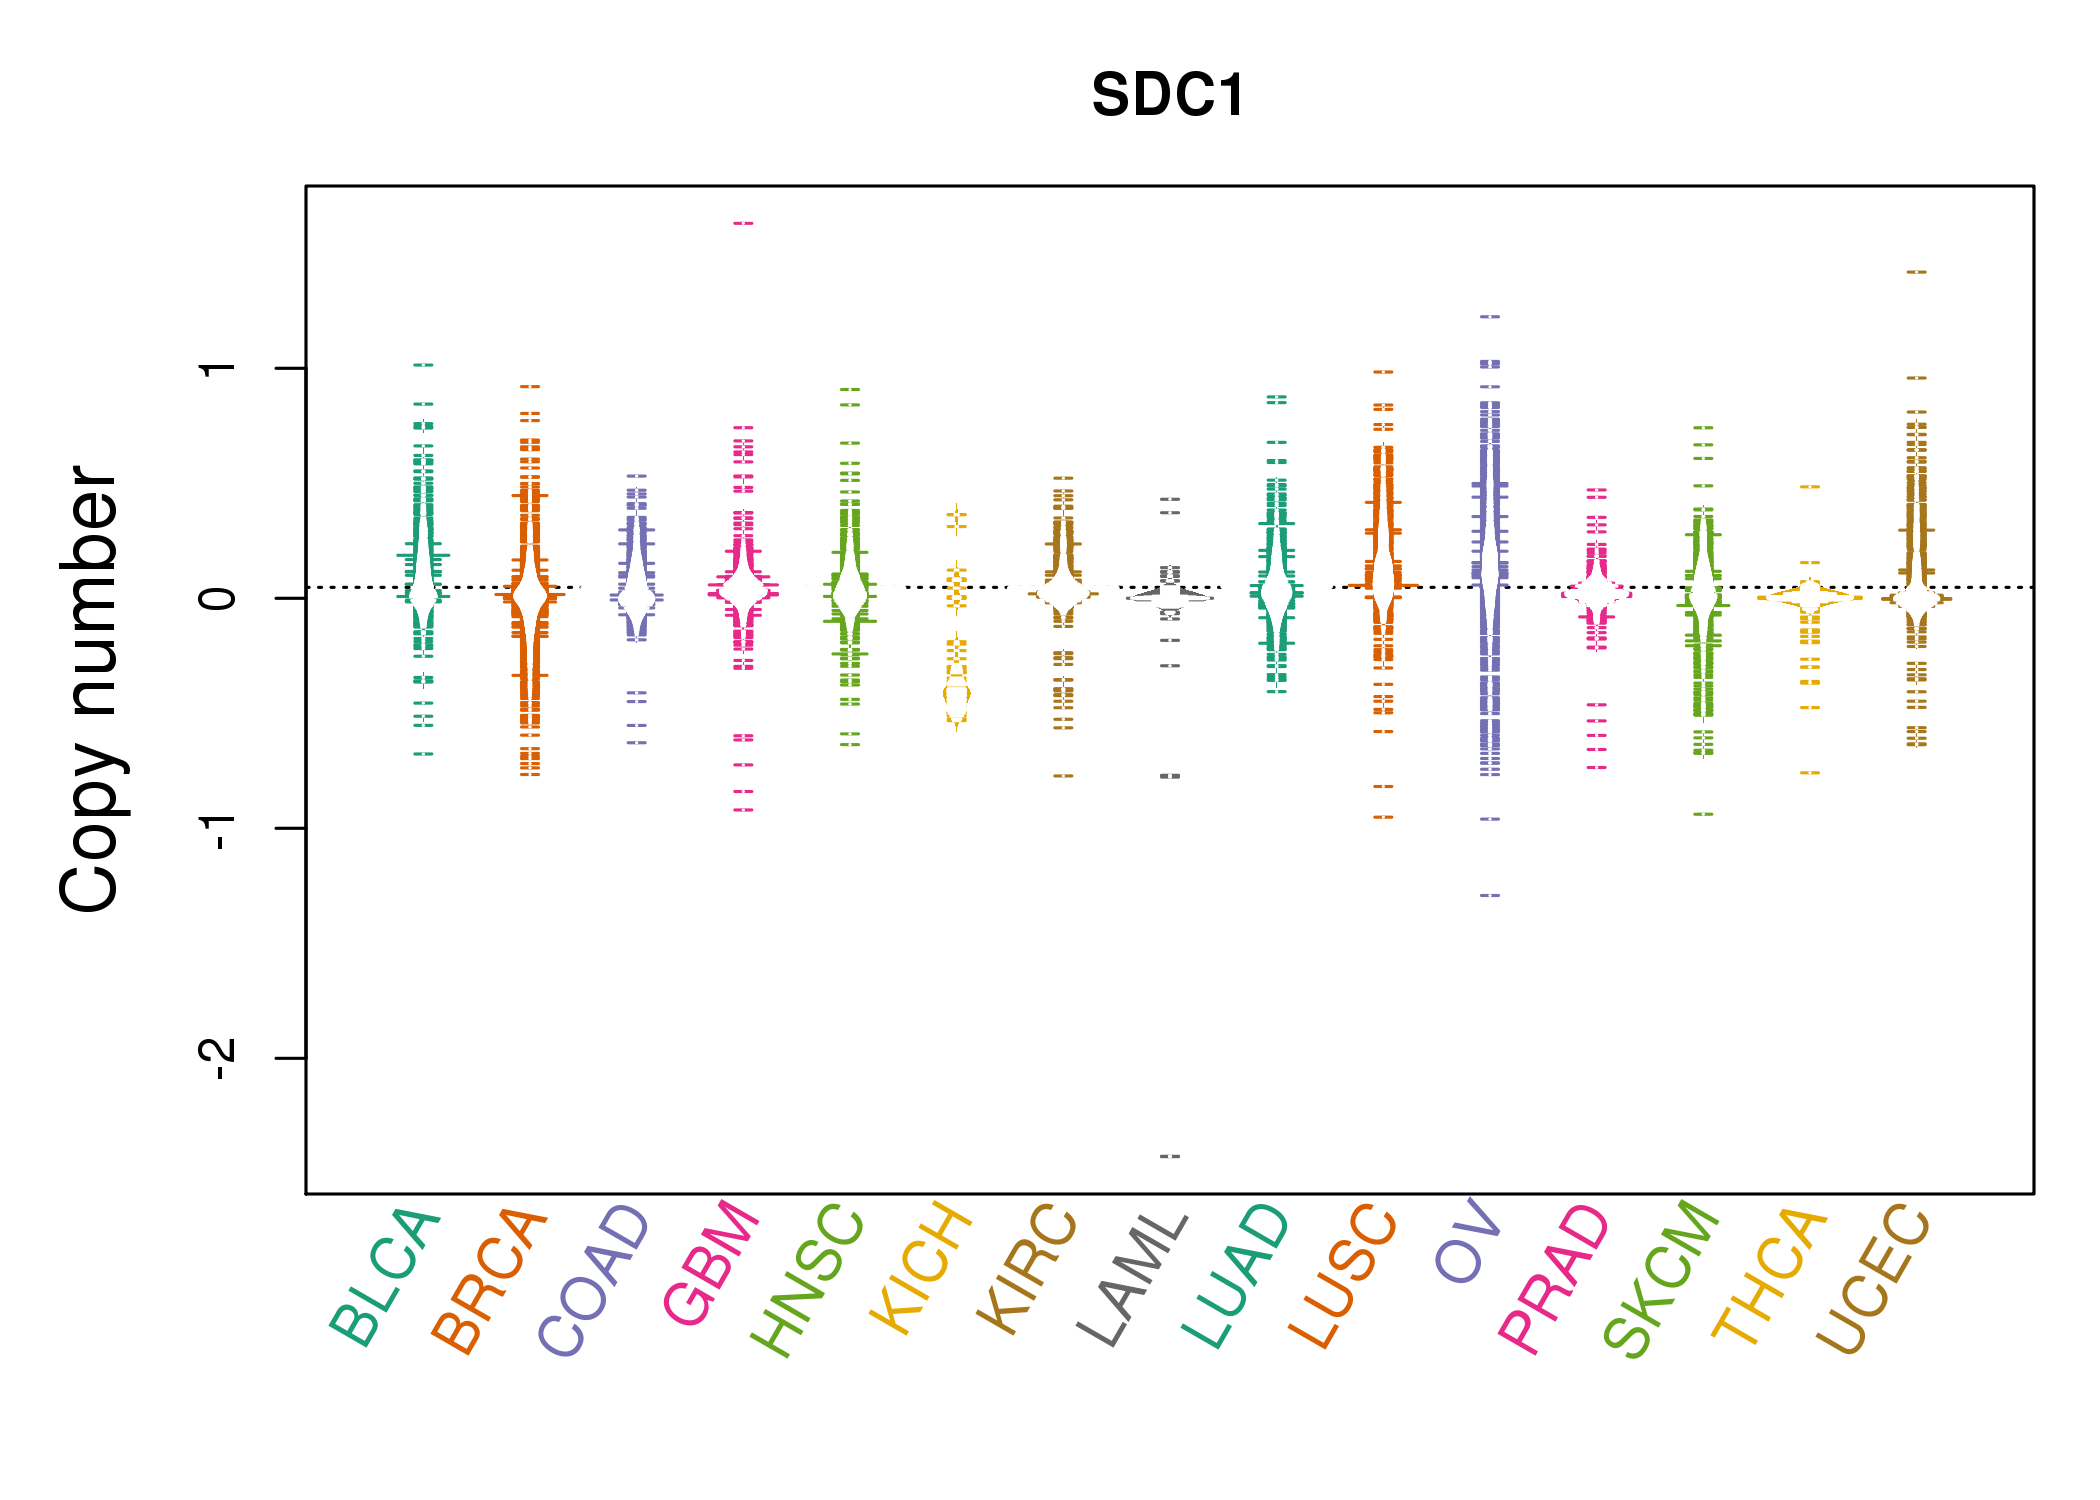 |
| cf) Tissue ID[Tissue type]: BLCA[Bladder Urothelial Carcinoma], BRCA[Breast invasive carcinoma], CESC[Cervical squamous cell carcinoma and endocervical adenocarcinoma], COAD[Colon adenocarcinoma], GBM[Glioblastoma multiforme], Glioma Low Grade, HNSC[Head and Neck squamous cell carcinoma], KICH[Kidney Chromophobe], KIRC[Kidney renal clear cell carcinoma], KIRP[Kidney renal papillary cell carcinoma], LAML[Acute Myeloid Leukemia], LUAD[Lung adenocarcinoma], LUSC[Lung squamous cell carcinoma], OV[Ovarian serous cystadenocarcinoma ], PAAD[Pancreatic adenocarcinoma], PRAD[Prostate adenocarcinoma], SKCM[Skin Cutaneous Melanoma], STAD[Stomach adenocarcinoma], THCA[Thyroid carcinoma], UCEC[Uterine Corpus Endometrial Carcinoma] |
| Top |
| Gene Expression for SDC1 |
| * CCLE gene expression data were extracted from CCLE_Expression_Entrez_2012-10-18.res: Gene-centric RMA-normalized mRNA expression data. |
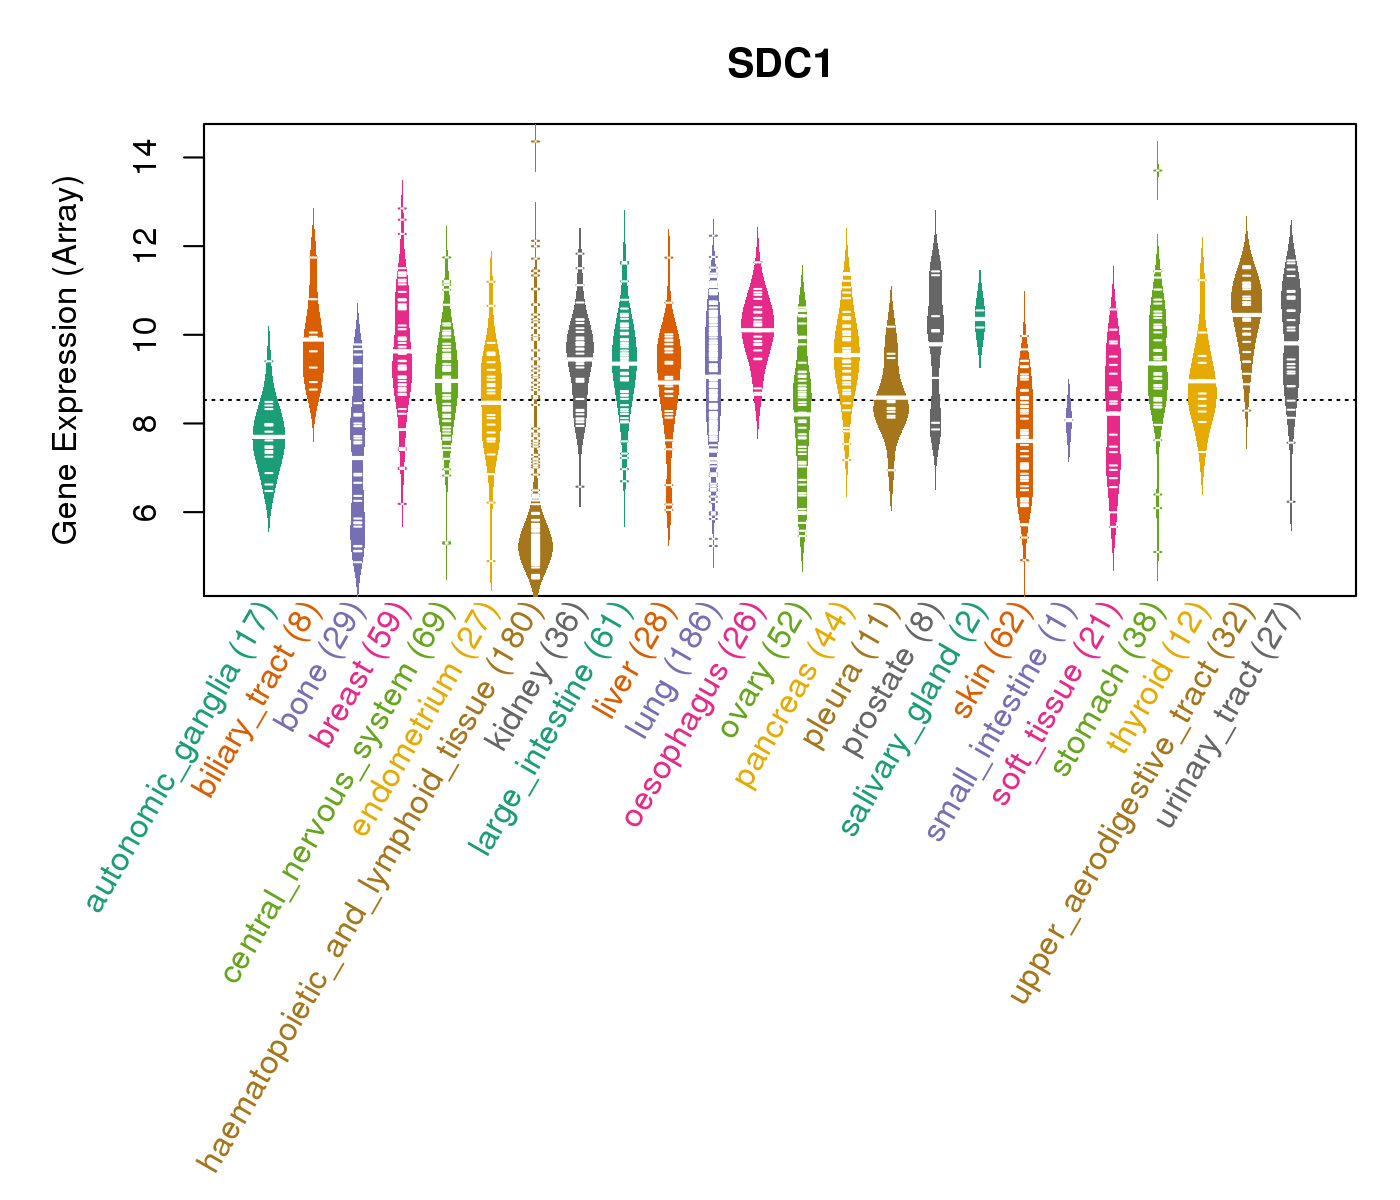 |
| * Normalized gene expression data of RNASeqV2 was extracted from TCGA using R package TCGA-Assembler. The URLs of all public data files on TCGA DCC data server were gathered at Jan-05-2015. Only eight cancer types have enough normal control samples for differential expression analysis. (t test, adjusted p<0.05 (using Benjamini-Hochberg FDR)) |
 |
| Top |
| * This plots show the correlation between CNV and gene expression. |
: Open all plots for all cancer types
 |
|
 |
|
| Top |
| Gene-Gene Network Information |
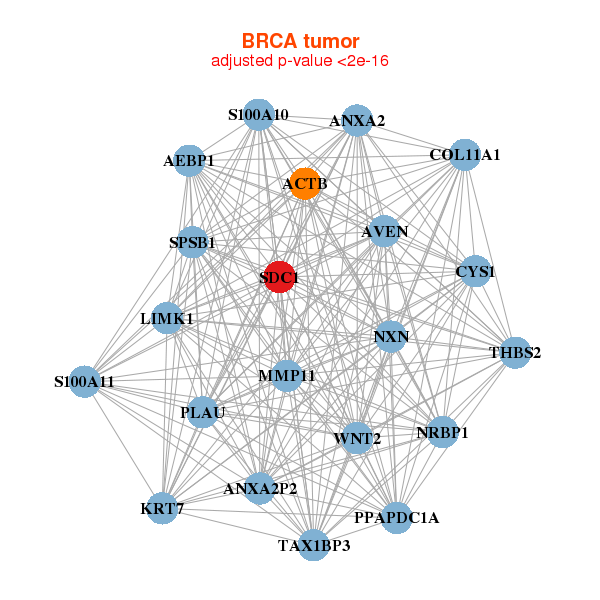
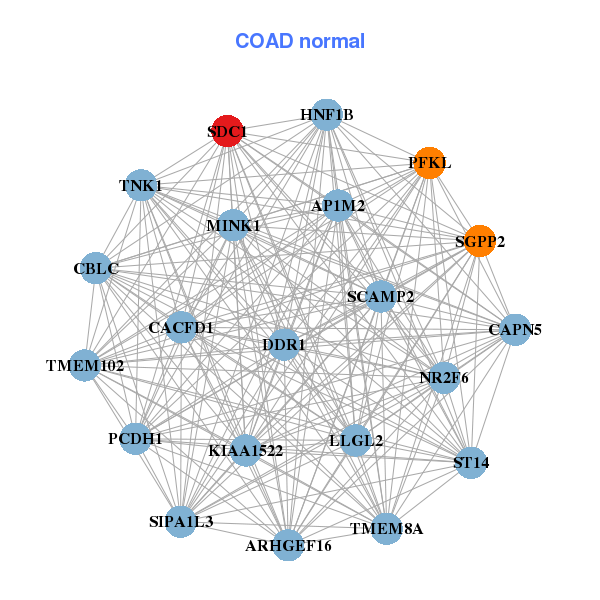
| * Co-Expression network figures were drawn using R package igraph. Only the top 20 genes with the highest correlations were shown. Red circle: input gene, orange circle: cell metabolism gene, sky circle: other gene |
: Open all plots for all cancer types
 |
|
| ACTB,AEBP1,ANXA2,ANXA2P2,AVEN,COL11A1,CYS1, KRT7,LIMK1,MMP11,NRBP1,NXN,PLAU,PPAPDC1A, S100A10,S100A11,SDC1,SPSB1,TAX1BP3,THBS2,WNT2 | AP1M2,APEX2,CACFD1,CAPN1,CLDN7,FAM83H,KRT18, KRT7,KRT8,LSR,PKP3,PRPF19,PRRG2,RUVBL1, SDC1,SLC35A2,SPINT1,SPINT2,ST14,STAP2,TMEM102 |
 |
|
| ABCC3,CRAT,DNAJB2,DTX2,FAM102A,GPR39,KLHDC7A, MFSD9,MYO7B,P2RX4,PROM2,PTPRF,RNF103,RNPEPL1, SDC1,SDCBP2,SPINT1,TMC4,TMCC1,TMEM53,UGT1A10 | AP1M2,ARHGEF16,CACFD1,CAPN5,CBLC,DDR1,HNF1B, KIAA1522,LLGL2,MINK1,NR2F6,PCDH1,PFKL,SCAMP2, SDC1,SGPP2,SIPA1L3,ST14,TMEM102,TMEM8A,TNK1 |

| * Co-Expression network figures were drawn using R package igraph. Only the top 20 genes with the highest correlations were shown. Red circle: input gene, orange circle: cell metabolism gene, sky circle: other gene |
: Open all plots for all cancer types
| Top |
: Open all interacting genes' information including KEGG pathway for all interacting genes from DAVID
| Top |
| Pharmacological Information for SDC1 |
| There's no related Drug. |
| Top |
| Cross referenced IDs for SDC1 |
| * We obtained these cross-references from Uniprot database. It covers 150 different DBs, 18 categories. http://www.uniprot.org/help/cross_references_section |
: Open all cross reference information
|
Copyright © 2016-Present - The Univsersity of Texas Health Science Center at Houston @ |