|
||||||||||||||||||||
| |
| Phenotypic Information (metabolism pathway, cancer, disease, phenome) |
| |
| |
| Gene-Gene Network Information: Co-Expression Network, Interacting Genes & KEGG |
| |
|


| Gene Summary for SRR |
| Basic gene info. | Gene symbol | SRR |
| Gene name | serine racemase | |
| Synonyms | ILV1|ISO1 | |
| Cytomap | UCSC genome browser: 17p13 | |
| Genomic location | chr17 :2207247-2228553 | |
| Type of gene | protein-coding | |
| RefGenes | NM_021947.1, | |
| Ensembl id | ENSG00000167720 | |
| Description | D-serine ammonia-lyaseD-serine dehydrataseL-serine ammonia-lyaseL-serine dehydratase | |
| Modification date | 20141207 | |
| dbXrefs | MIM : 606477 | |
| HGNC : HGNC | ||
| Ensembl : ENSG00000167720 | ||
| HPRD : 10451 | ||
| Vega : OTTHUMG00000090583 | ||
| Protein | UniProt: go to UniProt's Cross Reference DB Table | |
| Expression | CleanEX: HS_SRR | |
| BioGPS: 63826 | ||
| Gene Expression Atlas: ENSG00000167720 | ||
| The Human Protein Atlas: ENSG00000167720 | ||
| Pathway | NCI Pathway Interaction Database: SRR | |
| KEGG: SRR | ||
| REACTOME: SRR | ||
| ConsensusPathDB | ||
| Pathway Commons: SRR | ||
| Metabolism | MetaCyc: SRR | |
| HUMANCyc: SRR | ||
| Regulation | Ensembl's Regulation: ENSG00000167720 | |
| miRBase: chr17 :2,207,247-2,228,553 | ||
| TargetScan: NM_021947 | ||
| cisRED: ENSG00000167720 | ||
| Context | iHOP: SRR | |
| cancer metabolism search in PubMed: SRR | ||
| UCL Cancer Institute: SRR | ||
| Assigned class in ccmGDB | C | |
| Top |
| Phenotypic Information for SRR(metabolism pathway, cancer, disease, phenome) |
| Cancer | CGAP: SRR |
| Familial Cancer Database: SRR | |
| * This gene is included in those cancer gene databases. |
|
|
|
|
|
| . | ||||||||||||||
Oncogene 1 | Significant driver gene in | |||||||||||||||||||
| cf) number; DB name 1 Oncogene; http://nar.oxfordjournals.org/content/35/suppl_1/D721.long, 2 Tumor Suppressor gene; https://bioinfo.uth.edu/TSGene/, 3 Cancer Gene Census; http://www.nature.com/nrc/journal/v4/n3/abs/nrc1299.html, 4 CancerGenes; http://nar.oxfordjournals.org/content/35/suppl_1/D721.long, 5 Network of Cancer Gene; http://ncg.kcl.ac.uk/index.php, 1Therapeutic Vulnerabilities in Cancer; http://cbio.mskcc.org/cancergenomics/statius/ |
| KEGG_GLYCINE_SERINE_AND_THREONINE_METABOLISM | |
| OMIM | |
| Orphanet | |
| Disease | KEGG Disease: SRR |
| MedGen: SRR (Human Medical Genetics with Condition) | |
| ClinVar: SRR | |
| Phenotype | MGI: SRR (International Mouse Phenotyping Consortium) |
| PhenomicDB: SRR | |
| Mutations for SRR |
| * Under tables are showing count per each tissue to give us broad intuition about tissue specific mutation patterns.You can go to the detailed page for each mutation database's web site. |
| - Statistics for Tissue and Mutation type | Top |
 |
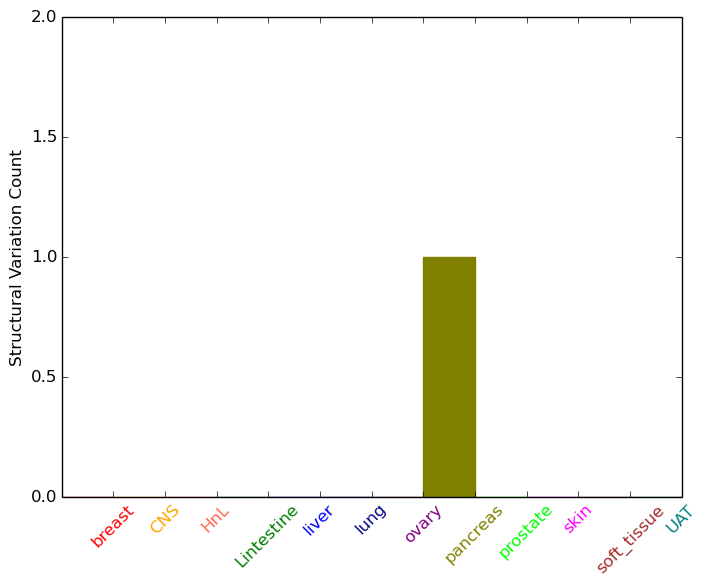
| - For Inter-chromosomal Variations |
| * Inter-chromosomal variantions includes 'interchromosomal amplicon to amplicon', 'interchromosomal amplicon to non-amplified dna', 'interchromosomal insertion', 'Interchromosomal unknown type'. |
 |
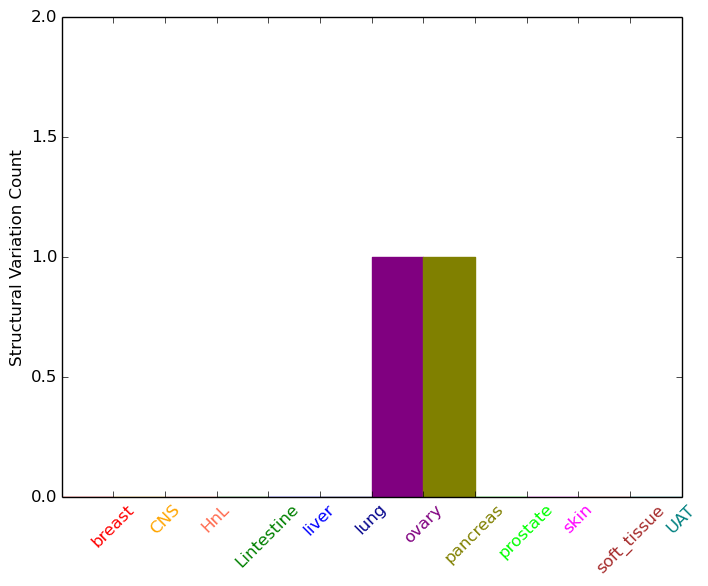
| - For Intra-chromosomal Variations |
| * Intra-chromosomal variantions includes 'intrachromosomal amplicon to amplicon', 'intrachromosomal amplicon to non-amplified dna', 'intrachromosomal deletion', 'intrachromosomal fold-back inversion', 'intrachromosomal inversion', 'intrachromosomal tandem duplication', 'Intrachromosomal unknown type', 'intrachromosomal with inverted orientation', 'intrachromosomal with non-inverted orientation'. |
 |
| Sample | Symbol_a | Chr_a | Start_a | End_a | Symbol_b | Chr_b | Start_b | End_b |
| ovary | SRR | chr17 | 2219606 | 2219626 | SMG6 | chr17 | 2130138 | 2130158 |
| pancreas | SRR | chr17 | 2209364 | 2209384 | SRR | chr17 | 2211109 | 2211129 |
| pancreas | SRR | chr17 | 2214790 | 2214810 | chr14 | 22043829 | 22043849 |
| cf) Tissue number; Tissue name (1;Breast, 2;Central_nervous_system, 3;Haematopoietic_and_lymphoid_tissue, 4;Large_intestine, 5;Liver, 6;Lung, 7;Ovary, 8;Pancreas, 9;Prostate, 10;Skin, 11;Soft_tissue, 12;Upper_aerodigestive_tract) |
| * From mRNA Sanger sequences, Chitars2.0 arranged chimeric transcripts. This table shows SRR related fusion information. |
| ID | Head Gene | Tail Gene | Accession | Gene_a | qStart_a | qEnd_a | Chromosome_a | tStart_a | tEnd_a | Gene_a | qStart_a | qEnd_a | Chromosome_a | tStart_a | tEnd_a |
| CN347172 | SRR | 1 | 541 | 17 | 2226860 | 2227400 | ROMO1 | 539 | 601 | 20 | 34288835 | 34288897 | |
| AA614279 | FUS | 1 | 323 | 16 | 31202314 | 31202923 | SRR | 319 | 376 | 17 | 2208426 | 2208483 | |
| Top |
| There's no copy number variation information in COSMIC data for this gene. |
| Top |
|
 |
| Top |
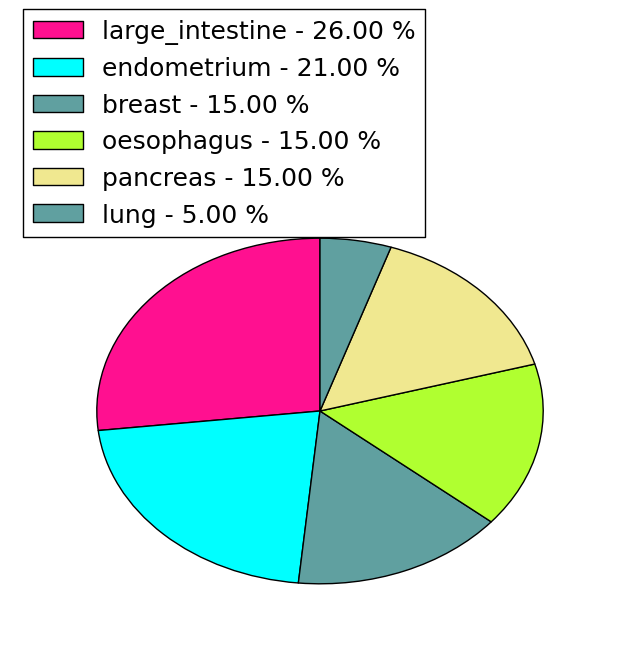
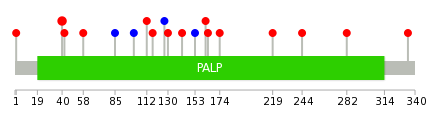
| Stat. for Non-Synonymous SNVs (# total SNVs=19) | (# total SNVs=4) |
 | 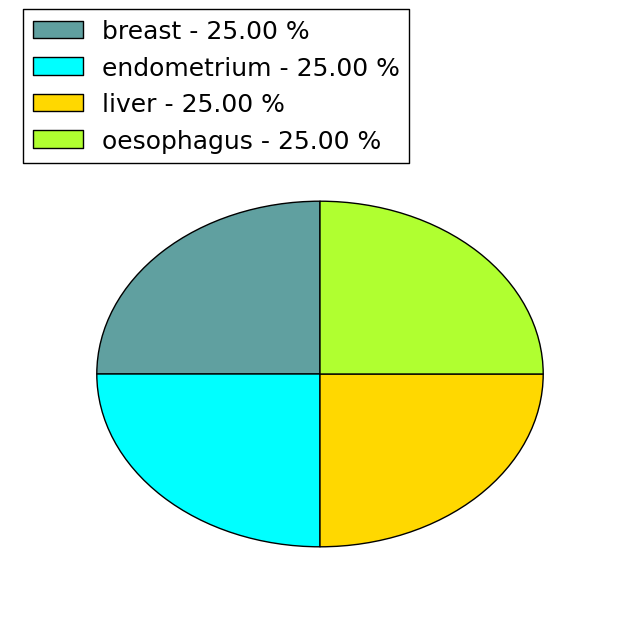 |
(# total SNVs=1) | (# total SNVs=0) |
 |
| Top |
| * When you move the cursor on each content, you can see more deailed mutation information on the Tooltip. Those are primary_site,primary_histology,mutation(aa),pubmedID. |
| GRCh37 position | Mutation(aa) | Unique sampleID count |
| chr17:2221171-2221171 | p.G59D | 3 |
| chr17:2227019-2227019 | p.A292G | 2 |
| chr17:2218973-2218973 | p.R40H | 2 |
| chr17:2226993-2226993 | p.E283E | 1 |
| chr17:2221167-2221167 | p.R58C | 1 |
| chr17:2224606-2224606 | p.E136* | 1 |
| chr17:2224624-2224624 | p.V142I | 1 |
| chr17:2227020-2227020 | p.A292A | 1 |
| chr17:2221250-2221250 | p.G85G | 1 |
| chr17:2224685-2224685 | p.G162A | 1 |
| Top |
|
 |
| Point Mutation/ Tissue ID | 1 | 2 | 3 | 4 | 5 | 6 | 7 | 8 | 9 | 10 | 11 | 12 | 13 | 14 | 15 | 16 | 17 | 18 | 19 | 20 |
| # sample | 3 | 3 | 1 | 1 | 1 | 4 | 1 | 4 | ||||||||||||
| # mutation | 3 | 3 | 1 | 1 | 1 | 4 | 1 | 5 | ||||||||||||
| nonsynonymous SNV | 2 | 3 | 1 | 1 | 4 | 1 | 4 | |||||||||||||
| synonymous SNV | 1 | 1 | 1 |
| cf) Tissue ID; Tissue type (1; BLCA[Bladder Urothelial Carcinoma], 2; BRCA[Breast invasive carcinoma], 3; CESC[Cervical squamous cell carcinoma and endocervical adenocarcinoma], 4; COAD[Colon adenocarcinoma], 5; GBM[Glioblastoma multiforme], 6; Glioma Low Grade, 7; HNSC[Head and Neck squamous cell carcinoma], 8; KICH[Kidney Chromophobe], 9; KIRC[Kidney renal clear cell carcinoma], 10; KIRP[Kidney renal papillary cell carcinoma], 11; LAML[Acute Myeloid Leukemia], 12; LUAD[Lung adenocarcinoma], 13; LUSC[Lung squamous cell carcinoma], 14; OV[Ovarian serous cystadenocarcinoma ], 15; PAAD[Pancreatic adenocarcinoma], 16; PRAD[Prostate adenocarcinoma], 17; SKCM[Skin Cutaneous Melanoma], 18:STAD[Stomach adenocarcinoma], 19:THCA[Thyroid carcinoma], 20:UCEC[Uterine Corpus Endometrial Carcinoma]) |
| Top |
| * We represented just top 10 SNVs. When you move the cursor on each content, you can see more deailed mutation information on the Tooltip. Those are primary_site, primary_histology, mutation(aa), pubmedID. |
| Genomic Position | Mutation(aa) | Unique sampleID count |
| chr17:2218973 | p.R40H | 2 |
| chr17:2221167 | p.V174F | 1 |
| chr17:2224836 | p.Q219L | 1 |
| chr17:2221250 | p.M1T | 1 |
| chr17:2226491 | p.I244T | 1 |
| chr17:2222127 | p.I282T | 1 |
| chr17:2226566 | p.L42I | 1 |
| chr17:2222158 | p.S334F | 1 |
| chr17:2226989 | p.R58C | 1 |
| chr17:2222174 | p.G85G | 1 |
| * Copy number data were extracted from TCGA using R package TCGA-Assembler. The URLs of all public data files on TCGA DCC data server were gathered on Jan-05-2015. Function ProcessCNAData in TCGA-Assembler package was used to obtain gene-level copy number value which is calculated as the average copy number of the genomic region of a gene. |
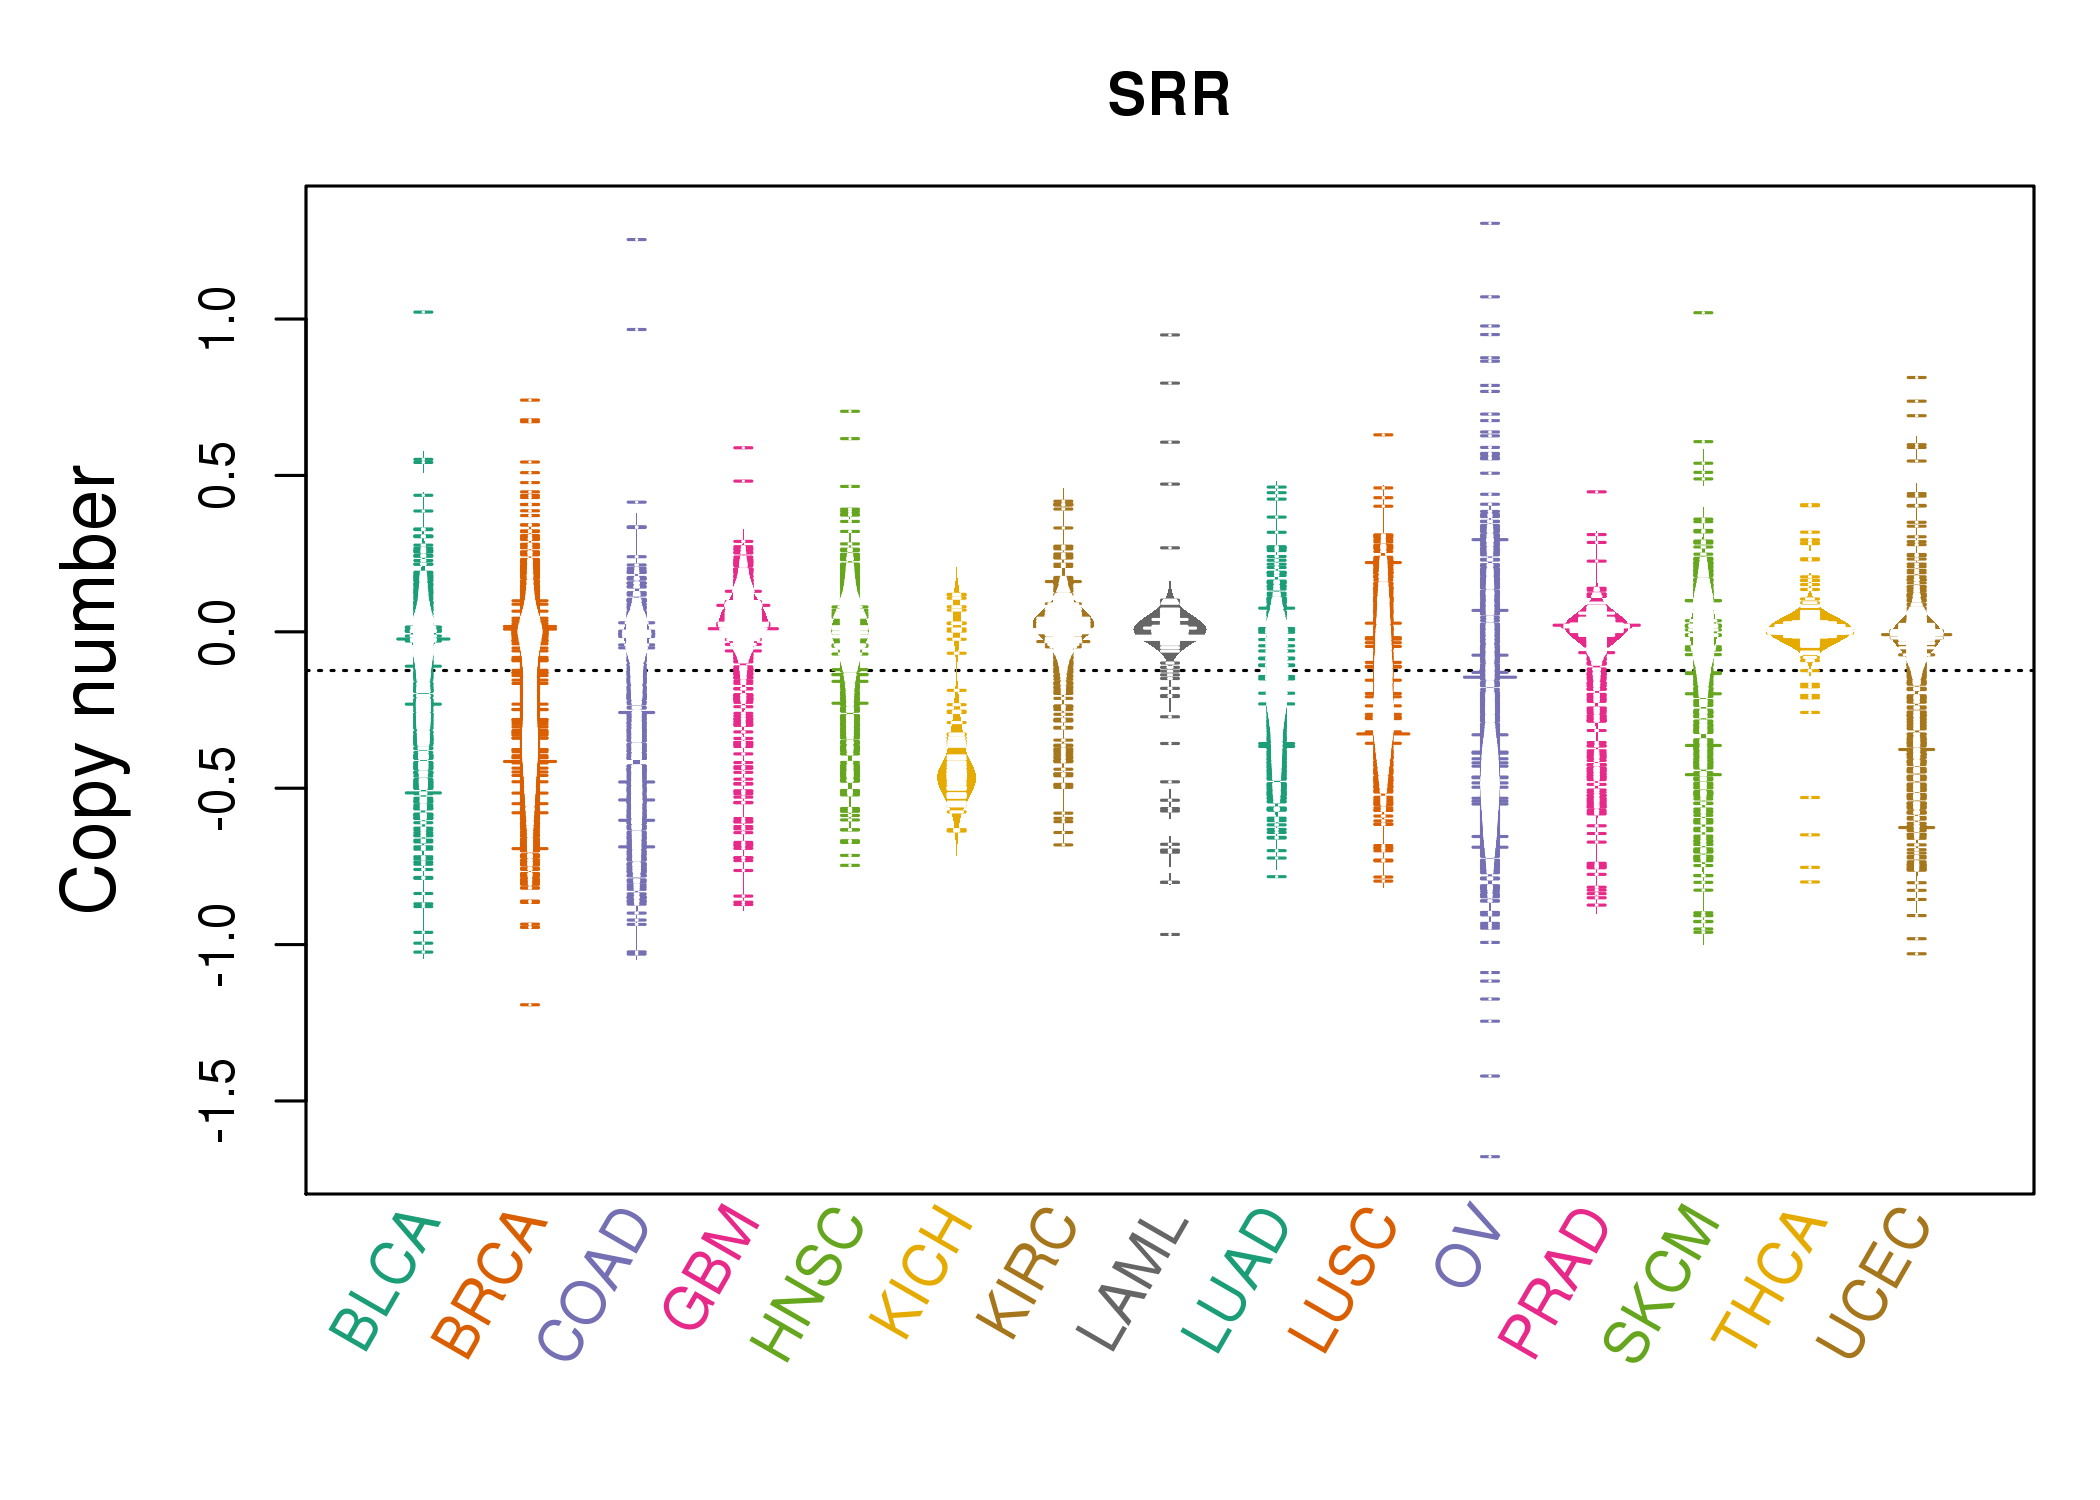 |
| cf) Tissue ID[Tissue type]: BLCA[Bladder Urothelial Carcinoma], BRCA[Breast invasive carcinoma], CESC[Cervical squamous cell carcinoma and endocervical adenocarcinoma], COAD[Colon adenocarcinoma], GBM[Glioblastoma multiforme], Glioma Low Grade, HNSC[Head and Neck squamous cell carcinoma], KICH[Kidney Chromophobe], KIRC[Kidney renal clear cell carcinoma], KIRP[Kidney renal papillary cell carcinoma], LAML[Acute Myeloid Leukemia], LUAD[Lung adenocarcinoma], LUSC[Lung squamous cell carcinoma], OV[Ovarian serous cystadenocarcinoma ], PAAD[Pancreatic adenocarcinoma], PRAD[Prostate adenocarcinoma], SKCM[Skin Cutaneous Melanoma], STAD[Stomach adenocarcinoma], THCA[Thyroid carcinoma], UCEC[Uterine Corpus Endometrial Carcinoma] |
| Top |
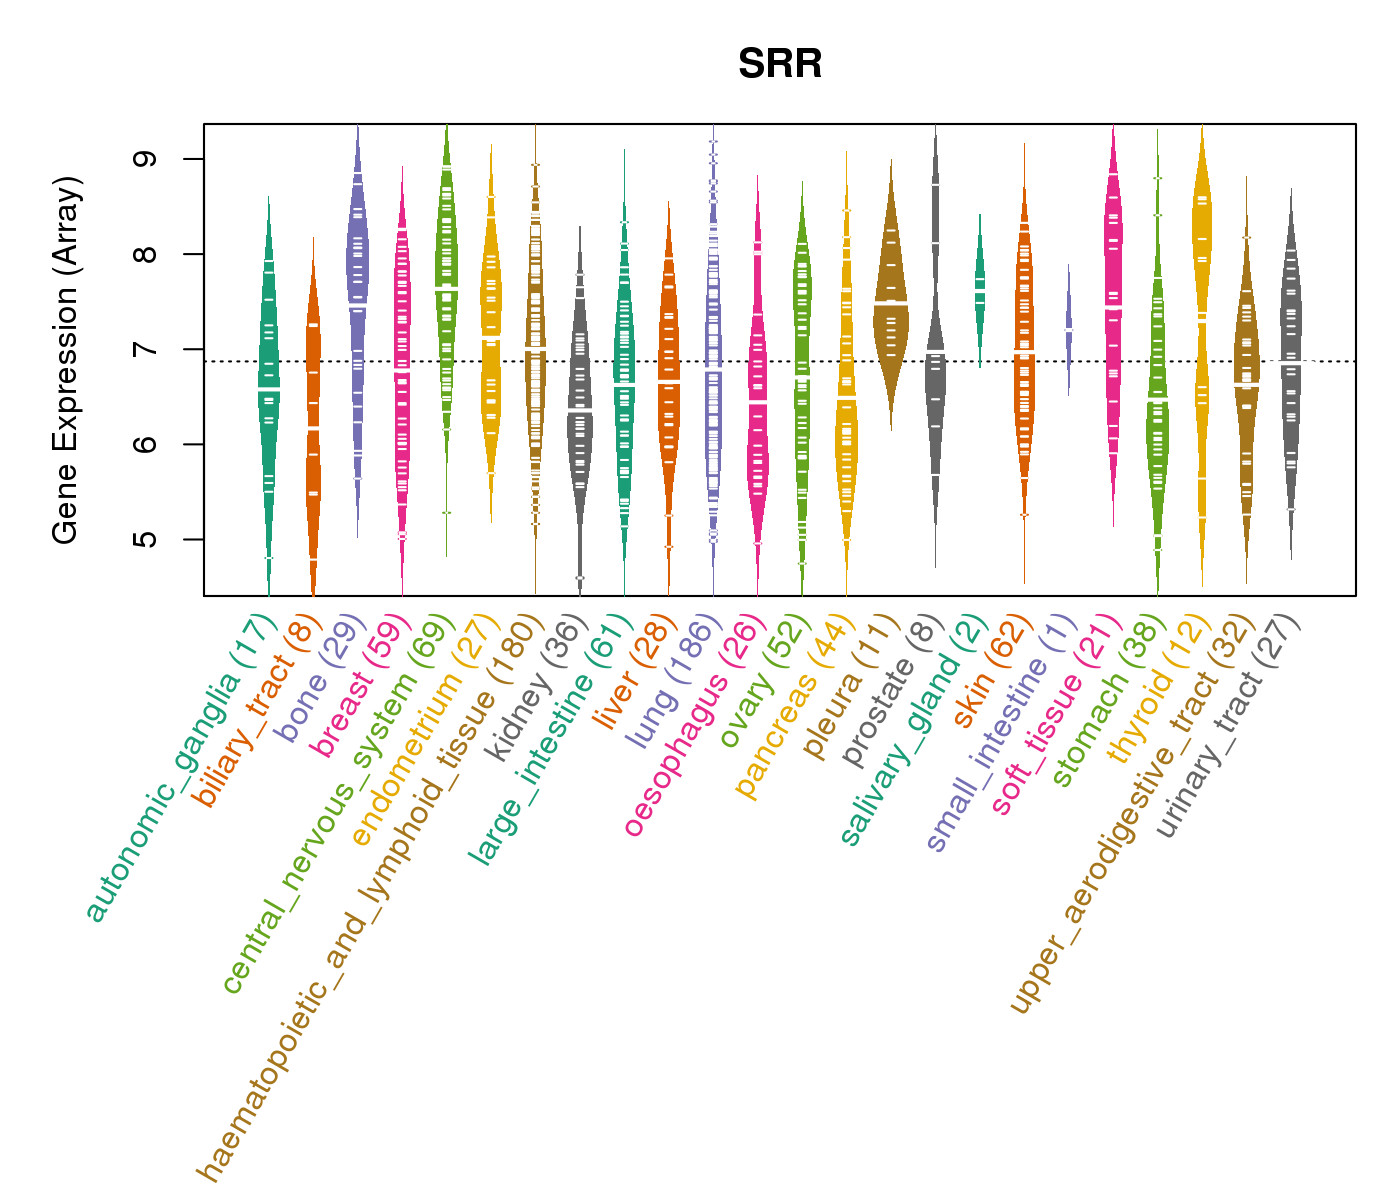
| Gene Expression for SRR |
| * CCLE gene expression data were extracted from CCLE_Expression_Entrez_2012-10-18.res: Gene-centric RMA-normalized mRNA expression data. |
 |
| * Normalized gene expression data of RNASeqV2 was extracted from TCGA using R package TCGA-Assembler. The URLs of all public data files on TCGA DCC data server were gathered at Jan-05-2015. Only eight cancer types have enough normal control samples for differential expression analysis. (t test, adjusted p<0.05 (using Benjamini-Hochberg FDR)) |
 |
| Top |
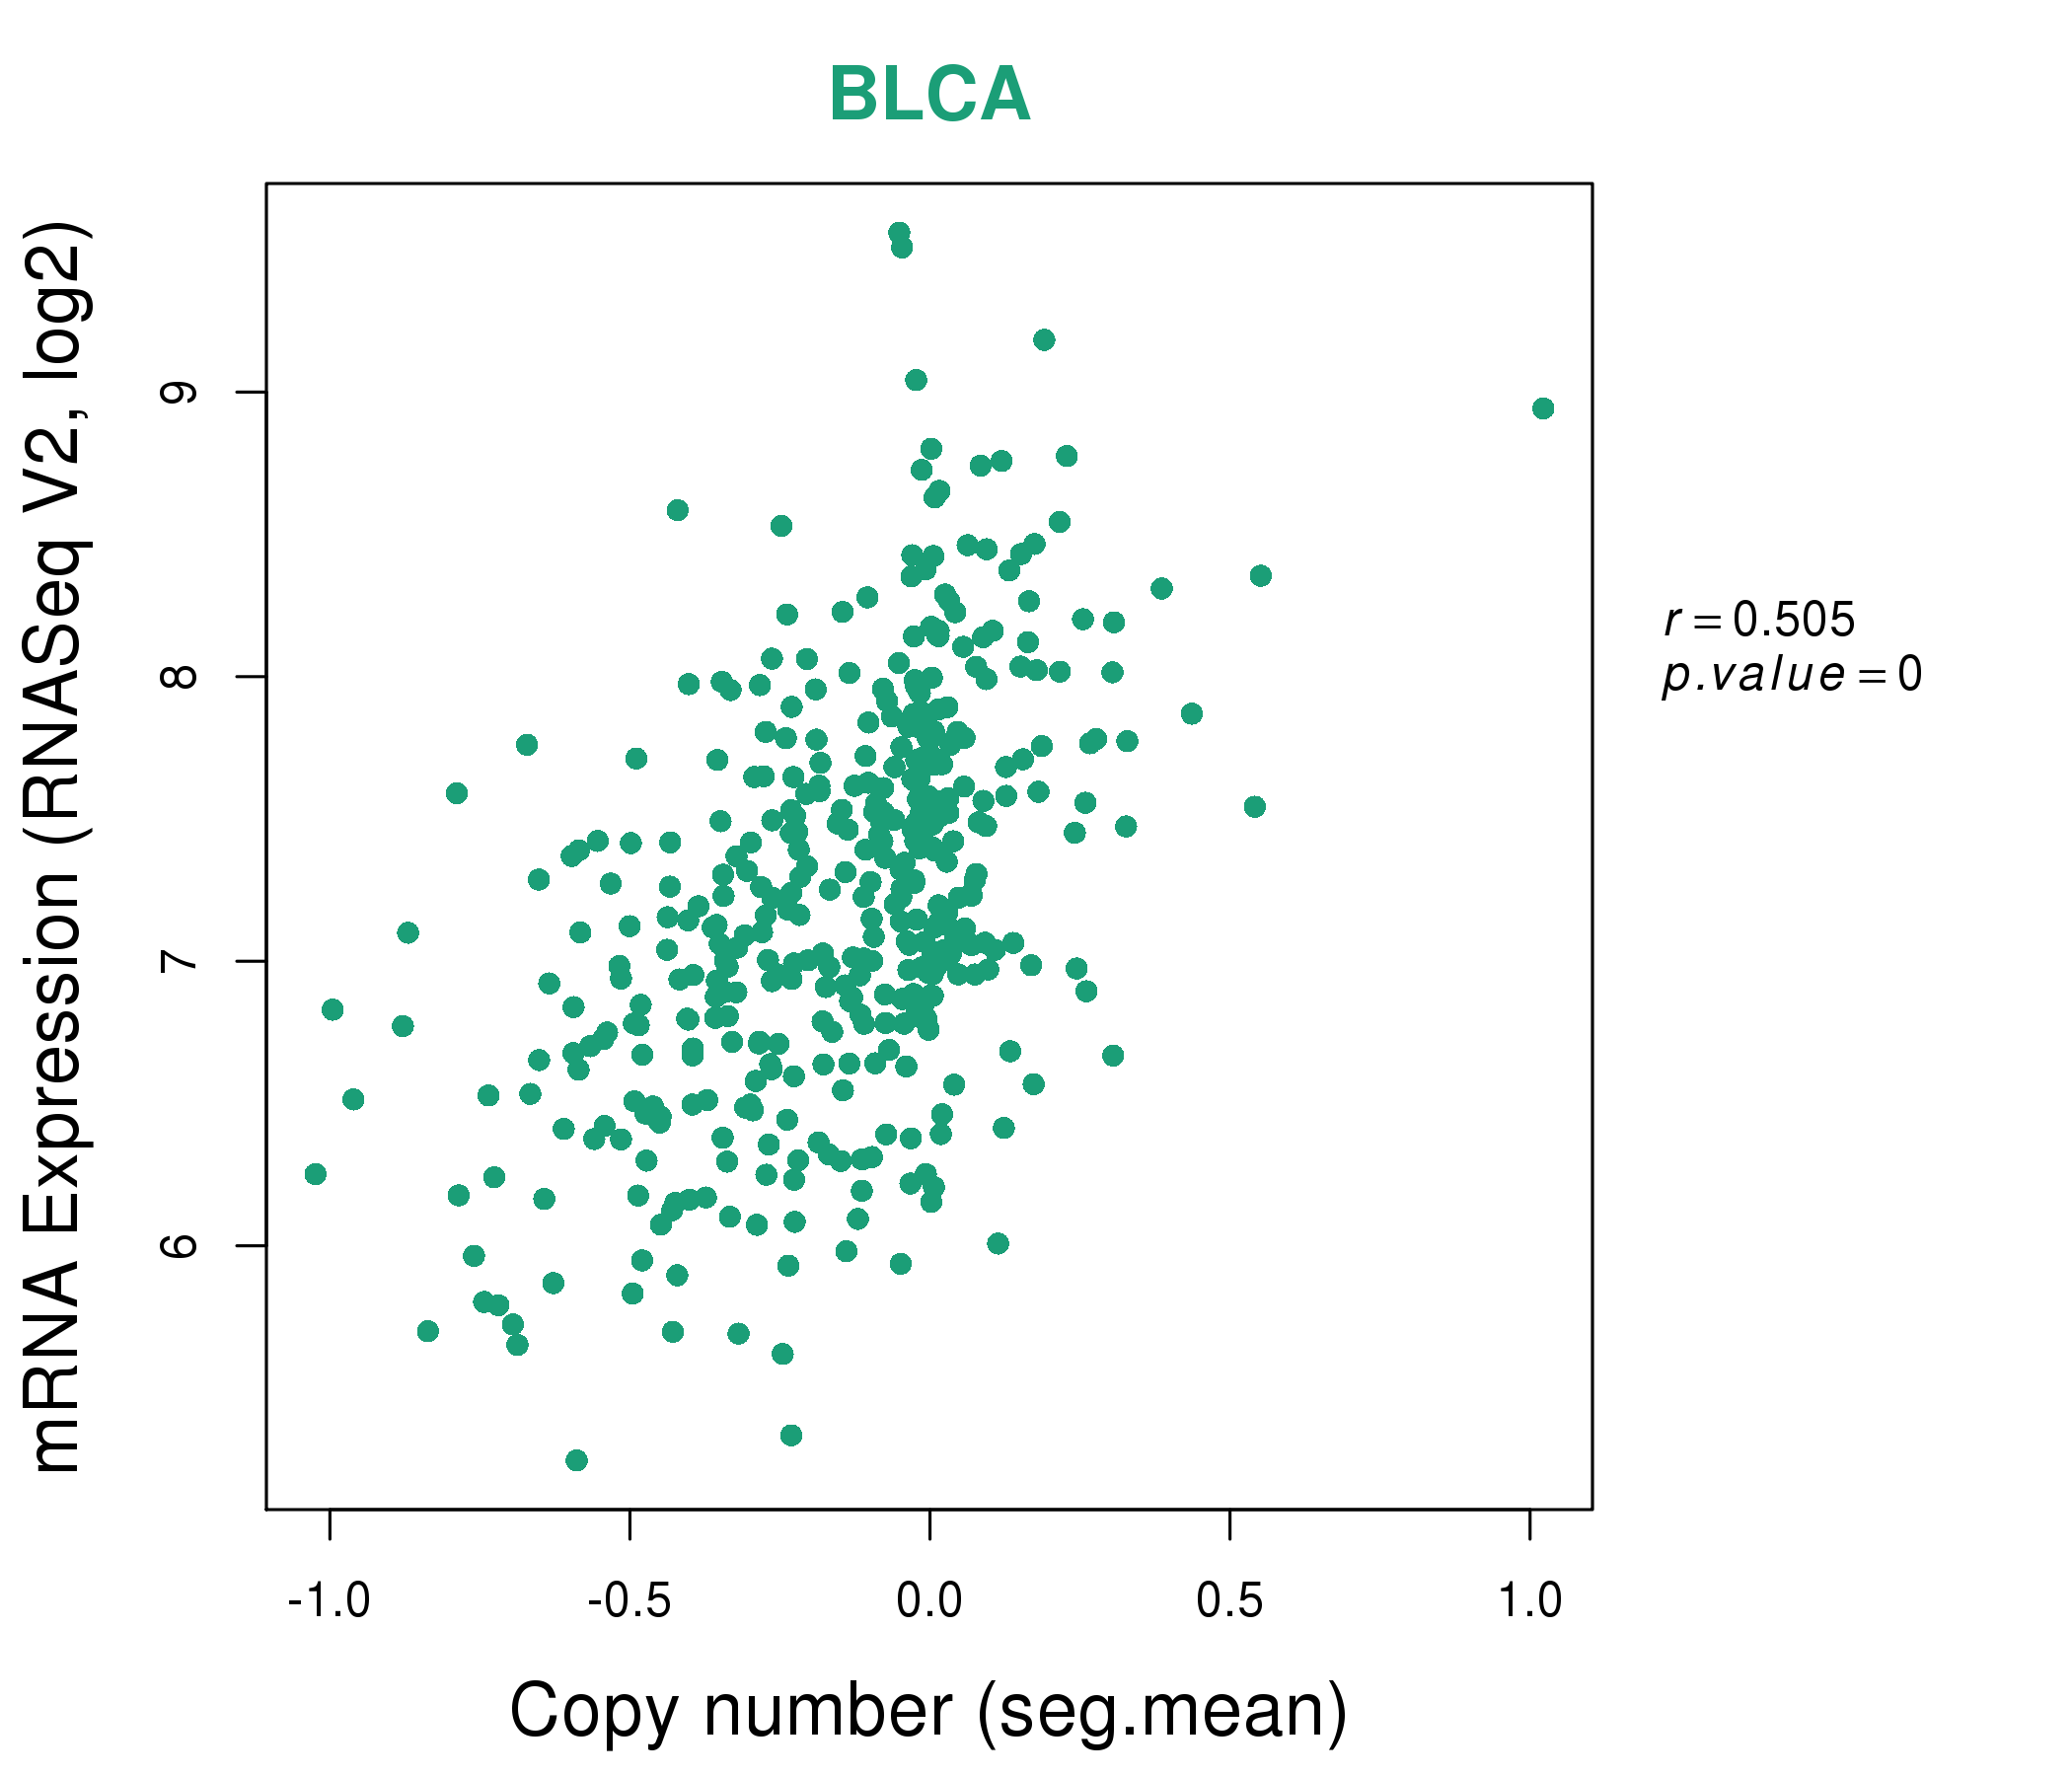
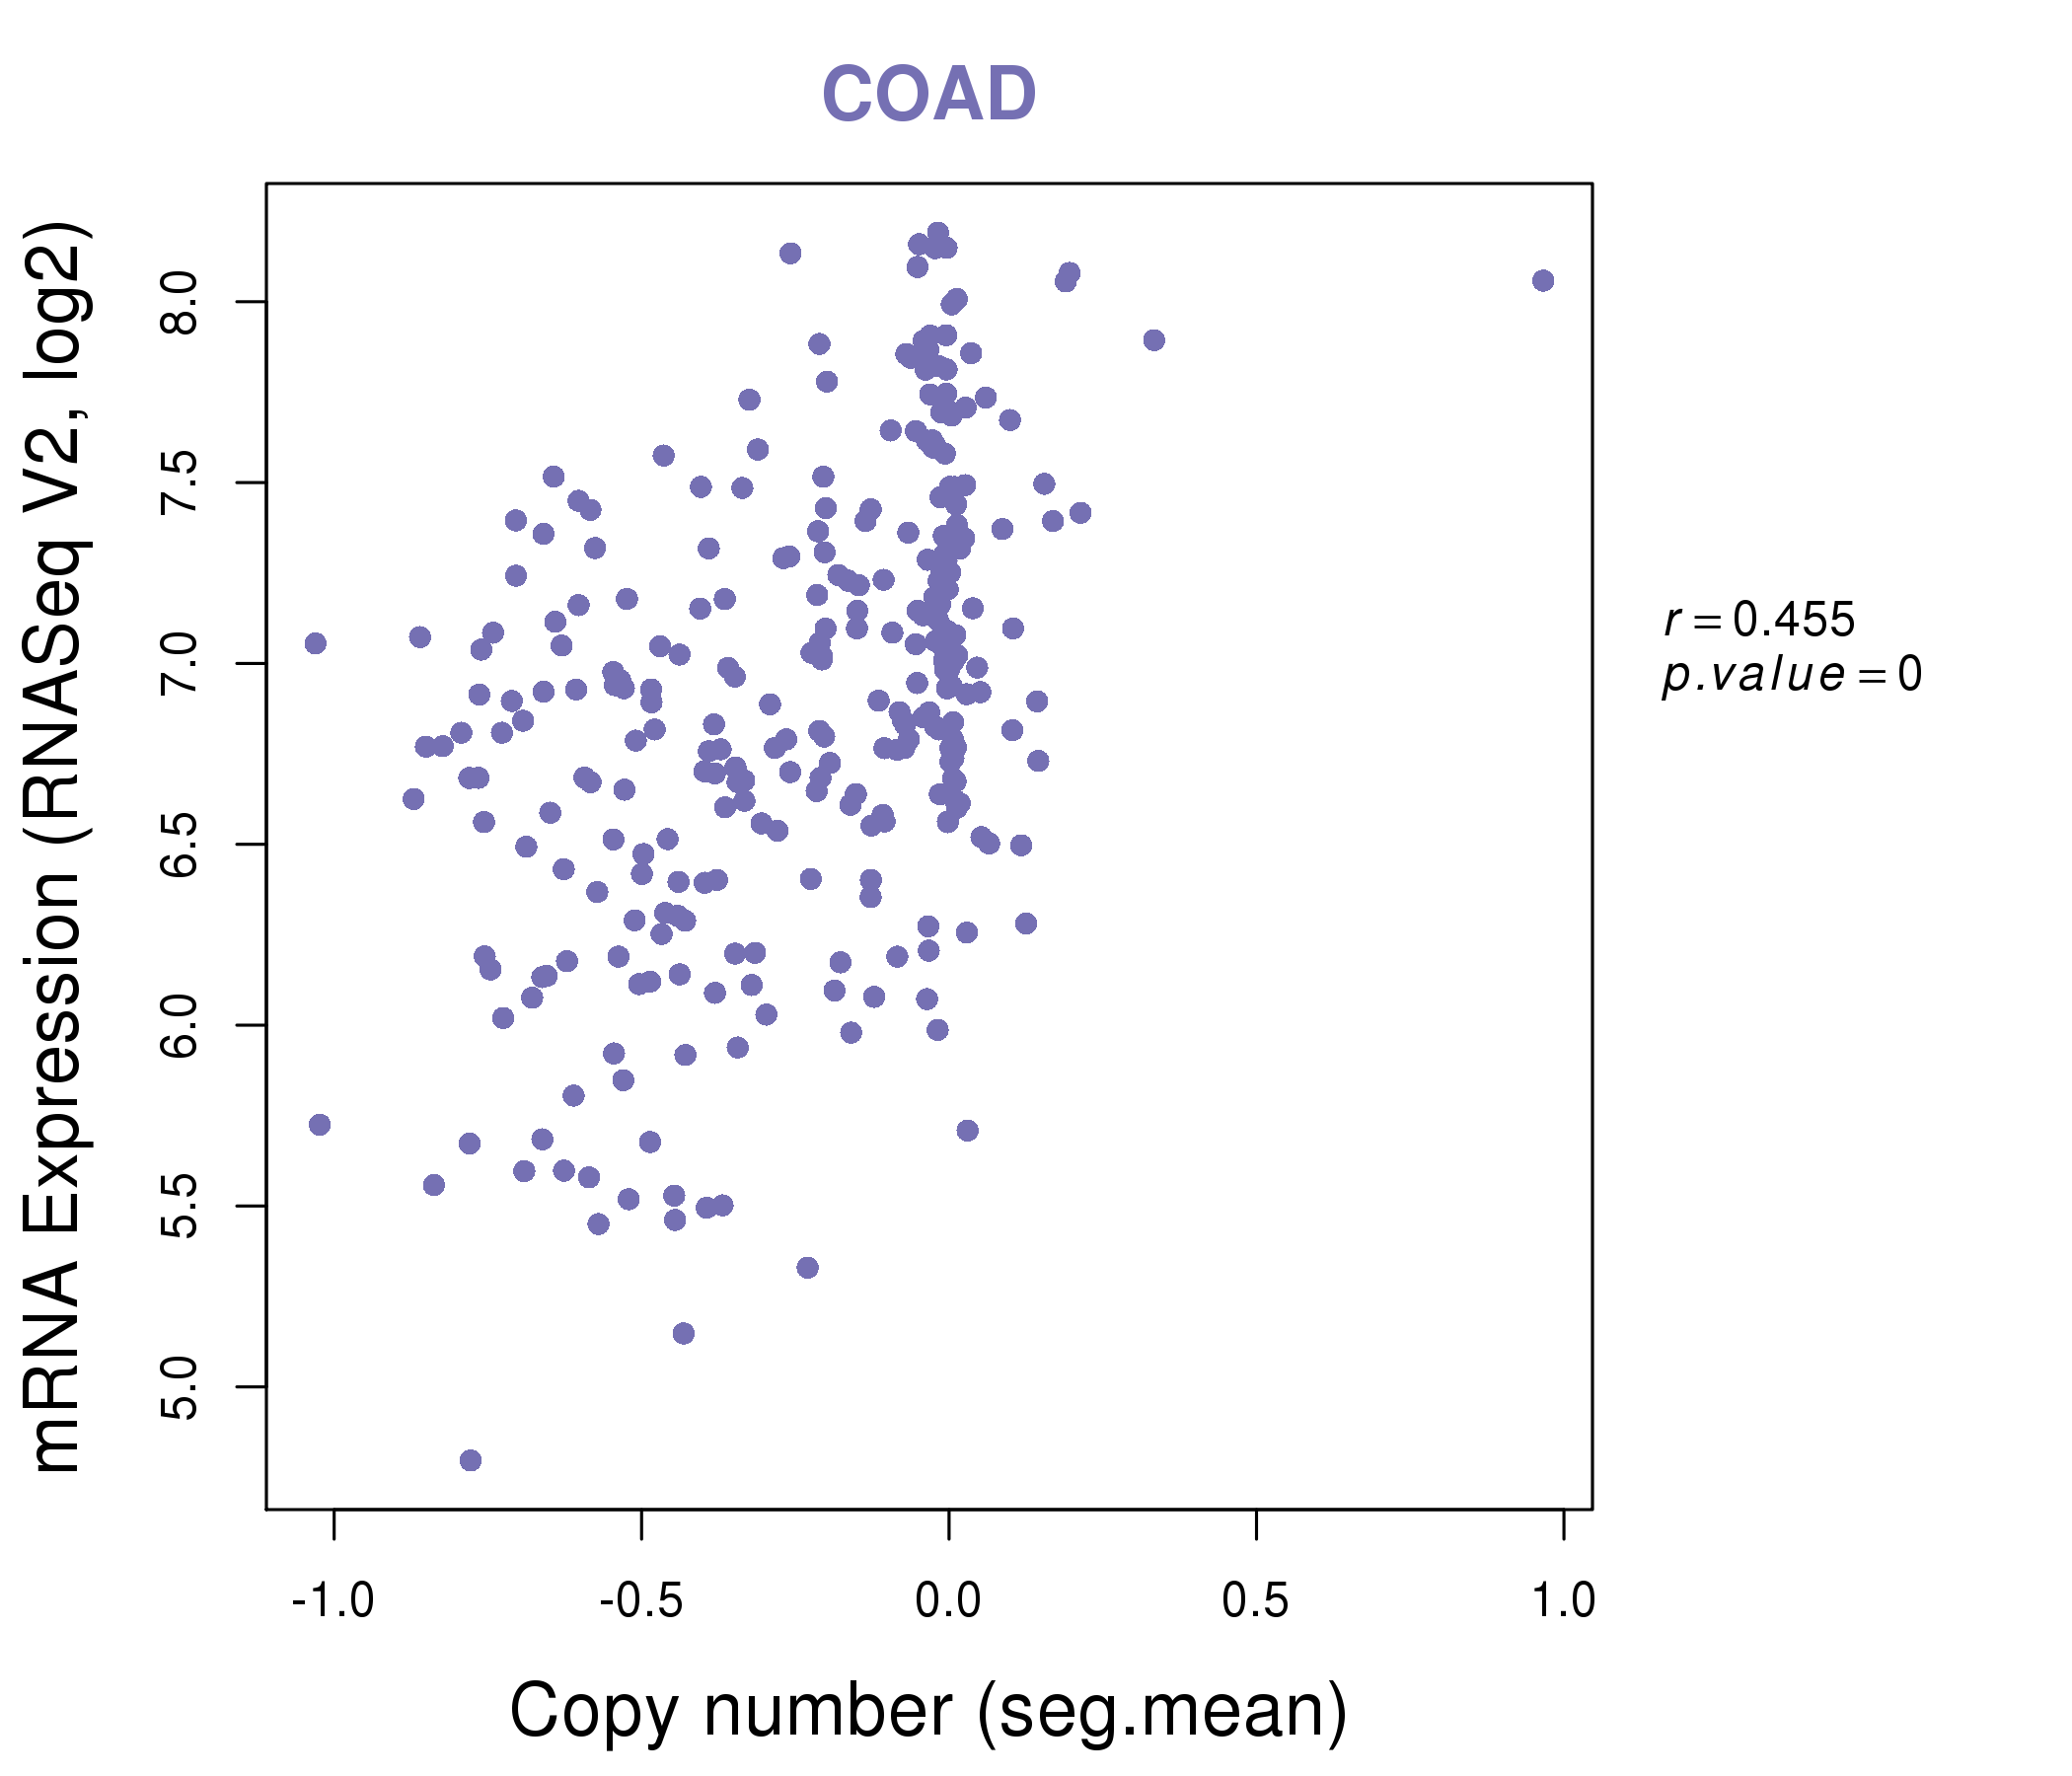
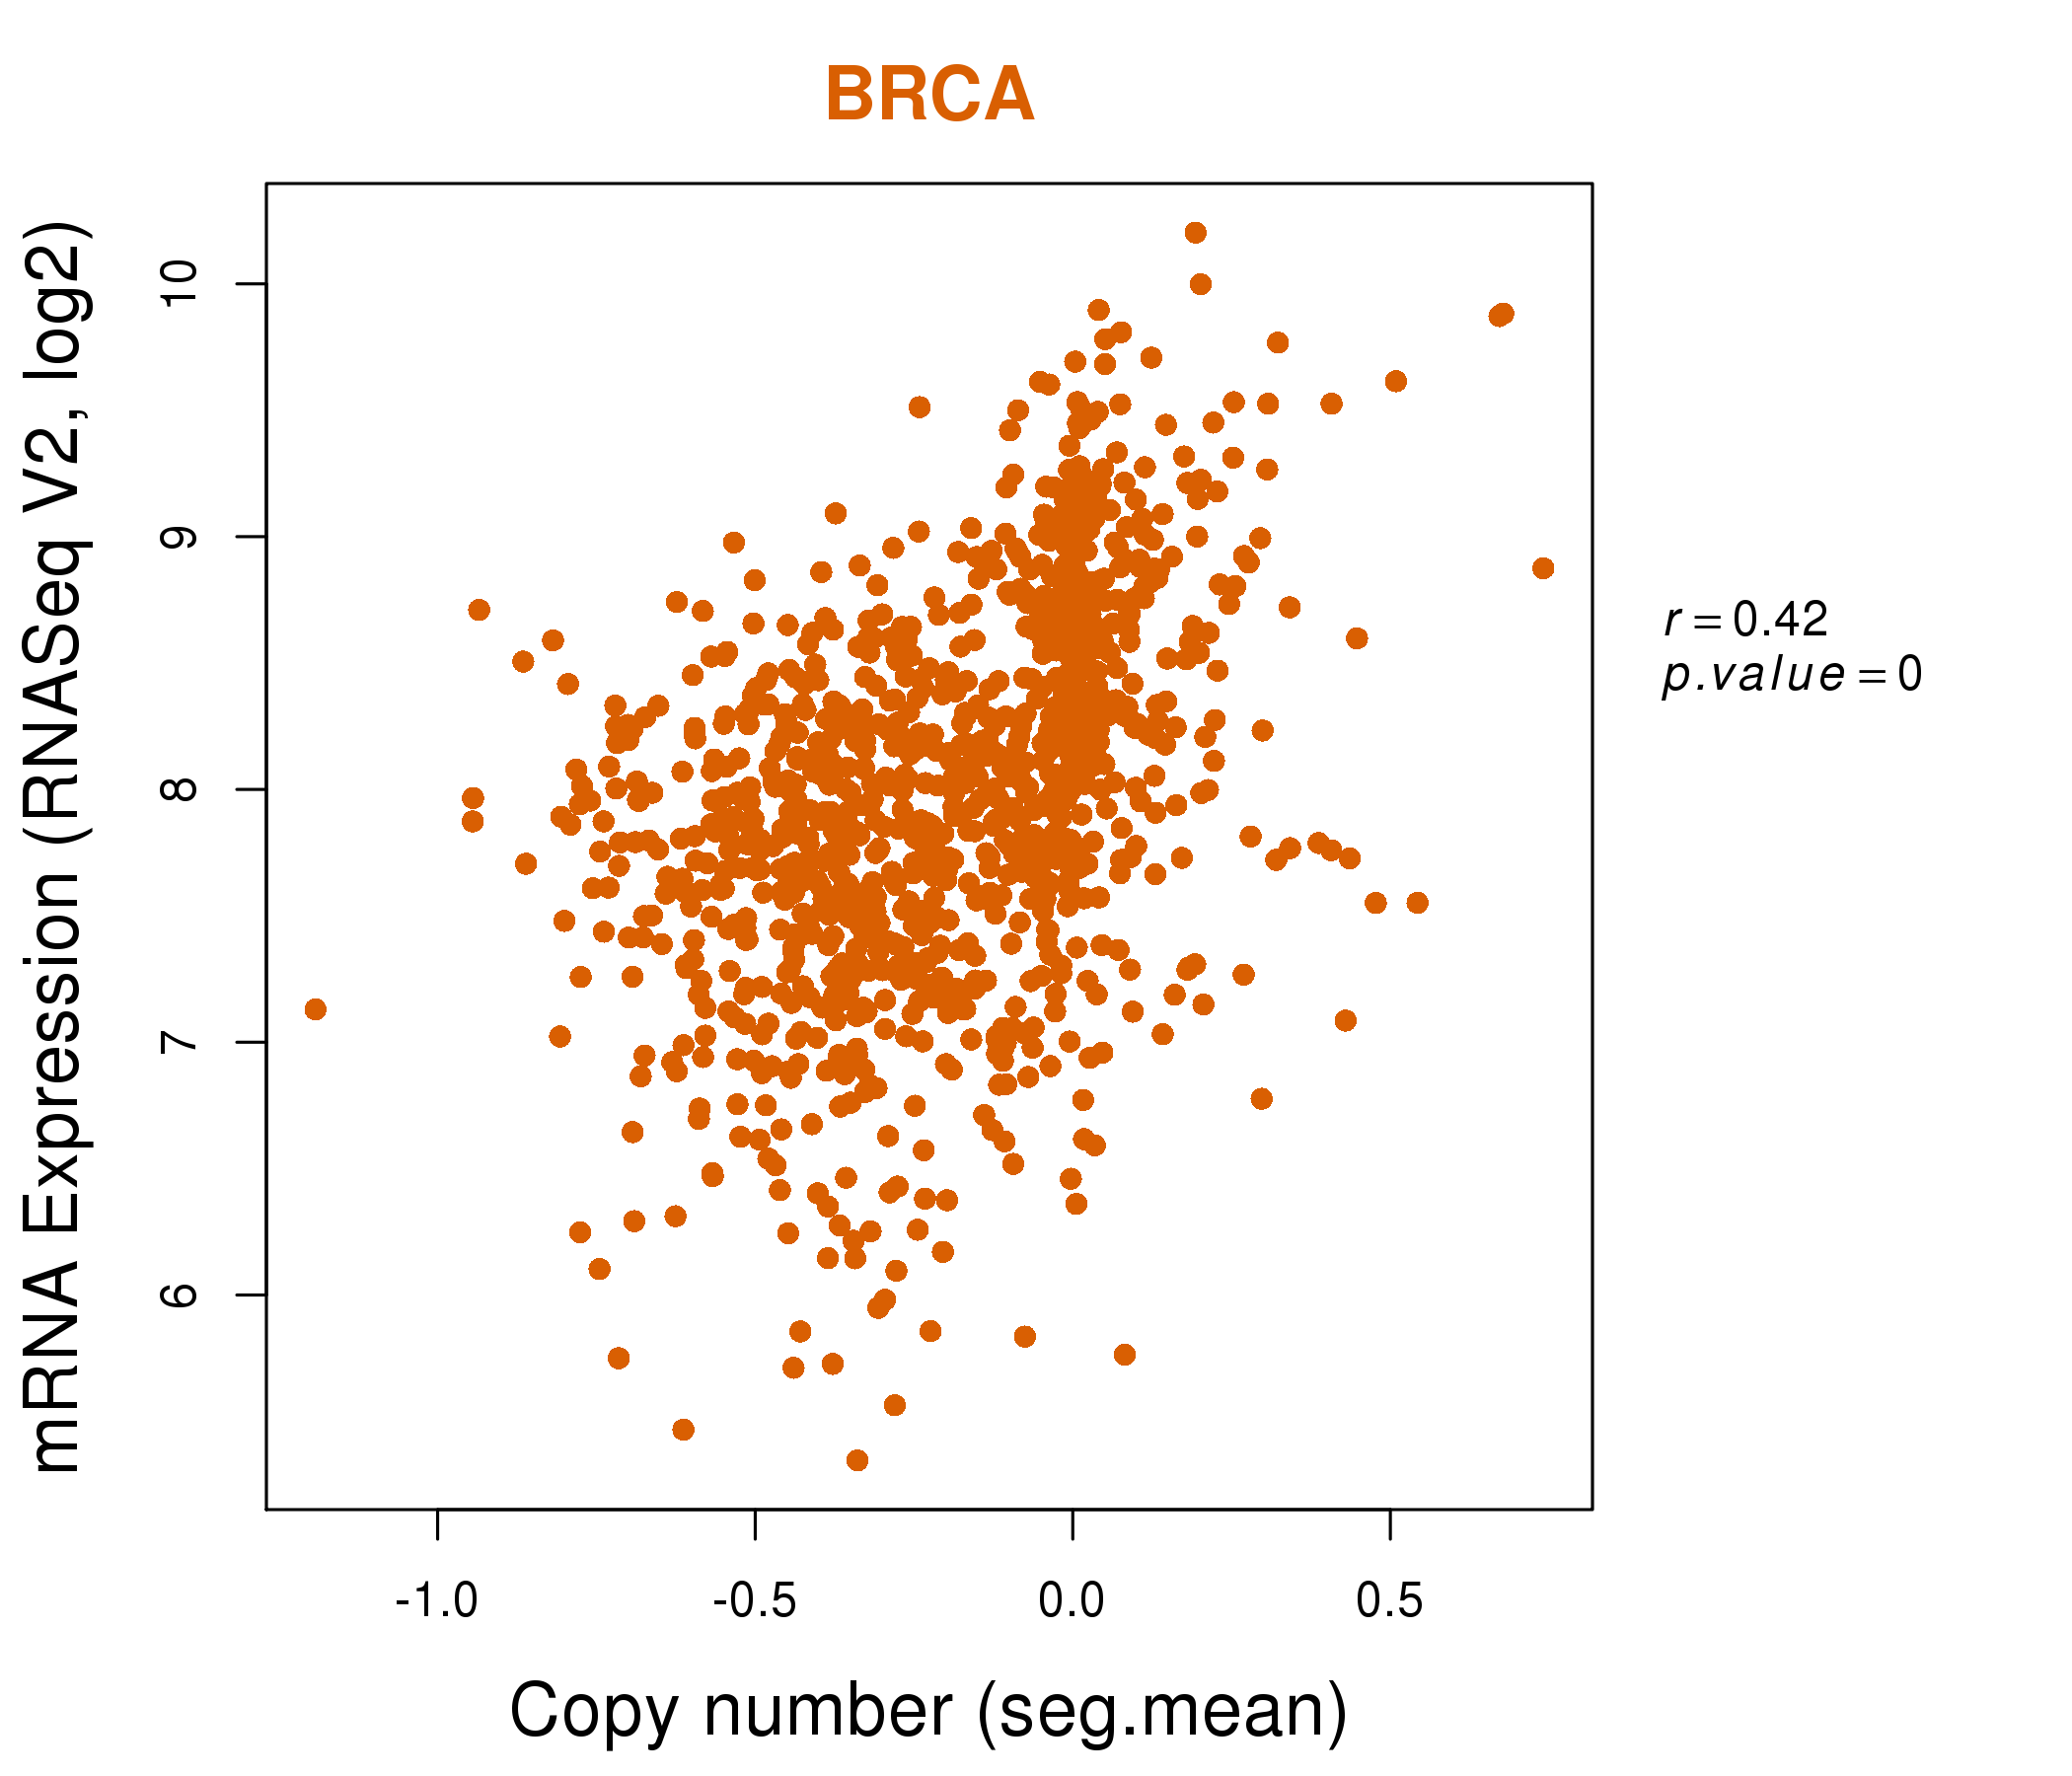
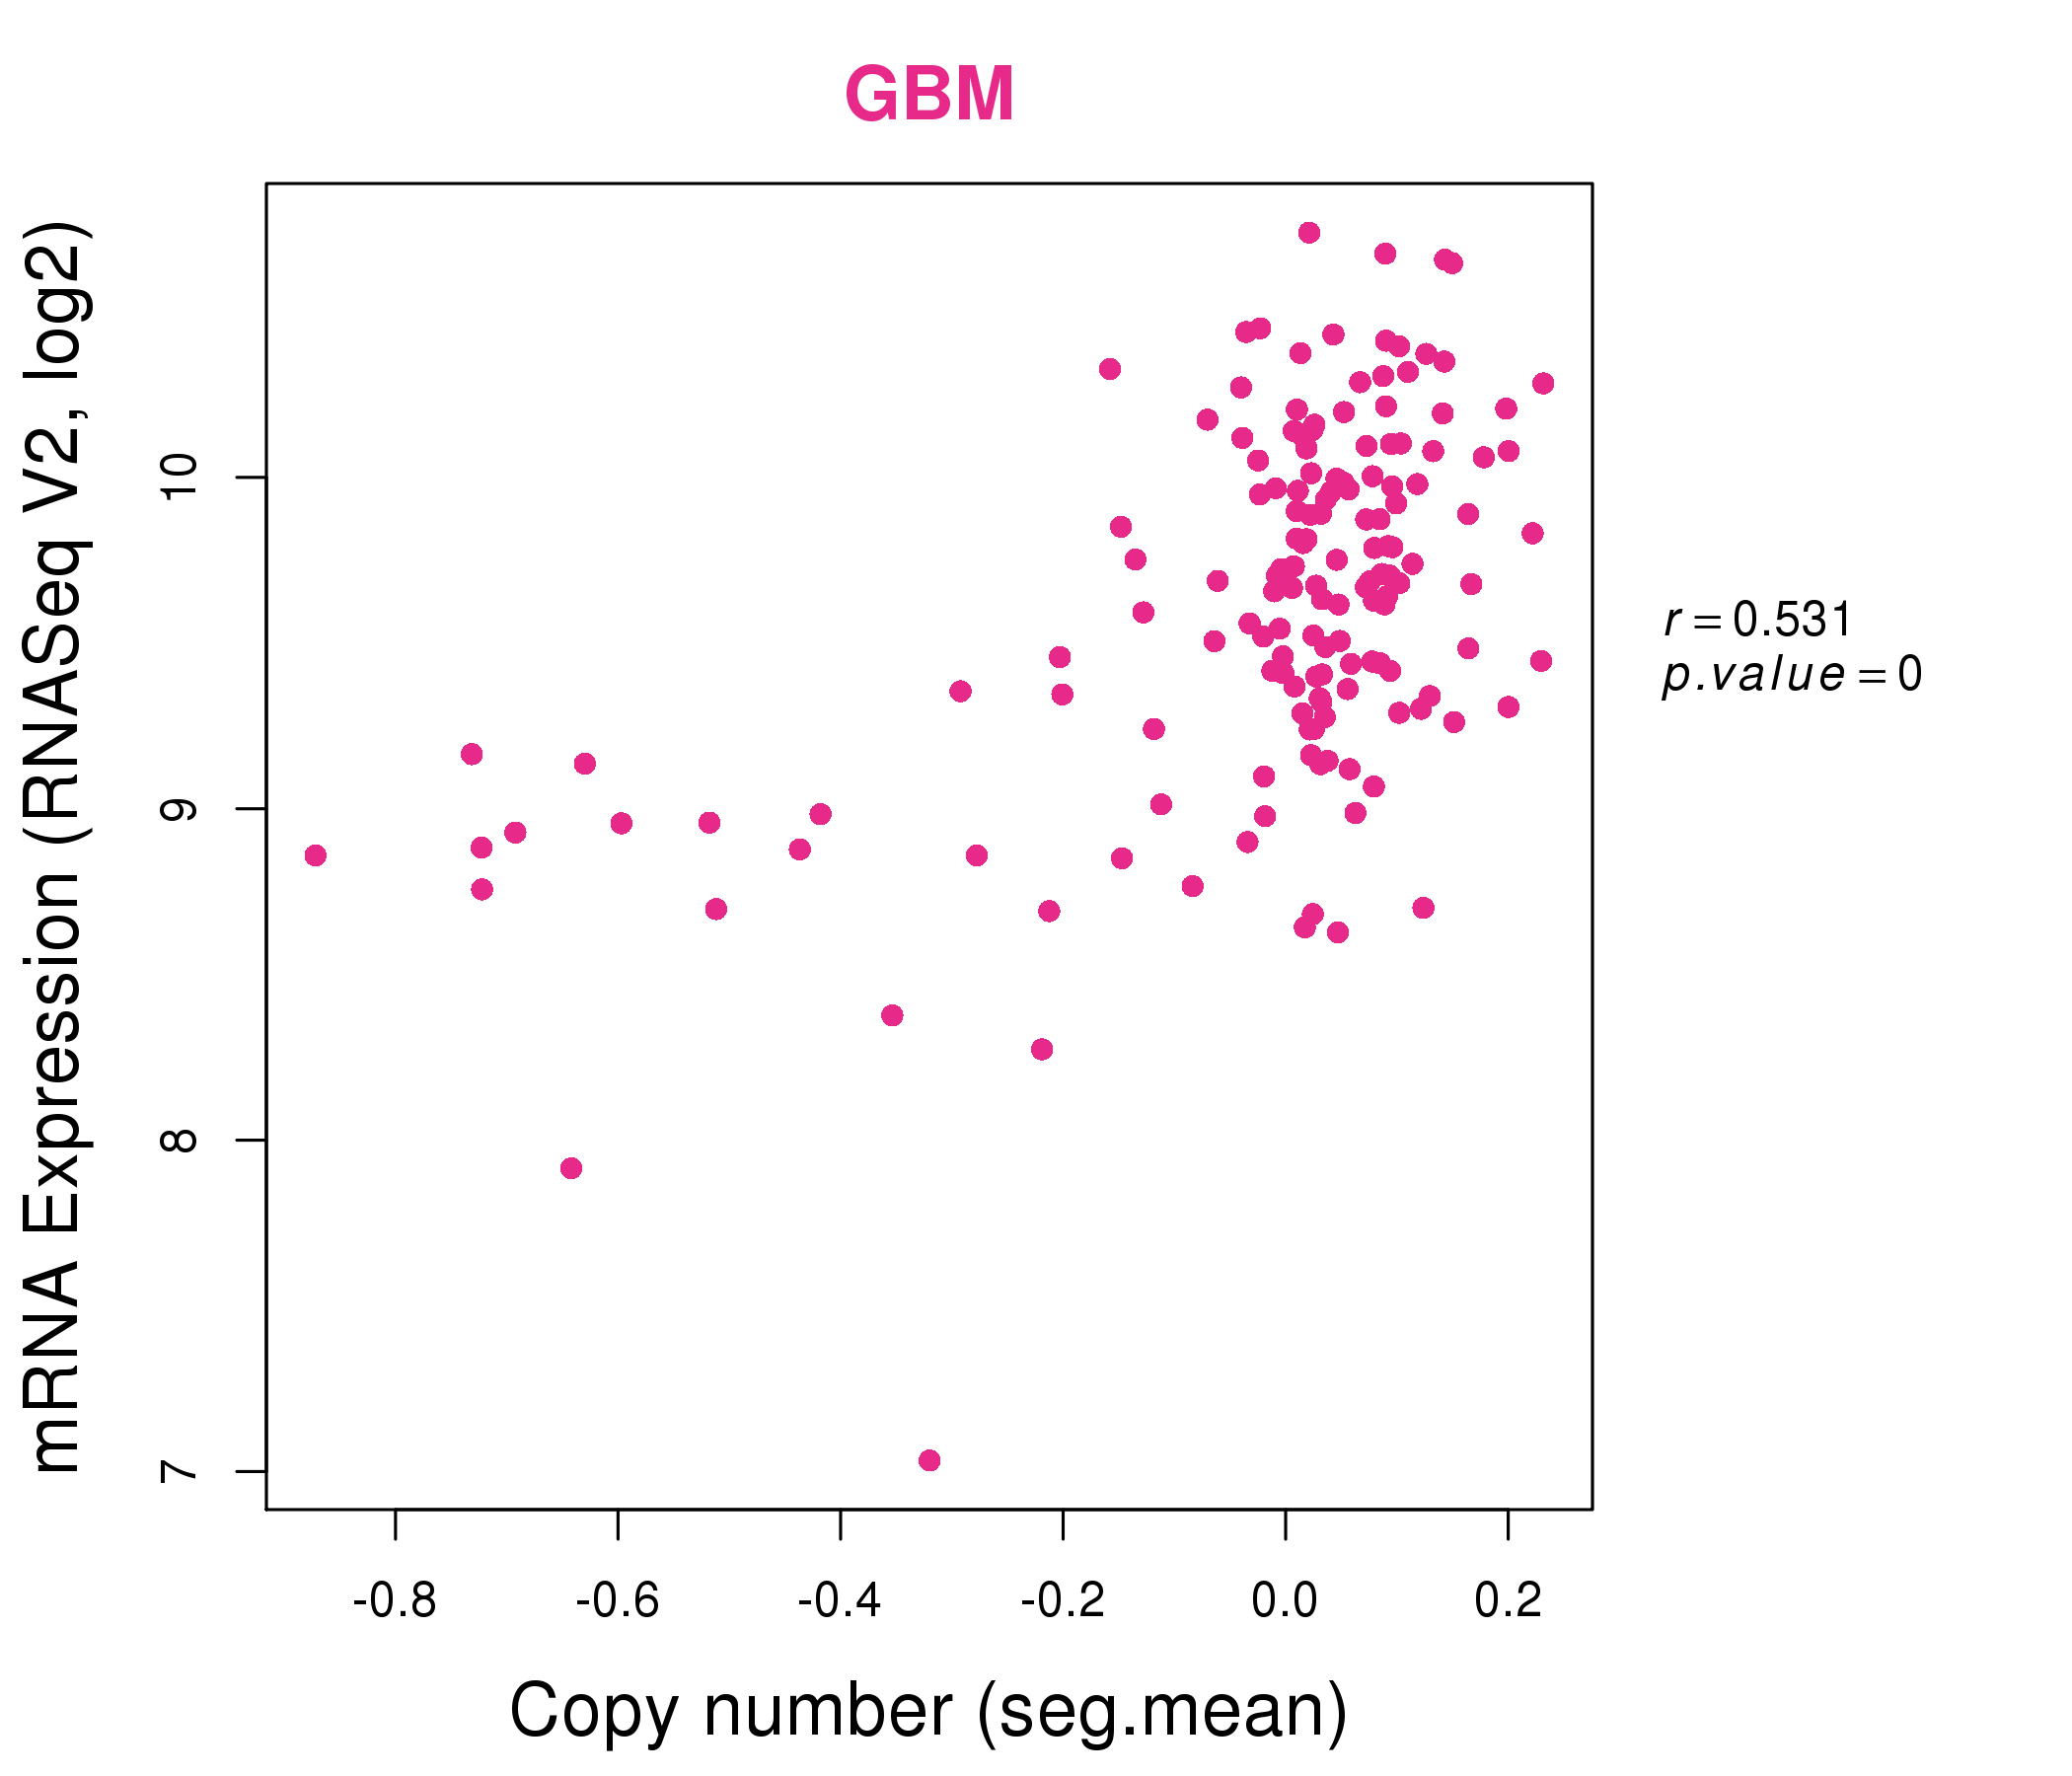
| * This plots show the correlation between CNV and gene expression. |
: Open all plots for all cancer types
 |
|
 |
|
| Top |
| Gene-Gene Network Information |
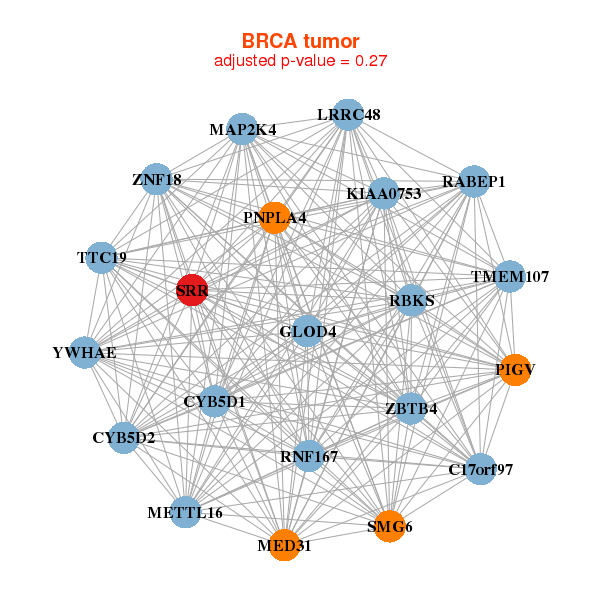
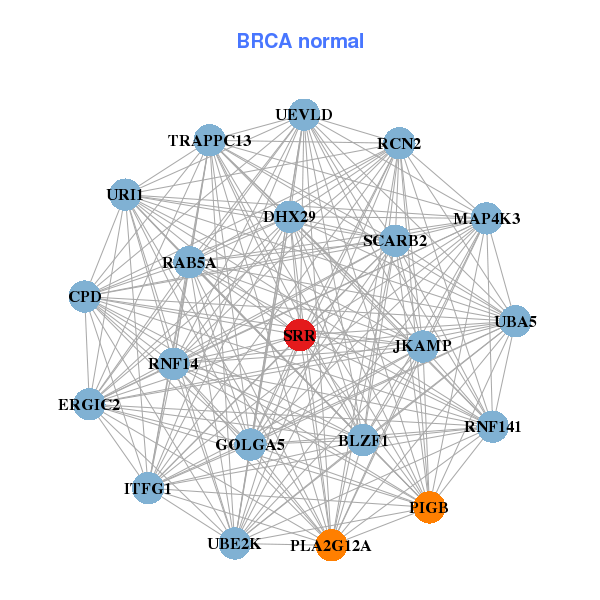
| * Co-Expression network figures were drawn using R package igraph. Only the top 20 genes with the highest correlations were shown. Red circle: input gene, orange circle: cell metabolism gene, sky circle: other gene |
: Open all plots for all cancer types
 |
| ||||
| C17orf97,CYB5D1,CYB5D2,GLOD4,KIAA0753,LRRC48,MAP2K4, MED31,METTL16,PIGV,PNPLA4,RABEP1,RBKS,RNF167, SMG6,SRR,TMEM107,TTC19,YWHAE,ZBTB4,ZNF18 | BLZF1,URI1,TRAPPC13,CPD,DHX29,ERGIC2,GOLGA5, ITFG1,JKAMP,MAP4K3,PIGB,PLA2G12A,RAB5A,RCN2, RNF141,RNF14,SCARB2,SRR,UBA5,UBE2K,UEVLD | ||||
 |
| ||||
| ATPAF2,C17orf49,C17orf85,COPS3,DERL2,EIF4A1,GLOD4, MED11,MIS12,OVCA2,PEMT,RNF167,RNMTL1,RPA1, SLC25A11,SRR,STX8,TIMM22,TXNL1,UBE2G1,YWHAE | ARL3,FAM229B,CFAP36,COX7A1,CUEDC2,EIF5A2,FAM195B, KCNMB2,KIAA0895,MSANTD4,KPNA5,LAYN,NKIRAS1,NME4, NME5,SNRPN,SRR,TCEAL1,TCEAL7,TCEAL8,TMEM17 |
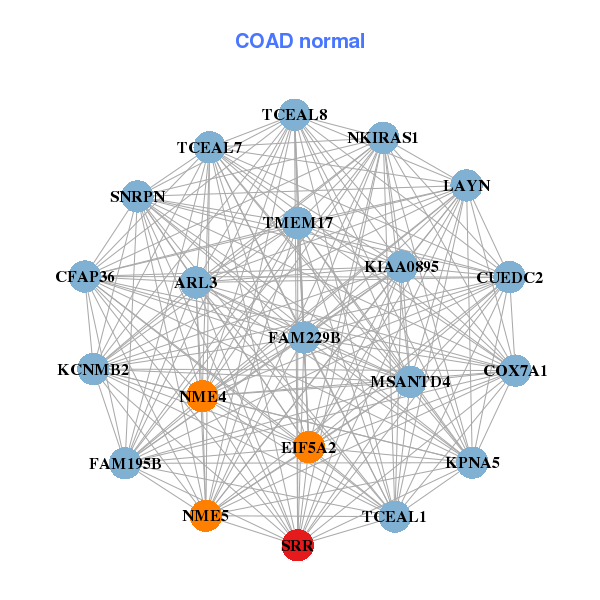
| * Co-Expression network figures were drawn using R package igraph. Only the top 20 genes with the highest correlations were shown. Red circle: input gene, orange circle: cell metabolism gene, sky circle: other gene |
: Open all plots for all cancer types
| Top |
: Open all interacting genes' information including KEGG pathway for all interacting genes from DAVID
| Top |
| Pharmacological Information for SRR |
| DB Category | DB Name | DB's ID and Url link |
| * Gene Centered Interaction Network. |
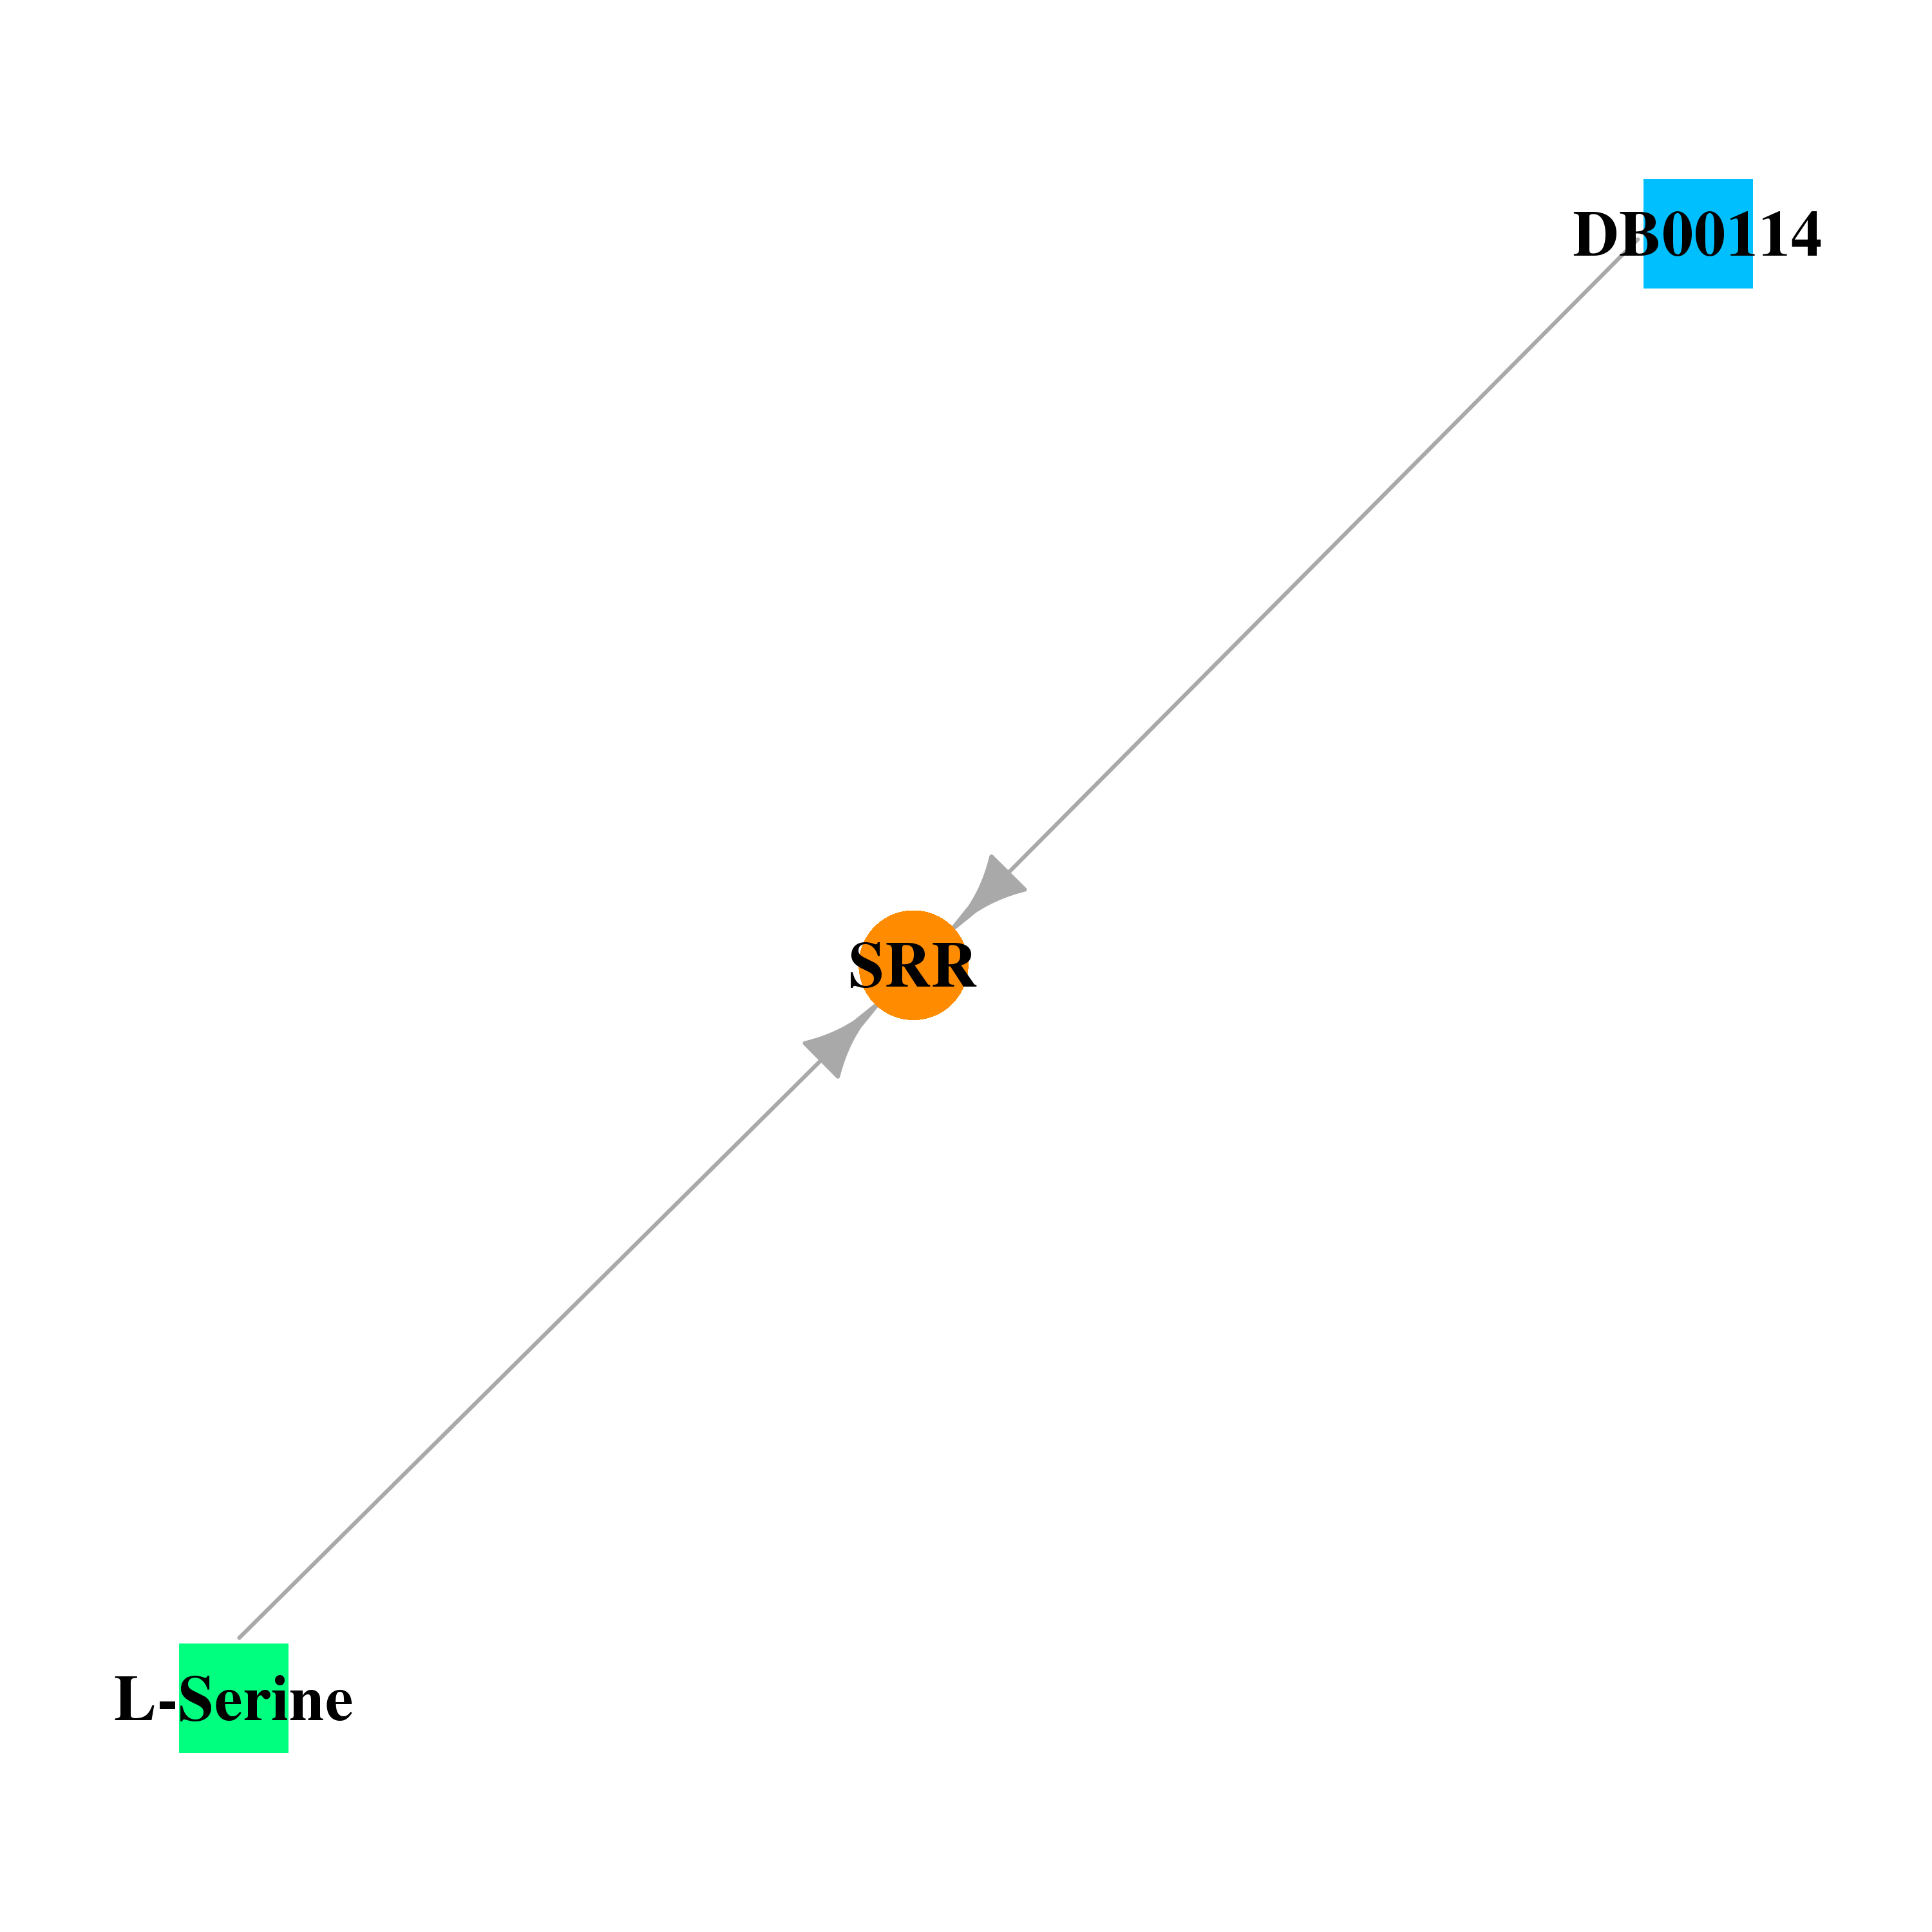 |
| * Drug Centered Interaction Network. |
| DrugBank ID | Target Name | Drug Groups | Generic Name | Drug Centered Network | Drug Structure |
| DB00114 | serine racemase | nutraceutical | Pyridoxal Phosphate |  |  |
| DB00133 | serine racemase | approved; nutraceutical | L-Serine | 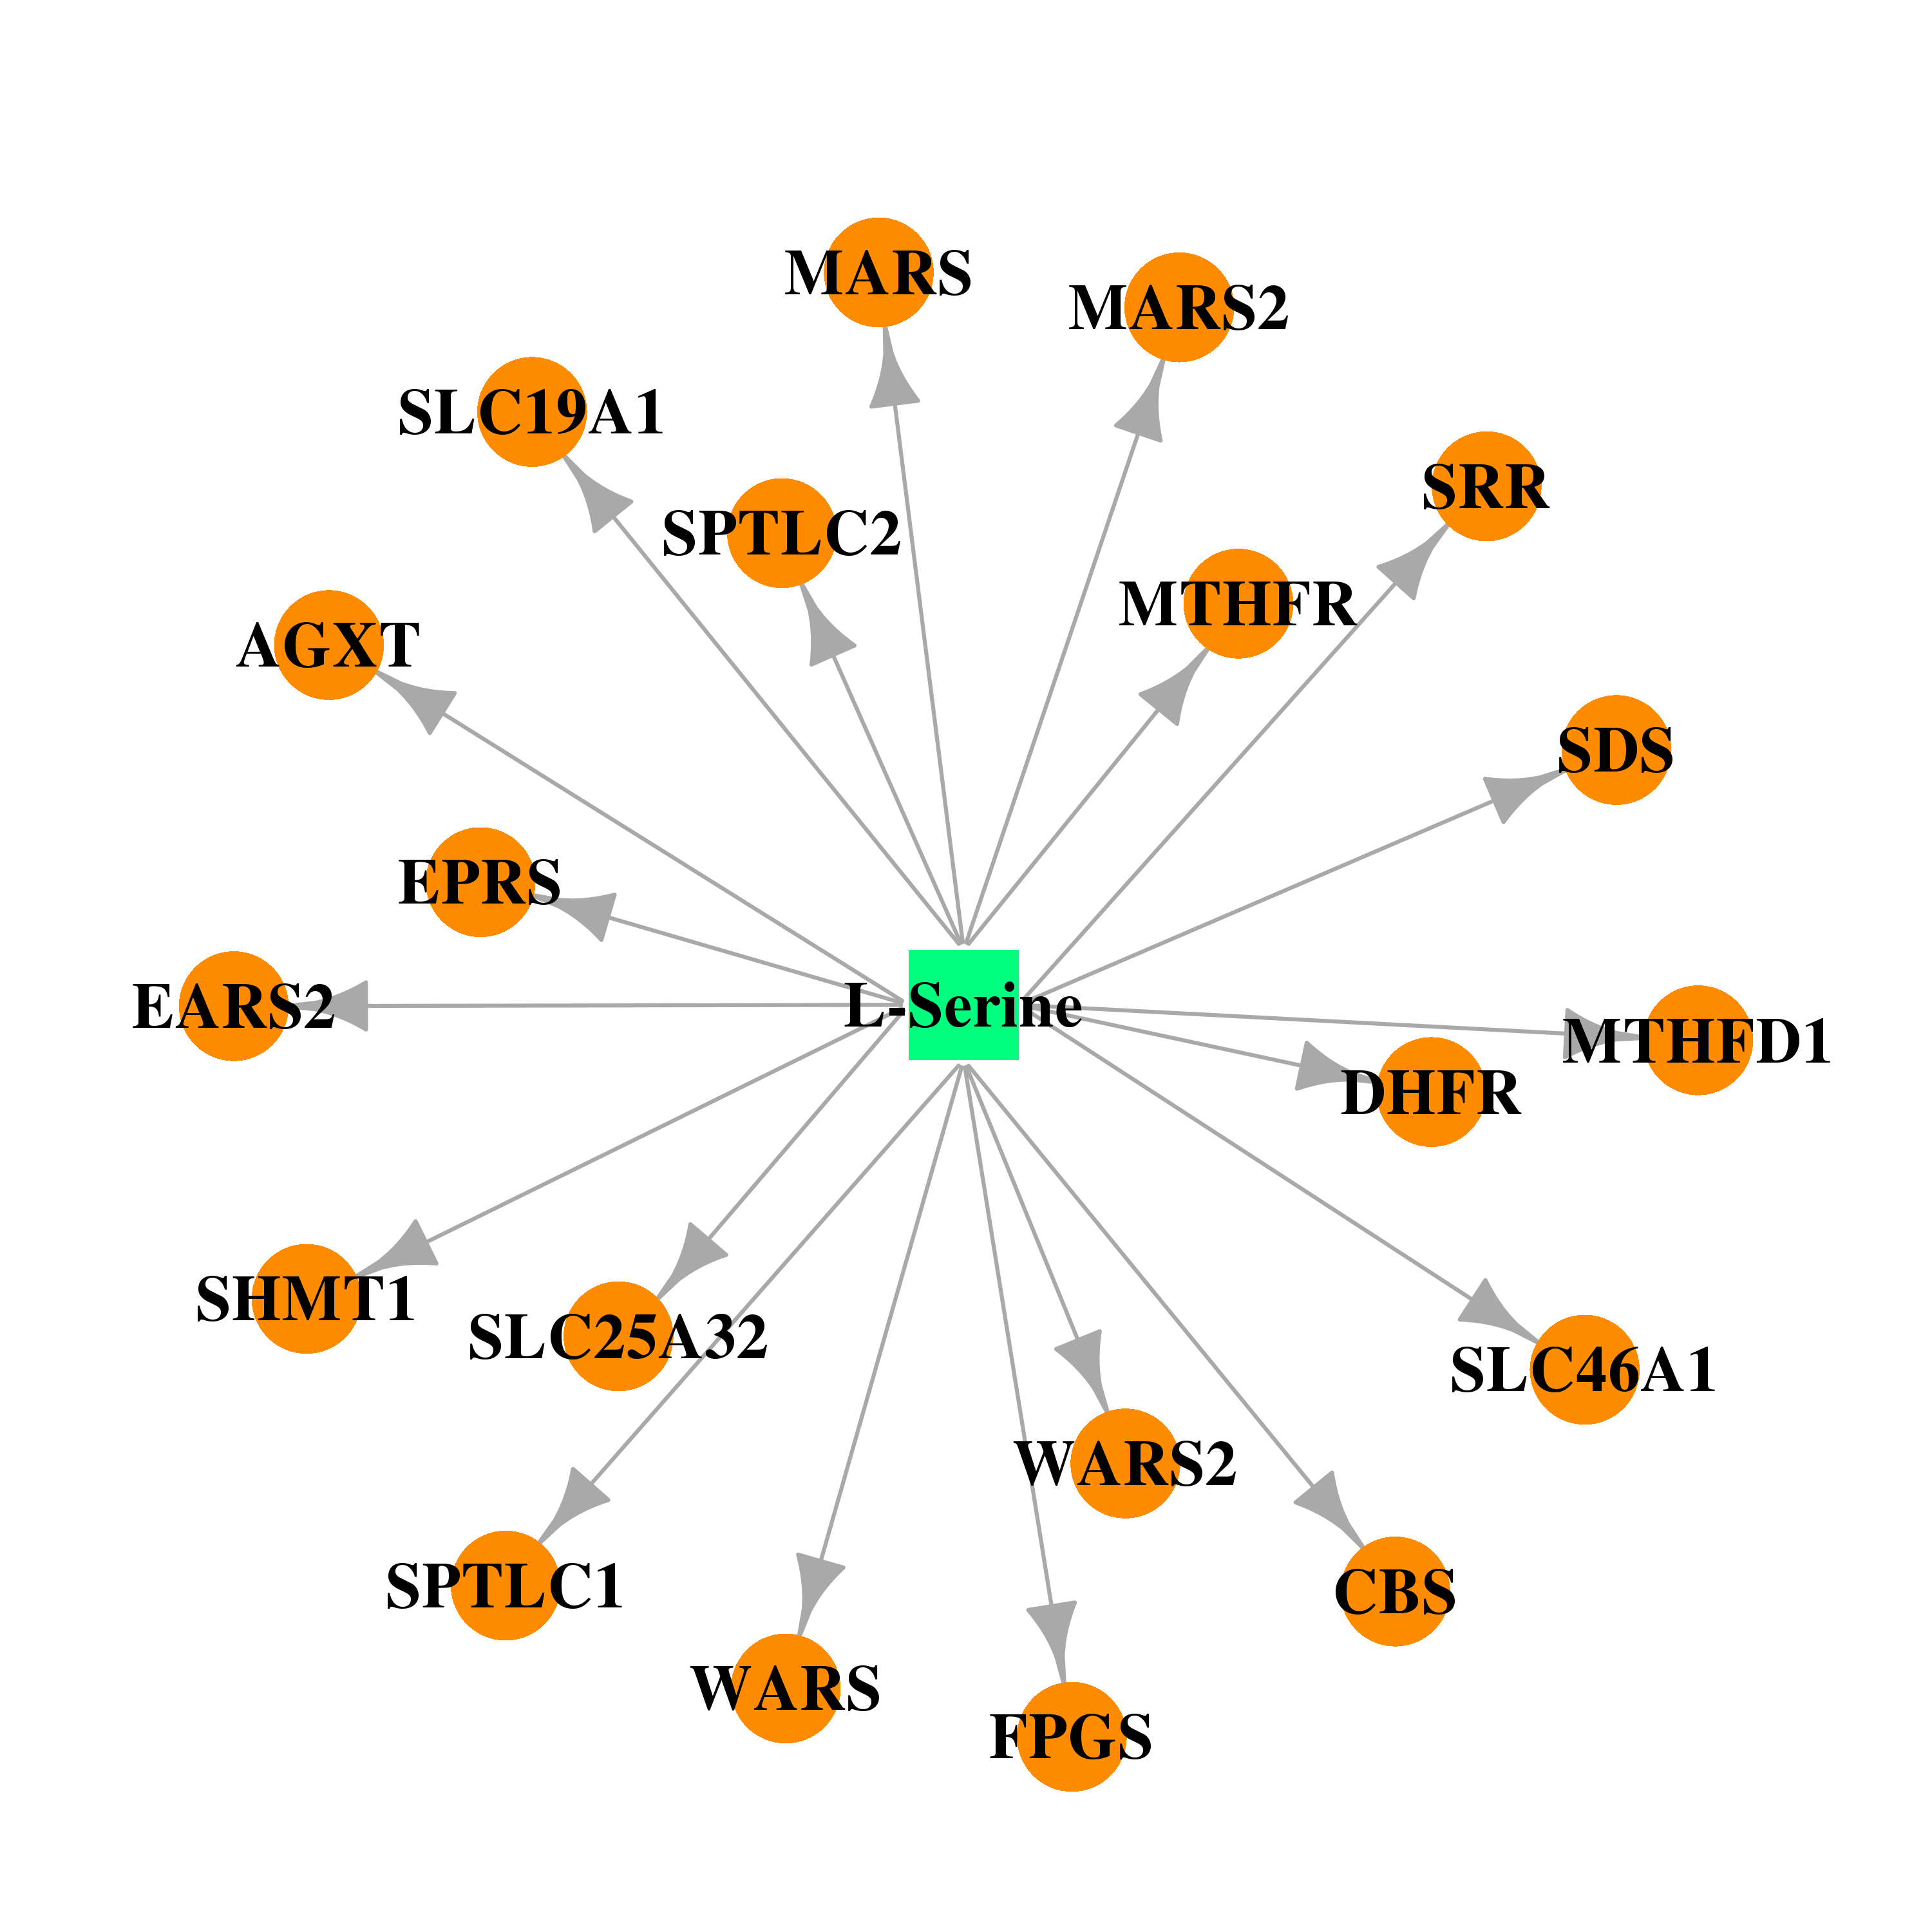 | 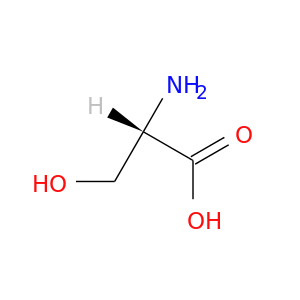 |
| Top |
| Cross referenced IDs for SRR |
| * We obtained these cross-references from Uniprot database. It covers 150 different DBs, 18 categories. http://www.uniprot.org/help/cross_references_section |
: Open all cross reference information
|
Copyright © 2016-Present - The Univsersity of Texas Health Science Center at Houston @ |