|
|||||||||||||||||||||||||||||||||||||||||||||||||||||||||||||||||||||||||||||||||||||||||||||||||||||||||||||||||||||||||||||||||||||||||||||||||||||||||||||||||||||||||||||||||||||||||||||||||||||||||||||||||||||||||||||||||||||||||||||||||||||||||||||||||||||||||||||||||||||||||||||||||||||||||||||||||||||||||||||||||||||||||||||||||||||||||||||||
| |
| Phenotypic Information (metabolism pathway, cancer, disease, phenome) |
| |
| |
| Gene-Gene Network Information: Co-Expression Network, Interacting Genes & KEGG |
| |
|


| Gene Summary for SDHC |
| Basic gene info. | Gene symbol | SDHC |
| Gene name | succinate dehydrogenase complex, subunit C, integral membrane protein, 15kDa | |
| Synonyms | CYB560|CYBL|PGL3|QPS1|SDH3 | |
| Cytomap | UCSC genome browser: 1q23.3 | |
| Genomic location | chr1 :161284165-161334535 | |
| Type of gene | protein-coding | |
| RefGenes | NM_001035511.1, NM_001035512.1,NM_001035513.1,NM_001278172.1,NM_003001.3, NR_103459.1, | |
| Ensembl id | ENSG00000143252 | |
| Description | cytochrome B large subunit of complex IIintegral membrane protein CII-3bsuccinate dehydrgenase cytochrome bsuccinate dehydrogenase 3, integral membrane subunitsuccinate dehydrogenase complex, subunit C, integral membrane protein, 15kDsuccinate dehydr | |
| Modification date | 20141219 | |
| dbXrefs | MIM : 602413 | |
| HGNC : HGNC | ||
| HPRD : 03878 | ||
| Protein | UniProt: Q99643 go to UniProt's Cross Reference DB Table | |
| Expression | CleanEX: HS_SDHC | |
| BioGPS: 6391 | ||
| Gene Expression Atlas: ENSG00000143252 | ||
| The Human Protein Atlas: ENSG00000143252 | ||
| Pathway | NCI Pathway Interaction Database: SDHC | |
| KEGG: SDHC | ||
| REACTOME: SDHC | ||
| ConsensusPathDB | ||
| Pathway Commons: SDHC | ||
| Metabolism | MetaCyc: SDHC | |
| HUMANCyc: SDHC | ||
| Regulation | Ensembl's Regulation: ENSG00000143252 | |
| miRBase: chr1 :161,284,165-161,334,535 | ||
| TargetScan: NM_001035511 | ||
| cisRED: ENSG00000143252 | ||
| Context | iHOP: SDHC | |
| cancer metabolism search in PubMed: SDHC | ||
| UCL Cancer Institute: SDHC | ||
| Assigned class in ccmGDB | A - This gene has a literature evidence and it belongs to cancer gene. | |
| References showing role of SDHC in cancer cell metabolism | 1. Baysal BE (2003) On the association of succinate dehydrogenase mutations with hereditary paraganglioma. Trends in Endocrinology & Metabolism 14: 453-459. go to article | |
| Top |
| Phenotypic Information for SDHC(metabolism pathway, cancer, disease, phenome) |
| Cancer | CGAP: SDHC |
| Familial Cancer Database: SDHC | |
| * This gene is included in those cancer gene databases. |
|
|
|
|
|
|
| |||||||||||||||||||||||||||||||||||||||||||||||||||||||||||||||||||||||||||||||||||||||||||||||||||||||||||||||||||||||||||||||||||||||||||||||||||||||||||||||||||||||||||||||||||||||||||||||||||||||||||||||||||||||||||||||||||||||||||||||||||||||||||||||||||||||||||||||||||||||||||||||||||||||||||||||||||||||||||||||||||||||||||||||||||||||||
Oncogene 1 | Significant driver gene in | ||||||||||||||||||||||||||||||||||||||||||||||||||||||||||||||||||||||||||||||||||||||||||||||||||||||||||||||||||||||||||||||||||||||||||||||||||||||||||||||||||||||||||||||||||||||||||||||||||||||||||||||||||||||||||||||||||||||||||||||||||||||||||||||||||||||||||||||||||||||||||||||||||||||||||||||||||||||||||||||||||||||||||||||||||||||||||||||
| cf) number; DB name 1 Oncogene; http://nar.oxfordjournals.org/content/35/suppl_1/D721.long, 2 Tumor Suppressor gene; https://bioinfo.uth.edu/TSGene/, 3 Cancer Gene Census; http://www.nature.com/nrc/journal/v4/n3/abs/nrc1299.html, 4 CancerGenes; http://nar.oxfordjournals.org/content/35/suppl_1/D721.long, 5 Network of Cancer Gene; http://ncg.kcl.ac.uk/index.php, 1Therapeutic Vulnerabilities in Cancer; http://cbio.mskcc.org/cancergenomics/statius/ |
| REACTOME_PYRUVATE_METABOLISM_AND_CITRIC_ACID_TCA_CYCLE | |
| OMIM | 602413; gene. 605373; phenotype. 606864; phenotype. |
| Orphanet | 201; Cowden syndrome. 29072; Hereditary pheochromocytoma-paraganglioma. 44890; Gastrointestinal stromal tumor. 97286; Carney-Stratakis syndrome. |
| Disease | KEGG Disease: SDHC |
| MedGen: SDHC (Human Medical Genetics with Condition) | |
| ClinVar: SDHC | |
| Phenotype | MGI: SDHC (International Mouse Phenotyping Consortium) |
| PhenomicDB: SDHC | |
| Mutations for SDHC |
| * Under tables are showing count per each tissue to give us broad intuition about tissue specific mutation patterns.You can go to the detailed page for each mutation database's web site. |
| - Statistics for Tissue and Mutation type | Top |
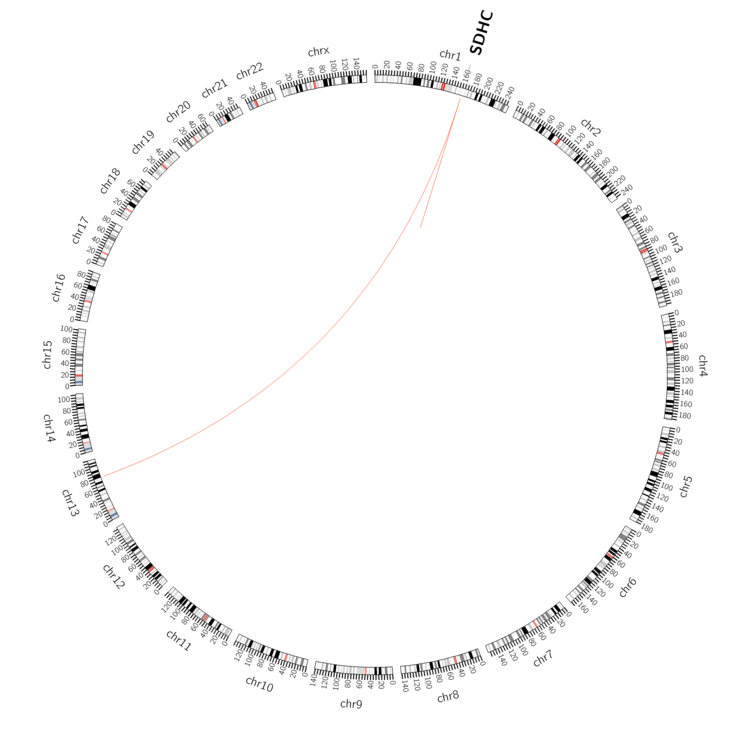 |
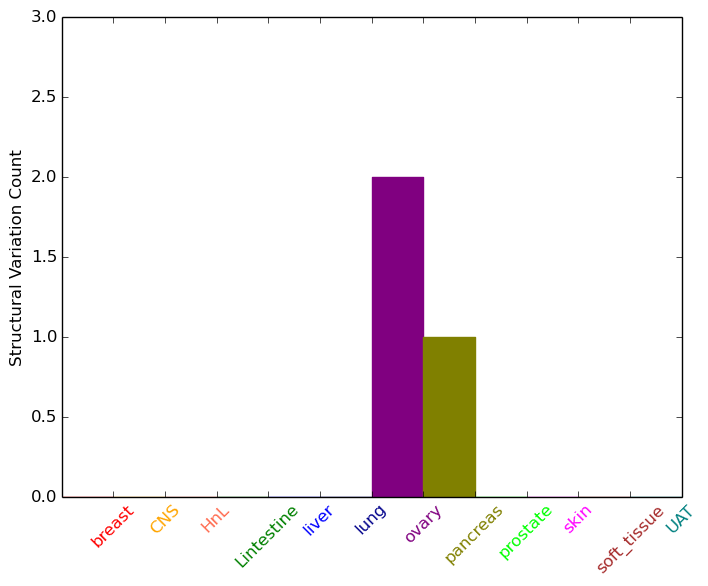
| - For Inter-chromosomal Variations |
| * Inter-chromosomal variantions includes 'interchromosomal amplicon to amplicon', 'interchromosomal amplicon to non-amplified dna', 'interchromosomal insertion', 'Interchromosomal unknown type'. |
 |
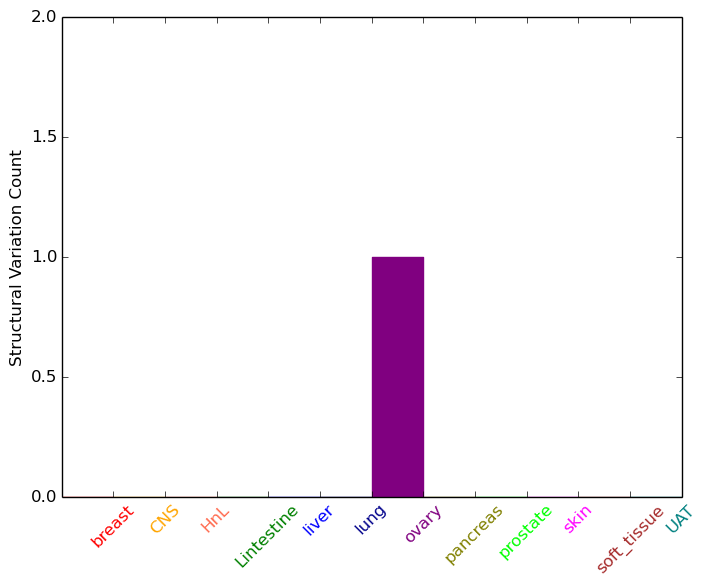
| - For Intra-chromosomal Variations |
| * Intra-chromosomal variantions includes 'intrachromosomal amplicon to amplicon', 'intrachromosomal amplicon to non-amplified dna', 'intrachromosomal deletion', 'intrachromosomal fold-back inversion', 'intrachromosomal inversion', 'intrachromosomal tandem duplication', 'Intrachromosomal unknown type', 'intrachromosomal with inverted orientation', 'intrachromosomal with non-inverted orientation'. |
 |
| Sample | Symbol_a | Chr_a | Start_a | End_a | Symbol_b | Chr_b | Start_b | End_b |
| ovary | SDHC | chr1 | 161309129 | 161309149 | SDHC | chr1 | 161309589 | 161309609 |
| ovary | SDHC | chr1 | 161314845 | 161314865 | MTMR8 | chr23 | 63515704 | 63515724 |
| pancreas | SDHC | chr1 | 161293775 | 161293795 | chr13 | 79271591 | 79271611 |
| cf) Tissue number; Tissue name (1;Breast, 2;Central_nervous_system, 3;Haematopoietic_and_lymphoid_tissue, 4;Large_intestine, 5;Liver, 6;Lung, 7;Ovary, 8;Pancreas, 9;Prostate, 10;Skin, 11;Soft_tissue, 12;Upper_aerodigestive_tract) |
| * From mRNA Sanger sequences, Chitars2.0 arranged chimeric transcripts. This table shows SDHC related fusion information. |
| ID | Head Gene | Tail Gene | Accession | Gene_a | qStart_a | qEnd_a | Chromosome_a | tStart_a | tEnd_a | Gene_a | qStart_a | qEnd_a | Chromosome_a | tStart_a | tEnd_a |
| Top |
| Mutation type/ Tissue ID | brca | cns | cerv | endome | haematopo | kidn | Lintest | liver | lung | ns | ovary | pancre | prost | skin | stoma | thyro | urina | |||
| Total # sample | 2 | |||||||||||||||||||
| GAIN (# sample) | 2 | |||||||||||||||||||
| LOSS (# sample) |
| cf) Tissue ID; Tissue type (1; Breast, 2; Central_nervous_system, 3; Cervix, 4; Endometrium, 5; Haematopoietic_and_lymphoid_tissue, 6; Kidney, 7; Large_intestine, 8; Liver, 9; Lung, 10; NS, 11; Ovary, 12; Pancreas, 13; Prostate, 14; Skin, 15; Stomach, 16; Thyroid, 17; Urinary_tract) |
| Top |
|
 |
| Top |
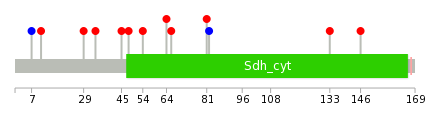
| Stat. for Non-Synonymous SNVs (# total SNVs=4) | (# total SNVs=2) |
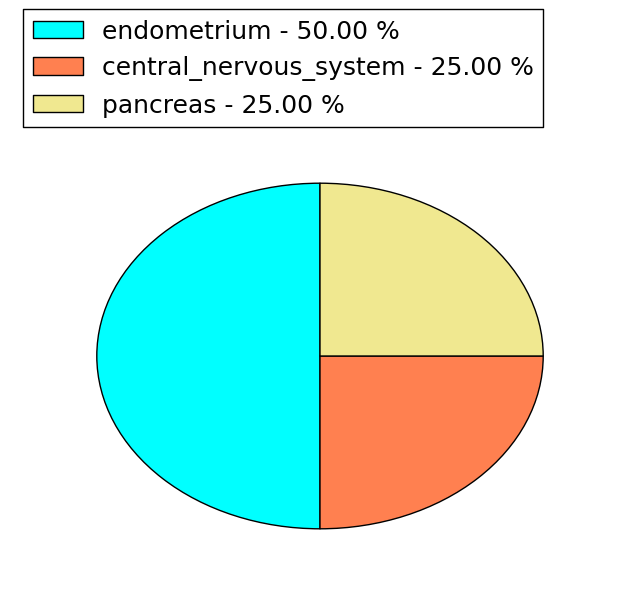 | 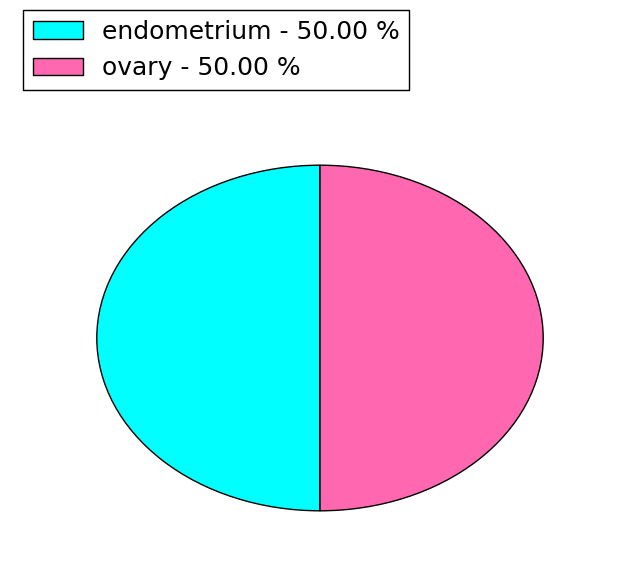 |
(# total SNVs=0) | (# total SNVs=0) |
| Top |
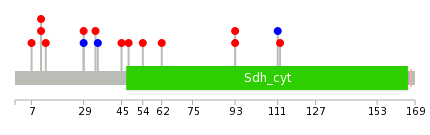
| * When you move the cursor on each content, you can see more deailed mutation information on the Tooltip. Those are primary_site,primary_histology,mutation(aa),pubmedID. |
| GRCh37 position | Mutation(aa) | Unique sampleID count |
| chr1:161326467-161326467 | p.G81E | 1 |
| chr1:161284214-161284214 | p.R7R | 1 |
| chr1:161326471-161326471 | p.V82V | 1 |
| chr1:161293414-161293414 | p.R11C | 1 |
| chr1:161326623-161326623 | p.R133Q | 1 |
| chr1:161298183-161298183 | p.? | 1 |
| chr1:161332149-161332149 | p.P146S | 1 |
| chr1:161298193-161298193 | p.P29S | 1 |
| chr1:161298208-161298208 | p.A34T | 1 |
| chr1:161298242-161298242 | p.N45S | 1 |
| Top |
|
 |
| Point Mutation/ Tissue ID | 1 | 2 | 3 | 4 | 5 | 6 | 7 | 8 | 9 | 10 | 11 | 12 | 13 | 14 | 15 | 16 | 17 | 18 | 19 | 20 |
| # sample | 2 | 1 | 1 | 1 | 3 | 1 | 4 | |||||||||||||
| # mutation | 2 | 1 | 1 | 1 | 3 | 1 | 6 | |||||||||||||
| nonsynonymous SNV | 2 | 1 | 1 | 3 | 1 | 4 | ||||||||||||||
| synonymous SNV | 1 | 2 |
| cf) Tissue ID; Tissue type (1; BLCA[Bladder Urothelial Carcinoma], 2; BRCA[Breast invasive carcinoma], 3; CESC[Cervical squamous cell carcinoma and endocervical adenocarcinoma], 4; COAD[Colon adenocarcinoma], 5; GBM[Glioblastoma multiforme], 6; Glioma Low Grade, 7; HNSC[Head and Neck squamous cell carcinoma], 8; KICH[Kidney Chromophobe], 9; KIRC[Kidney renal clear cell carcinoma], 10; KIRP[Kidney renal papillary cell carcinoma], 11; LAML[Acute Myeloid Leukemia], 12; LUAD[Lung adenocarcinoma], 13; LUSC[Lung squamous cell carcinoma], 14; OV[Ovarian serous cystadenocarcinoma ], 15; PAAD[Pancreatic adenocarcinoma], 16; PRAD[Prostate adenocarcinoma], 17; SKCM[Skin Cutaneous Melanoma], 18:STAD[Stomach adenocarcinoma], 19:THCA[Thyroid carcinoma], 20:UCEC[Uterine Corpus Endometrial Carcinoma]) |
| Top |
| * We represented just top 10 SNVs. When you move the cursor on each content, you can see more deailed mutation information on the Tooltip. Those are primary_site, primary_histology, mutation(aa), pubmedID. |
| Genomic Position | Mutation(aa) | Unique sampleID count |
| chr1:161326518 | p.F112L,SDHC | 1 |
| chr1:161284214 | p.S7R | 1 |
| chr1:161326568 | p.R11C,SDHC | 1 |
| chr1:161293414 | p.P29S,SDHC | 1 |
| chr1:161332149 | p.A34T,SDHC | 1 |
| chr1:161298193 | p.S48L,SDHC | 1 |
| chr1:161332256 | p.P54T,SDHC | 1 |
| chr1:161298208 | p.P11L,SDHC | 1 |
| chr1:161332312 | p.A13V,SDHC | 1 |
| chr1:161298251 | p.V29V,SDHC | 1 |
| * Copy number data were extracted from TCGA using R package TCGA-Assembler. The URLs of all public data files on TCGA DCC data server were gathered on Jan-05-2015. Function ProcessCNAData in TCGA-Assembler package was used to obtain gene-level copy number value which is calculated as the average copy number of the genomic region of a gene. |
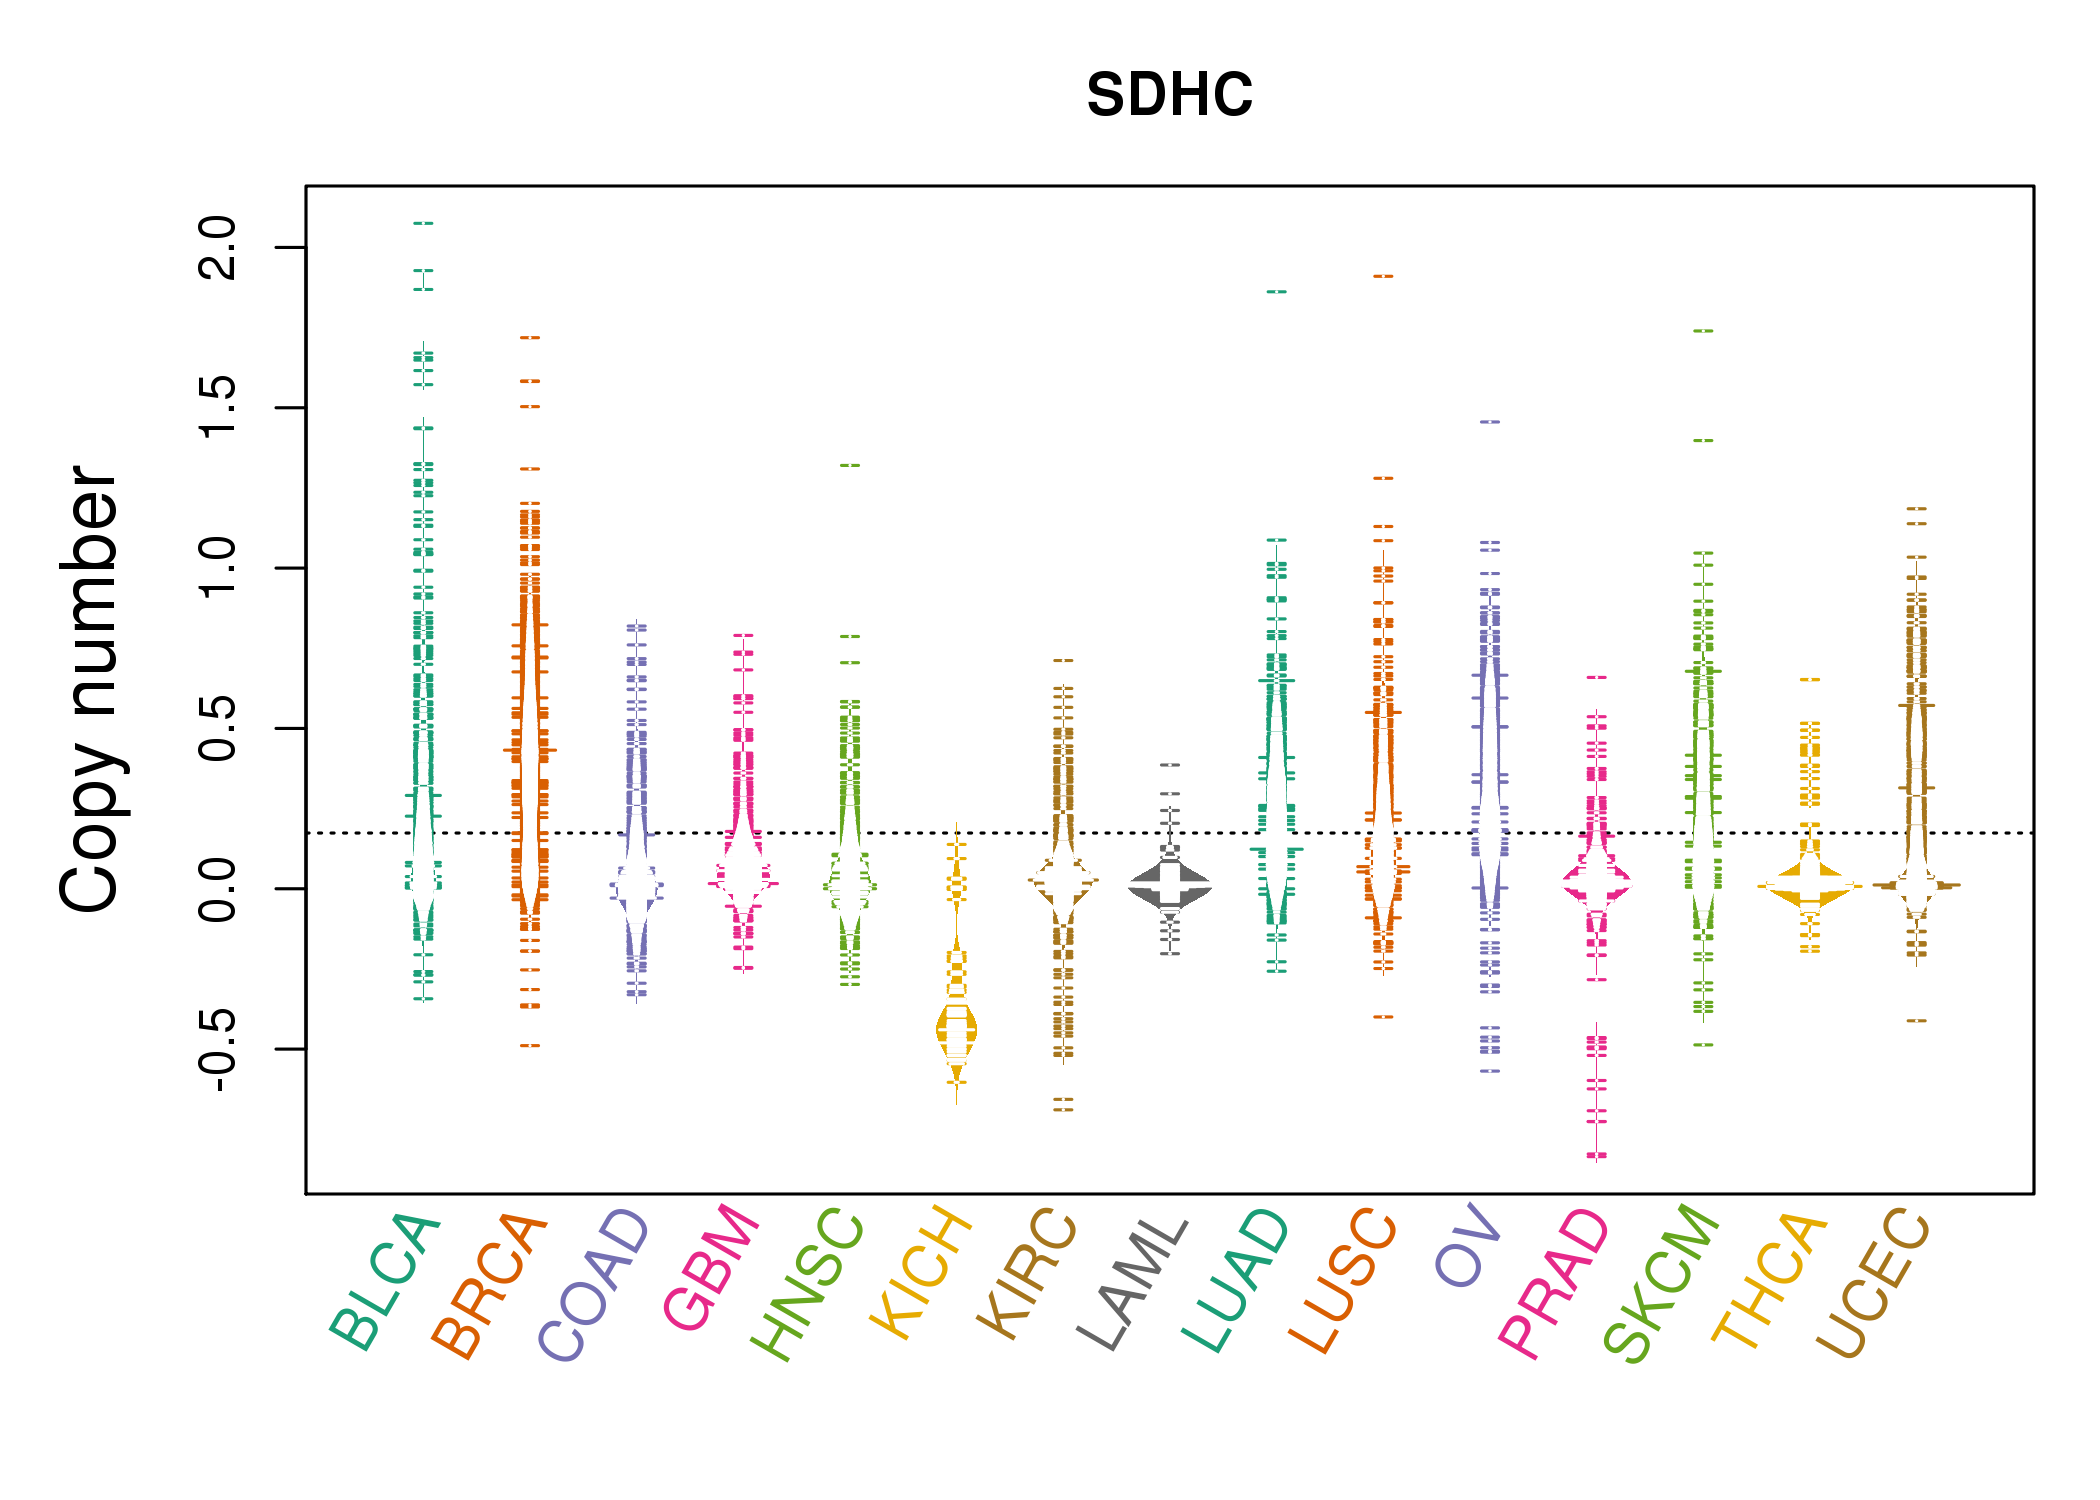 |
| cf) Tissue ID[Tissue type]: BLCA[Bladder Urothelial Carcinoma], BRCA[Breast invasive carcinoma], CESC[Cervical squamous cell carcinoma and endocervical adenocarcinoma], COAD[Colon adenocarcinoma], GBM[Glioblastoma multiforme], Glioma Low Grade, HNSC[Head and Neck squamous cell carcinoma], KICH[Kidney Chromophobe], KIRC[Kidney renal clear cell carcinoma], KIRP[Kidney renal papillary cell carcinoma], LAML[Acute Myeloid Leukemia], LUAD[Lung adenocarcinoma], LUSC[Lung squamous cell carcinoma], OV[Ovarian serous cystadenocarcinoma ], PAAD[Pancreatic adenocarcinoma], PRAD[Prostate adenocarcinoma], SKCM[Skin Cutaneous Melanoma], STAD[Stomach adenocarcinoma], THCA[Thyroid carcinoma], UCEC[Uterine Corpus Endometrial Carcinoma] |
| Top |
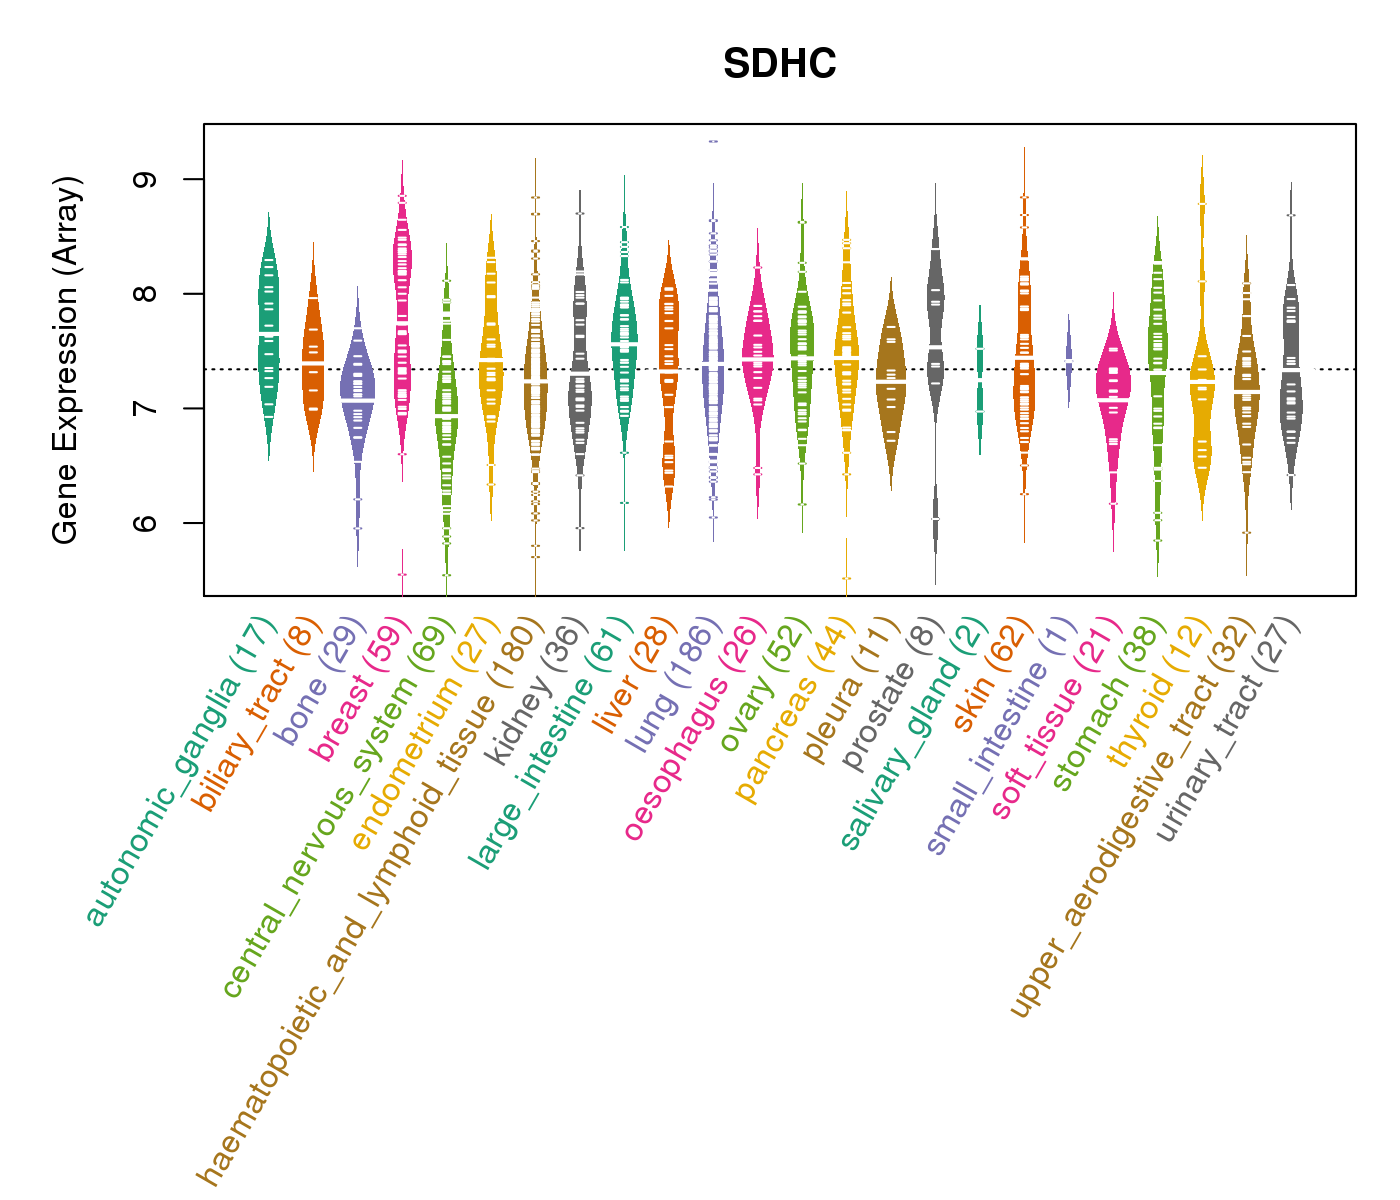
| Gene Expression for SDHC |
| * CCLE gene expression data were extracted from CCLE_Expression_Entrez_2012-10-18.res: Gene-centric RMA-normalized mRNA expression data. |
 |
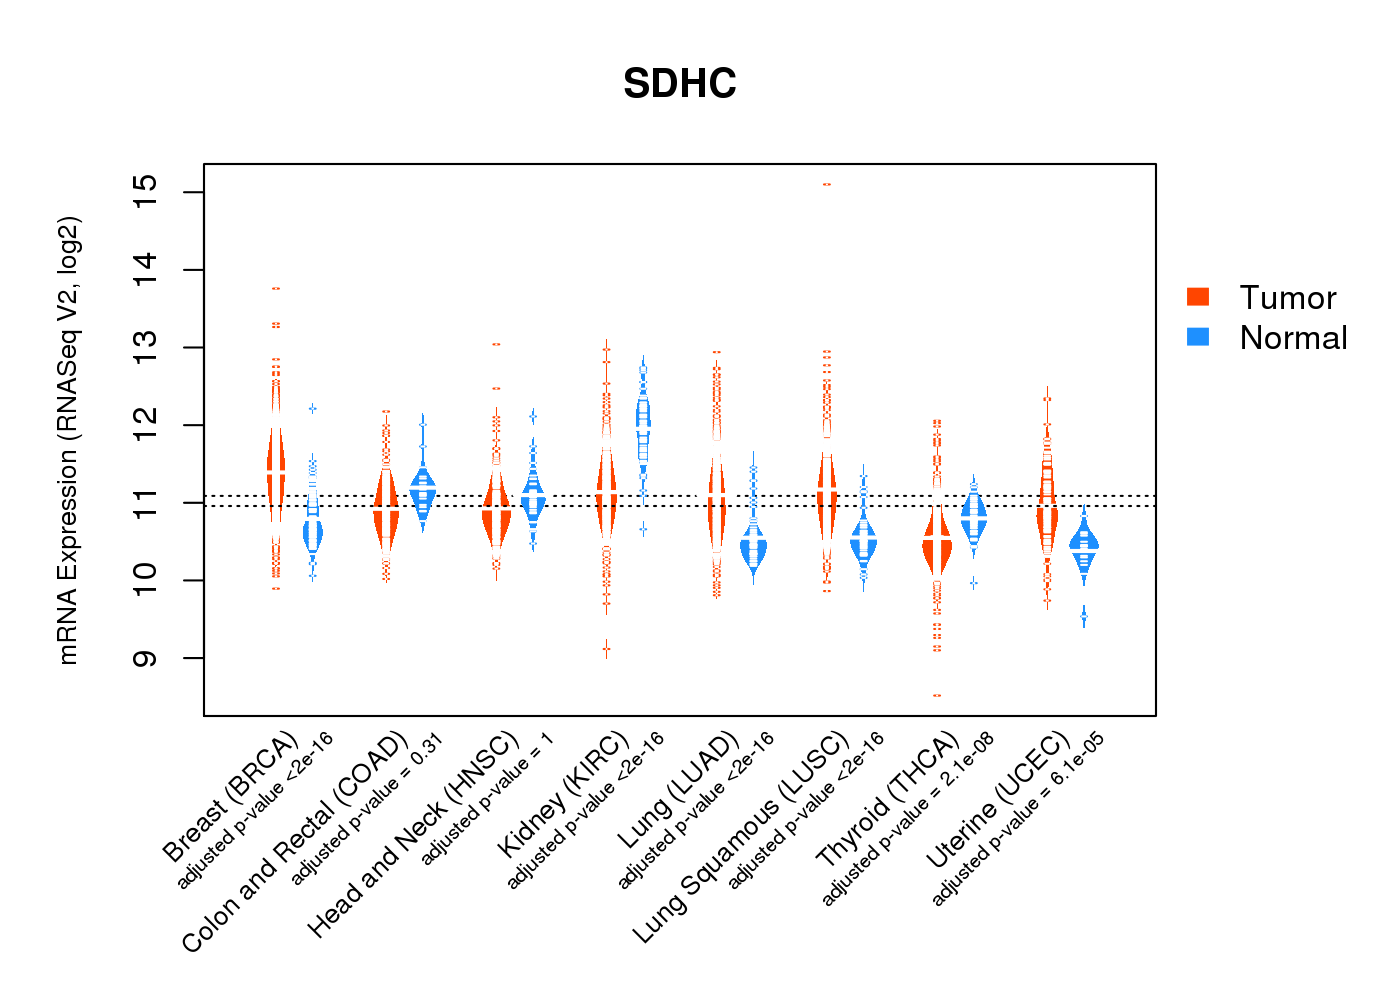
| * Normalized gene expression data of RNASeqV2 was extracted from TCGA using R package TCGA-Assembler. The URLs of all public data files on TCGA DCC data server were gathered at Jan-05-2015. Only eight cancer types have enough normal control samples for differential expression analysis. (t test, adjusted p<0.05 (using Benjamini-Hochberg FDR)) |
 |
| Top |
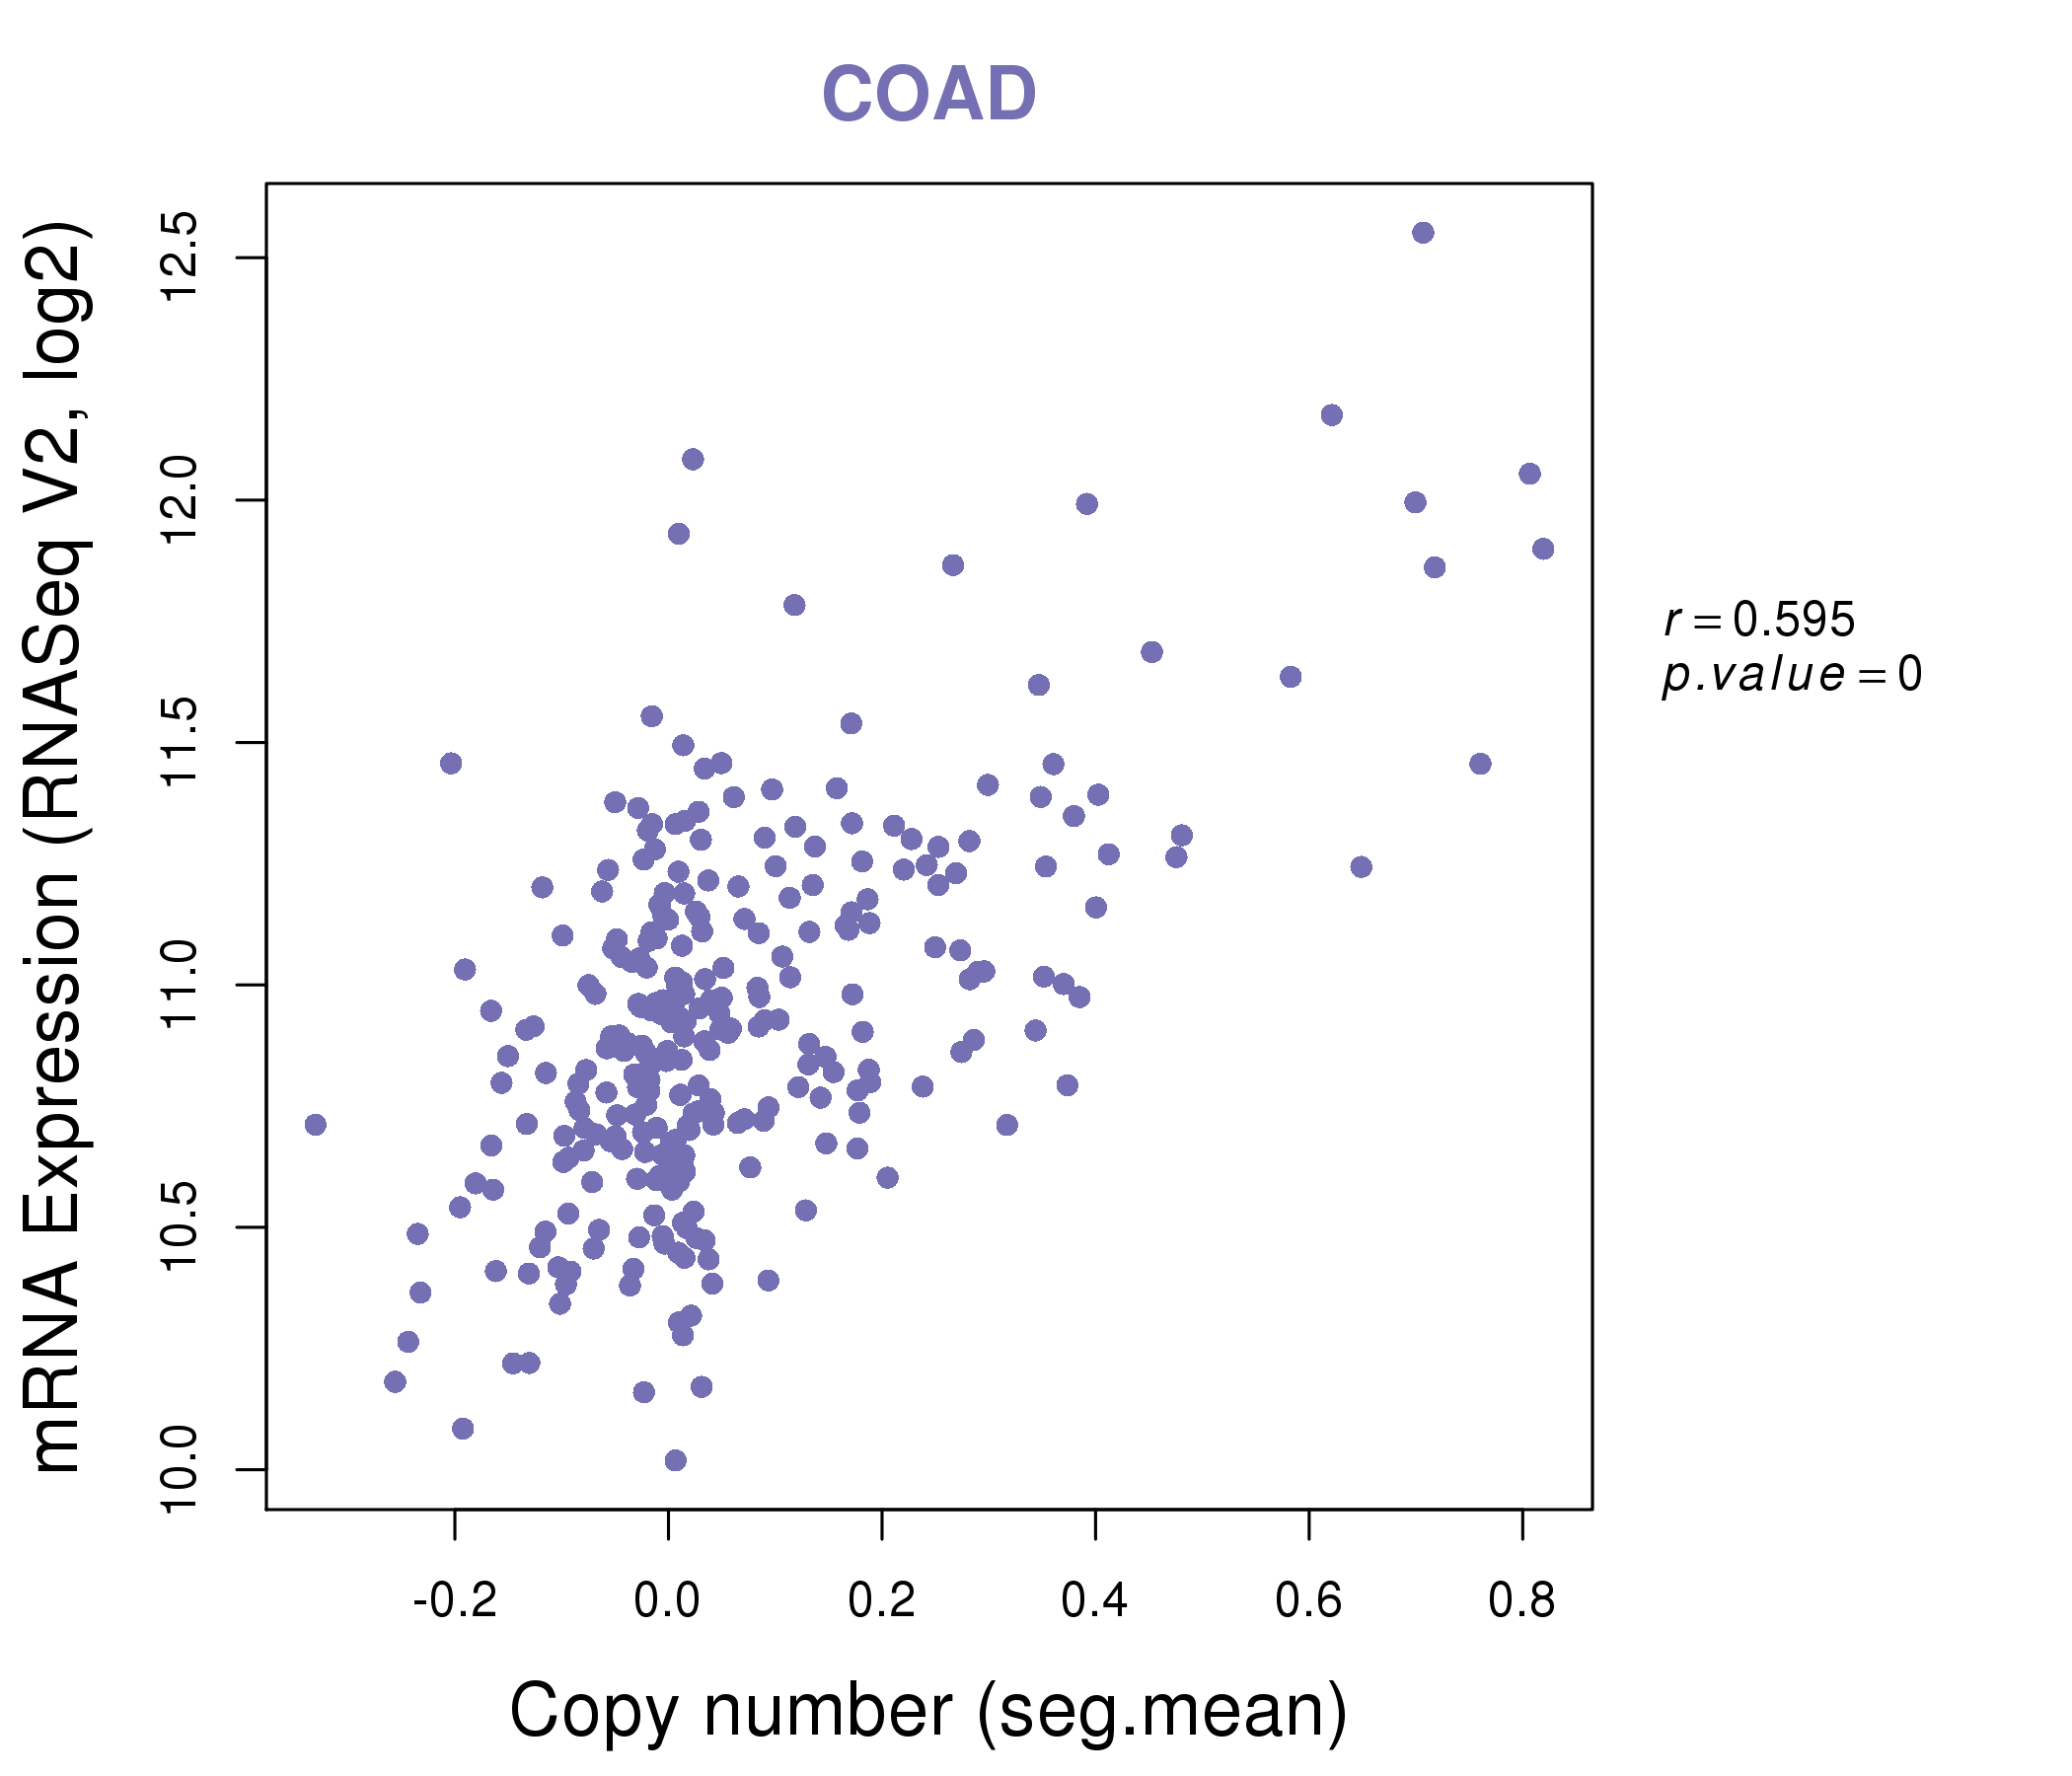
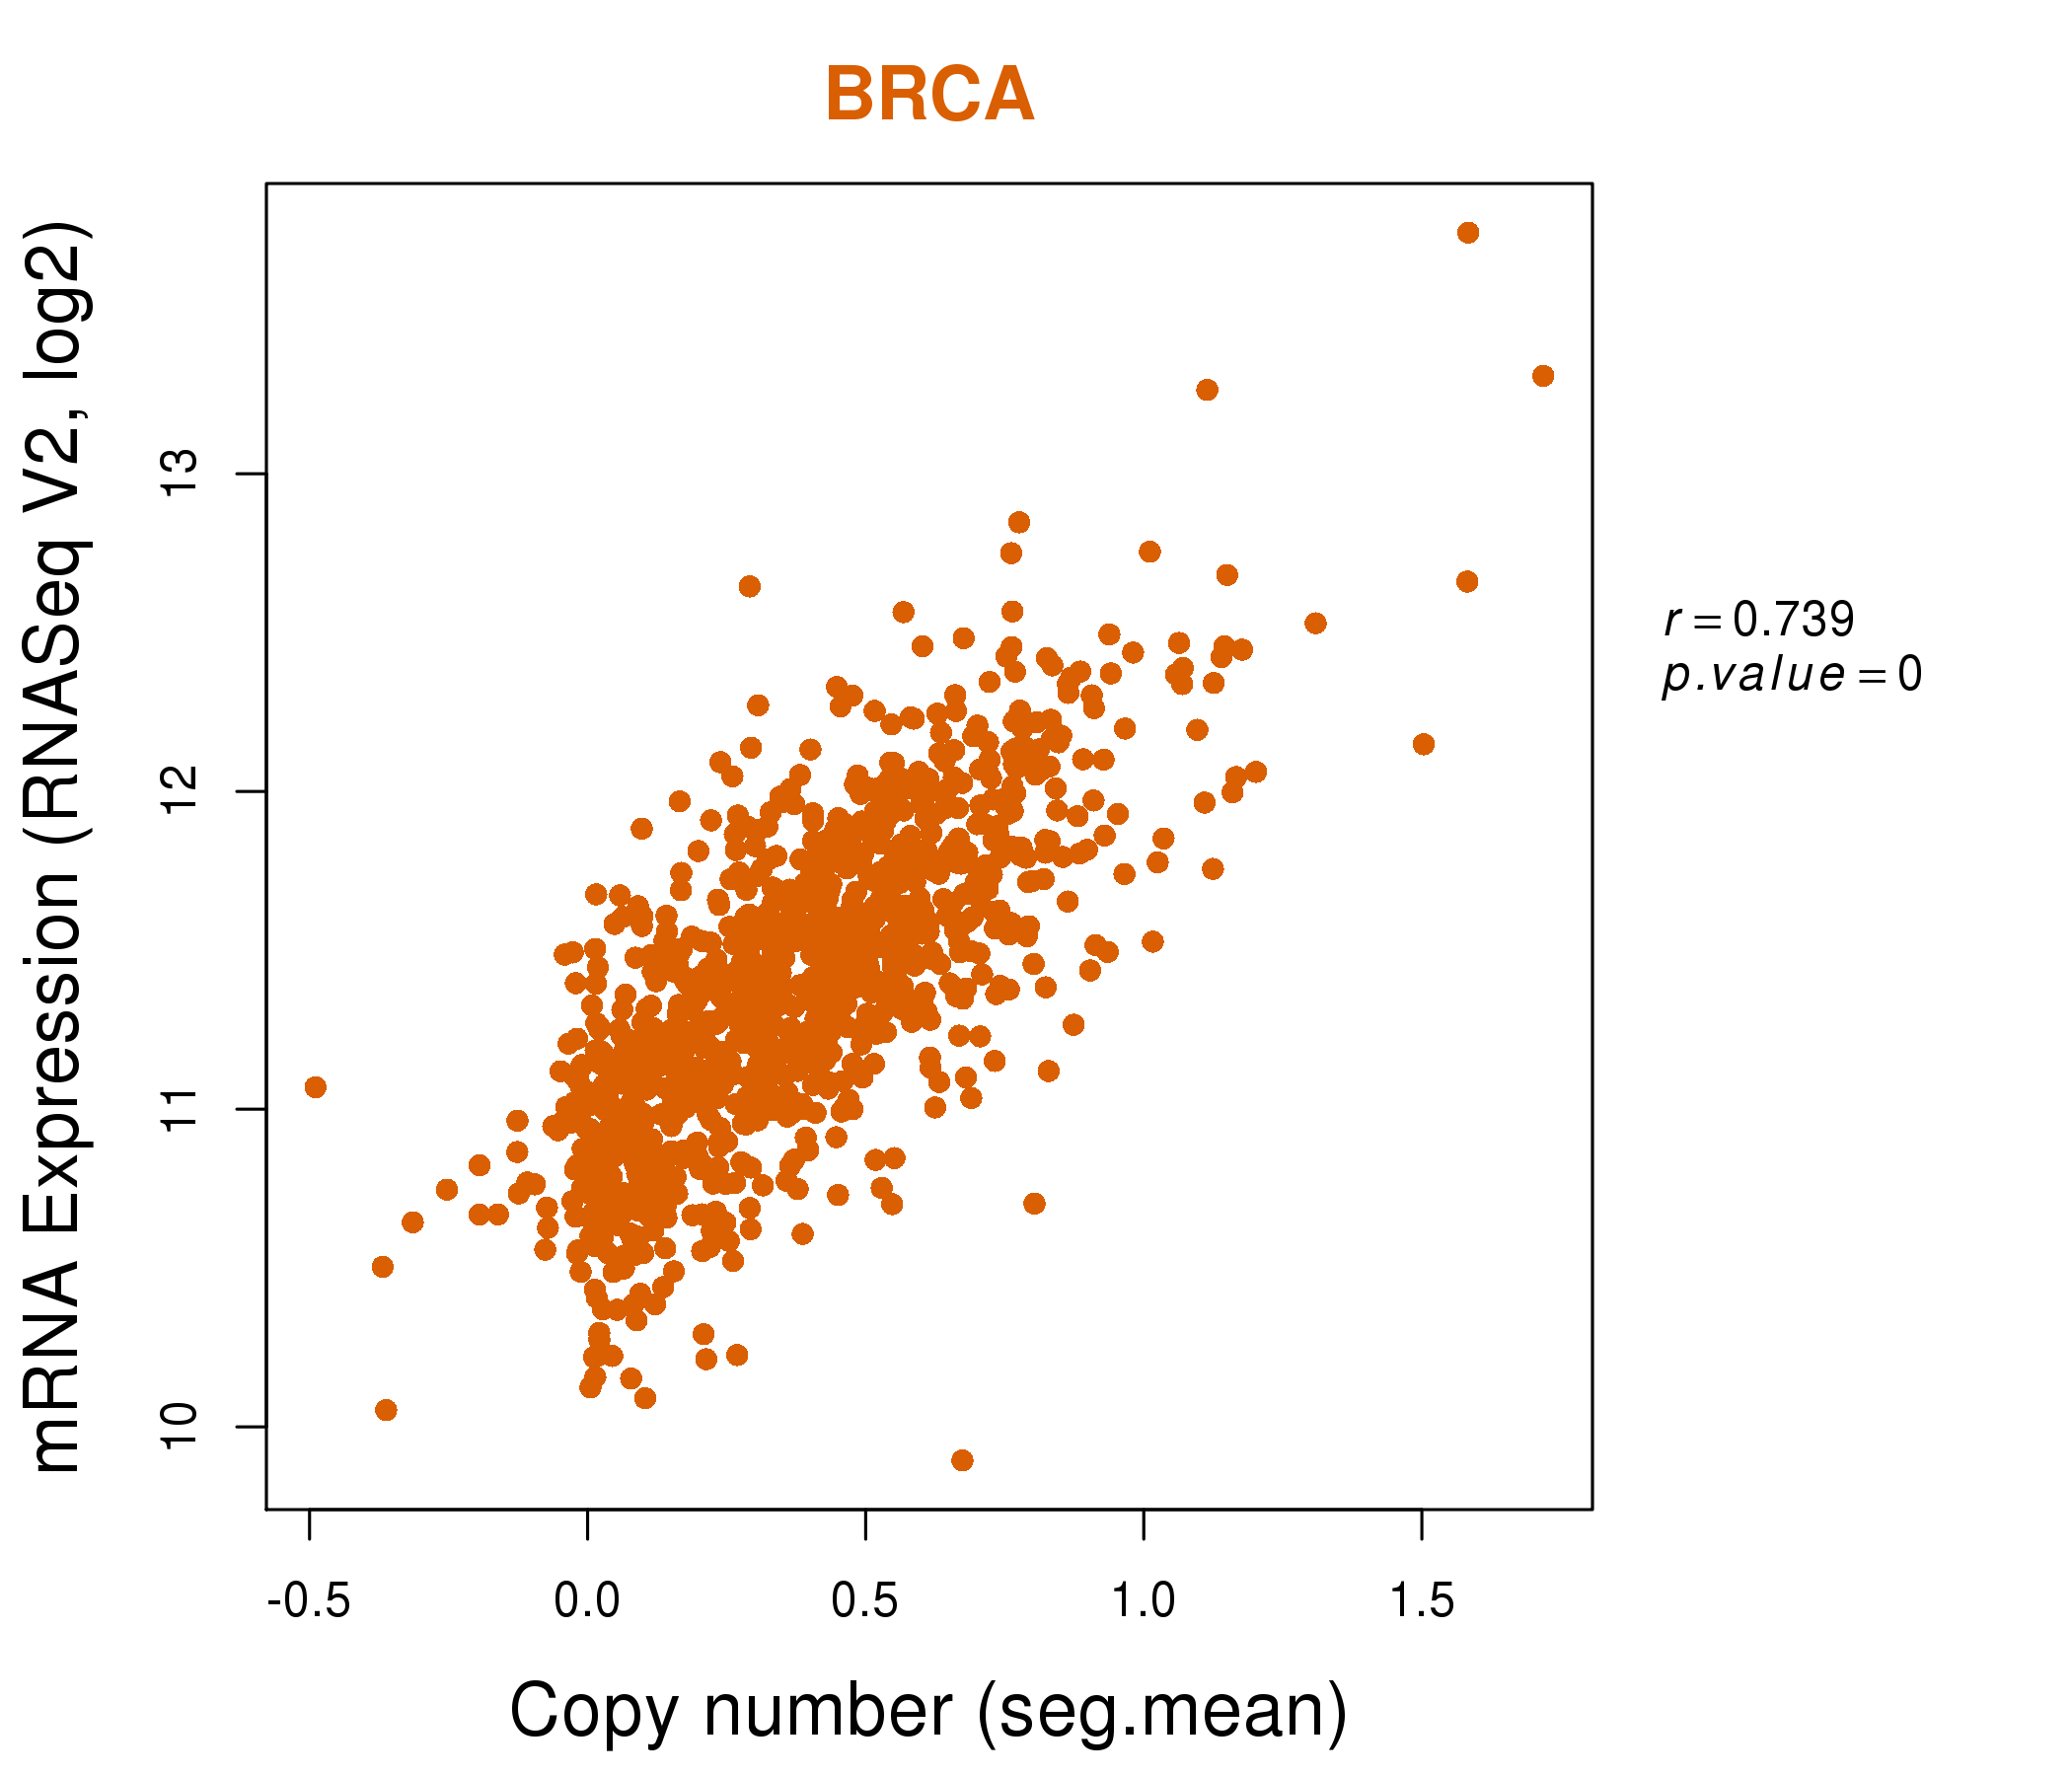
| * This plots show the correlation between CNV and gene expression. |
: Open all plots for all cancer types
 |
|
 |
|

| Top |
| Gene-Gene Network Information |
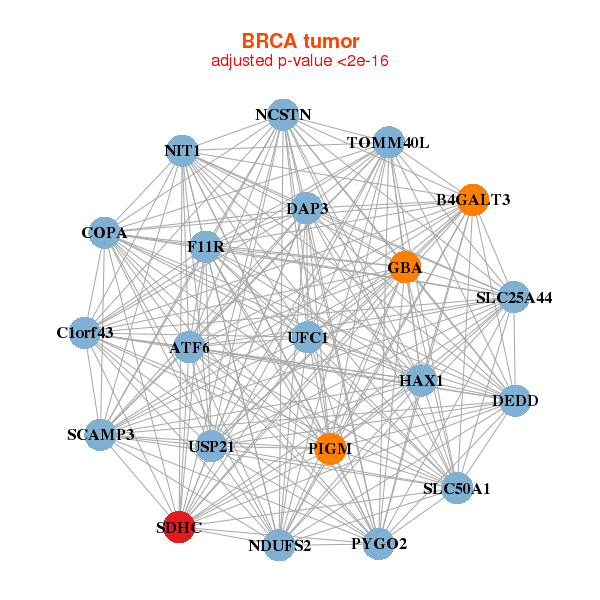
| * Co-Expression network figures were drawn using R package igraph. Only the top 20 genes with the highest correlations were shown. Red circle: input gene, orange circle: cell metabolism gene, sky circle: other gene |
: Open all plots for all cancer types
 |
| ||||
| ATF6,B4GALT3,C1orf43,COPA,DAP3,DEDD,F11R, GBA,HAX1,NCSTN,NDUFS2,NIT1,PIGM,PYGO2, SLC50A1,SCAMP3,SDHC,SLC25A44,TOMM40L,UFC1,USP21 | ACAT1,ATP5G3,ATPAF1,DLD,ETFA,ETFDH,FH, GHITM,GNPAT,HOXA10,HSDL2,HSPB6,ISCA1P1,PGM1, PHYH,PRDX3,SDHC,SETD3,SUCLA2,SUCLG2,WSB2 | ||||
 |
| ||||
| APH1A,ARPC5,BPNT1,C1orf43,DAP3,FH,FLAD1, HAX1,ILF2,MRPS14,NDUFS2,PEX19,SDHC,SNAPIN, TADA1,TFB2M,TIMM17A,TIPRL,TMEM183A,TPM3,TSNAX | AK2,ATP5C1,ATP5F1,ATP5H,C14orf2,COX16,HPRT1, MRPL13,MRPL16,MRPL39,MRPS22,MRPS28,MRPS35,MYCBP, NDUFA12,NDUFAB1,PPIA,PTGES3,SDHC,UQCRH,YWHAE |


| * Co-Expression network figures were drawn using R package igraph. Only the top 20 genes with the highest correlations were shown. Red circle: input gene, orange circle: cell metabolism gene, sky circle: other gene |
: Open all plots for all cancer types
| Top |
: Open all interacting genes' information including KEGG pathway for all interacting genes from DAVID
| Top |
| Pharmacological Information for SDHC |
| DB Category | DB Name | DB's ID and Url link |
| Organism-specific databases | PharmGKB | PA35607; -. |
| Organism-specific databases | CTD | 6391; -. |
| * Gene Centered Interaction Network. |
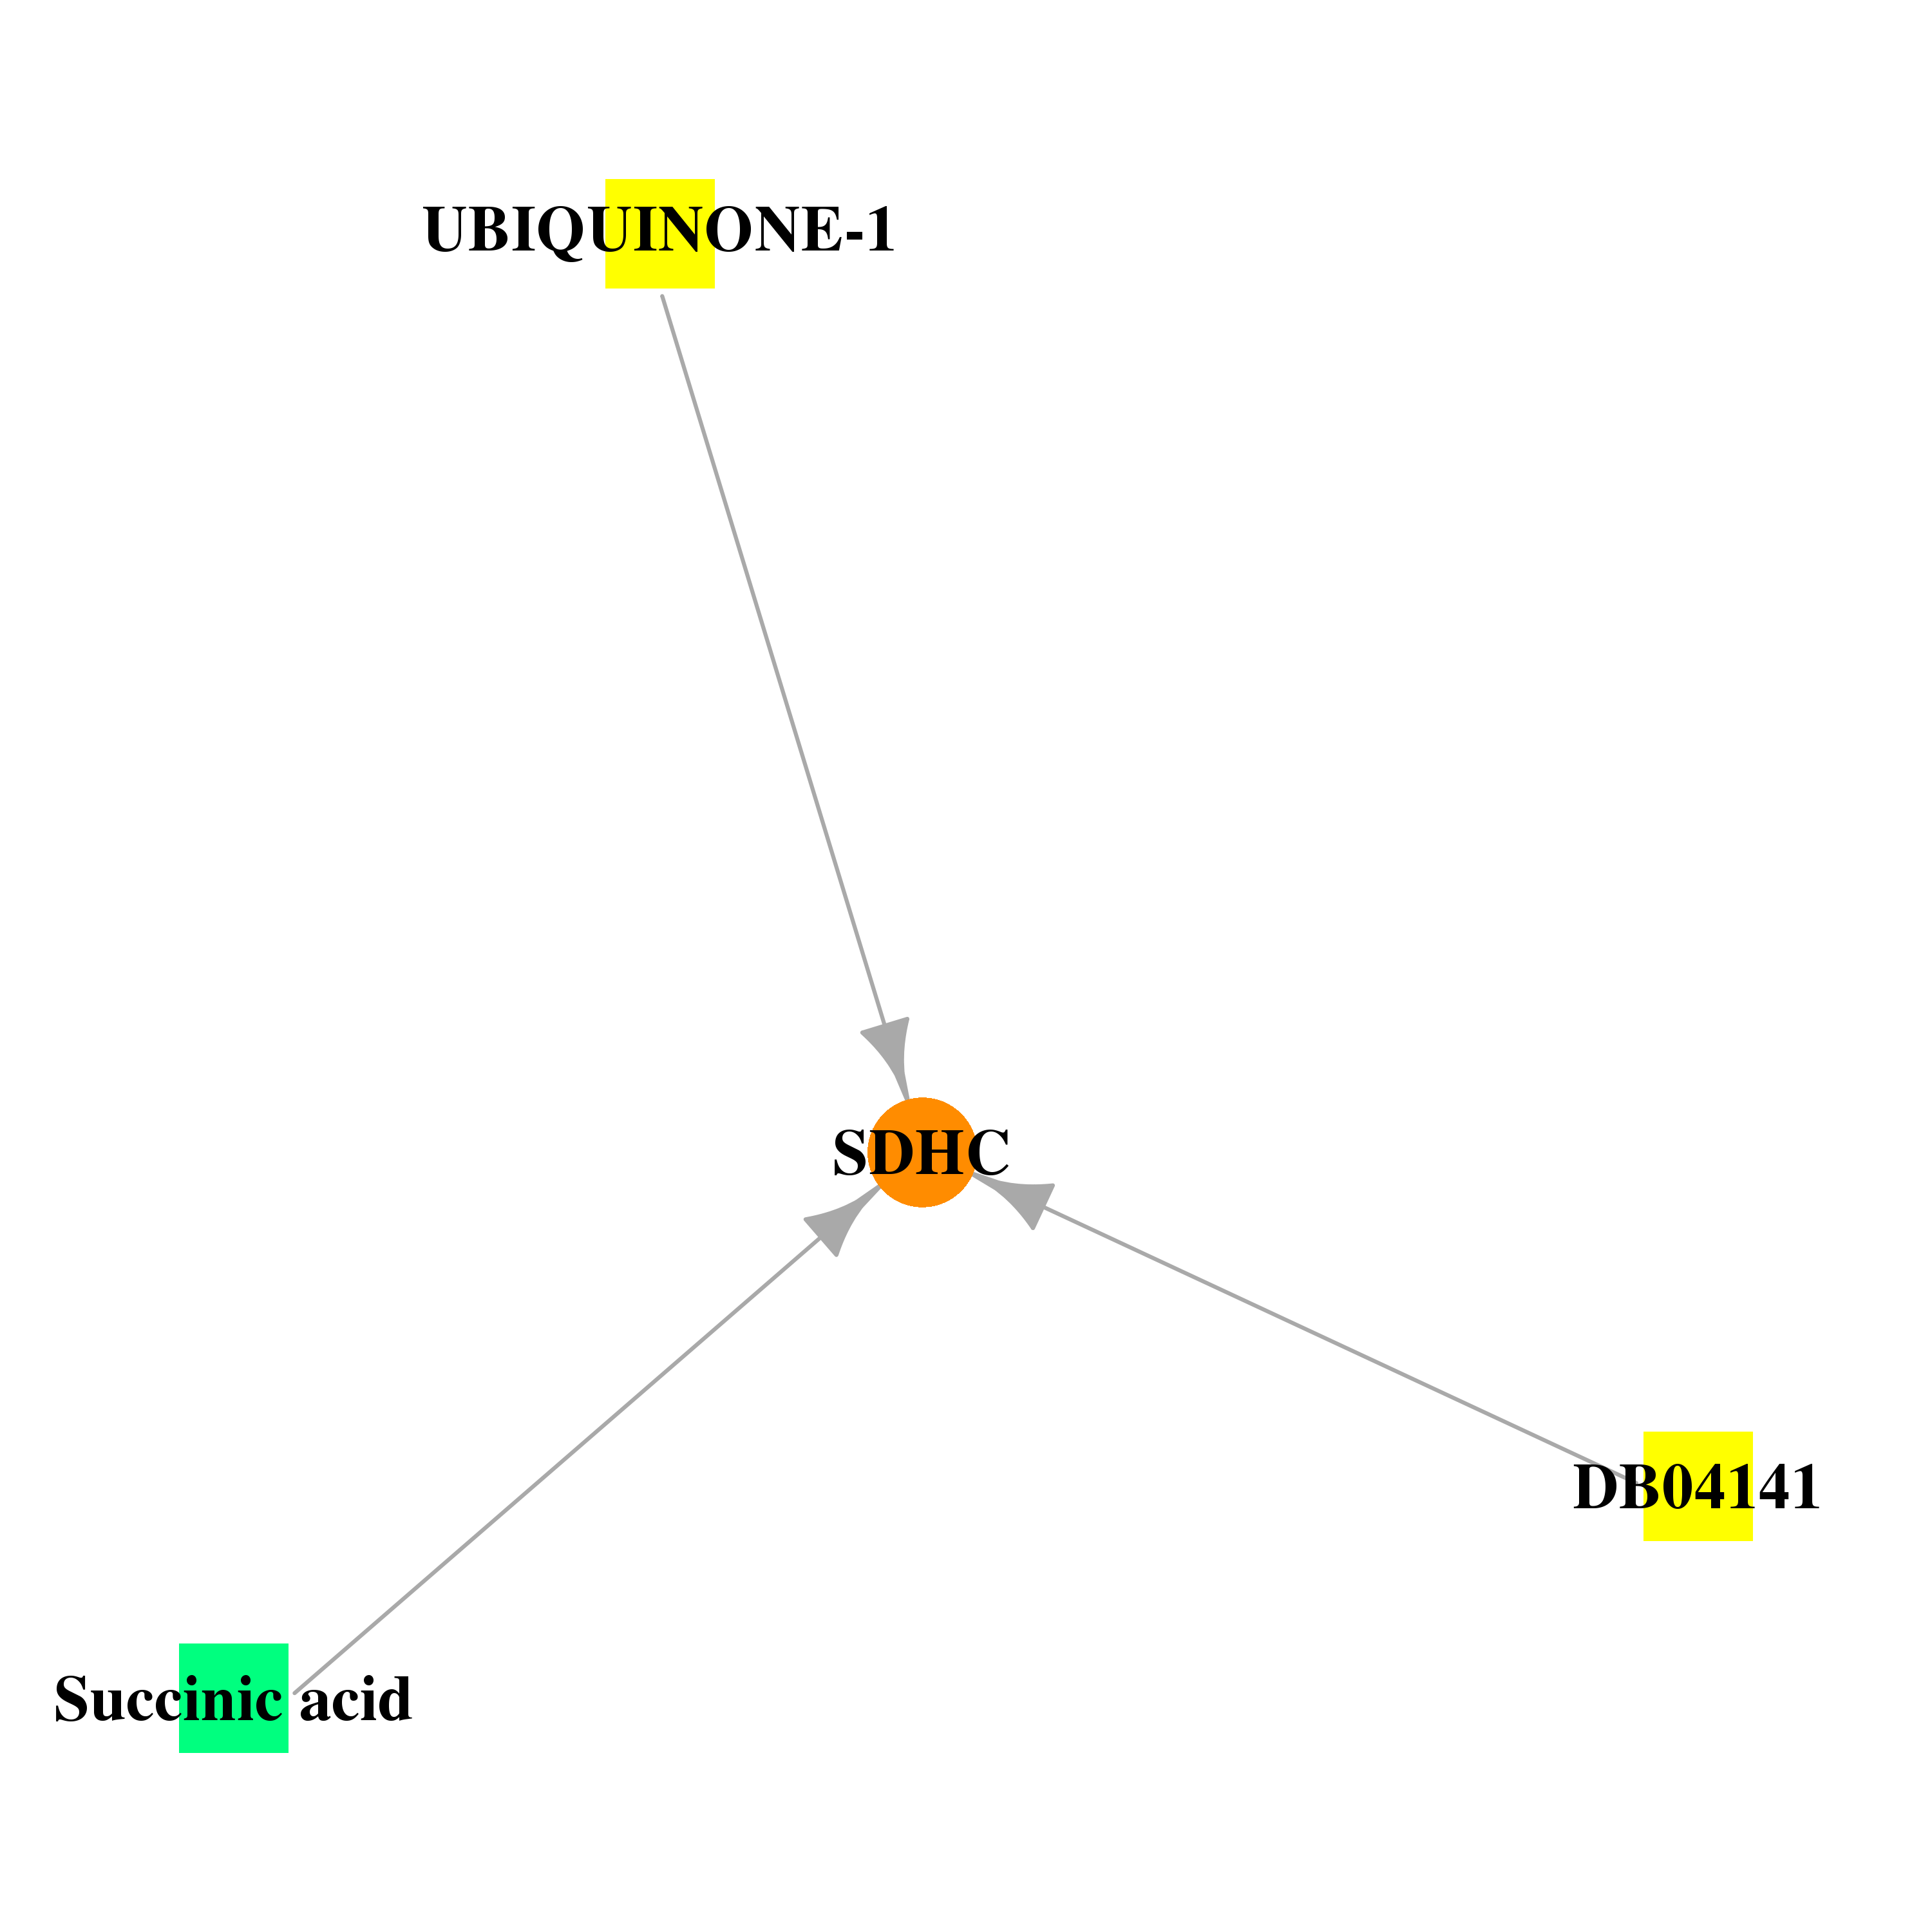 |
| * Drug Centered Interaction Network. |
| DrugBank ID | Target Name | Drug Groups | Generic Name | Drug Centered Network | Drug Structure |
| DB00139 | succinate dehydrogenase complex, subunit C, integral membrane protein, 15kDa | approved; nutraceutical | Succinic acid | 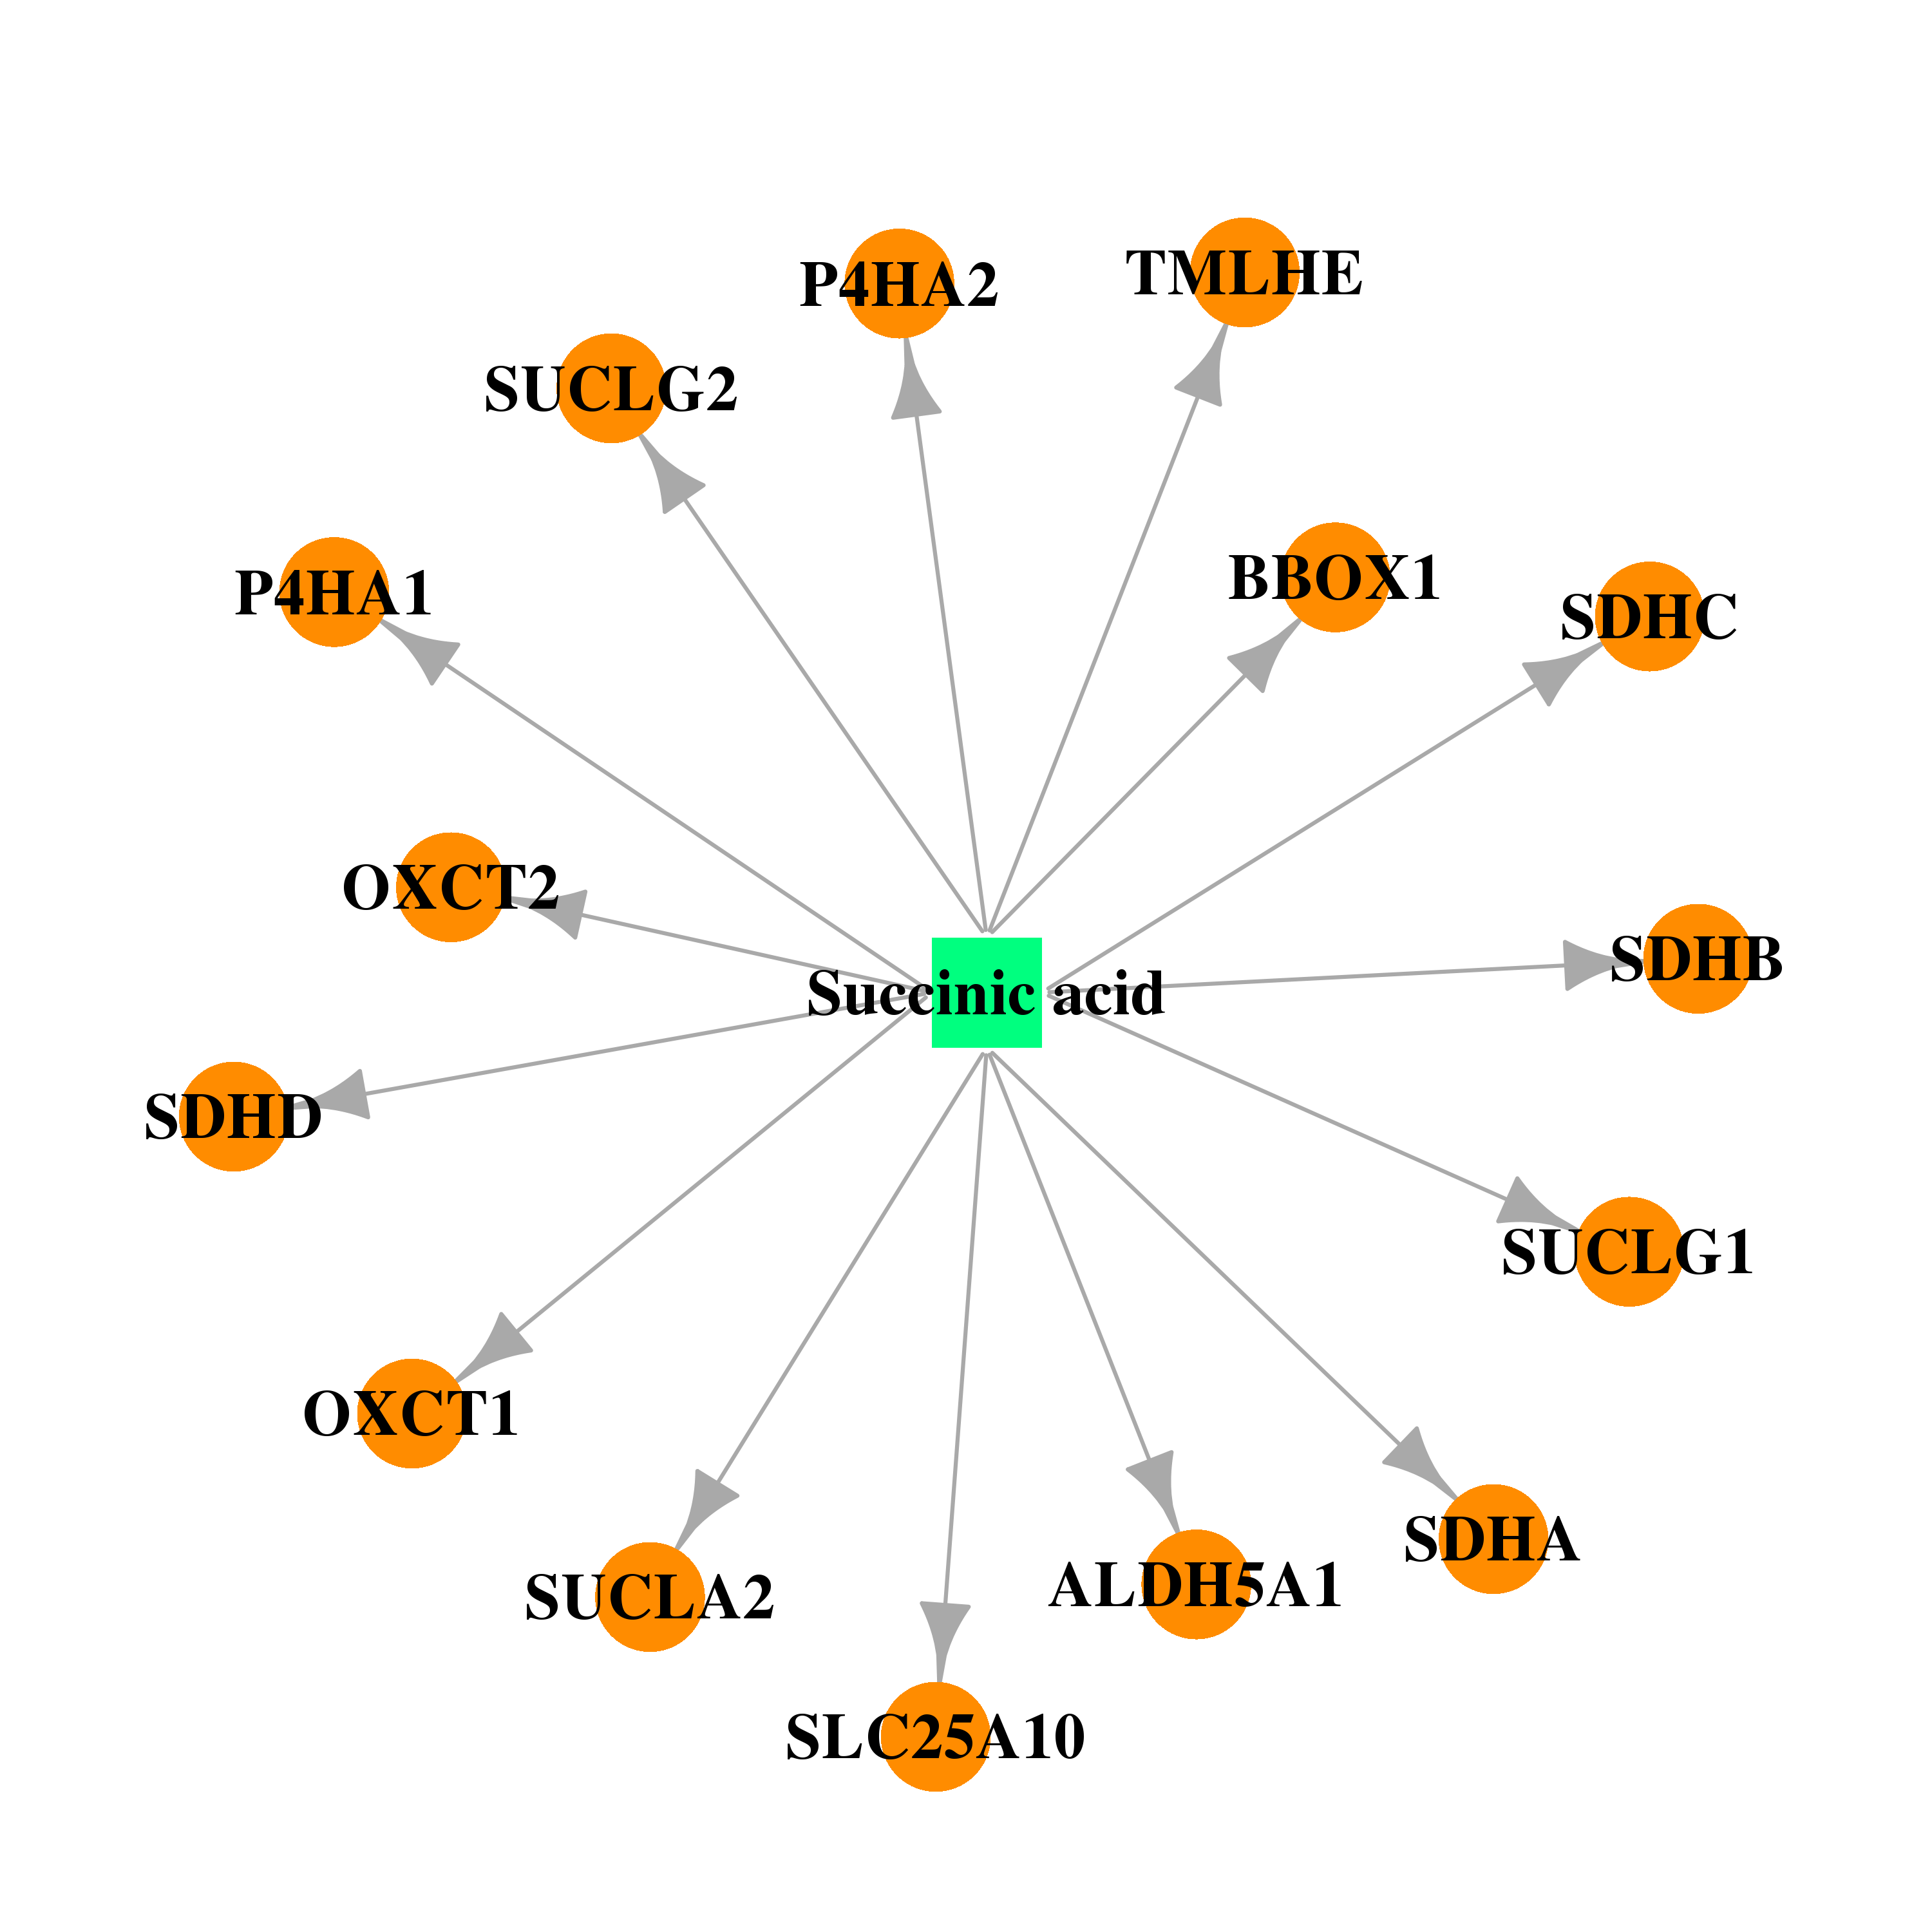 | 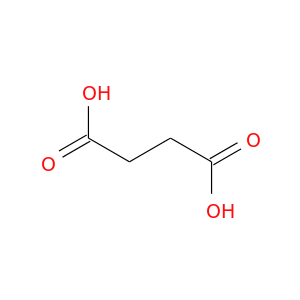 |
| DB04141 | succinate dehydrogenase complex, subunit C, integral membrane protein, 15kDa | experimental | 2-Hexyloxy-6-Hydroxymethyl-Tetrahydro-Pyran-3,4,5-Triol | 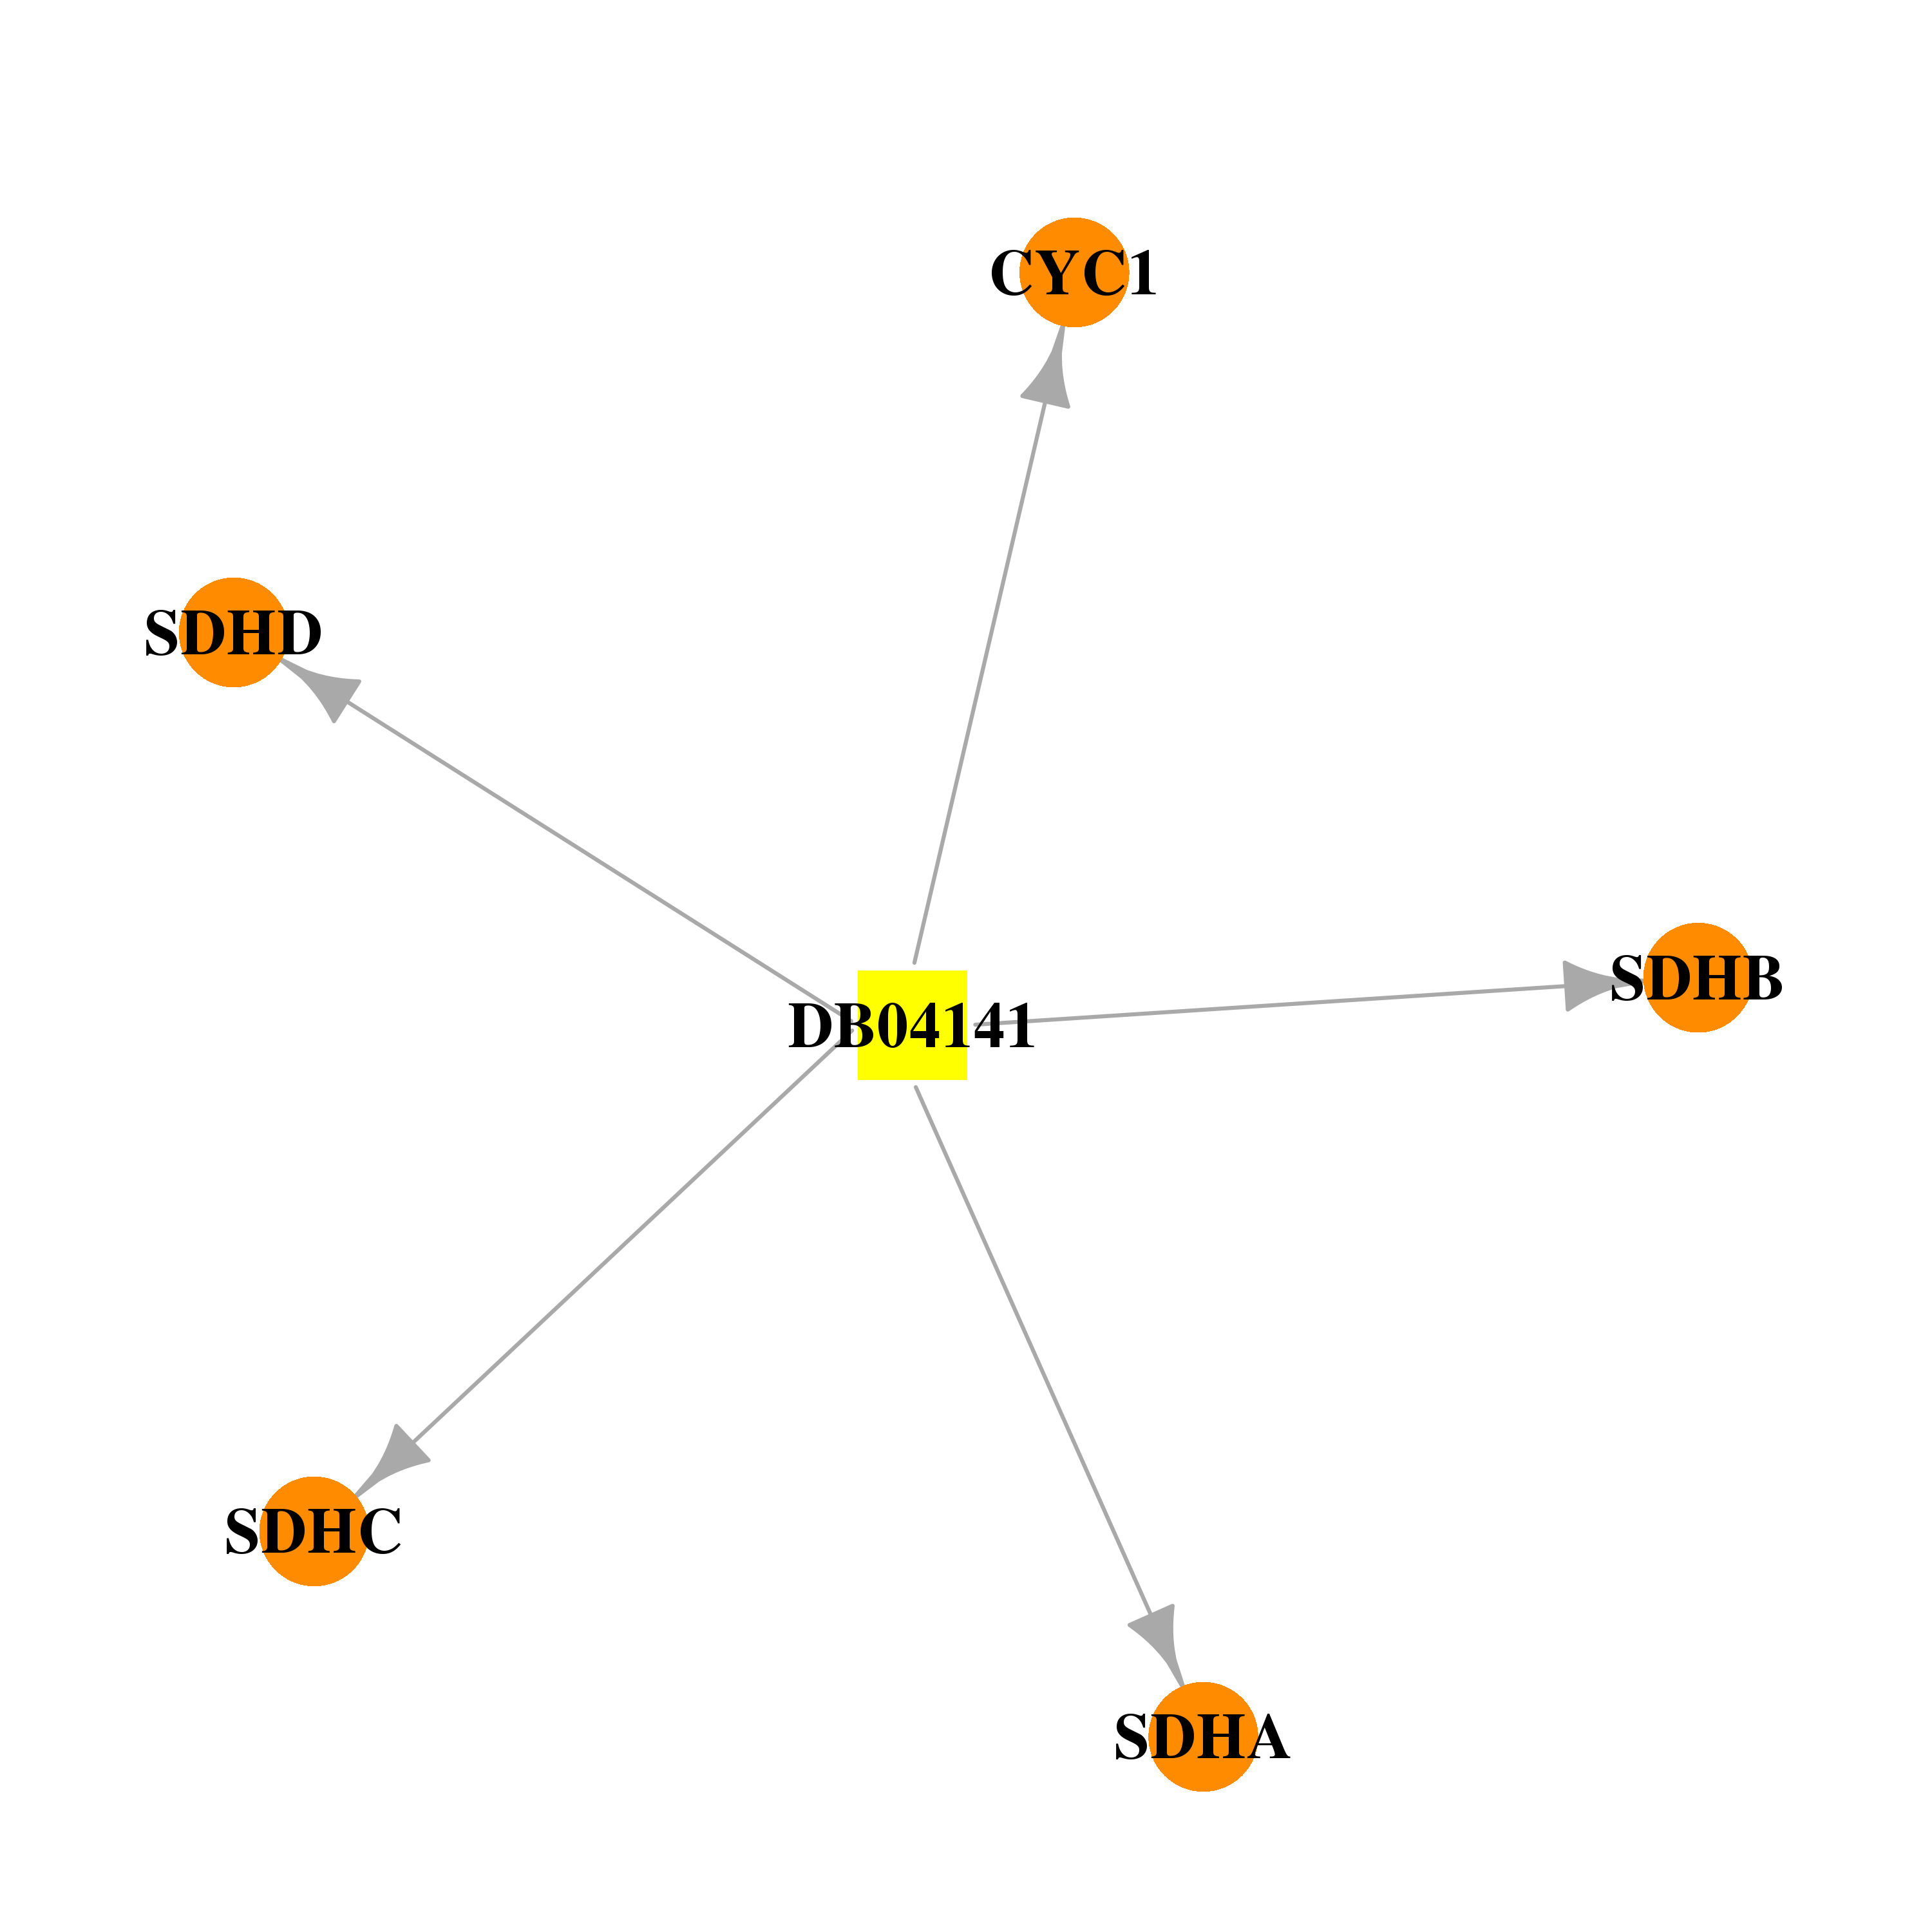 | 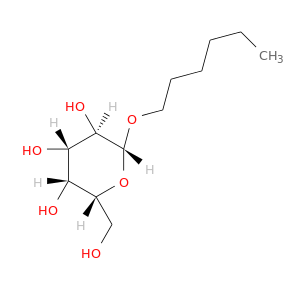 |
| DB08689 | succinate dehydrogenase complex, subunit C, integral membrane protein, 15kDa | experimental | UBIQUINONE-1 | 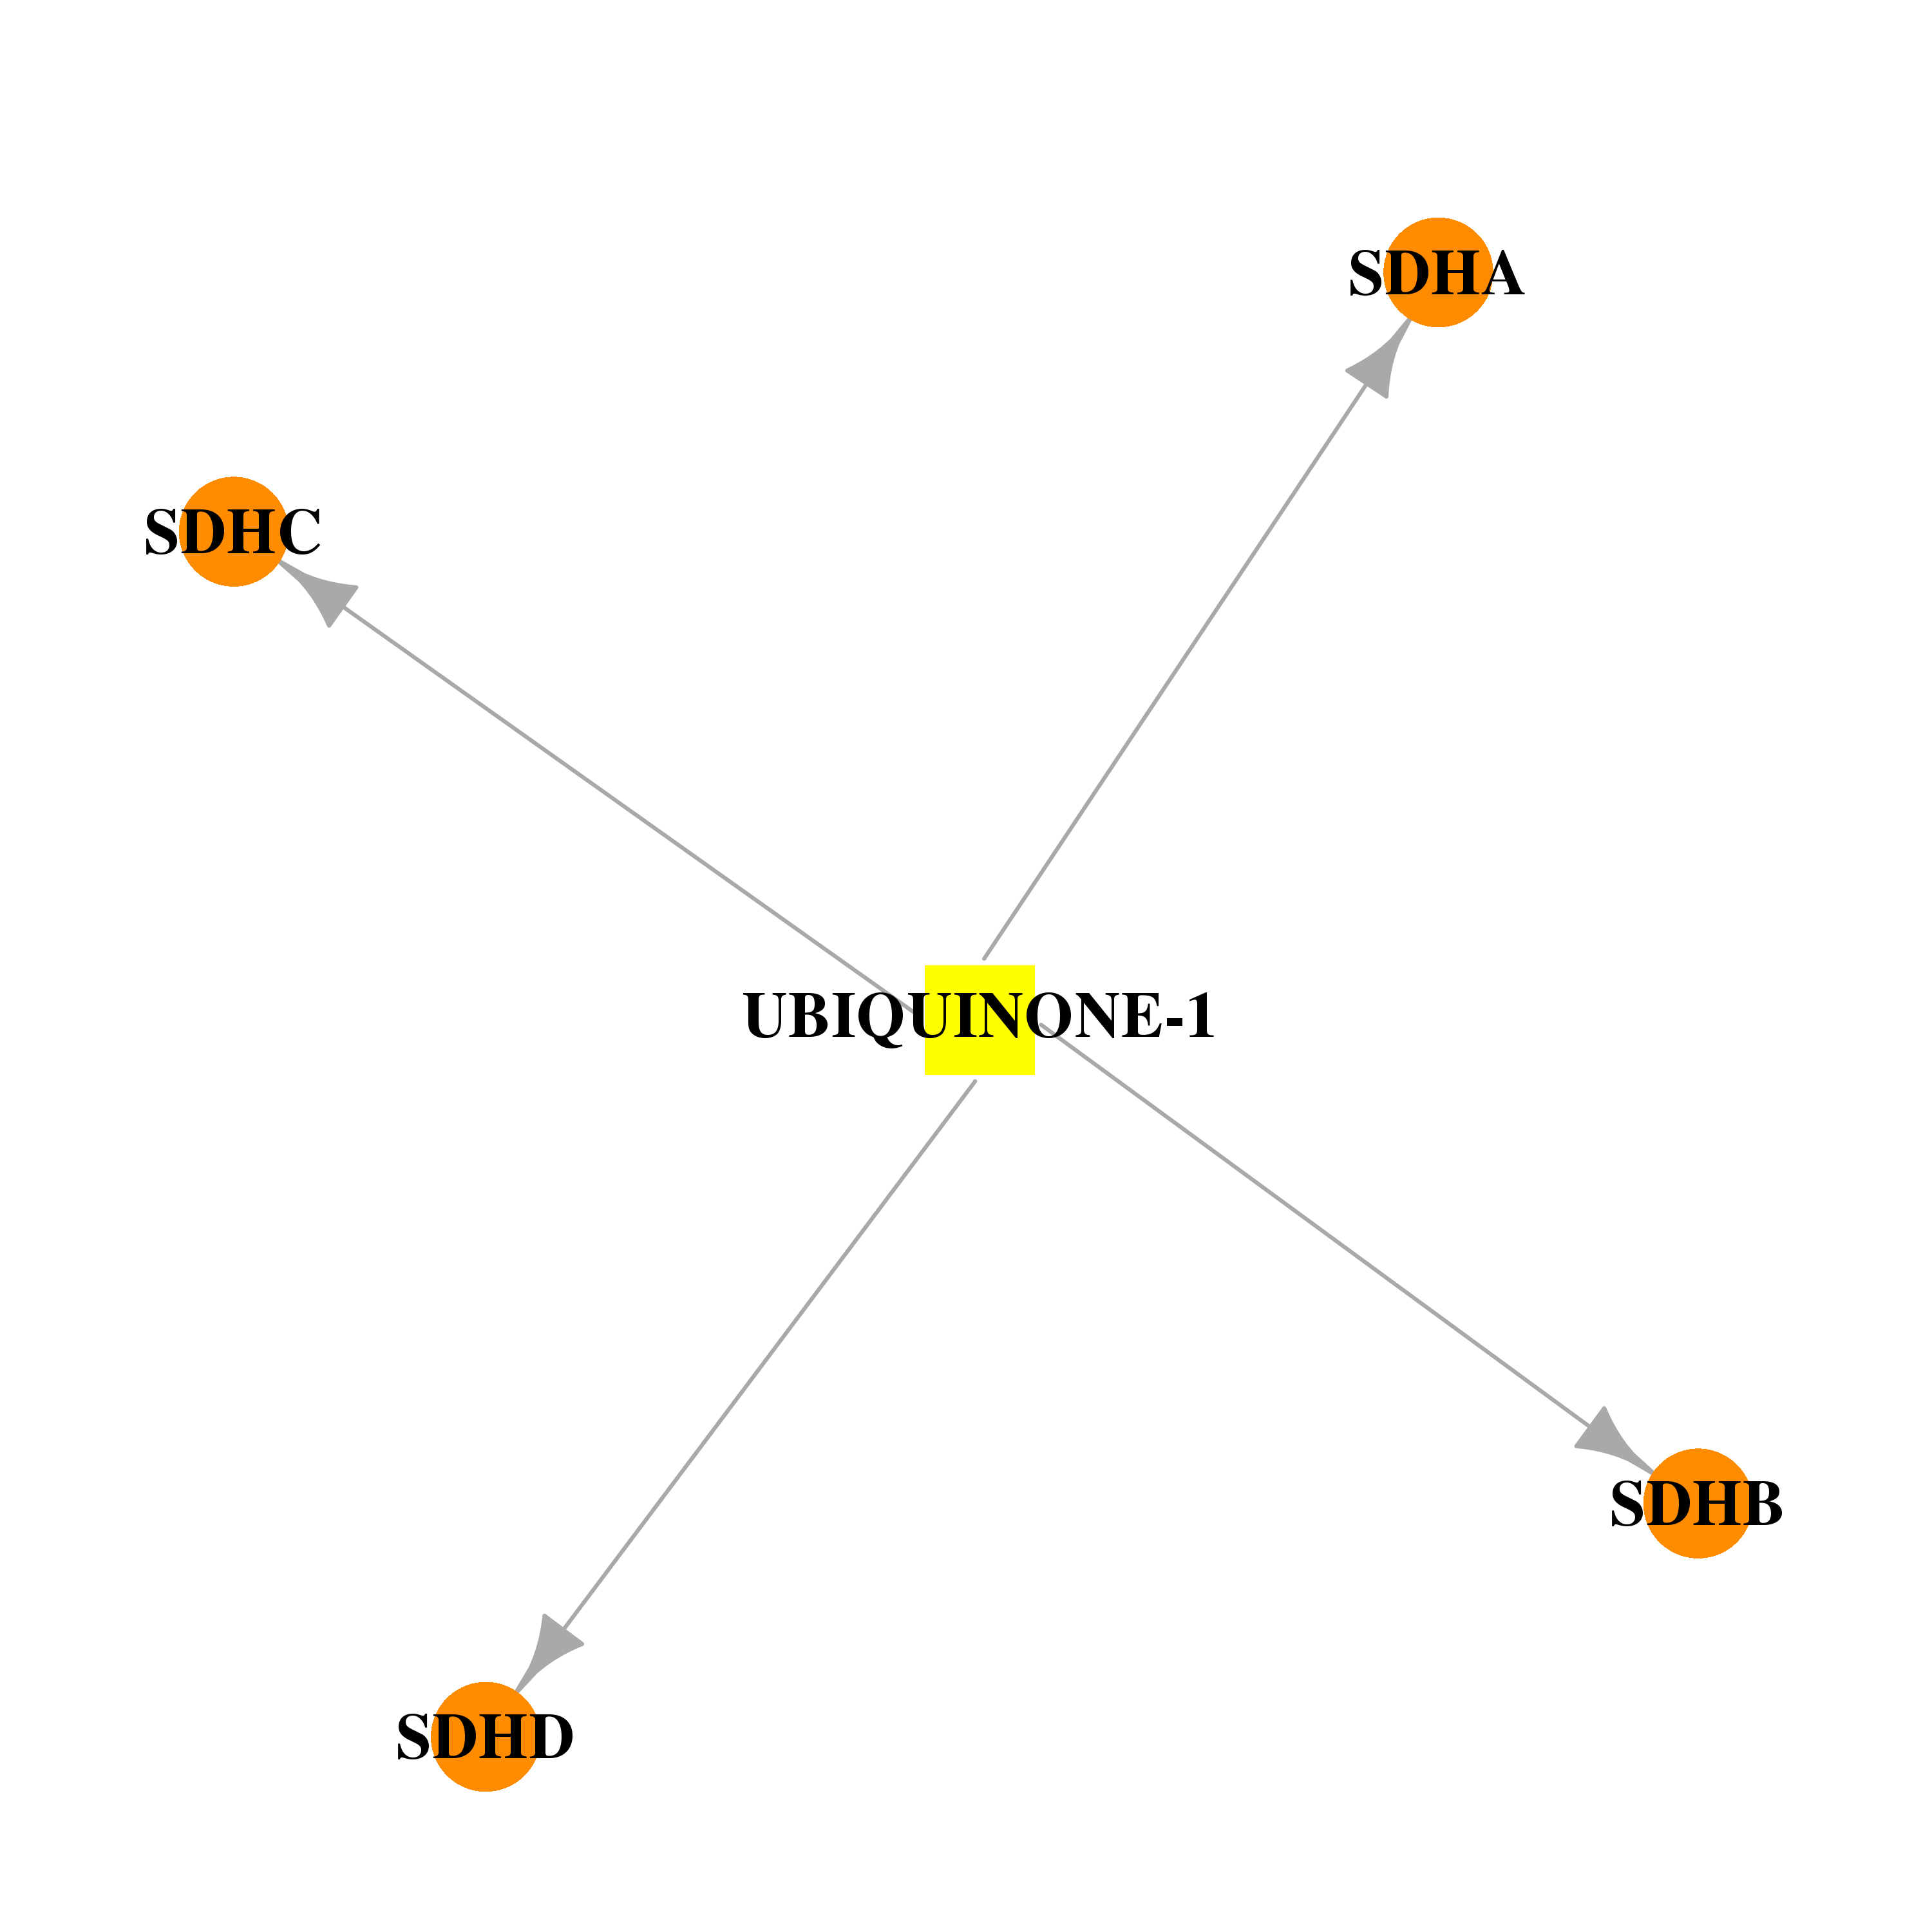 | 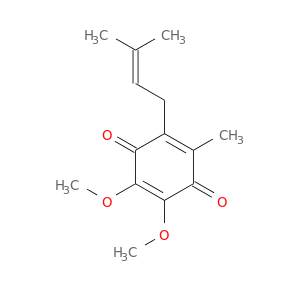 |
| Top |
| Cross referenced IDs for SDHC |
| * We obtained these cross-references from Uniprot database. It covers 150 different DBs, 18 categories. http://www.uniprot.org/help/cross_references_section |
: Open all cross reference information
|
Copyright © 2016-Present - The Univsersity of Texas Health Science Center at Houston @ |