|
||||||||||||||||||||
| |
| Phenotypic Information (metabolism pathway, cancer, disease, phenome) |
| |
| |
| Gene-Gene Network Information: Co-Expression Network, Interacting Genes & KEGG |
| |
|


| Gene Summary for SEC13 |
| Top |
| Phenotypic Information for SEC13(metabolism pathway, cancer, disease, phenome) |
| Cancer | CGAP: SEC13 |
| Familial Cancer Database: SEC13 | |
| * This gene is included in those cancer gene databases. |
|
|
|
|
|
| . | ||||||||||||||
Oncogene 1 | Significant driver gene in | |||||||||||||||||||
| cf) number; DB name 1 Oncogene; http://nar.oxfordjournals.org/content/35/suppl_1/D721.long, 2 Tumor Suppressor gene; https://bioinfo.uth.edu/TSGene/, 3 Cancer Gene Census; http://www.nature.com/nrc/journal/v4/n3/abs/nrc1299.html, 4 CancerGenes; http://nar.oxfordjournals.org/content/35/suppl_1/D721.long, 5 Network of Cancer Gene; http://ncg.kcl.ac.uk/index.php, 1Therapeutic Vulnerabilities in Cancer; http://cbio.mskcc.org/cancergenomics/statius/ |
| REACTOME_METABOLISM_OF_PROTEINS | |
| OMIM | |
| Orphanet | |
| Disease | KEGG Disease: SEC13 |
| MedGen: SEC13 (Human Medical Genetics with Condition) | |
| ClinVar: SEC13 | |
| Phenotype | MGI: SEC13 (International Mouse Phenotyping Consortium) |
| PhenomicDB: SEC13 | |
| Mutations for SEC13 |
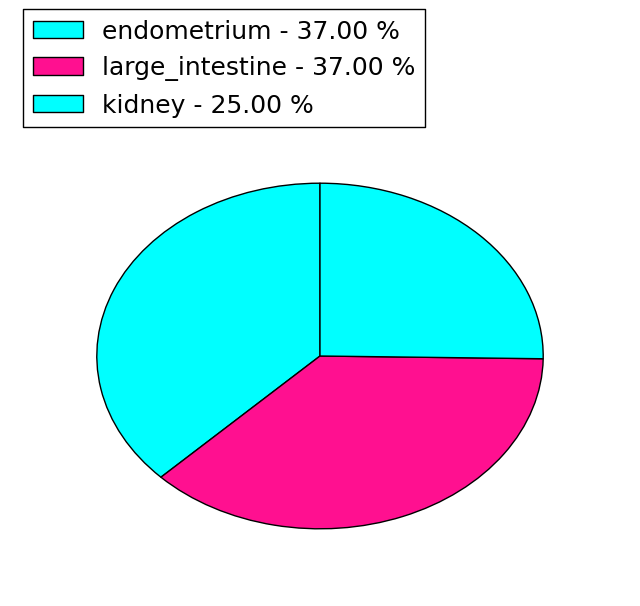
| * Under tables are showing count per each tissue to give us broad intuition about tissue specific mutation patterns.You can go to the detailed page for each mutation database's web site. |
| There's no structural variation information in COSMIC data for this gene. |
| * From mRNA Sanger sequences, Chitars2.0 arranged chimeric transcripts. This table shows SEC13 related fusion information. |
| ID | Head Gene | Tail Gene | Accession | Gene_a | qStart_a | qEnd_a | Chromosome_a | tStart_a | tEnd_a | Gene_a | qStart_a | qEnd_a | Chromosome_a | tStart_a | tEnd_a |
| BG256737 | MRPS10 | 1 | 339 | 6 | 42175255 | 42175596 | SEC13 | 335 | 725 | 3 | 10343270 | 10343668 | |
| DW441224 | TOMM7 | 18 | 262 | 7 | 22857627 | 22862498 | SEC13 | 257 | 379 | 3 | 10342765 | 10342887 | |
| BE161424 | KHNYN | 24 | 77 | 14 | 24908767 | 24908820 | SEC13 | 72 | 549 | 3 | 10343009 | 10353671 | |
| Top |
| There's no copy number variation information in COSMIC data for this gene. |
| Top |
|
 |
| Top |
| Stat. for Non-Synonymous SNVs (# total SNVs=25) | (# total SNVs=8) |
 |  |
(# total SNVs=0) | (# total SNVs=0) |
| Top |
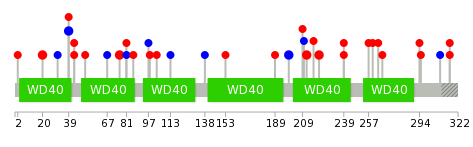
| * When you move the cursor on each content, you can see more deailed mutation information on the Tooltip. Those are primary_site,primary_histology,mutation(aa),pubmedID. |
| GRCh37 position | Mutation(aa) | Unique sampleID count |
| chr3:10354321-10354321 | p.W86* | 2 |
| chr3:10357109-10357109 | p.Q20H | 2 |
| chr3:10346828-10346828 | p.D199D | 2 |
| chr3:10354352-10354352 | p.S76L | 2 |
| chr3:10346764-10346764 | p.A221T | 2 |
| chr3:10357052-10357052 | p.I39I | 2 |
| chr3:10345775-10345775 | p.V264L | 1 |
| chr3:10357076-10357076 | p.C31C | 1 |
| chr3:10346795-10346795 | p.A210A | 1 |
| chr3:10345786-10345786 | p.K260R | 1 |
| Top |
|
 |
| Point Mutation/ Tissue ID | 1 | 2 | 3 | 4 | 5 | 6 | 7 | 8 | 9 | 10 | 11 | 12 | 13 | 14 | 15 | 16 | 17 | 18 | 19 | 20 |
| # sample | 2 | 1 | 3 | 3 | 1 | 4 | 1 | 2 | 5 | 3 | 7 | |||||||||
| # mutation | 2 | 1 | 3 | 3 | 1 | 4 | 1 | 2 | 5 | 3 | 7 | |||||||||
| nonsynonymous SNV | 1 | 1 | 2 | 1 | 1 | 3 | 1 | 2 | 3 | 2 | 4 | |||||||||
| synonymous SNV | 1 | 1 | 2 | 1 | 2 | 1 | 3 |
| cf) Tissue ID; Tissue type (1; BLCA[Bladder Urothelial Carcinoma], 2; BRCA[Breast invasive carcinoma], 3; CESC[Cervical squamous cell carcinoma and endocervical adenocarcinoma], 4; COAD[Colon adenocarcinoma], 5; GBM[Glioblastoma multiforme], 6; Glioma Low Grade, 7; HNSC[Head and Neck squamous cell carcinoma], 8; KICH[Kidney Chromophobe], 9; KIRC[Kidney renal clear cell carcinoma], 10; KIRP[Kidney renal papillary cell carcinoma], 11; LAML[Acute Myeloid Leukemia], 12; LUAD[Lung adenocarcinoma], 13; LUSC[Lung squamous cell carcinoma], 14; OV[Ovarian serous cystadenocarcinoma ], 15; PAAD[Pancreatic adenocarcinoma], 16; PRAD[Prostate adenocarcinoma], 17; SKCM[Skin Cutaneous Melanoma], 18:STAD[Stomach adenocarcinoma], 19:THCA[Thyroid carcinoma], 20:UCEC[Uterine Corpus Endometrial Carcinoma]) |
| Top |
| * We represented just top 10 SNVs. When you move the cursor on each content, you can see more deailed mutation information on the Tooltip. Those are primary_site, primary_histology, mutation(aa), pubmedID. |
| Genomic Position | Mutation(aa) | Unique sampleID count |
| chr3:10346828 | p.I25I,SEC13 | 2 |
| chr3:10357052 | p.D185D,SEC13 | 2 |
| chr3:10345822 | p.D203N,SEC13 | 1 |
| chr3:10354272 | p.R29H,SEC13 | 1 |
| chr3:10357076 | p.S198R,SEC13 | 1 |
| chr3:10345850 | p.R29C,SEC13 | 1 |
| chr3:10354287 | p.S198R,SEC13 | 1 |
| chr3:10346764 | p.E195Q,SEC13 | 1 |
| chr3:10354288 | p.C17C,SEC13 | 1 |
| chr3:10342967 | p.E302A,SEC13 | 1 |
| * Copy number data were extracted from TCGA using R package TCGA-Assembler. The URLs of all public data files on TCGA DCC data server were gathered on Jan-05-2015. Function ProcessCNAData in TCGA-Assembler package was used to obtain gene-level copy number value which is calculated as the average copy number of the genomic region of a gene. |
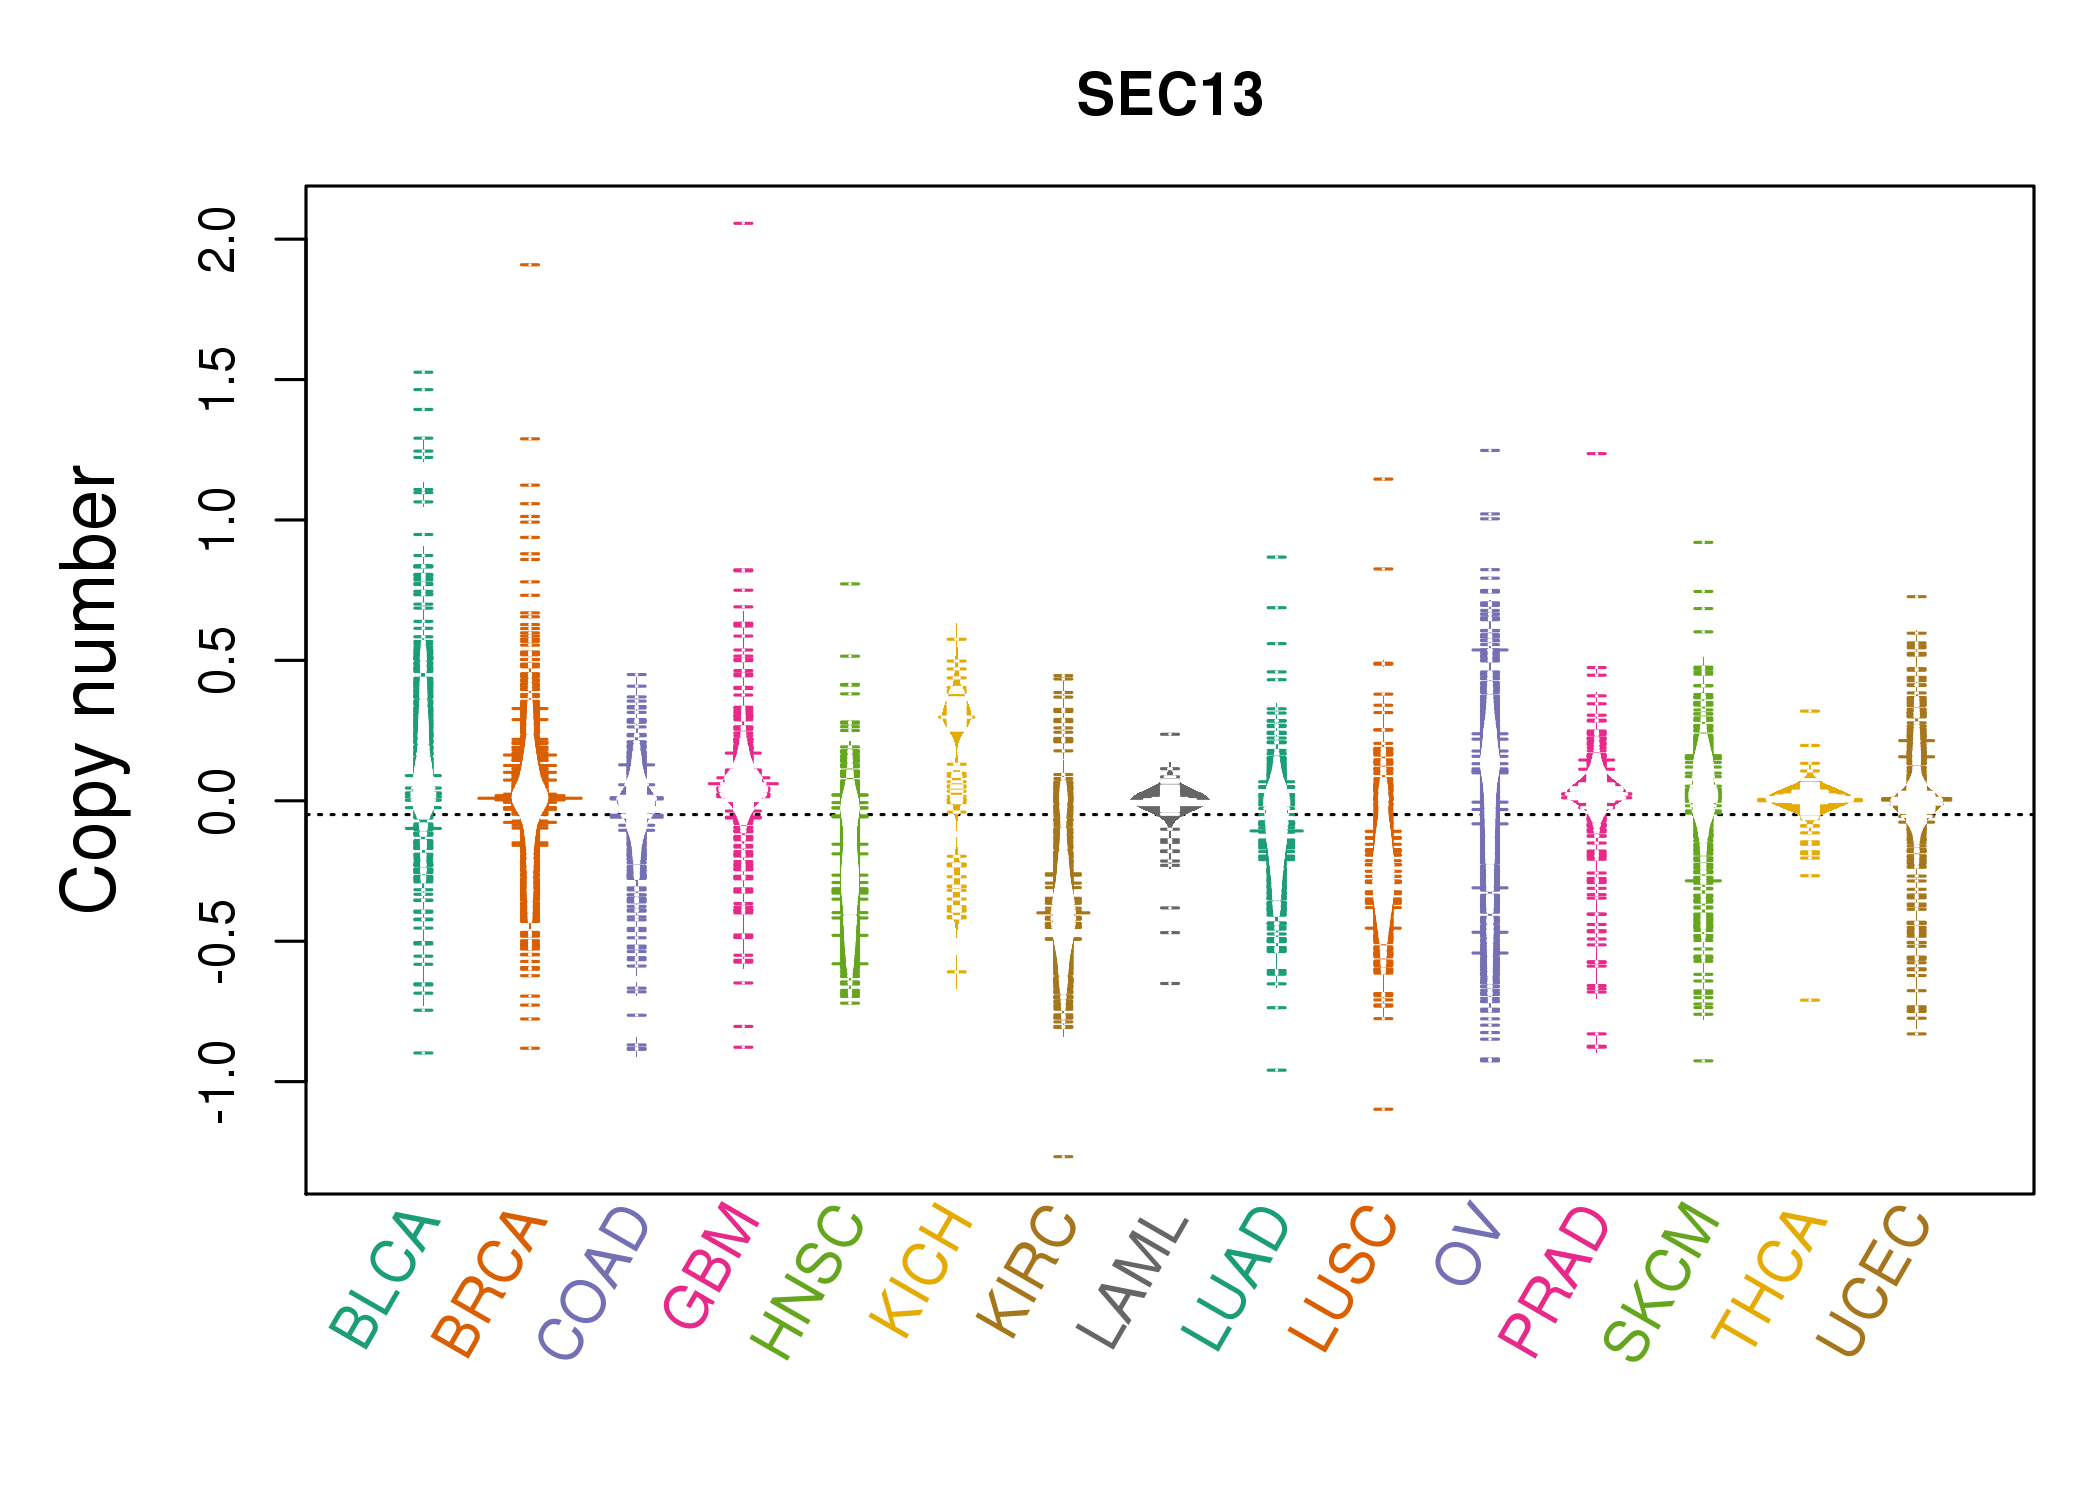 |
| cf) Tissue ID[Tissue type]: BLCA[Bladder Urothelial Carcinoma], BRCA[Breast invasive carcinoma], CESC[Cervical squamous cell carcinoma and endocervical adenocarcinoma], COAD[Colon adenocarcinoma], GBM[Glioblastoma multiforme], Glioma Low Grade, HNSC[Head and Neck squamous cell carcinoma], KICH[Kidney Chromophobe], KIRC[Kidney renal clear cell carcinoma], KIRP[Kidney renal papillary cell carcinoma], LAML[Acute Myeloid Leukemia], LUAD[Lung adenocarcinoma], LUSC[Lung squamous cell carcinoma], OV[Ovarian serous cystadenocarcinoma ], PAAD[Pancreatic adenocarcinoma], PRAD[Prostate adenocarcinoma], SKCM[Skin Cutaneous Melanoma], STAD[Stomach adenocarcinoma], THCA[Thyroid carcinoma], UCEC[Uterine Corpus Endometrial Carcinoma] |
| Top |
| Gene Expression for SEC13 |
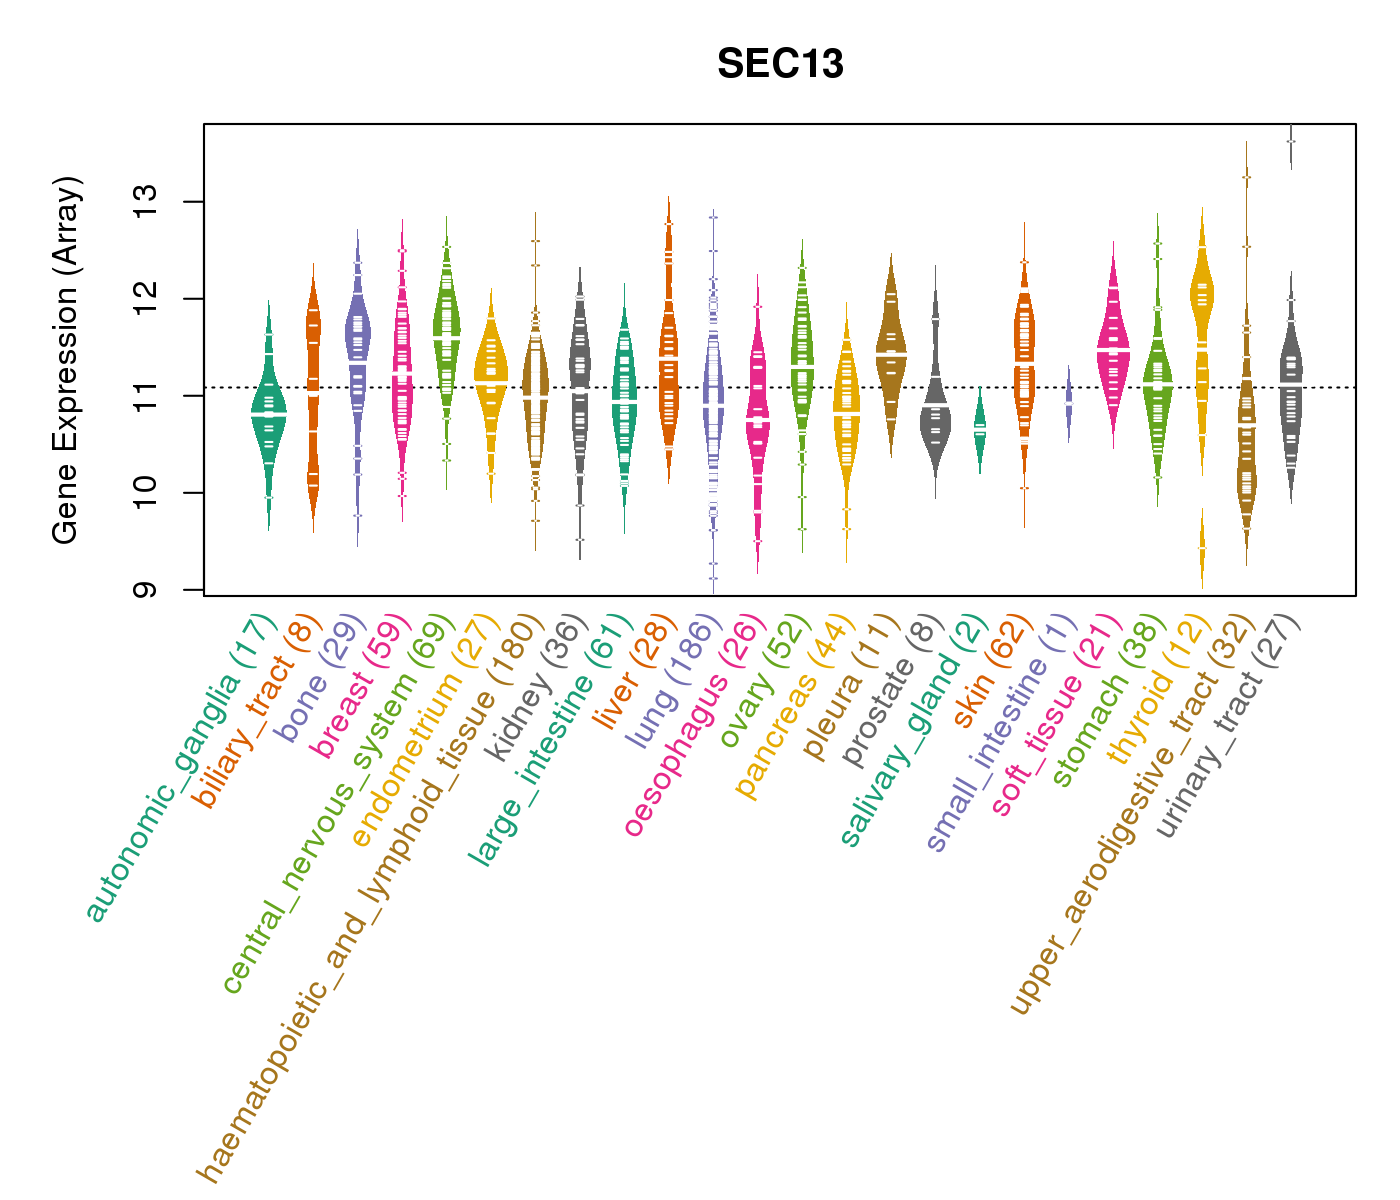
| * CCLE gene expression data were extracted from CCLE_Expression_Entrez_2012-10-18.res: Gene-centric RMA-normalized mRNA expression data. |
 |
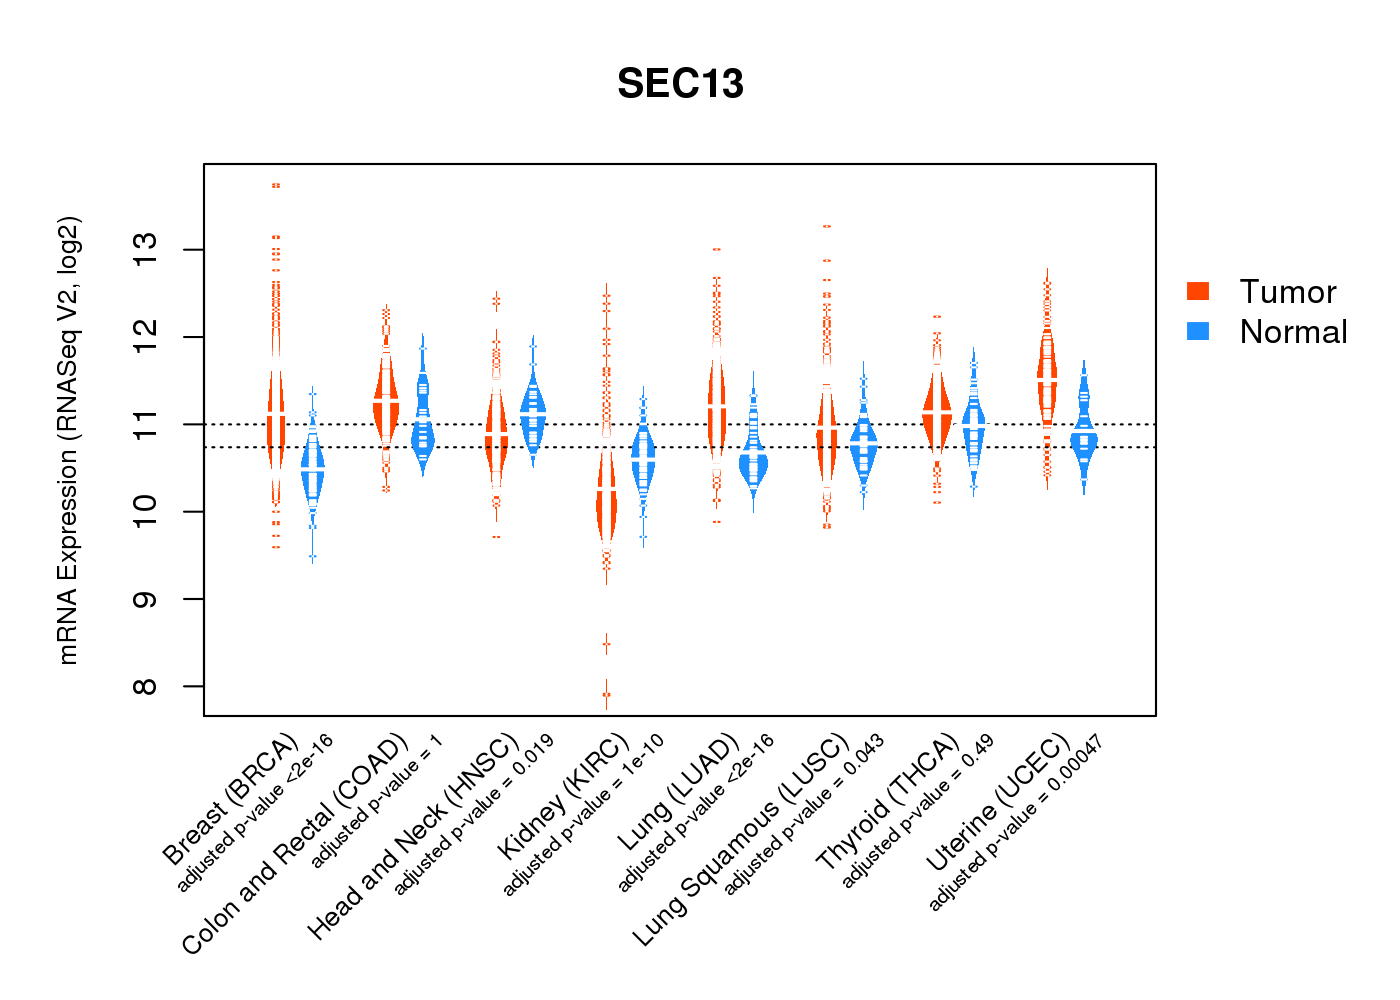
| * Normalized gene expression data of RNASeqV2 was extracted from TCGA using R package TCGA-Assembler. The URLs of all public data files on TCGA DCC data server were gathered at Jan-05-2015. Only eight cancer types have enough normal control samples for differential expression analysis. (t test, adjusted p<0.05 (using Benjamini-Hochberg FDR)) |
 |
| Top |
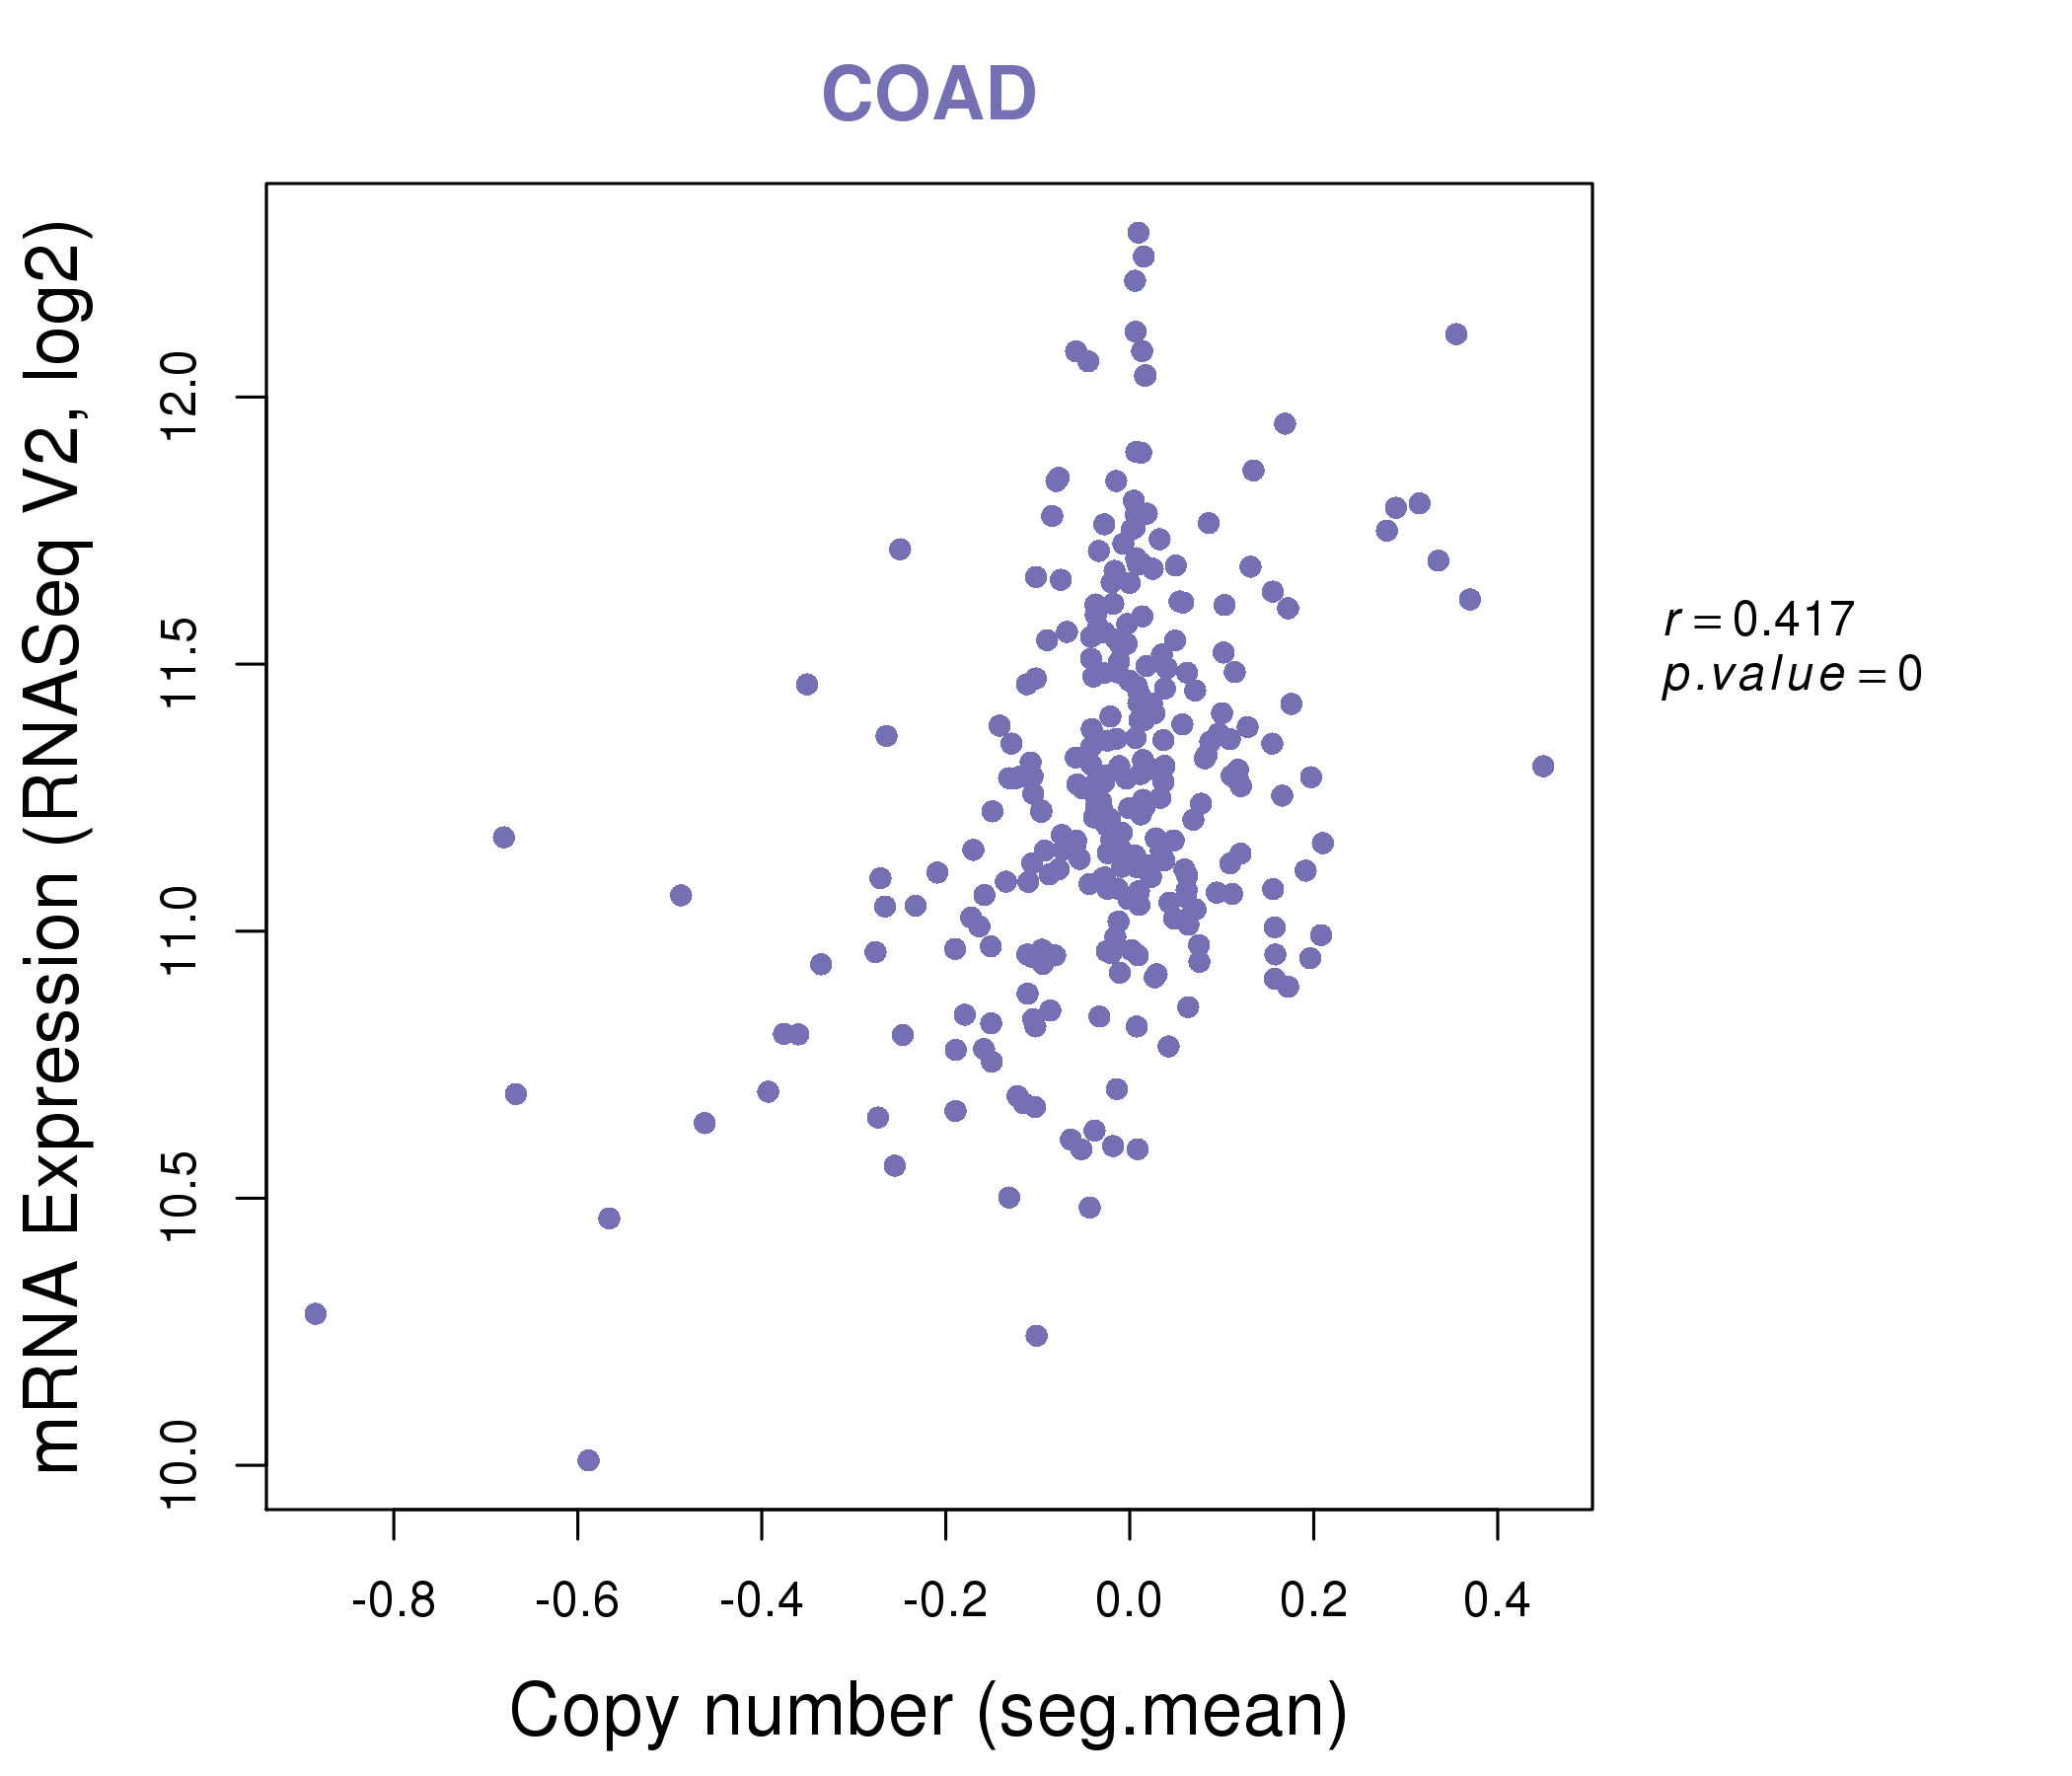
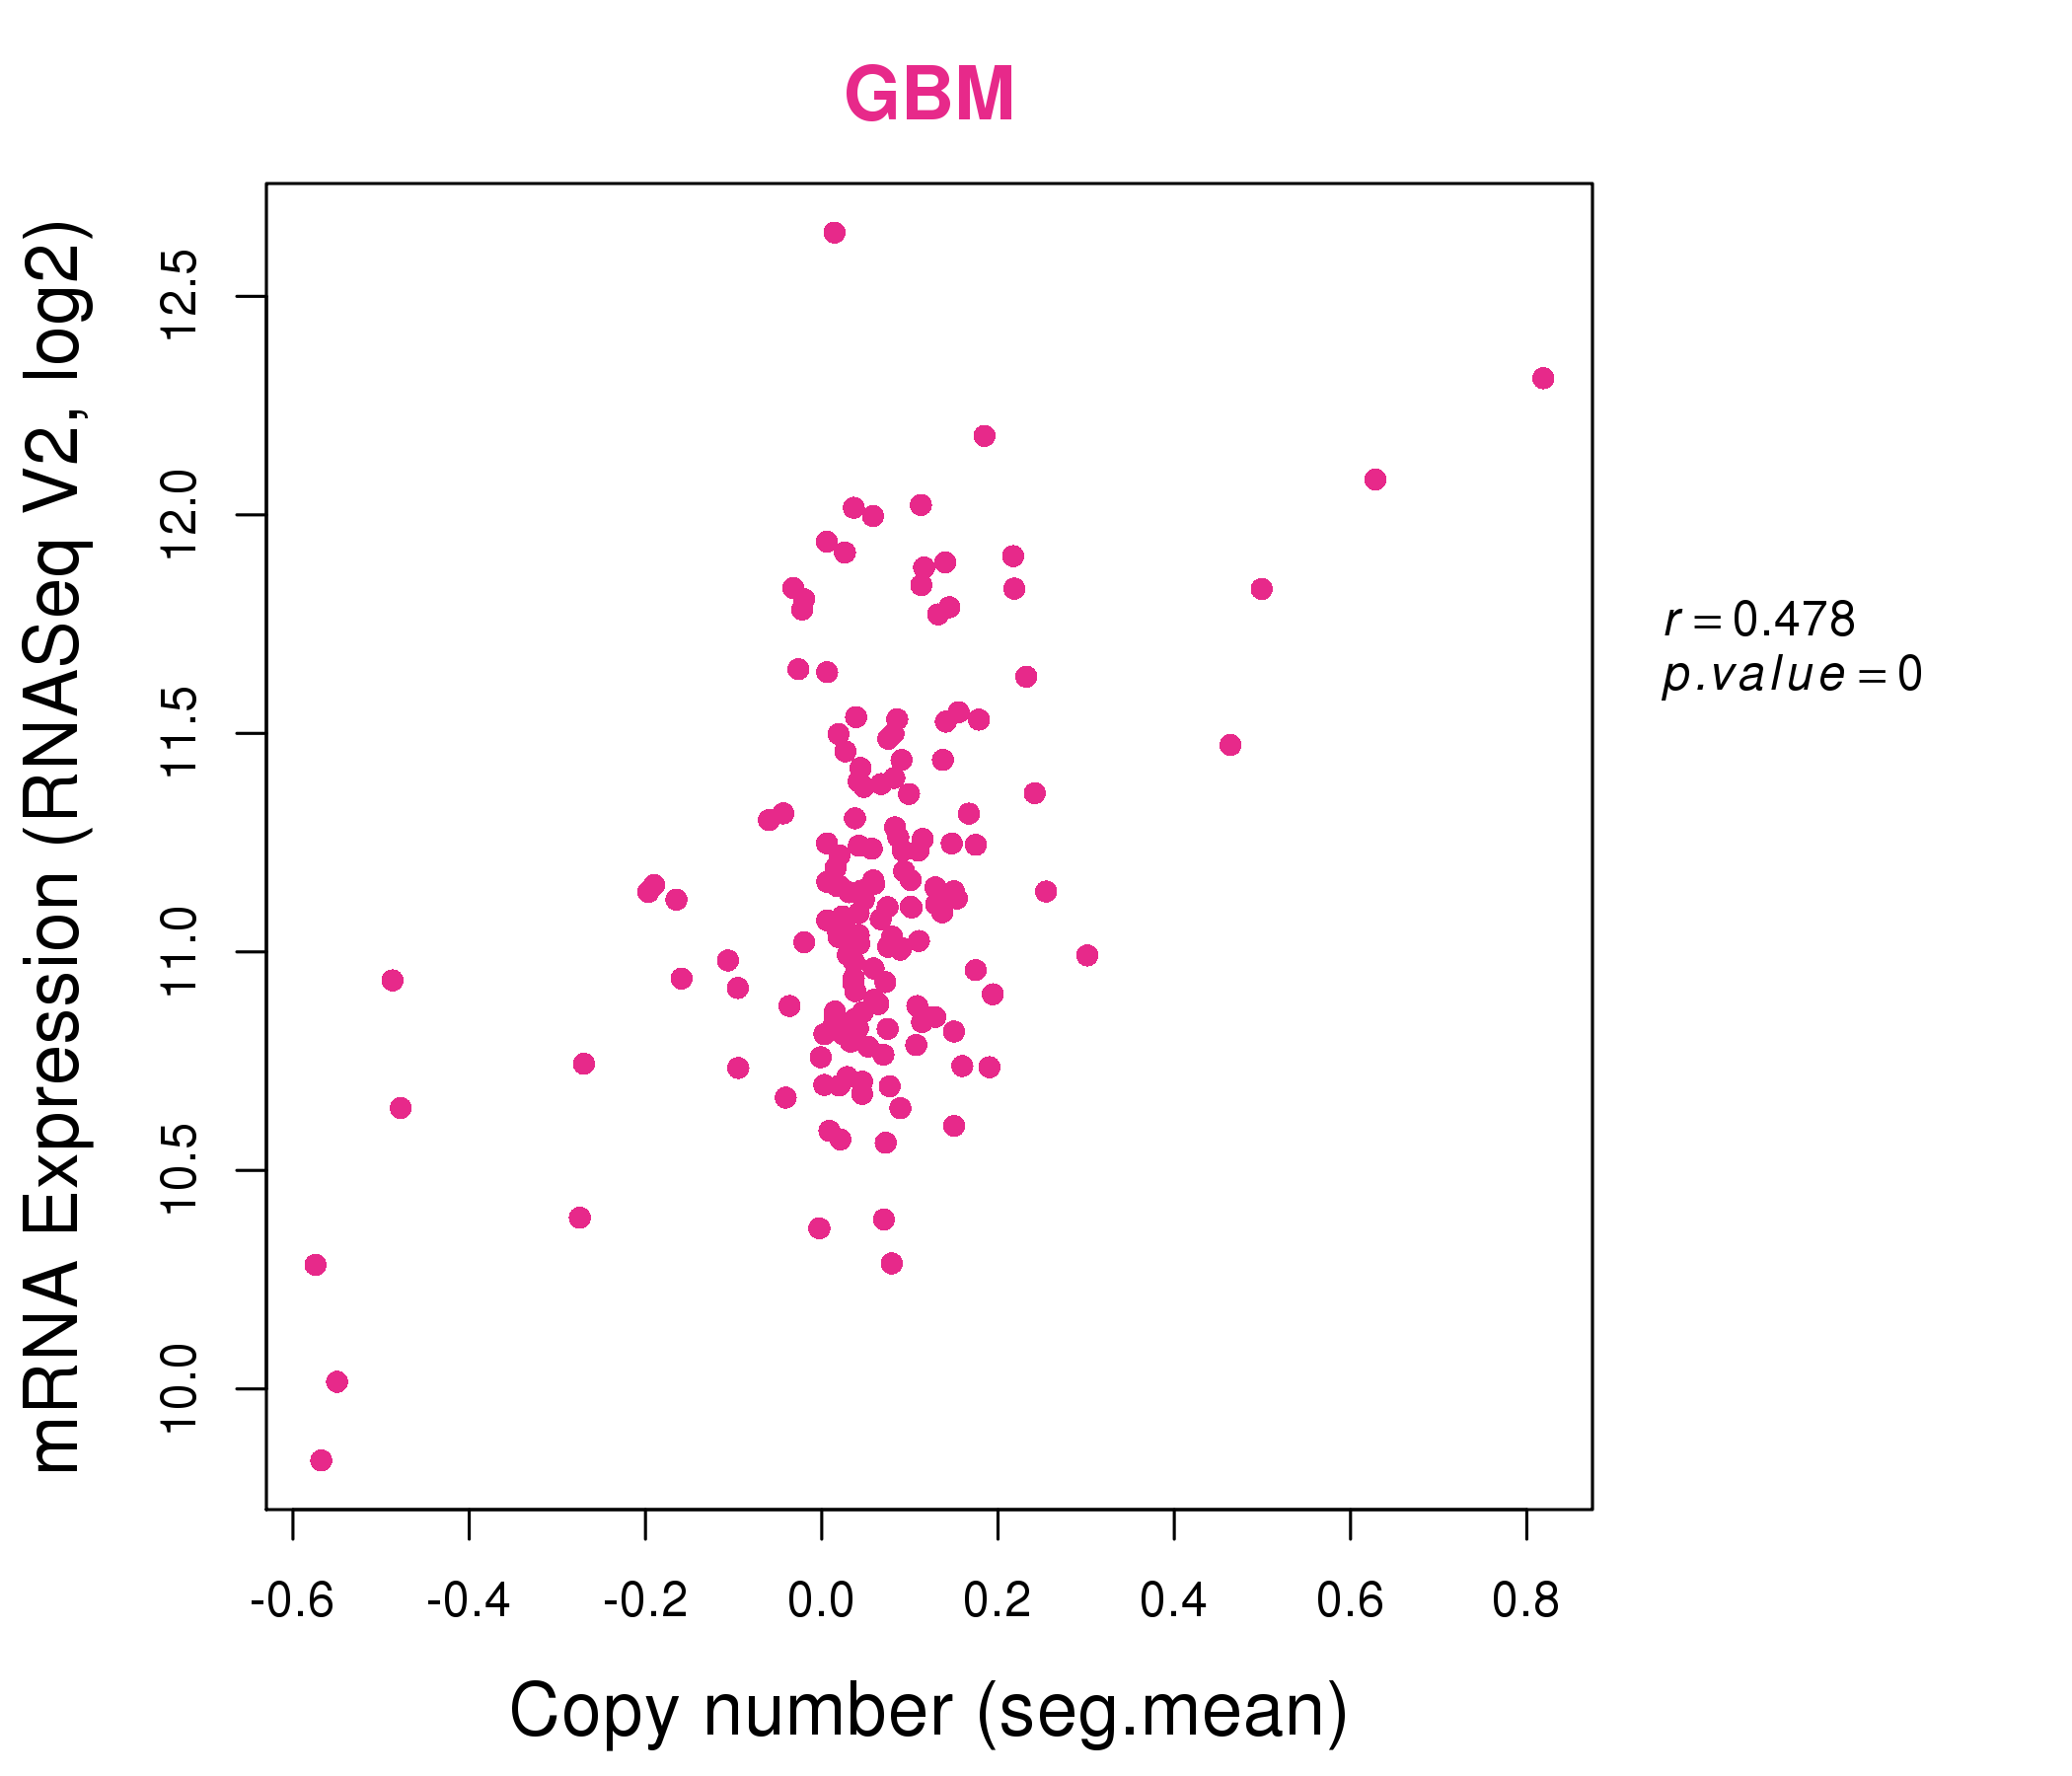
| * This plots show the correlation between CNV and gene expression. |
: Open all plots for all cancer types
 |
|
 |
|

| Top |
| Gene-Gene Network Information |
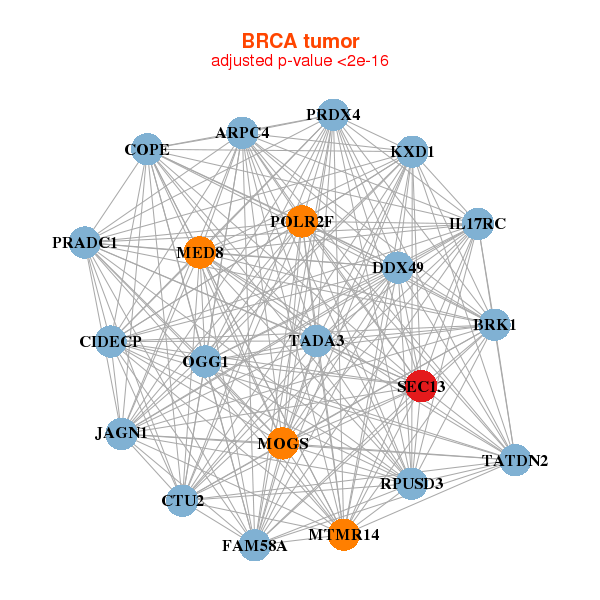
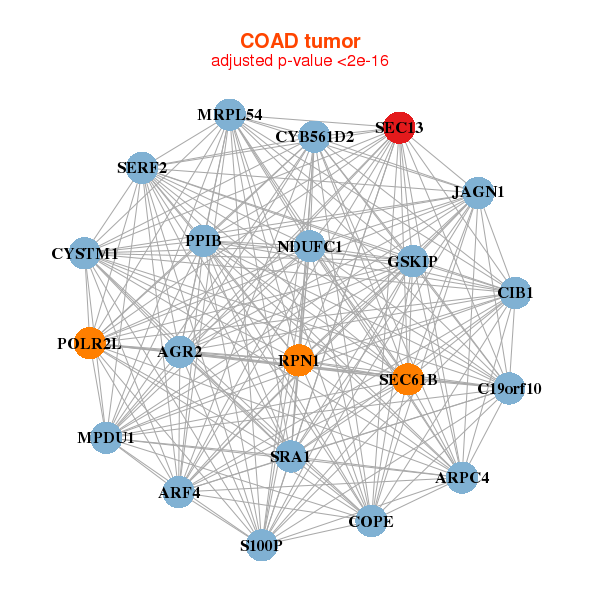
| * Co-Expression network figures were drawn using R package igraph. Only the top 20 genes with the highest correlations were shown. Red circle: input gene, orange circle: cell metabolism gene, sky circle: other gene |
: Open all plots for all cancer types
 |
|
| ARPC4,KXD1,PRADC1,BRK1,CIDECP,COPE,CTU2, DDX49,FAM58A,IL17RC,JAGN1,MED8,MOGS,MTMR14, OGG1,POLR2F,PRDX4,RPUSD3,SEC13,TADA3,TATDN2 | ADRM1,AP2S1,ARHGDIA,ASNA1,KXD1,CHMP2A,COPE, CUEDC2,DRAP1,GNB2,MRPL28,NAA10,PSMC3,PSMC4, LAMTOR2,SDF4,SEC13,SLC39A3,USP5,YIF1A,YKT6 |
 |
|
| AGR2,ARF4,ARPC4,GSKIP,C19orf10,CYSTM1,CIB1, COPE,CYB561D2,JAGN1,MPDU1,MRPL54,NDUFC1,POLR2L, PPIB,RPN1,S100P,SEC13,SEC61B,SERF2,SRA1 | AKR1A1,ATOX1,COA4,CNPY2,COQ6,GLRX,GLYATL1, GOSR2,GSTO1,NTMT1,MRPL55,P4HB,PPAPDC1B,SEC13, SEC24D,SLC35B1,SNRPA1,TFEC,TSPO2,YIF1A,YIPF5 |
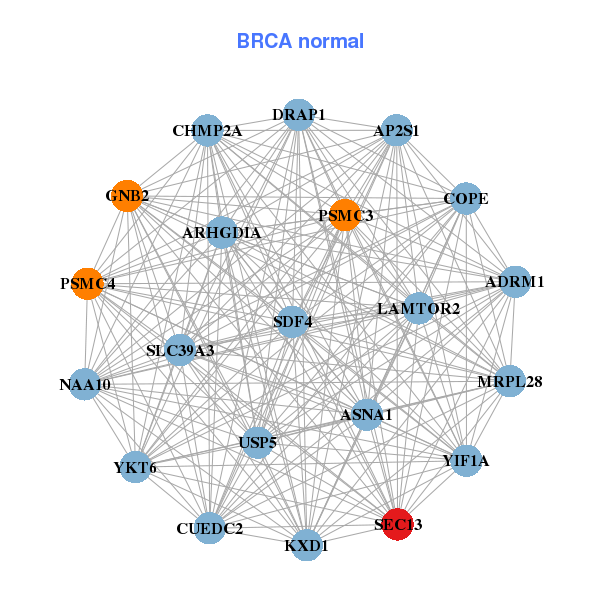

| * Co-Expression network figures were drawn using R package igraph. Only the top 20 genes with the highest correlations were shown. Red circle: input gene, orange circle: cell metabolism gene, sky circle: other gene |
: Open all plots for all cancer types
| Top |
: Open all interacting genes' information including KEGG pathway for all interacting genes from DAVID
| Top |
| Pharmacological Information for SEC13 |
| There's no related Drug. |
| Top |
| Cross referenced IDs for SEC13 |
| * We obtained these cross-references from Uniprot database. It covers 150 different DBs, 18 categories. http://www.uniprot.org/help/cross_references_section |
: Open all cross reference information
|
Copyright © 2016-Present - The Univsersity of Texas Health Science Center at Houston @ |