|
||||||||||||||||||||||||||||||||||||||||||||||||||||||||||||||||||||||||||||||||||||||||||||||||||||||||||||||||||||||||||||||||||||||||||||||||||||||||||||||||||||||||||||||||||||||||||||||||||||||||||||||||||||||||||||||||||||||||||||||||||||||||||||||||||||||||||||||||||||||||||||||||||||||||||||||||||||||||||
| |
| Phenotypic Information (metabolism pathway, cancer, disease, phenome) |
| |
| |
| Gene-Gene Network Information: Co-Expression Network, Interacting Genes & KEGG |
| |
|


| Gene Summary for KIF13A |
| Top |
| Phenotypic Information for KIF13A(metabolism pathway, cancer, disease, phenome) |
| Cancer | CGAP: KIF13A |
| Familial Cancer Database: KIF13A | |
| * This gene is included in those cancer gene databases. |
|
|
|
|
|
| . | ||||||||||||||||||||||||||||||||||||||||||||||||||||||||||||||||||||||||||||||||||||||||||||||||||||||||||||||||||||||||||||||||||||||||||||||||||||||||||||||||||||||||||||||||||||||||||||||||||||||||||||||||||||||||||||||||||||||||||||||||||||||||||||||||||||||||||||||||||||||||||||||||||||||||||||||||||||
Oncogene 1 | Significant driver gene in STAD 6, | |||||||||||||||||||||||||||||||||||||||||||||||||||||||||||||||||||||||||||||||||||||||||||||||||||||||||||||||||||||||||||||||||||||||||||||||||||||||||||||||||||||||||||||||||||||||||||||||||||||||||||||||||||||||||||||||||||||||||||||||||||||||||||||||||||||||||||||||||||||||||||||||||||||||||||||||||||||||||
| cf) number; DB name 1 Oncogene; http://nar.oxfordjournals.org/content/35/suppl_1/D721.long, 2 Tumor Suppressor gene; https://bioinfo.uth.edu/TSGene/, 3 Cancer Gene Census; http://www.nature.com/nrc/journal/v4/n3/abs/nrc1299.html, 4 CancerGenes; http://nar.oxfordjournals.org/content/35/suppl_1/D721.long, 5 Network of Cancer Gene; http://ncg.kcl.ac.uk/index.php, 6 http://www.nature.com/nature/journal/v513/n7517/full/nature13480.html, 7Therapeutic Vulnerabilities in Cancer; http://cbio.mskcc.org/cancergenomics/statius/ |
| REACTOME_METABOLISM_OF_PROTEINS | |
| OMIM | 605433; gene. 605433; gene. |
| Orphanet | |
| Disease | KEGG Disease: KIF13A |
| MedGen: KIF13A (Human Medical Genetics with Condition) | |
| ClinVar: KIF13A | |
| Phenotype | MGI: KIF13A (International Mouse Phenotyping Consortium) |
| PhenomicDB: KIF13A | |
| Mutations for KIF13A |
| * Under tables are showing count per each tissue to give us broad intuition about tissue specific mutation patterns.You can go to the detailed page for each mutation database's web site. |
| - Statistics for Tissue and Mutation type | Top |
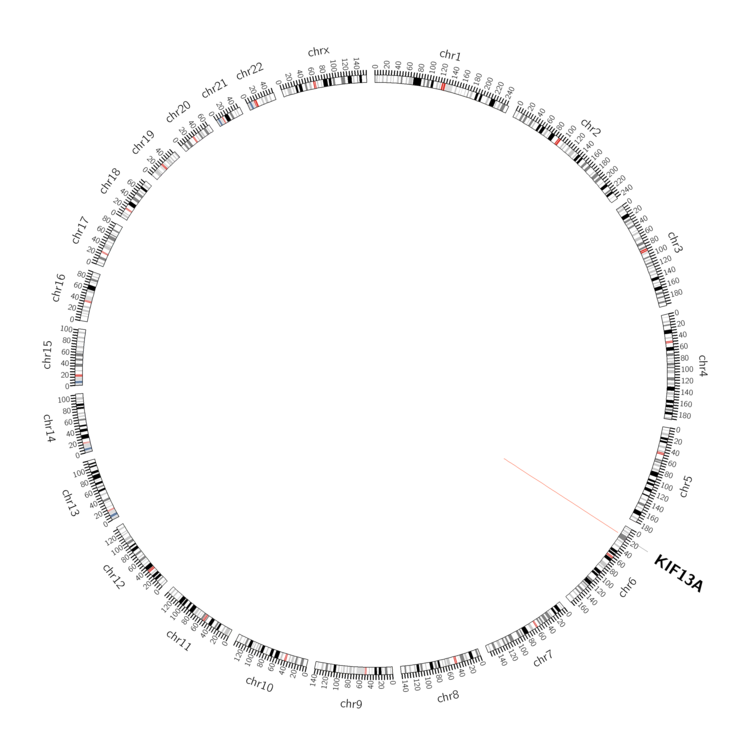 |
| - For Inter-chromosomal Variations |
| There's no inter-chromosomal structural variation. |
| - For Intra-chromosomal Variations |
| * Intra-chromosomal variantions includes 'intrachromosomal amplicon to amplicon', 'intrachromosomal amplicon to non-amplified dna', 'intrachromosomal deletion', 'intrachromosomal fold-back inversion', 'intrachromosomal inversion', 'intrachromosomal tandem duplication', 'Intrachromosomal unknown type', 'intrachromosomal with inverted orientation', 'intrachromosomal with non-inverted orientation'. |
 |
| Sample | Symbol_a | Chr_a | Start_a | End_a | Symbol_b | Chr_b | Start_b | End_b |
| ovary | KIF13A | chr6 | 17956178 | 17956198 | KIF13A | chr6 | 17949390 | 17949410 |
| cf) Tissue number; Tissue name (1;Breast, 2;Central_nervous_system, 3;Haematopoietic_and_lymphoid_tissue, 4;Large_intestine, 5;Liver, 6;Lung, 7;Ovary, 8;Pancreas, 9;Prostate, 10;Skin, 11;Soft_tissue, 12;Upper_aerodigestive_tract) |
| * From mRNA Sanger sequences, Chitars2.0 arranged chimeric transcripts. This table shows KIF13A related fusion information. |
| ID | Head Gene | Tail Gene | Accession | Gene_a | qStart_a | qEnd_a | Chromosome_a | tStart_a | tEnd_a | Gene_a | qStart_a | qEnd_a | Chromosome_a | tStart_a | tEnd_a |
| BQ428394 | KIAA0195 | 12 | 375 | 17 | 73494555 | 73495376 | KIF13A | 367 | 671 | 6 | 17760669 | 17760973 | |
| T07391 | BZW2 | 1 | 144 | 7 | 16746001 | 16746144 | KIF13A | 134 | 306 | 6 | 17965364 | 17965643 | |
| BF001556 | TBC1D9B | 1 | 215 | 5 | 179289743 | 179289957 | KIF13A | 210 | 588 | 6 | 17826007 | 17828603 | |
| BF357666 | KIF13A | 1 | 239 | 6 | 17831343 | 17834305 | KIF13A | 236 | 320 | 6 | 17826109 | 17826296 | |
| AW993933 | HEATR5B | 17 | 472 | 2 | 37244126 | 37244584 | KIF13A | 455 | 479 | 6 | 17888794 | 17888823 | |
| Top |
| Mutation type/ Tissue ID | brca | cns | cerv | endome | haematopo | kidn | Lintest | liver | lung | ns | ovary | pancre | prost | skin | stoma | thyro | urina | |||
| Total # sample | 1 | |||||||||||||||||||
| GAIN (# sample) | 1 | |||||||||||||||||||
| LOSS (# sample) |
| cf) Tissue ID; Tissue type (1; Breast, 2; Central_nervous_system, 3; Cervix, 4; Endometrium, 5; Haematopoietic_and_lymphoid_tissue, 6; Kidney, 7; Large_intestine, 8; Liver, 9; Lung, 10; NS, 11; Ovary, 12; Pancreas, 13; Prostate, 14; Skin, 15; Stomach, 16; Thyroid, 17; Urinary_tract) |
| Top |
|
 |
| Top |
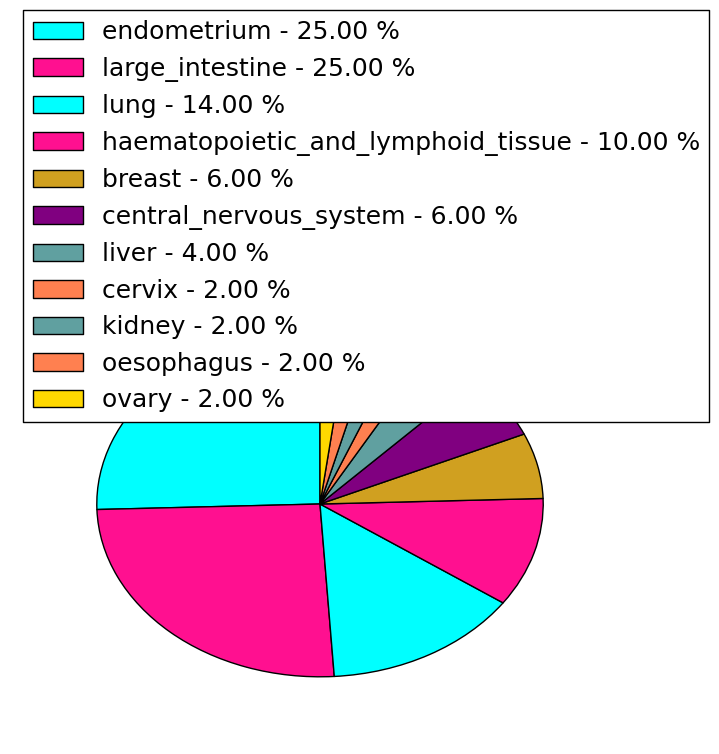
| Stat. for Non-Synonymous SNVs (# total SNVs=111) | (# total SNVs=48) |
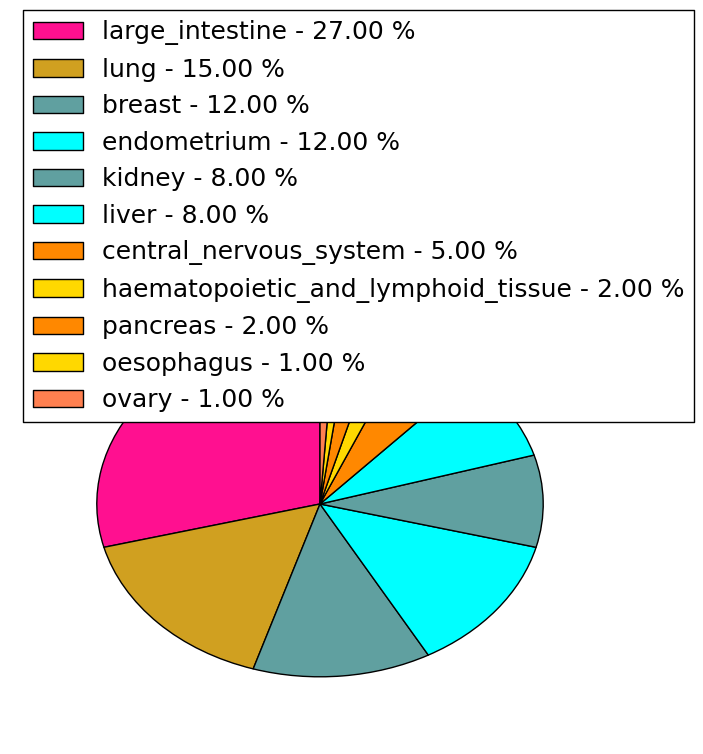 |  |
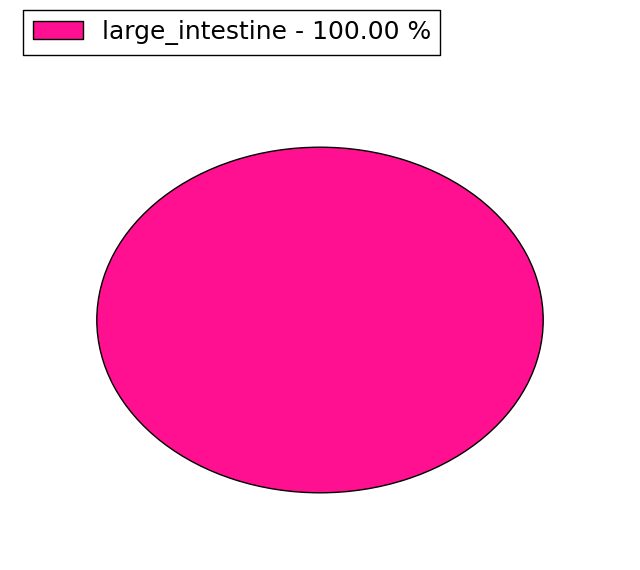
(# total SNVs=3) | (# total SNVs=1) |
 |  |
| Top |
| * When you move the cursor on each content, you can see more deailed mutation information on the Tooltip. Those are primary_site,primary_histology,mutation(aa),pubmedID. |
| GRCh37 position | Mutation(aa) | Unique sampleID count |
| chr6:17780996-17780996 | p.R1271R | 4 |
| chr6:17817423-17817423 | p.L610V | 2 |
| chr6:17779188-17779188 | p.R1361Q | 2 |
| chr6:17834206-17834206 | p.E418K | 2 |
| chr6:17855836-17855836 | p.S109F | 2 |
| chr6:17800215-17800215 | p.I862V | 2 |
| chr6:17800233-17800233 | p.V856I | 2 |
| chr6:17834246-17834246 | p.K404N | 2 |
| chr6:17856298-17856298 | p.Q92Q | 2 |
| chr6:17831419-17831419 | p.S438S | 2 |
| Top |
|
 |
| Point Mutation/ Tissue ID | 1 | 2 | 3 | 4 | 5 | 6 | 7 | 8 | 9 | 10 | 11 | 12 | 13 | 14 | 15 | 16 | 17 | 18 | 19 | 20 |
| # sample | 9 | 8 | 2 | 21 | 6 | 3 | 7 | 2 | 13 | 4 | 4 | 1 | 19 | 8 | 18 | |||||
| # mutation | 9 | 9 | 4 | 22 | 6 | 5 | 8 | 2 | 16 | 5 | 4 | 1 | 20 | 9 | 23 | |||||
| nonsynonymous SNV | 7 | 8 | 2 | 16 | 3 | 4 | 6 | 2 | 13 | 2 | 3 | 1 | 13 | 8 | 12 | |||||
| synonymous SNV | 2 | 1 | 2 | 6 | 3 | 1 | 2 | 3 | 3 | 1 | 7 | 1 | 11 |
| cf) Tissue ID; Tissue type (1; BLCA[Bladder Urothelial Carcinoma], 2; BRCA[Breast invasive carcinoma], 3; CESC[Cervical squamous cell carcinoma and endocervical adenocarcinoma], 4; COAD[Colon adenocarcinoma], 5; GBM[Glioblastoma multiforme], 6; Glioma Low Grade, 7; HNSC[Head and Neck squamous cell carcinoma], 8; KICH[Kidney Chromophobe], 9; KIRC[Kidney renal clear cell carcinoma], 10; KIRP[Kidney renal papillary cell carcinoma], 11; LAML[Acute Myeloid Leukemia], 12; LUAD[Lung adenocarcinoma], 13; LUSC[Lung squamous cell carcinoma], 14; OV[Ovarian serous cystadenocarcinoma ], 15; PAAD[Pancreatic adenocarcinoma], 16; PRAD[Prostate adenocarcinoma], 17; SKCM[Skin Cutaneous Melanoma], 18:STAD[Stomach adenocarcinoma], 19:THCA[Thyroid carcinoma], 20:UCEC[Uterine Corpus Endometrial Carcinoma]) |
| Top |
| * We represented just top 10 SNVs. When you move the cursor on each content, you can see more deailed mutation information on the Tooltip. Those are primary_site, primary_histology, mutation(aa), pubmedID. |
| Genomic Position | Mutation(aa) | Unique sampleID count |
| chr6:17779188 | p.F780F,KIF13A | 2 |
| chr6:17831438 | p.R1348Q,KIF13A | 2 |
| chr6:17834246 | p.S109F,KIF13A | 2 |
| chr6:17764967 | p.K1268K,KIF13A | 2 |
| chr6:17855836 | p.A254V,KIF13A | 2 |
| chr6:17849677 | p.G432E,KIF13A | 2 |
| chr6:17780964 | p.R207G,KIF13A | 2 |
| chr6:17804706 | p.G1550S,KIF13A | 2 |
| chr6:17850652 | p.K404N,KIF13A | 2 |
| chr6:17817384 | p.R957L,KIF13A | 1 |
| * Copy number data were extracted from TCGA using R package TCGA-Assembler. The URLs of all public data files on TCGA DCC data server were gathered on Jan-05-2015. Function ProcessCNAData in TCGA-Assembler package was used to obtain gene-level copy number value which is calculated as the average copy number of the genomic region of a gene. |
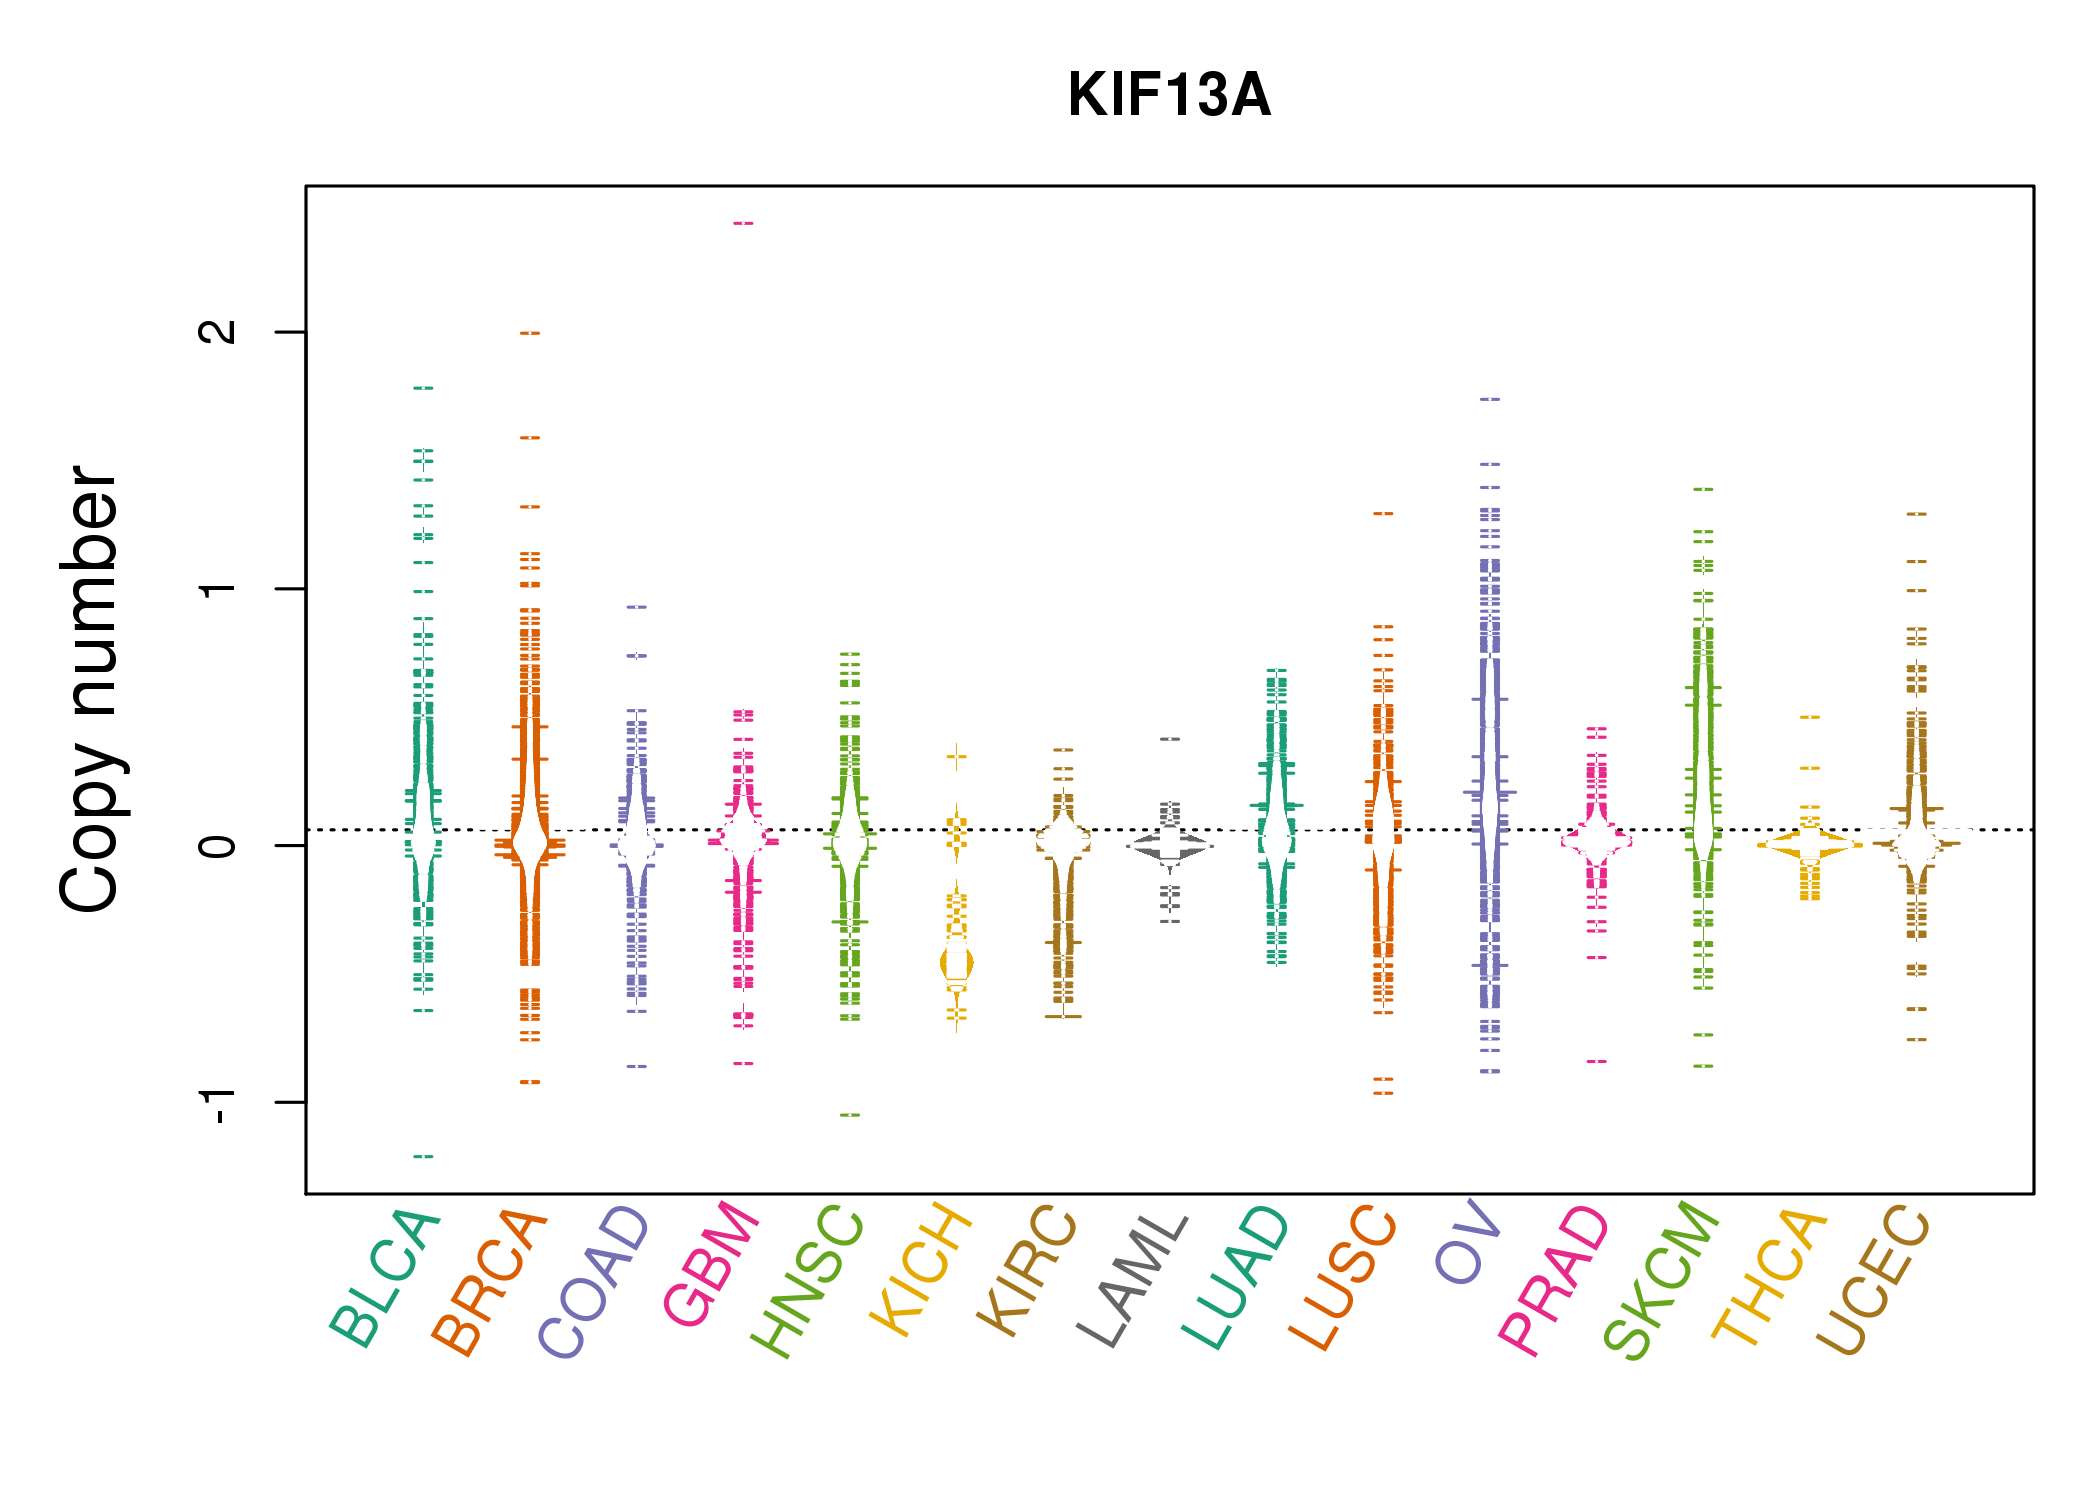 |
| cf) Tissue ID[Tissue type]: BLCA[Bladder Urothelial Carcinoma], BRCA[Breast invasive carcinoma], CESC[Cervical squamous cell carcinoma and endocervical adenocarcinoma], COAD[Colon adenocarcinoma], GBM[Glioblastoma multiforme], Glioma Low Grade, HNSC[Head and Neck squamous cell carcinoma], KICH[Kidney Chromophobe], KIRC[Kidney renal clear cell carcinoma], KIRP[Kidney renal papillary cell carcinoma], LAML[Acute Myeloid Leukemia], LUAD[Lung adenocarcinoma], LUSC[Lung squamous cell carcinoma], OV[Ovarian serous cystadenocarcinoma ], PAAD[Pancreatic adenocarcinoma], PRAD[Prostate adenocarcinoma], SKCM[Skin Cutaneous Melanoma], STAD[Stomach adenocarcinoma], THCA[Thyroid carcinoma], UCEC[Uterine Corpus Endometrial Carcinoma] |
| Top |
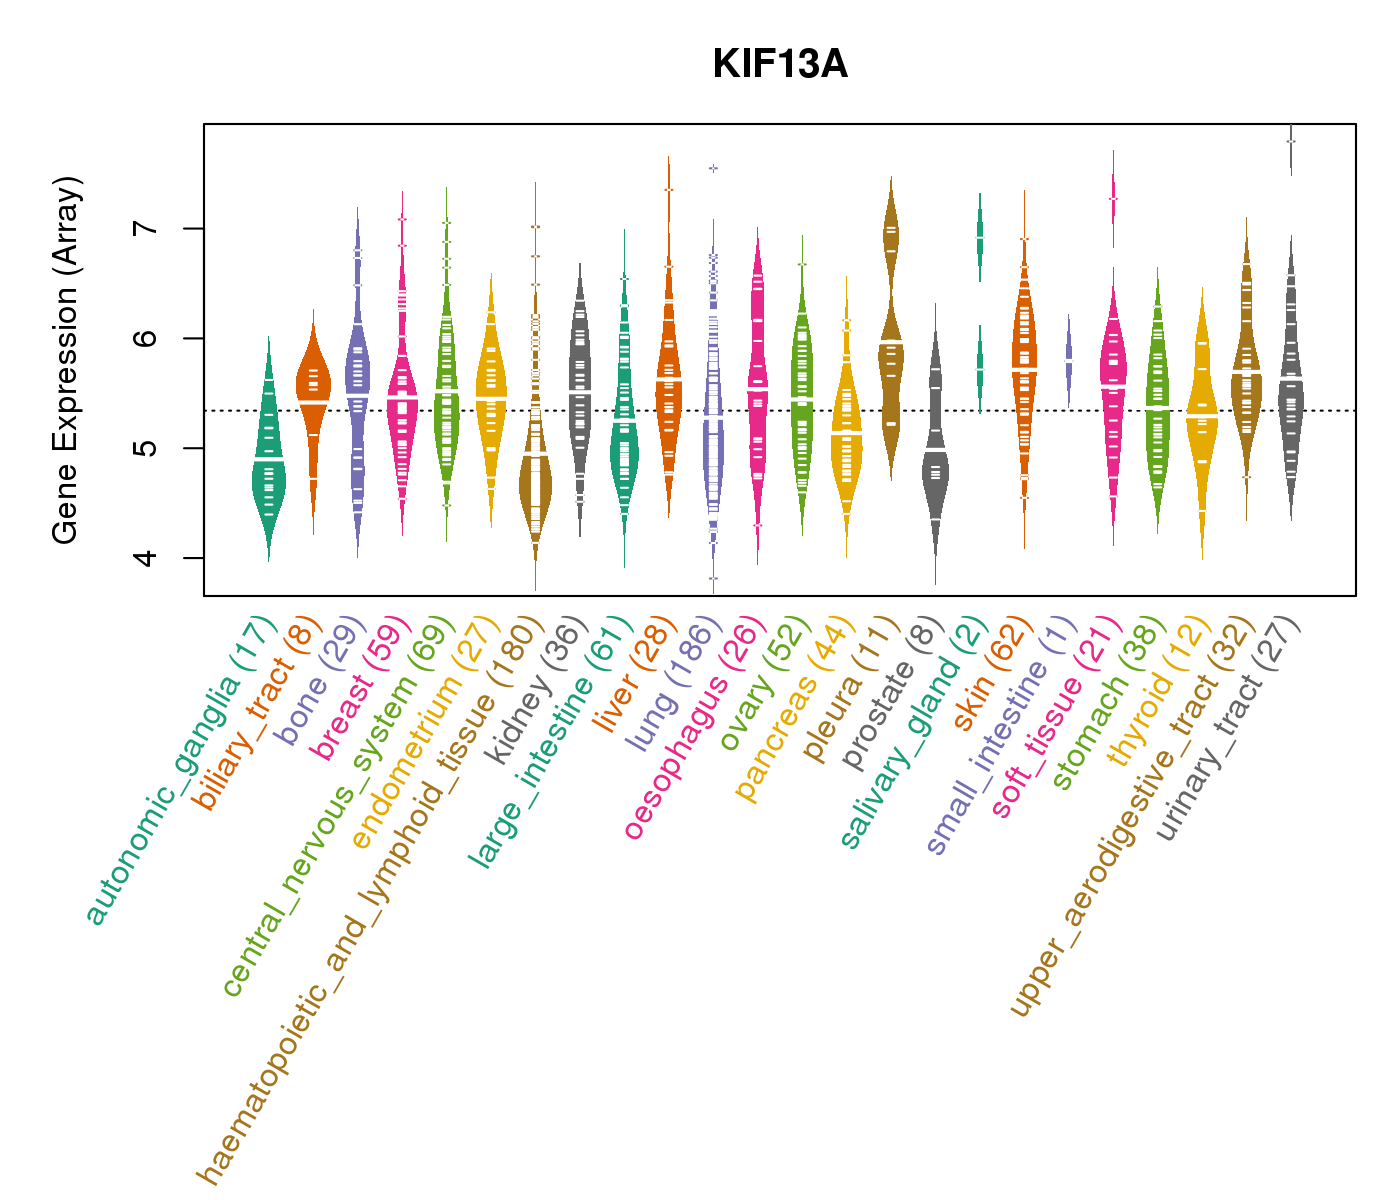
| Gene Expression for KIF13A |
| * CCLE gene expression data were extracted from CCLE_Expression_Entrez_2012-10-18.res: Gene-centric RMA-normalized mRNA expression data. |
 |
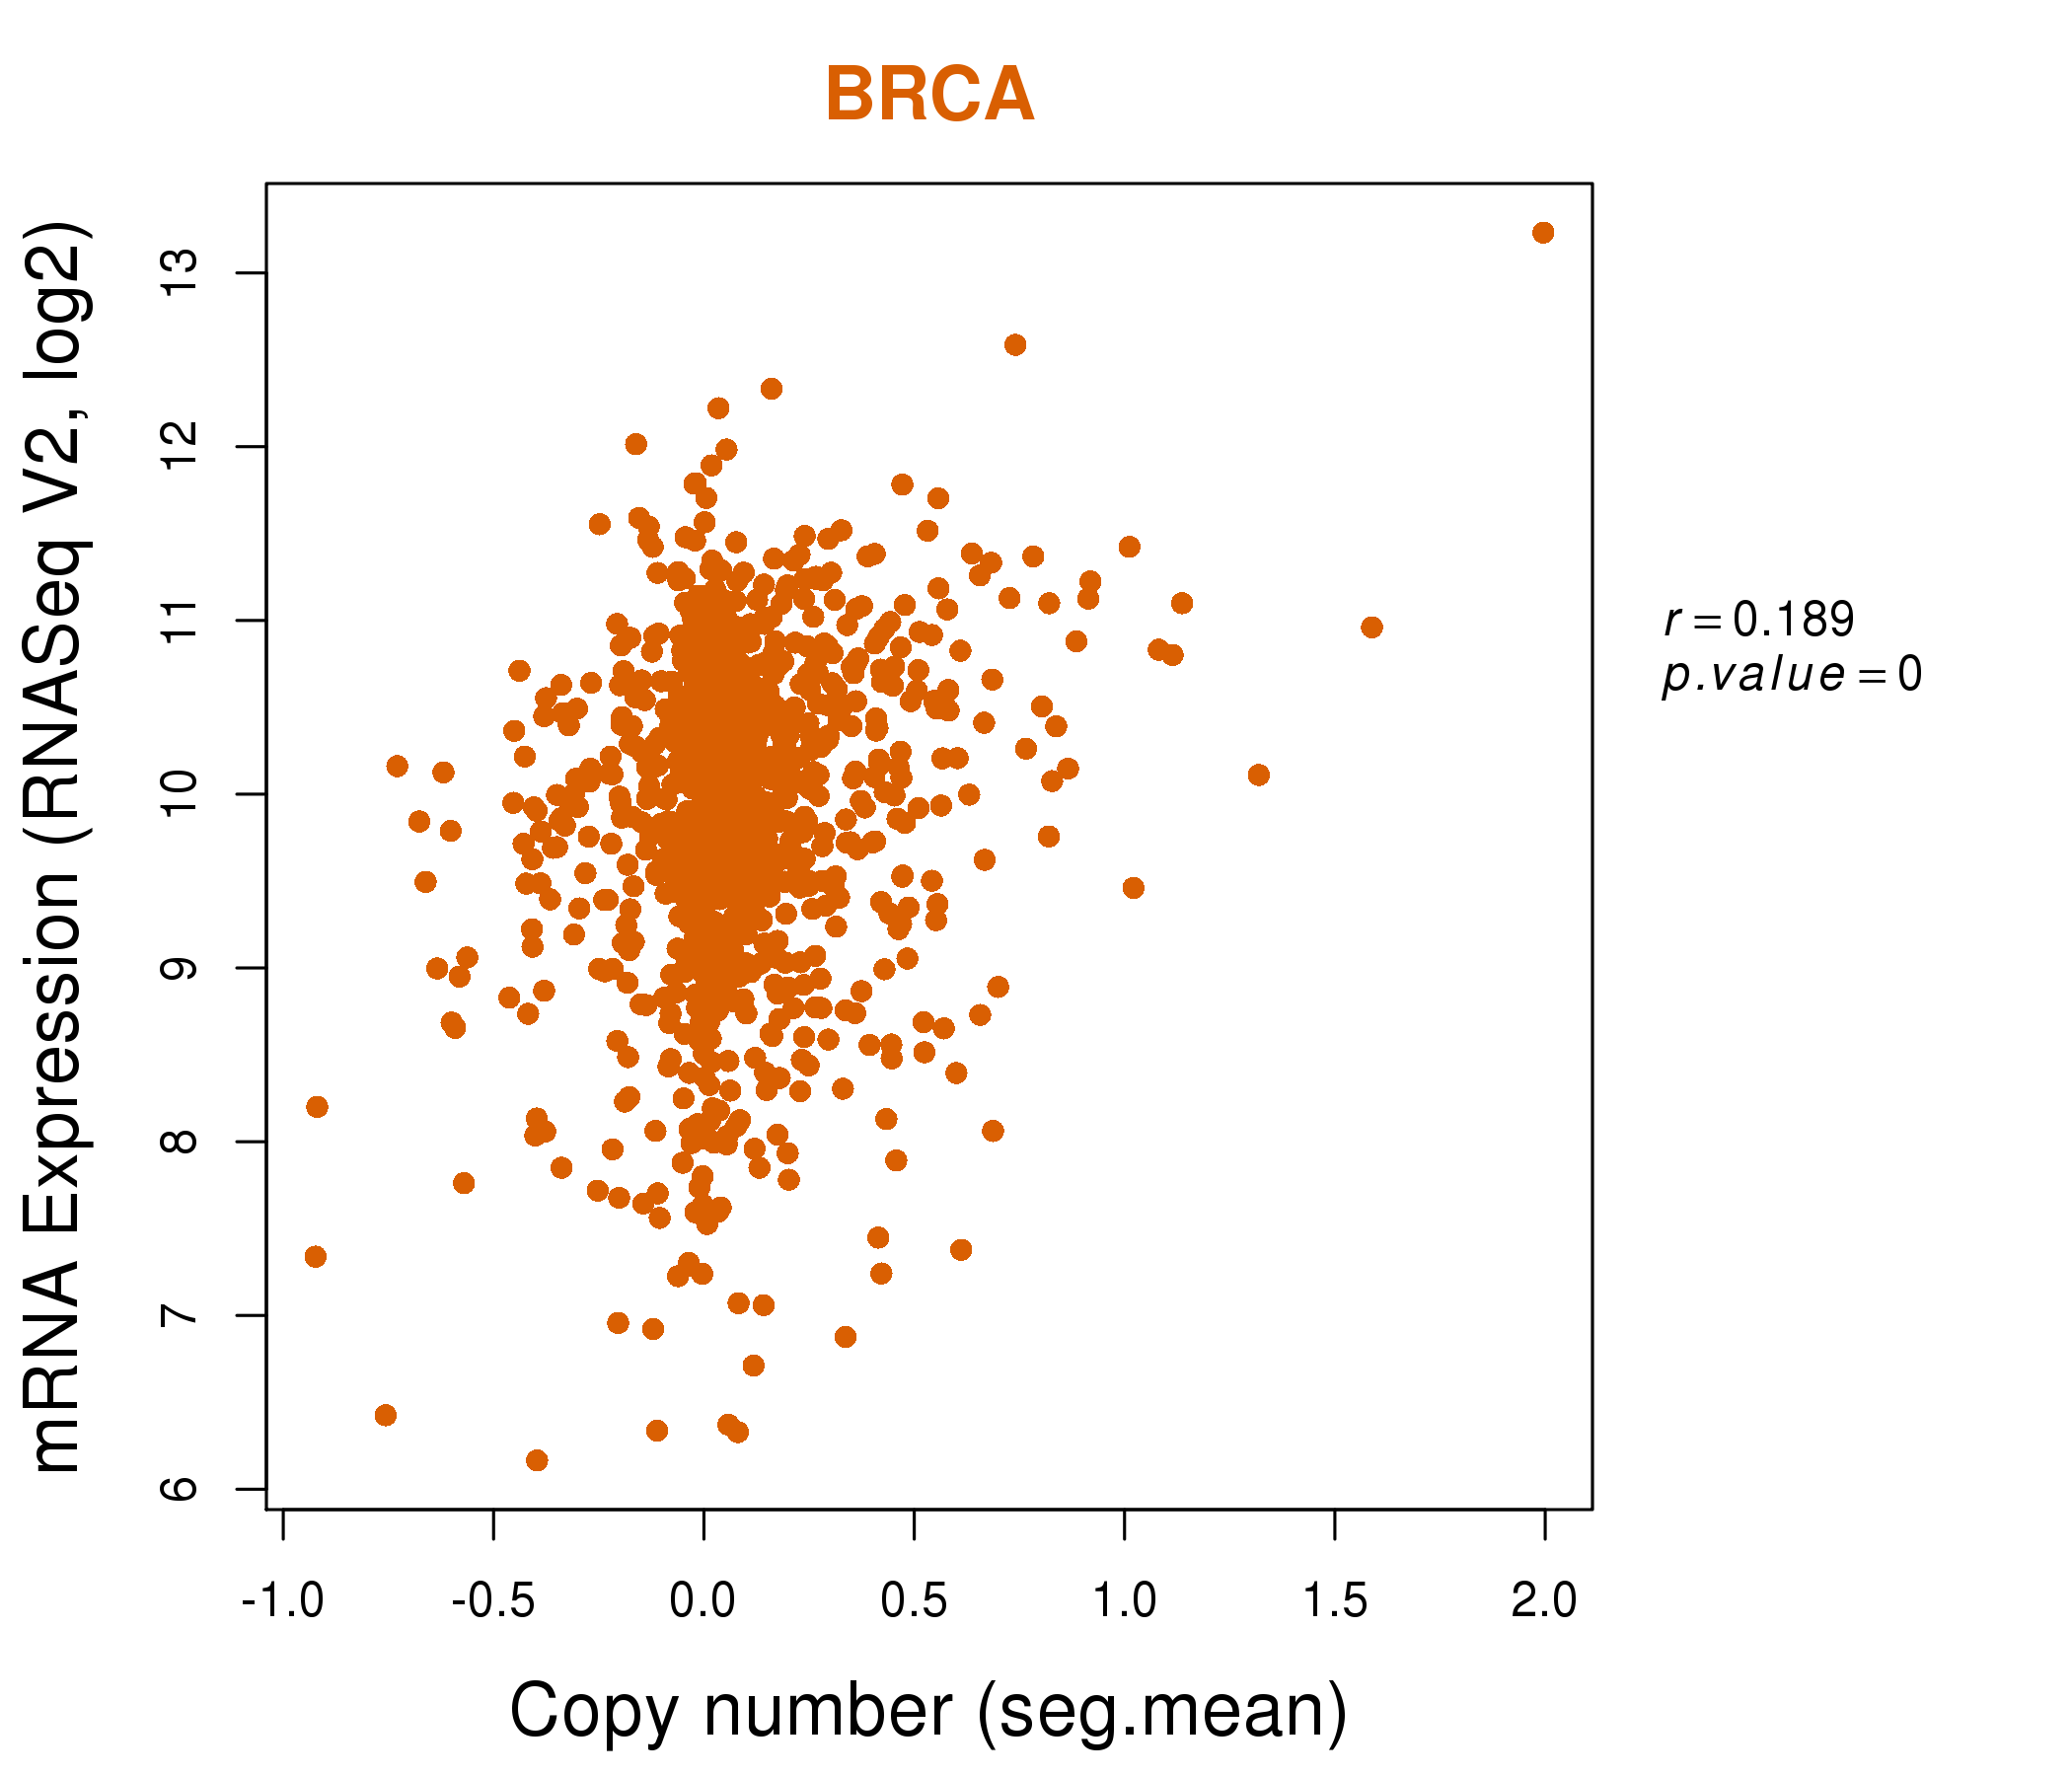
| * Normalized gene expression data of RNASeqV2 was extracted from TCGA using R package TCGA-Assembler. The URLs of all public data files on TCGA DCC data server were gathered at Jan-05-2015. Only eight cancer types have enough normal control samples for differential expression analysis. (t test, adjusted p<0.05 (using Benjamini-Hochberg FDR)) |
 |
| Top |
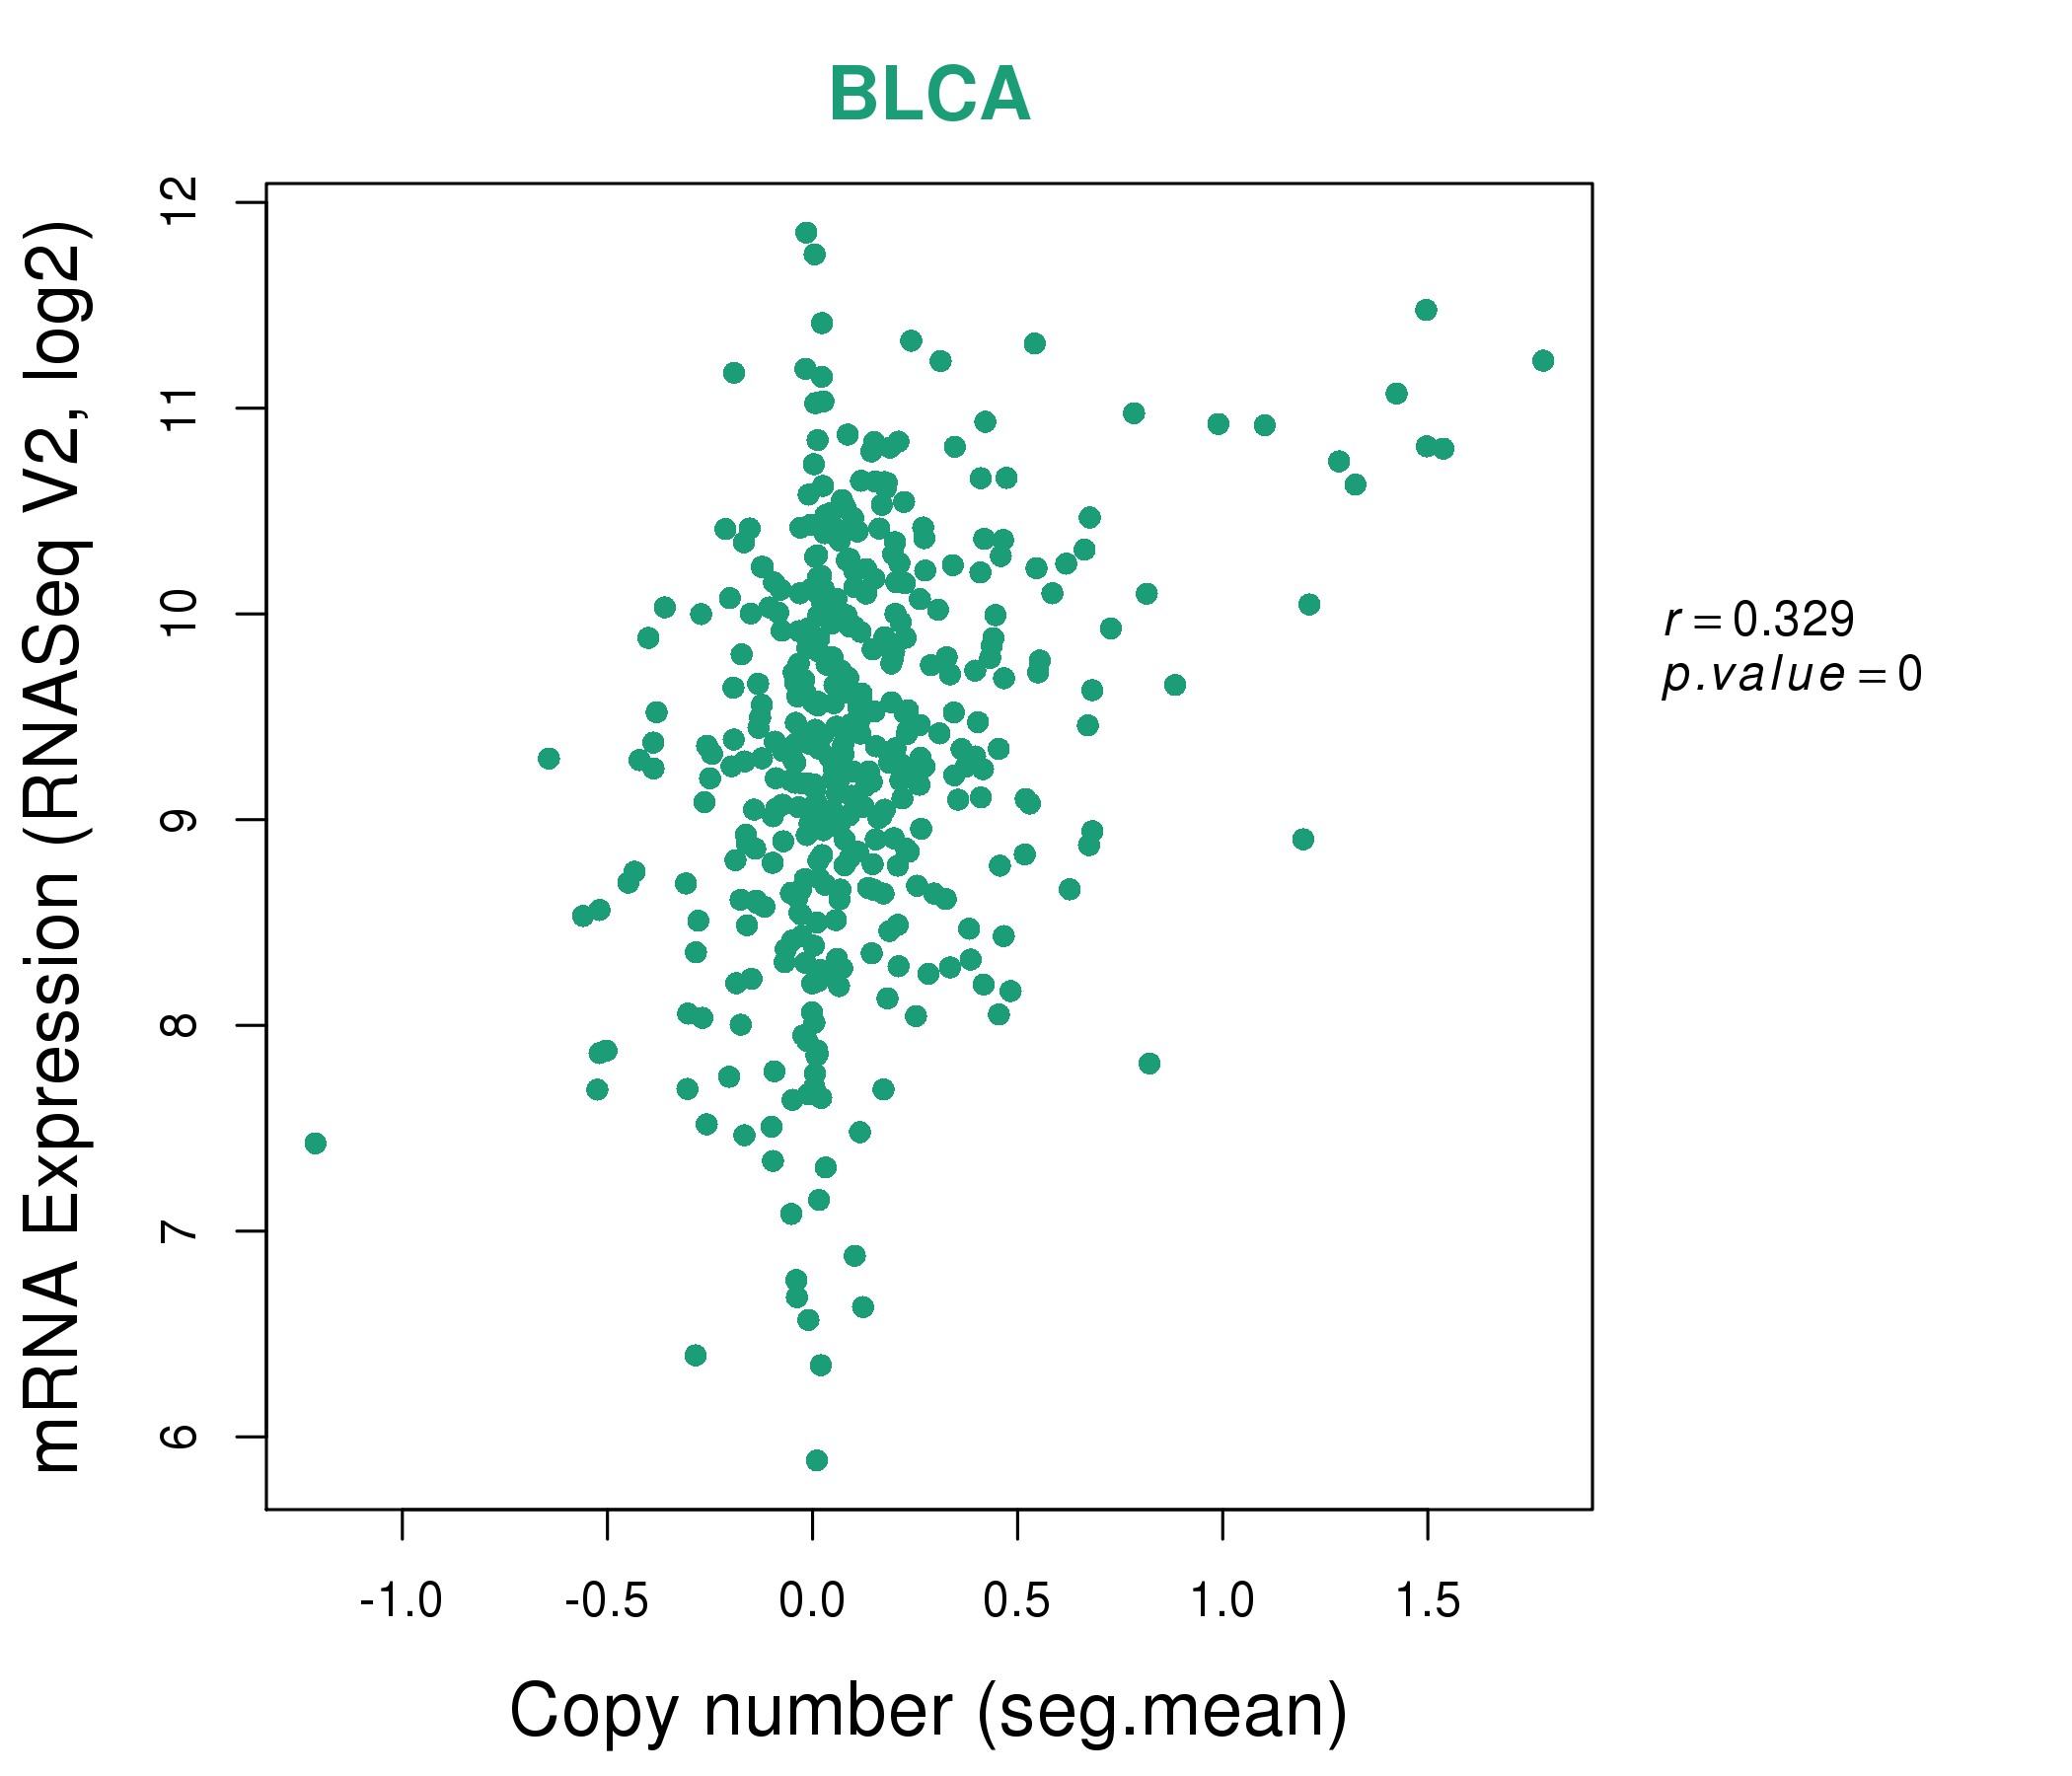
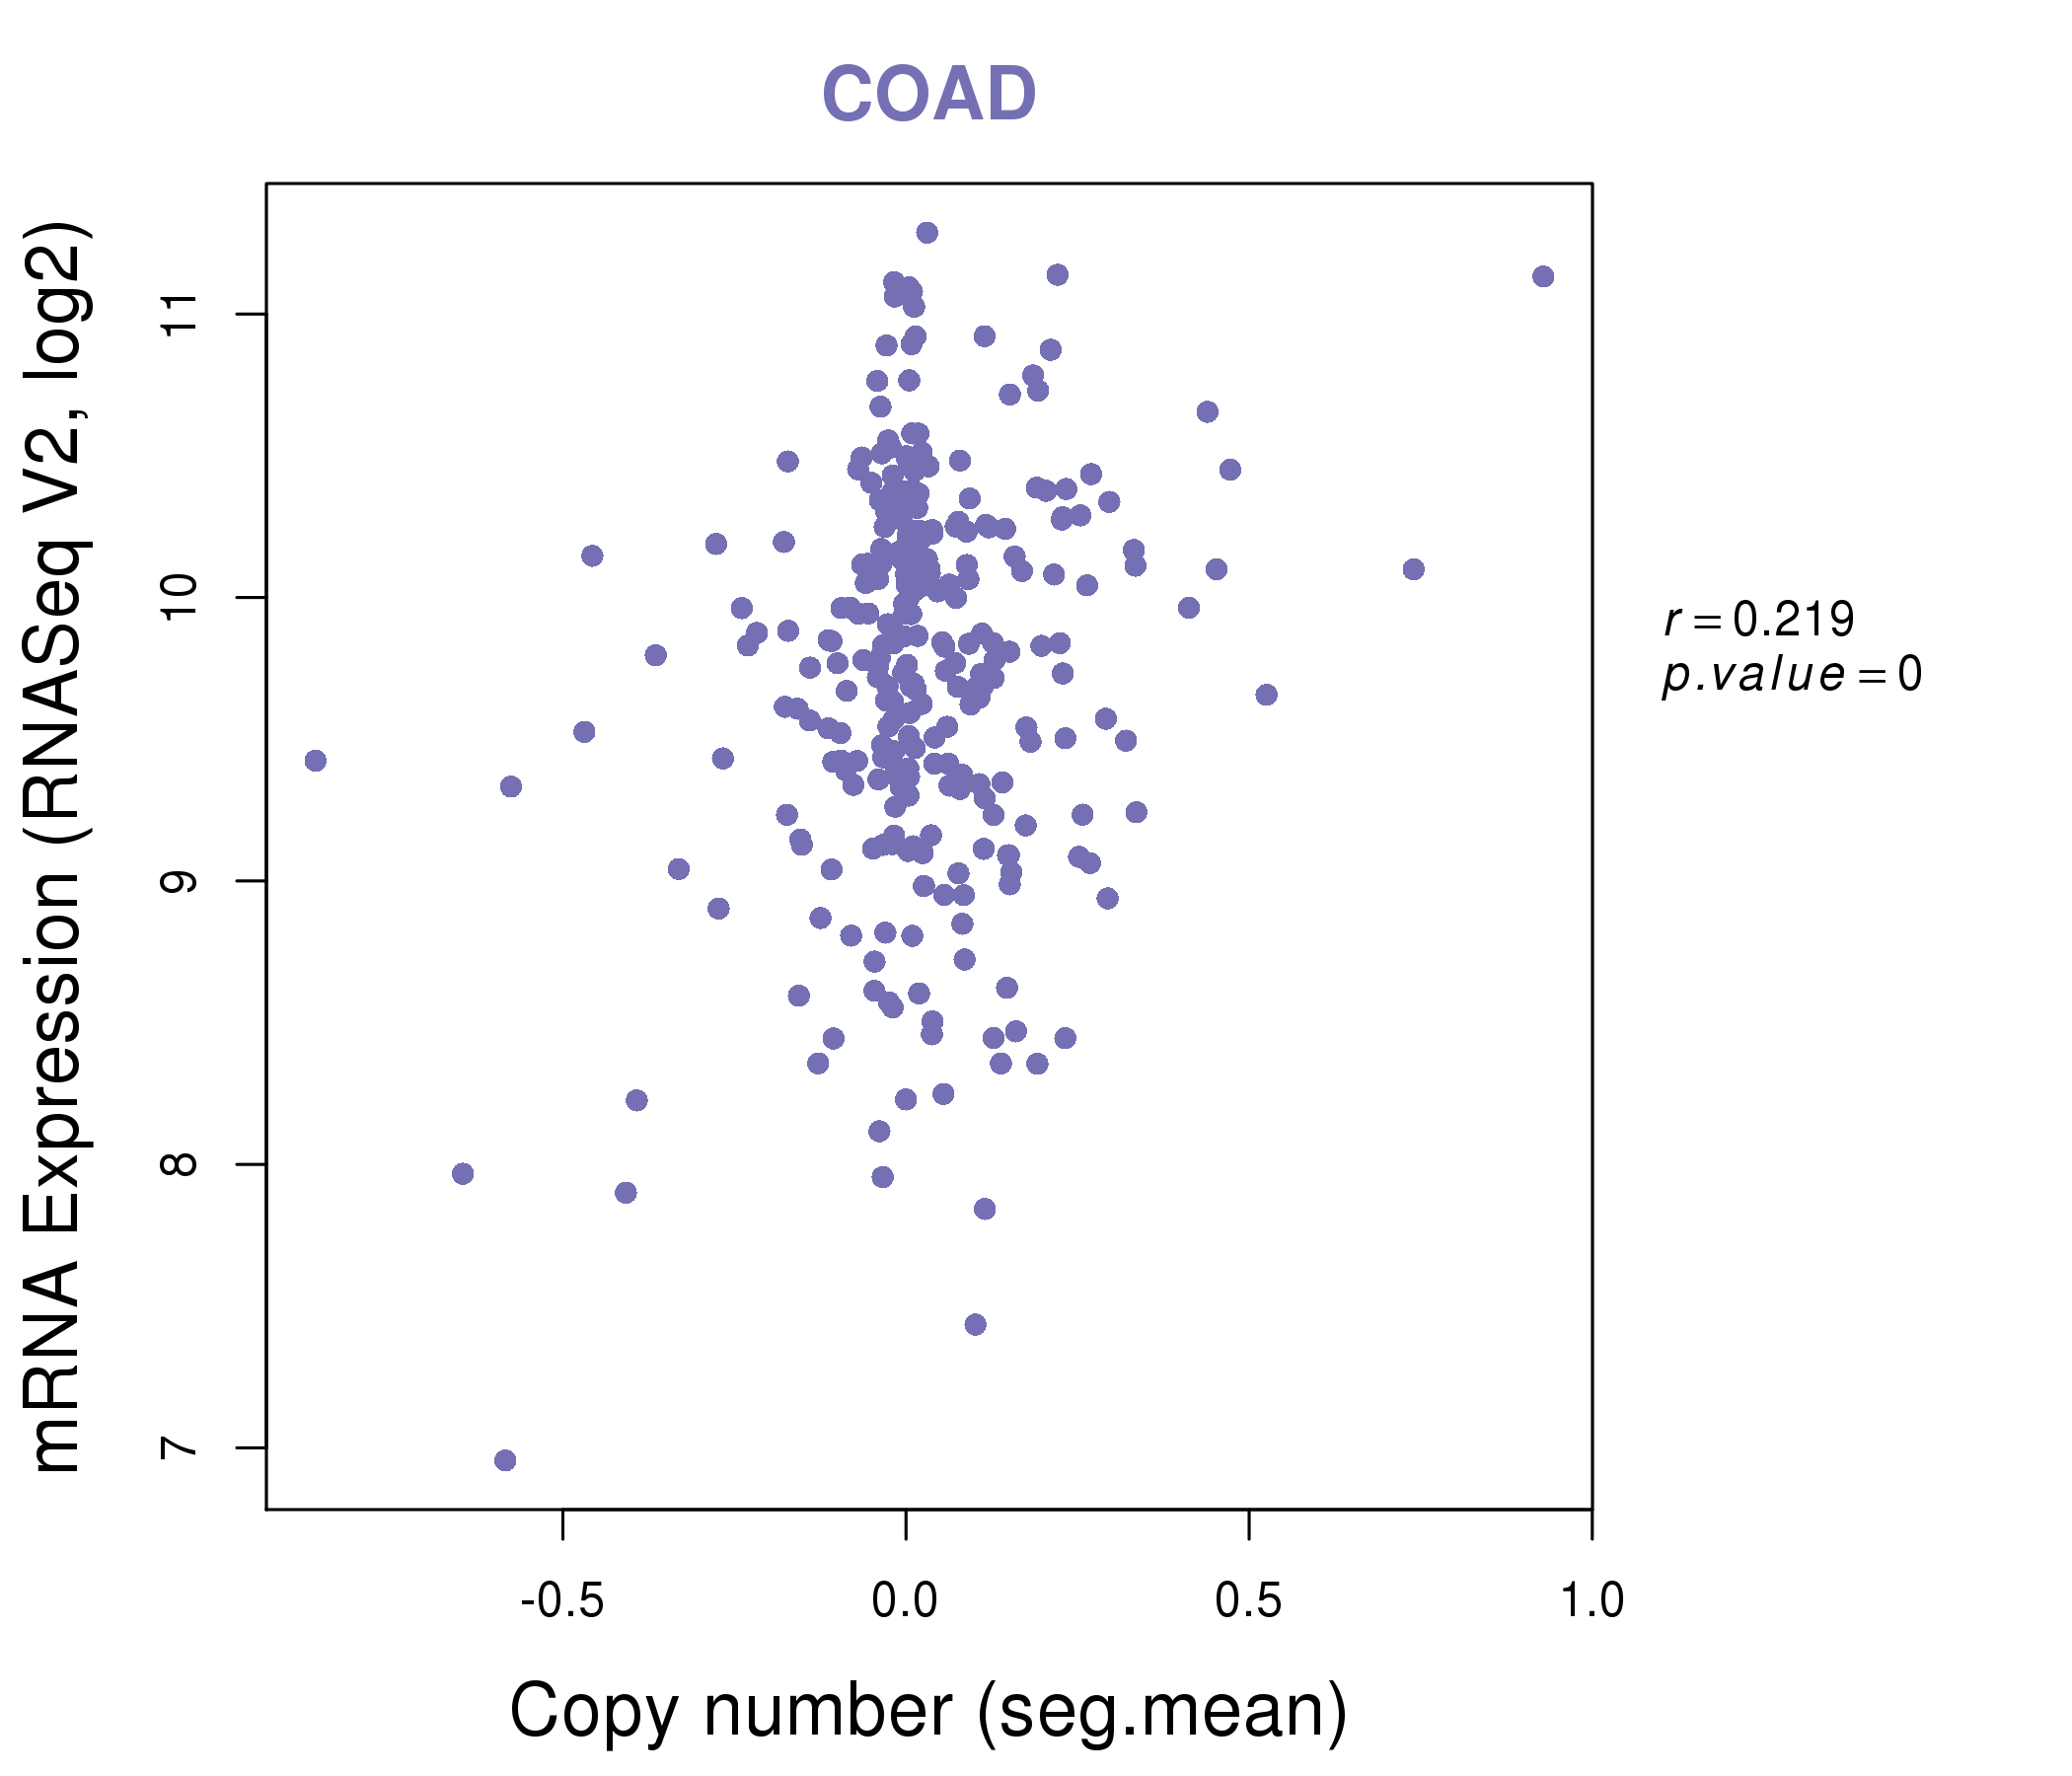
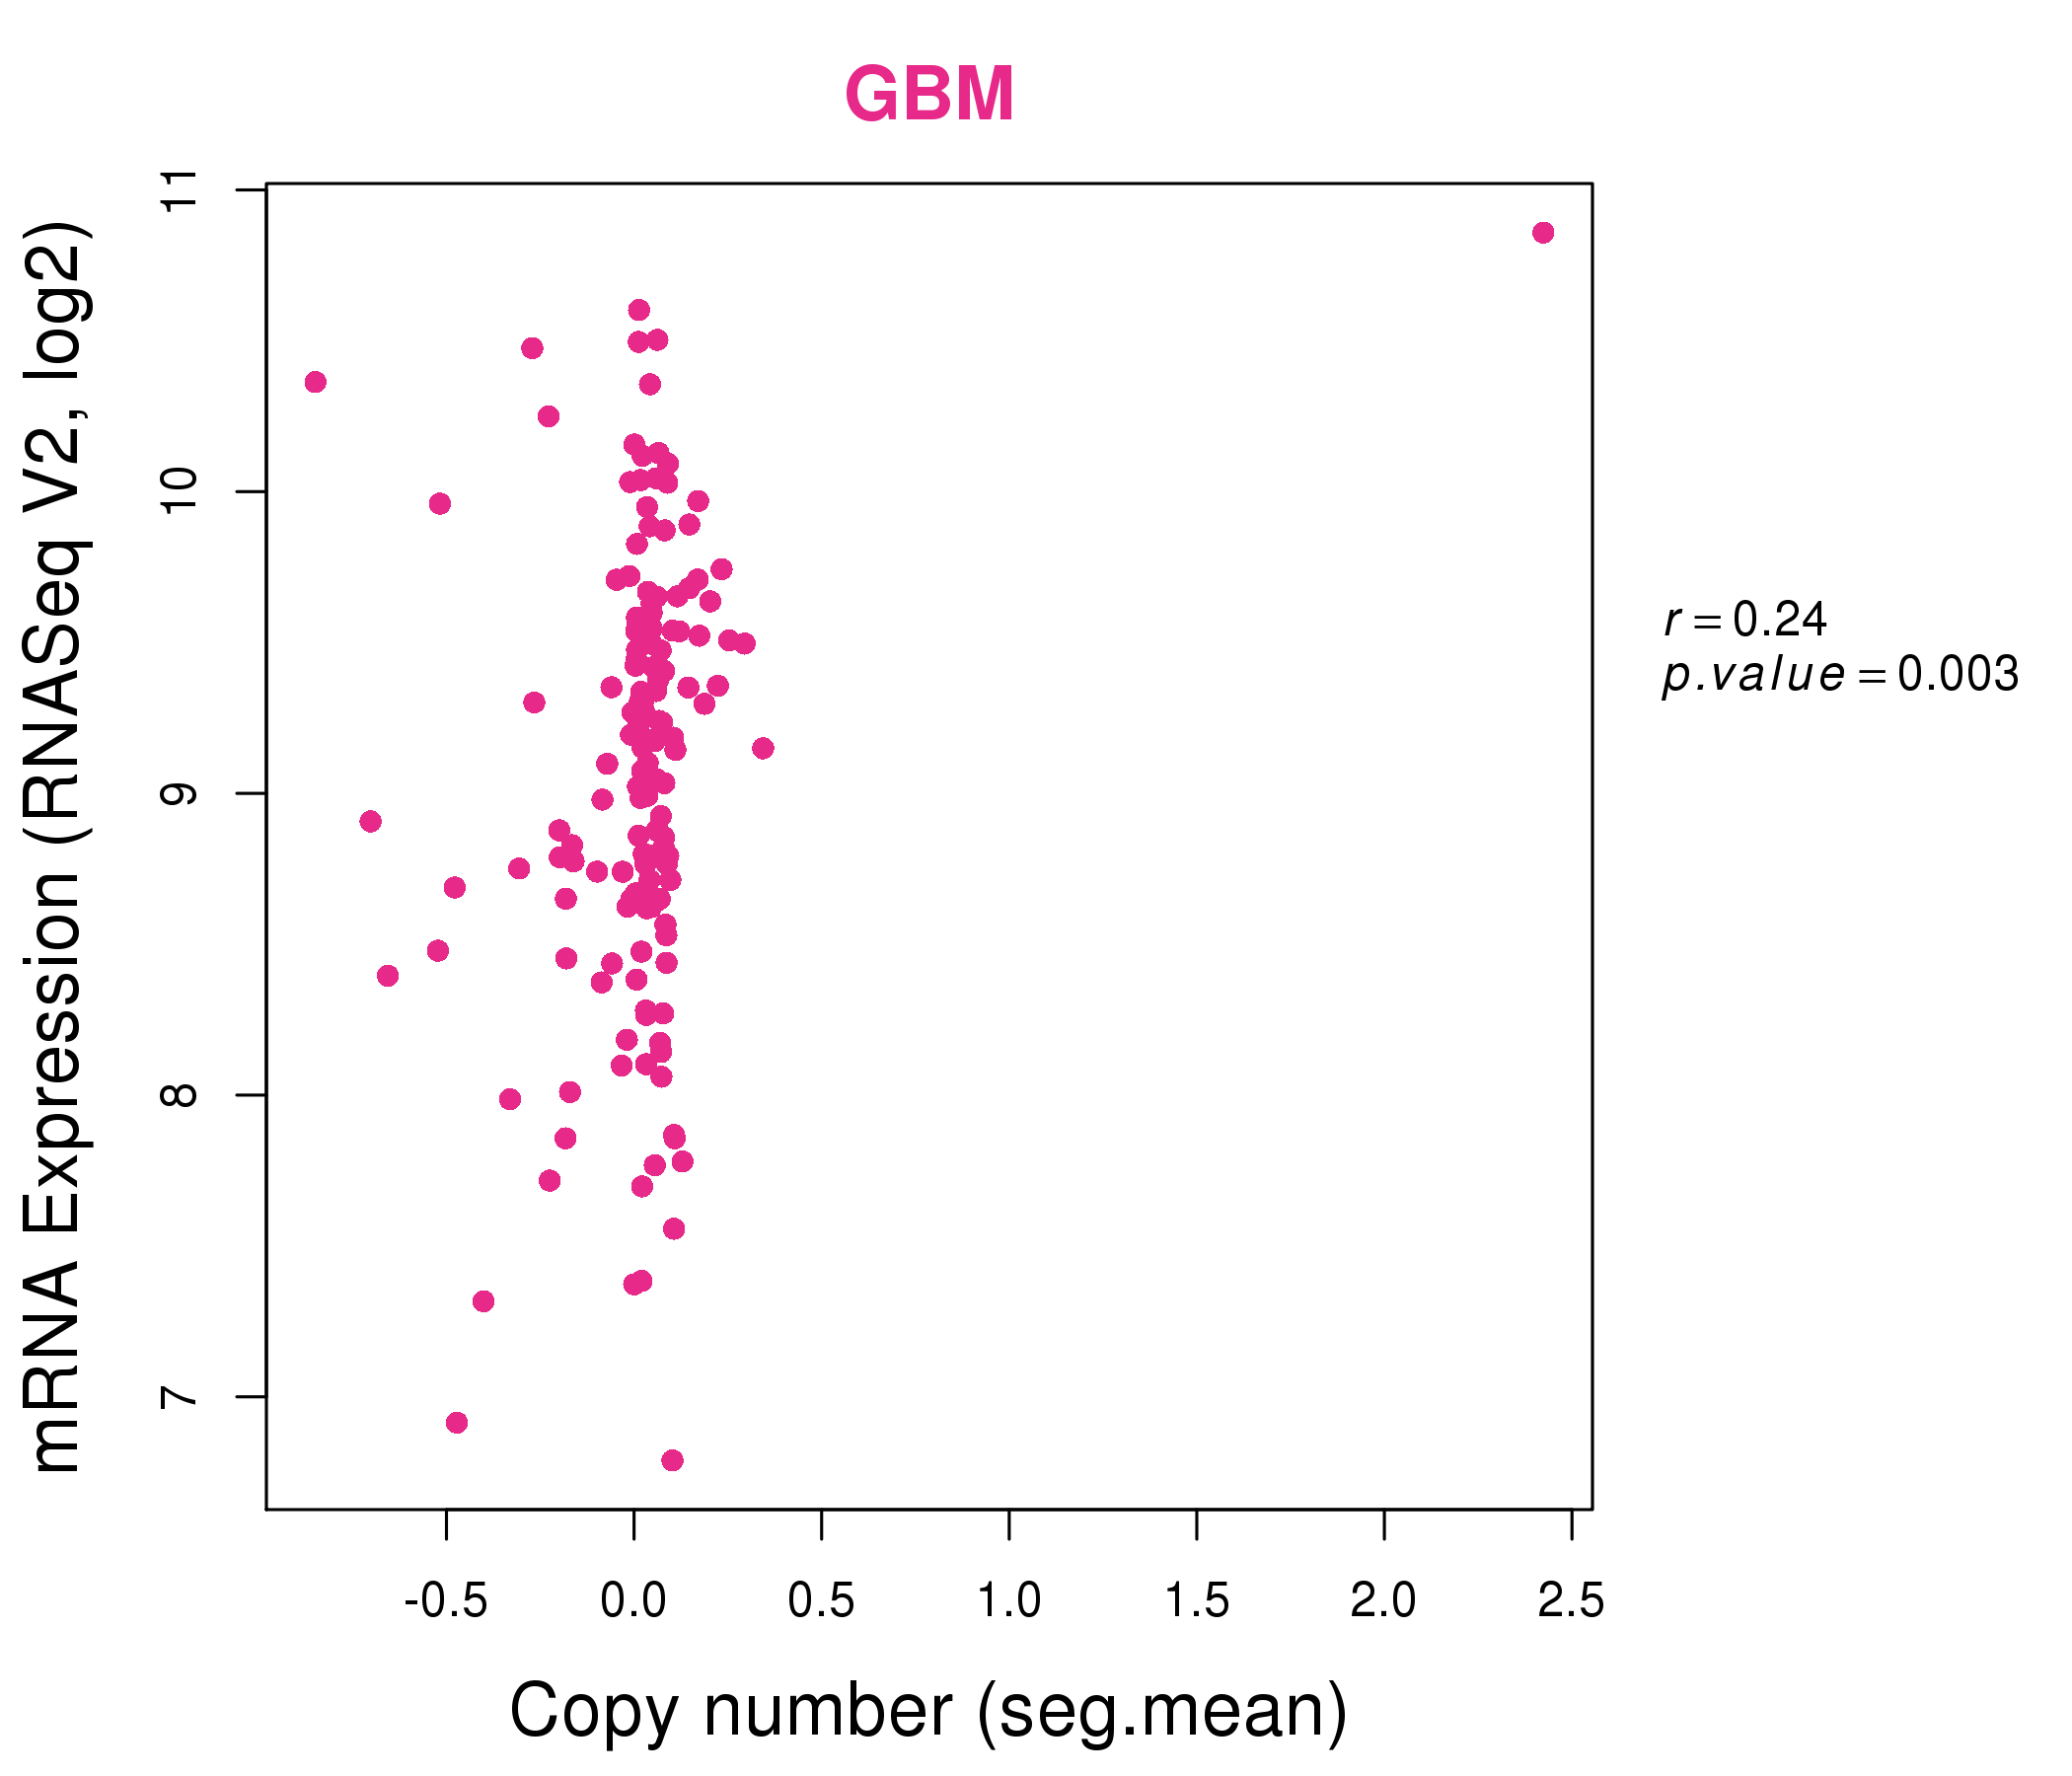
| * This plots show the correlation between CNV and gene expression. |
: Open all plots for all cancer types
 |
|
 |
|
| Top |
| Gene-Gene Network Information |
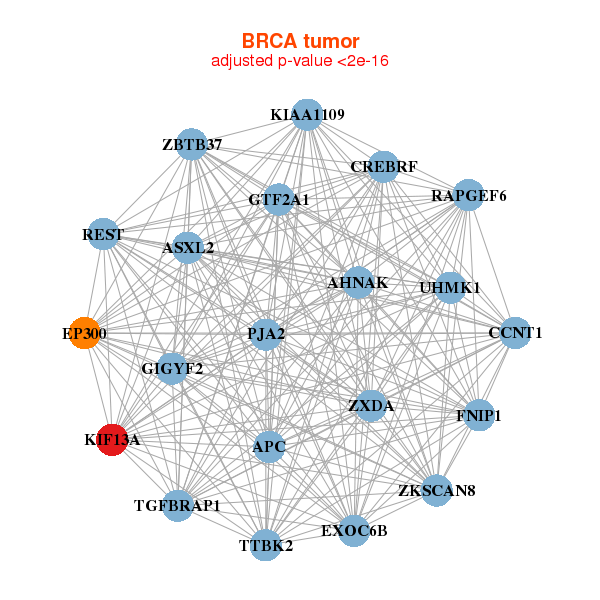
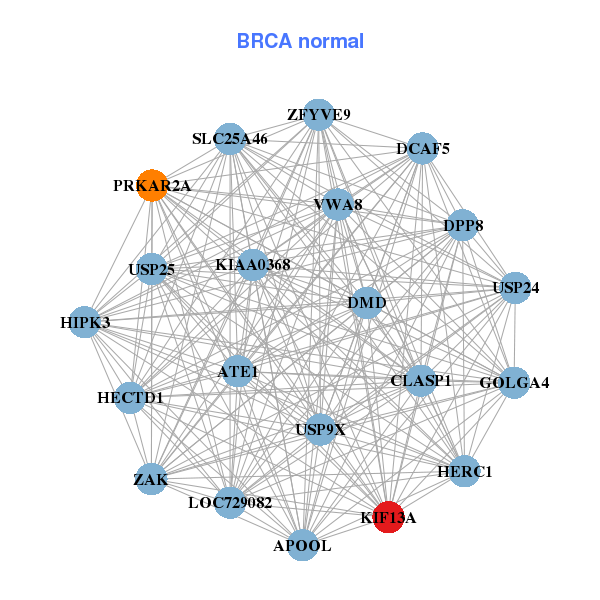
| * Co-Expression network figures were drawn using R package igraph. Only the top 20 genes with the highest correlations were shown. Red circle: input gene, orange circle: cell metabolism gene, sky circle: other gene |
: Open all plots for all cancer types
 |
|
| AHNAK,APC,ASXL2,CREBRF,CCNT1,EP300,EXOC6B, FNIP1,GIGYF2,GTF2A1,KIAA1109,KIF13A,PJA2,RAPGEF6, REST,TGFBRAP1,TTBK2,UHMK1,ZBTB37,ZKSCAN8,ZXDA | APOOL,ATE1,CLASP1,DCAF5,DMD,DPP8,GOLGA4, HECTD1,HERC1,HIPK3,KIAA0368,VWA8,KIF13A,LOC729082, PRKAR2A,SLC25A46,USP24,USP25,USP9X,ZAK,ZFYVE9 |
 |
|
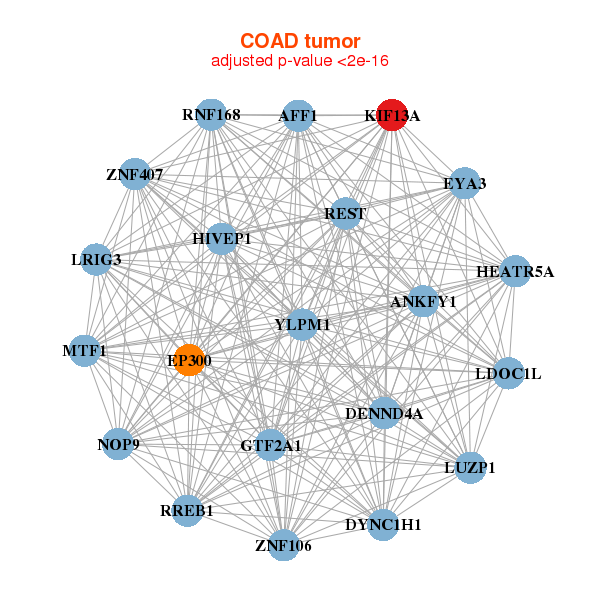
| AFF1,ANKFY1,NOP9,DENND4A,DYNC1H1,EP300,EYA3, GTF2A1,HEATR5A,HIVEP1,KIF13A,LDOC1L,LRIG3,LUZP1, MTF1,REST,RNF168,RREB1,YLPM1,ZNF106,ZNF407 | ARVCF,BCL9,SOGA1,CELSR2,CHD6,CLTCL1,CROCCP3, EPHA4,FAM63B,GPR161,HIP1,KIF13A,MTMR12,NFIX, PKD1,RAI1,REV3L,SCN9A,TBC1D24,TTBK2,USP13 |
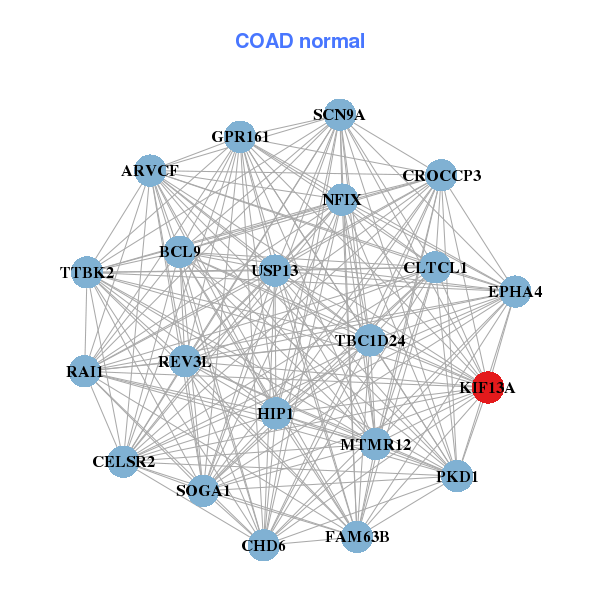
| * Co-Expression network figures were drawn using R package igraph. Only the top 20 genes with the highest correlations were shown. Red circle: input gene, orange circle: cell metabolism gene, sky circle: other gene |
: Open all plots for all cancer types
| Top |
: Open all interacting genes' information including KEGG pathway for all interacting genes from DAVID
| Top |
| Pharmacological Information for KIF13A |
| There's no related Drug. |
| Top |
| Cross referenced IDs for KIF13A |
| * We obtained these cross-references from Uniprot database. It covers 150 different DBs, 18 categories. http://www.uniprot.org/help/cross_references_section |
: Open all cross reference information
|
Copyright © 2016-Present - The Univsersity of Texas Health Science Center at Houston @ |