|
|||||||||||||||||||||||||||||||||||||||||||||||||||||||||||||||||||||||||||||||||||||||||||||||||||||||||||||||||||||||||||||||||||||||||||||||||||||||||||||||||||||||||||||||||||||||||||||||||||||||||||||||||||||||||||||||||||||||||||||||||||||||||||||||||||||||||||||||||||||||||||||||||||||||||||||||||||||||||||||||||||||||||||||||||||||||||||||||
| |
| Phenotypic Information (metabolism pathway, cancer, disease, phenome) |
| |
| |
| Gene-Gene Network Information: Co-Expression Network, Interacting Genes & KEGG |
| |
|


| Gene Summary for MCCC2 |
| Basic gene info. | Gene symbol | MCCC2 |
| Gene name | methylcrotonoyl-CoA carboxylase 2 (beta) | |
| Synonyms | MCCB | |
| Cytomap | UCSC genome browser: 5q12-q13 | |
| Genomic location | chr5 :70883114-70954530 | |
| Type of gene | protein-coding | |
| RefGenes | NM_022132.4, | |
| Ensembl id | ENSG00000262057 | |
| Description | 3-methylcrotonyl-CoA carboxylase 23-methylcrotonyl-CoA carboxylase non-biotin-containing subunit3-methylcrotonyl-CoA:carbon dioxide ligase subunit betaMCCase subunit betabiotin carboxylasemethylcrotonoyl-CoA carboxylase beta chain, mitochondrialmeth | |
| Modification date | 20141207 | |
| dbXrefs | MIM : 609014 | |
| HGNC : HGNC | ||
| Ensembl : ENSG00000131844 | ||
| HPRD : 01952 | ||
| Vega : OTTHUMG00000162505 | ||
| Protein | UniProt: go to UniProt's Cross Reference DB Table | |
| Expression | CleanEX: HS_MCCC2 | |
| BioGPS: 64087 | ||
| Gene Expression Atlas: ENSG00000262057 | ||
| The Human Protein Atlas: ENSG00000262057 | ||
| Pathway | NCI Pathway Interaction Database: MCCC2 | |
| KEGG: MCCC2 | ||
| REACTOME: MCCC2 | ||
| ConsensusPathDB | ||
| Pathway Commons: MCCC2 | ||
| Metabolism | MetaCyc: MCCC2 | |
| HUMANCyc: MCCC2 | ||
| Regulation | Ensembl's Regulation: ENSG00000262057 | |
| miRBase: chr5 :70,883,114-70,954,530 | ||
| TargetScan: NM_022132 | ||
| cisRED: ENSG00000262057 | ||
| Context | iHOP: MCCC2 | |
| cancer metabolism search in PubMed: MCCC2 | ||
| UCL Cancer Institute: MCCC2 | ||
| Assigned class in ccmGDB | C | |
| Top |
| Phenotypic Information for MCCC2(metabolism pathway, cancer, disease, phenome) |
| Cancer | CGAP: MCCC2 |
| Familial Cancer Database: MCCC2 | |
| * This gene is included in those cancer gene databases. |
|
|
|
|
|
|
| |||||||||||||||||||||||||||||||||||||||||||||||||||||||||||||||||||||||||||||||||||||||||||||||||||||||||||||||||||||||||||||||||||||||||||||||||||||||||||||||||||||||||||||||||||||||||||||||||||||||||||||||||||||||||||||||||||||||||||||||||||||||||||||||||||||||||||||||||||||||||||||||||||||||||||||||||||||||||||||||||||||||||||||||||||||||||
Oncogene 1 | Significant driver gene in | ||||||||||||||||||||||||||||||||||||||||||||||||||||||||||||||||||||||||||||||||||||||||||||||||||||||||||||||||||||||||||||||||||||||||||||||||||||||||||||||||||||||||||||||||||||||||||||||||||||||||||||||||||||||||||||||||||||||||||||||||||||||||||||||||||||||||||||||||||||||||||||||||||||||||||||||||||||||||||||||||||||||||||||||||||||||||||||||
| cf) number; DB name 1 Oncogene; http://nar.oxfordjournals.org/content/35/suppl_1/D721.long, 2 Tumor Suppressor gene; https://bioinfo.uth.edu/TSGene/, 3 Cancer Gene Census; http://www.nature.com/nrc/journal/v4/n3/abs/nrc1299.html, 4 CancerGenes; http://nar.oxfordjournals.org/content/35/suppl_1/D721.long, 5 Network of Cancer Gene; http://ncg.kcl.ac.uk/index.php, 1Therapeutic Vulnerabilities in Cancer; http://cbio.mskcc.org/cancergenomics/statius/ |
| REACTOME_METABOLISM_OF_AMINO_ACIDS_AND_DERIVATIVES | |
| OMIM | |
| Orphanet | |
| Disease | KEGG Disease: MCCC2 |
| MedGen: MCCC2 (Human Medical Genetics with Condition) | |
| ClinVar: MCCC2 | |
| Phenotype | MGI: MCCC2 (International Mouse Phenotyping Consortium) |
| PhenomicDB: MCCC2 | |
| Mutations for MCCC2 |
| * Under tables are showing count per each tissue to give us broad intuition about tissue specific mutation patterns.You can go to the detailed page for each mutation database's web site. |
| - Statistics for Tissue and Mutation type | Top |
 |
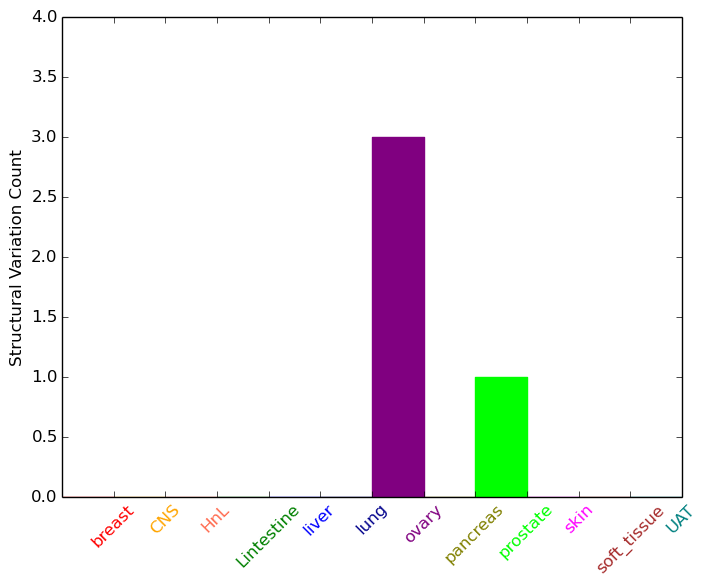
| - For Inter-chromosomal Variations |
| There's no inter-chromosomal structural variation. |
| - For Intra-chromosomal Variations |
| * Intra-chromosomal variantions includes 'intrachromosomal amplicon to amplicon', 'intrachromosomal amplicon to non-amplified dna', 'intrachromosomal deletion', 'intrachromosomal fold-back inversion', 'intrachromosomal inversion', 'intrachromosomal tandem duplication', 'Intrachromosomal unknown type', 'intrachromosomal with inverted orientation', 'intrachromosomal with non-inverted orientation'. |
 |
| Sample | Symbol_a | Chr_a | Start_a | End_a | Symbol_b | Chr_b | Start_b | End_b |
| ovary | MCCC2 | chr5 | 70890599 | 70890619 | chr5 | 71083065 | 71083085 | |
| ovary | MCCC2 | chr5 | 70908752 | 70908772 | ADAMTS6 | chr5 | 64580281 | 64580301 |
| ovary | MCCC2 | chr5 | 70936458 | 70936478 | chr5 | 58247756 | 58247776 | |
| prostate | MCCC2 | chr5 | 70941648 | 70941648 | chr5 | 74937572 | 74937572 |
| cf) Tissue number; Tissue name (1;Breast, 2;Central_nervous_system, 3;Haematopoietic_and_lymphoid_tissue, 4;Large_intestine, 5;Liver, 6;Lung, 7;Ovary, 8;Pancreas, 9;Prostate, 10;Skin, 11;Soft_tissue, 12;Upper_aerodigestive_tract) |
| * From mRNA Sanger sequences, Chitars2.0 arranged chimeric transcripts. This table shows MCCC2 related fusion information. |
| ID | Head Gene | Tail Gene | Accession | Gene_a | qStart_a | qEnd_a | Chromosome_a | tStart_a | tEnd_a | Gene_a | qStart_a | qEnd_a | Chromosome_a | tStart_a | tEnd_a |
| Top |
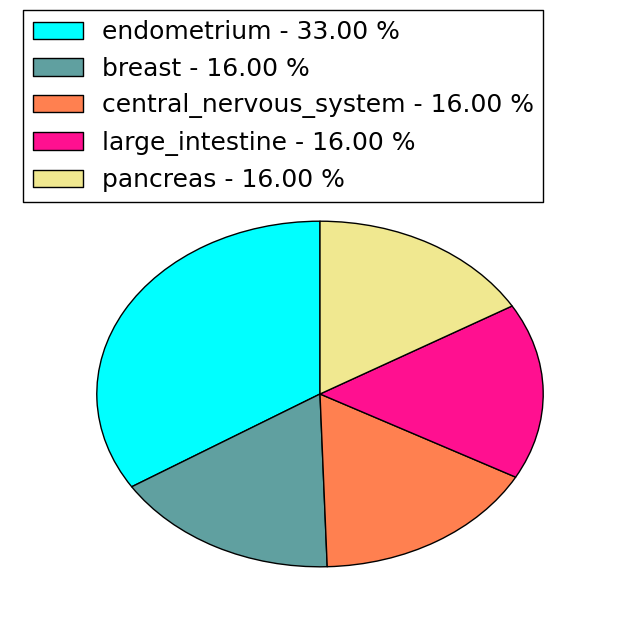
| Mutation type/ Tissue ID | brca | cns | cerv | endome | haematopo | kidn | Lintest | liver | lung | ns | ovary | pancre | prost | skin | stoma | thyro | urina | |||
| Total # sample | 1 | 1 | ||||||||||||||||||
| GAIN (# sample) | 1 | |||||||||||||||||||
| LOSS (# sample) | 1 |
| cf) Tissue ID; Tissue type (1; Breast, 2; Central_nervous_system, 3; Cervix, 4; Endometrium, 5; Haematopoietic_and_lymphoid_tissue, 6; Kidney, 7; Large_intestine, 8; Liver, 9; Lung, 10; NS, 11; Ovary, 12; Pancreas, 13; Prostate, 14; Skin, 15; Stomach, 16; Thyroid, 17; Urinary_tract) |
| Top |
|
 |
| Top |
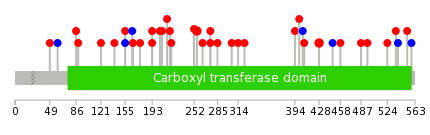
| Stat. for Non-Synonymous SNVs (# total SNVs=51) | (# total SNVs=6) |
 |  |
(# total SNVs=0) | (# total SNVs=1) |
 |
| Top |
| * When you move the cursor on each content, you can see more deailed mutation information on the Tooltip. Those are primary_site,primary_histology,mutation(aa),pubmedID. |
| GRCh37 position | Mutation(aa) | Unique sampleID count |
| chr5:70927955-70927955 | p.A249V | 11 |
| chr5:70939693-70939693 | p.G374R | 3 |
| chr5:70948577-70948577 | p.A524T | 2 |
| chr5:70944989-70944989 | p.A428T | 2 |
| chr5:70952669-70952669 | p.F558F | 2 |
| chr5:70900248-70900248 | p.R193S | 2 |
| chr5:70946013-70946013 | p.? | 2 |
| chr5:70898399-70898400 | p.Q153fs*20 | 1 |
| chr5:70944923-70944923 | p.? | 1 |
| chr5:70900297-70900297 | p.? | 1 |
| Top |
|
 |
| Point Mutation/ Tissue ID | 1 | 2 | 3 | 4 | 5 | 6 | 7 | 8 | 9 | 10 | 11 | 12 | 13 | 14 | 15 | 16 | 17 | 18 | 19 | 20 |
| # sample | 1 | 4 | 1 | 4 | 5 | 6 | 1 | 5 | 3 | 7 | ||||||||||
| # mutation | 1 | 5 | 1 | 4 | 5 | 6 | 1 | 5 | 3 | 8 | ||||||||||
| nonsynonymous SNV | 1 | 5 | 2 | 5 | 6 | 1 | 3 | 3 | 6 | |||||||||||
| synonymous SNV | 1 | 2 | 2 | 2 |
| cf) Tissue ID; Tissue type (1; BLCA[Bladder Urothelial Carcinoma], 2; BRCA[Breast invasive carcinoma], 3; CESC[Cervical squamous cell carcinoma and endocervical adenocarcinoma], 4; COAD[Colon adenocarcinoma], 5; GBM[Glioblastoma multiforme], 6; Glioma Low Grade, 7; HNSC[Head and Neck squamous cell carcinoma], 8; KICH[Kidney Chromophobe], 9; KIRC[Kidney renal clear cell carcinoma], 10; KIRP[Kidney renal papillary cell carcinoma], 11; LAML[Acute Myeloid Leukemia], 12; LUAD[Lung adenocarcinoma], 13; LUSC[Lung squamous cell carcinoma], 14; OV[Ovarian serous cystadenocarcinoma ], 15; PAAD[Pancreatic adenocarcinoma], 16; PRAD[Prostate adenocarcinoma], 17; SKCM[Skin Cutaneous Melanoma], 18:STAD[Stomach adenocarcinoma], 19:THCA[Thyroid carcinoma], 20:UCEC[Uterine Corpus Endometrial Carcinoma]) |
| Top |
| * We represented just top 10 SNVs. When you move the cursor on each content, you can see more deailed mutation information on the Tooltip. Those are primary_site, primary_histology, mutation(aa), pubmedID. |
| Genomic Position | Mutation(aa) | Unique sampleID count |
| chr5:70900248 | p.S256F | 2 |
| chr5:70927976 | p.R193S | 2 |
| chr5:70944989 | p.A428T | 2 |
| chr5:70900197 | p.A218T | 1 |
| chr5:70930791 | p.A447A | 1 |
| chr5:70888768 | p.M49V | 1 |
| chr5:70945080 | p.G220A | 1 |
| chr5:70930821 | p.S458N | 1 |
| chr5:70888803 | p.V60V | 1 |
| chr5:70945982 | p.G252W | 1 |
| * Copy number data were extracted from TCGA using R package TCGA-Assembler. The URLs of all public data files on TCGA DCC data server were gathered on Jan-05-2015. Function ProcessCNAData in TCGA-Assembler package was used to obtain gene-level copy number value which is calculated as the average copy number of the genomic region of a gene. |
 |
| cf) Tissue ID[Tissue type]: BLCA[Bladder Urothelial Carcinoma], BRCA[Breast invasive carcinoma], CESC[Cervical squamous cell carcinoma and endocervical adenocarcinoma], COAD[Colon adenocarcinoma], GBM[Glioblastoma multiforme], Glioma Low Grade, HNSC[Head and Neck squamous cell carcinoma], KICH[Kidney Chromophobe], KIRC[Kidney renal clear cell carcinoma], KIRP[Kidney renal papillary cell carcinoma], LAML[Acute Myeloid Leukemia], LUAD[Lung adenocarcinoma], LUSC[Lung squamous cell carcinoma], OV[Ovarian serous cystadenocarcinoma ], PAAD[Pancreatic adenocarcinoma], PRAD[Prostate adenocarcinoma], SKCM[Skin Cutaneous Melanoma], STAD[Stomach adenocarcinoma], THCA[Thyroid carcinoma], UCEC[Uterine Corpus Endometrial Carcinoma] |
| Top |
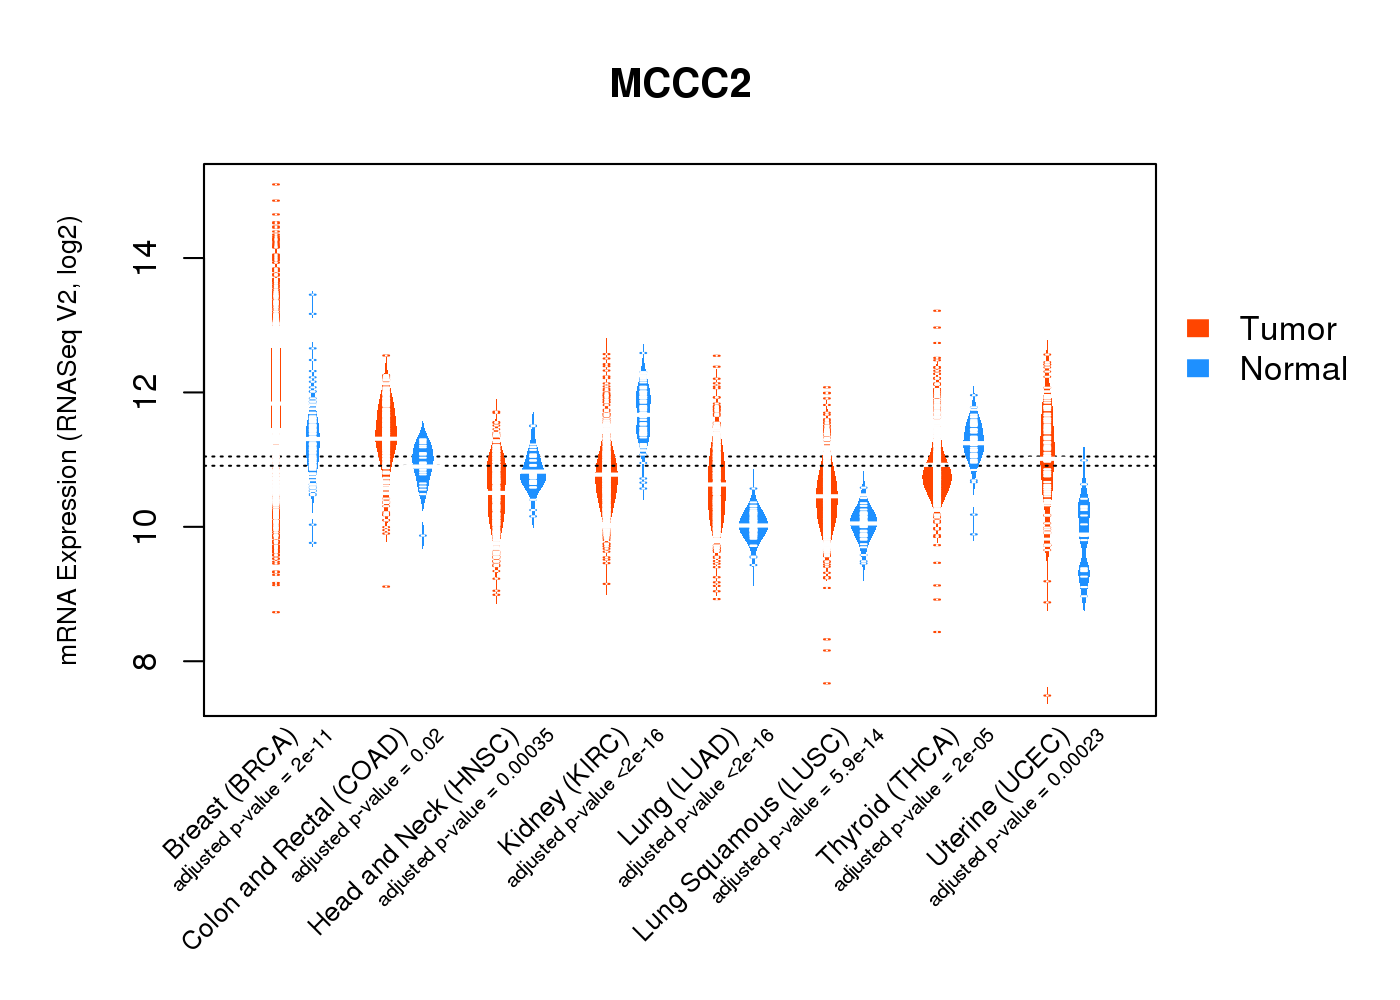
| Gene Expression for MCCC2 |
| * CCLE gene expression data were extracted from CCLE_Expression_Entrez_2012-10-18.res: Gene-centric RMA-normalized mRNA expression data. |
 |
| * Normalized gene expression data of RNASeqV2 was extracted from TCGA using R package TCGA-Assembler. The URLs of all public data files on TCGA DCC data server were gathered at Jan-05-2015. Only eight cancer types have enough normal control samples for differential expression analysis. (t test, adjusted p<0.05 (using Benjamini-Hochberg FDR)) |
 |
| Top |
| * This plots show the correlation between CNV and gene expression. |
: Open all plots for all cancer types
 |
|
 |
|


| Top |
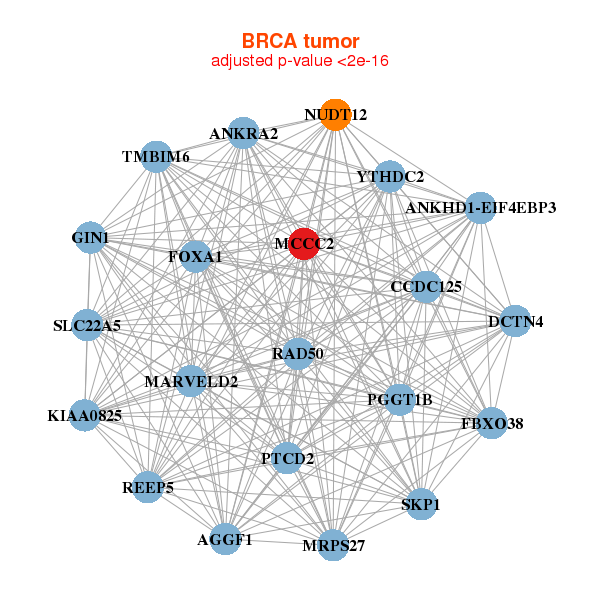
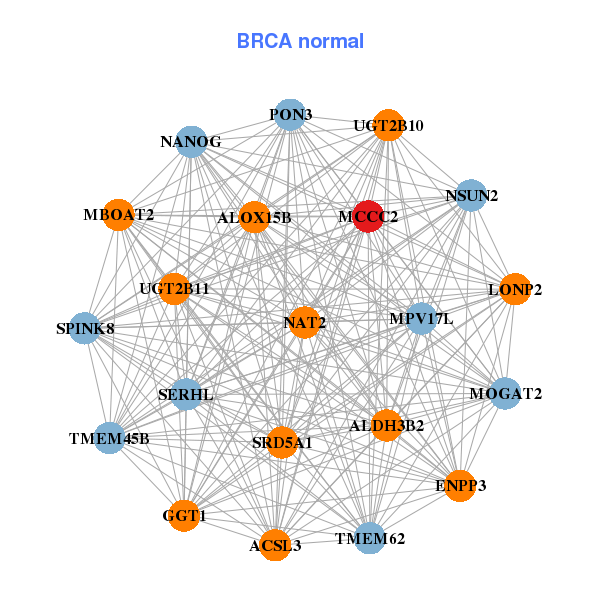
| Gene-Gene Network Information |
| * Co-Expression network figures were drawn using R package igraph. Only the top 20 genes with the highest correlations were shown. Red circle: input gene, orange circle: cell metabolism gene, sky circle: other gene |
: Open all plots for all cancer types
 |
| ||||
| AGGF1,ANKHD1-EIF4EBP3,ANKRA2,KIAA0825,CCDC125,DCTN4,FBXO38, FOXA1,GIN1,MARVELD2,MCCC2,MRPS27,NUDT12,PGGT1B, PTCD2,RAD50,REEP5,SKP1,SLC22A5,TMBIM6,YTHDC2 | ACSL3,ALDH3B2,ALOX15B,ENPP3,GGT1,LONP2,MBOAT2, MCCC2,MOGAT2,MPV17L,NANOG,NAT2,NSUN2,PON3, SERHL,SPINK8,SRD5A1,TMEM45B,TMEM62,UGT2B10,UGT2B11 | ||||
 |
| ||||
| ACADSB,ALDH7A1,AP3B1,SMIM15,COX7C,CS,DLD, GOT2,HNRNPAB,HSD17B4,HSPA9,LARS2,LARS,MARS2, MCCC2,MRPS27,MRPS36,NLN,TAF9,TMEM161B,UTP15 | ANKEF1,DARS2,DCAF12,FAM120A,FAM81A,HSPA9,IARS2, LRPPRC,MCCC2,MECOM,MIPEP,MLEC,MTIF2,PDHA1, PKP2,PPIP5K2,PROM2,RPIA,SRPK1,STARD7,UGT8 |

| * Co-Expression network figures were drawn using R package igraph. Only the top 20 genes with the highest correlations were shown. Red circle: input gene, orange circle: cell metabolism gene, sky circle: other gene |
: Open all plots for all cancer types
| Top |
: Open all interacting genes' information including KEGG pathway for all interacting genes from DAVID
| Top |
| Pharmacological Information for MCCC2 |
| DB Category | DB Name | DB's ID and Url link |
| * Gene Centered Interaction Network. |
 |
| * Drug Centered Interaction Network. |
| DrugBank ID | Target Name | Drug Groups | Generic Name | Drug Centered Network | Drug Structure |
| DB00121 | methylcrotonoyl-CoA carboxylase 2 (beta) | approved; nutraceutical | Biotin | 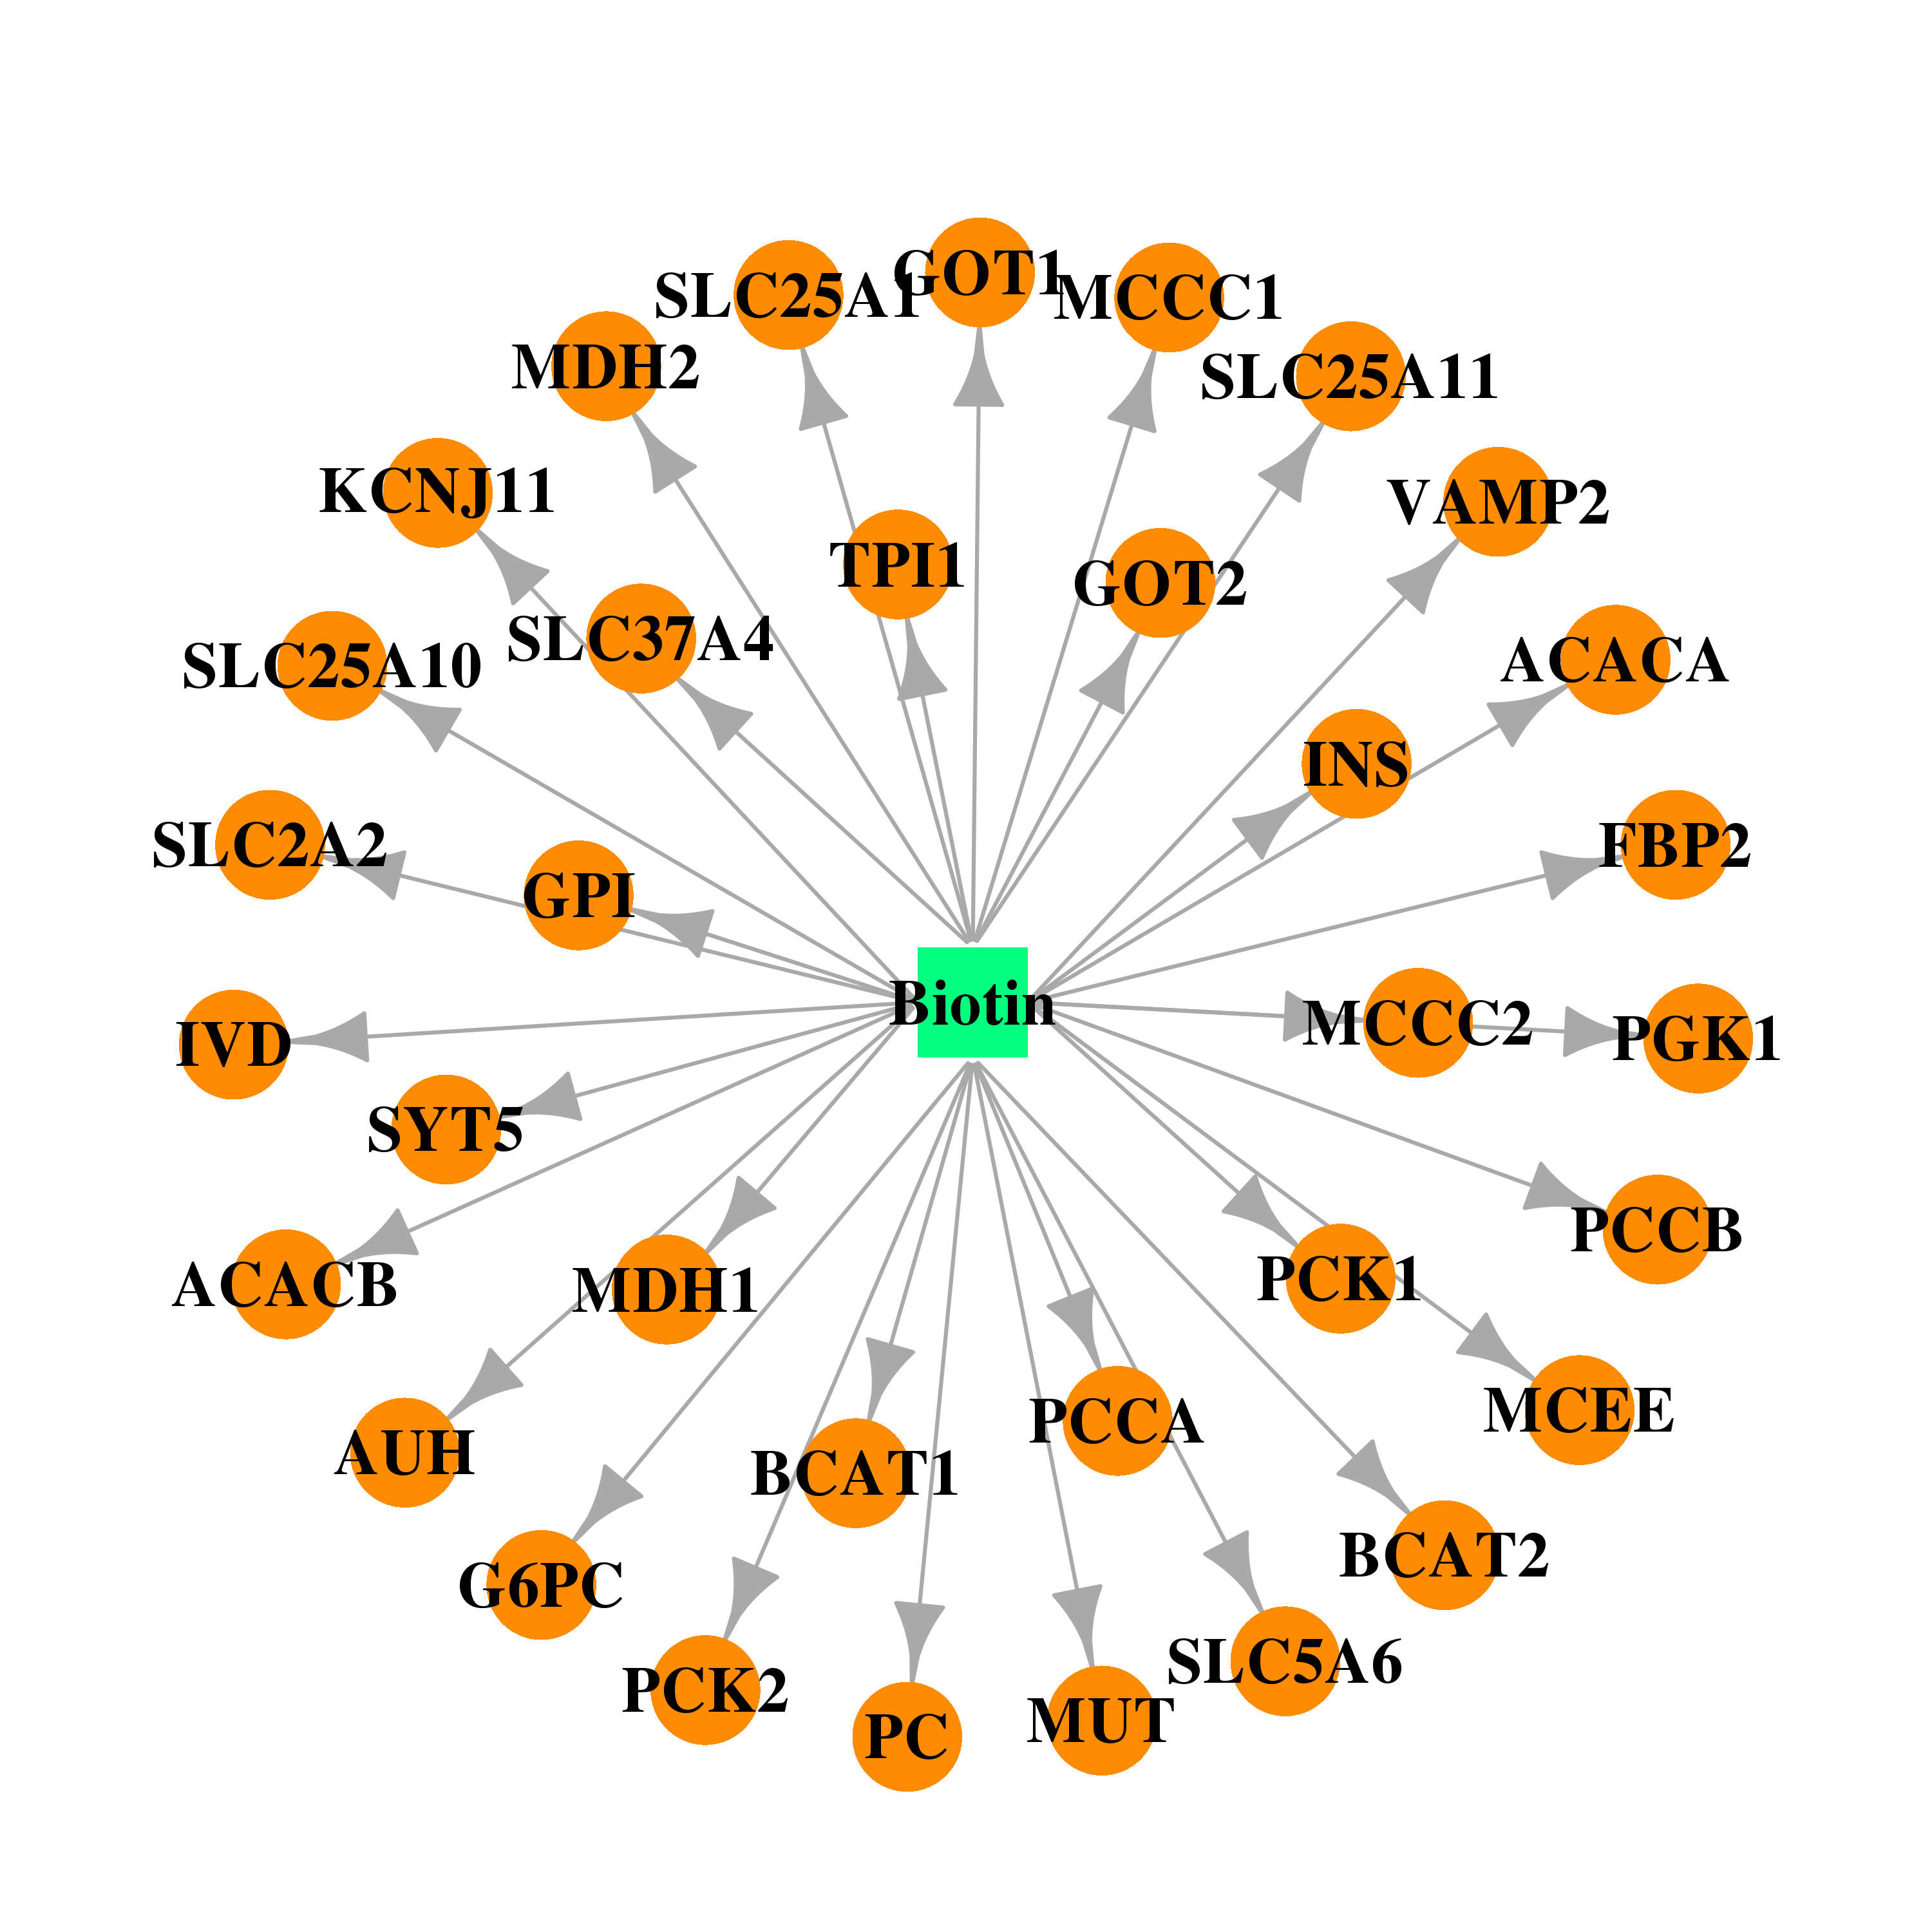 | 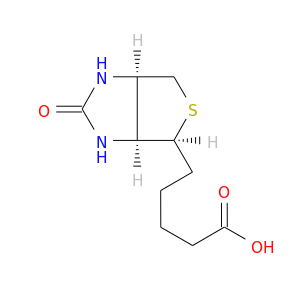 |
| DB00149 | methylcrotonoyl-CoA carboxylase 2 (beta) | approved; nutraceutical | L-Leucine | 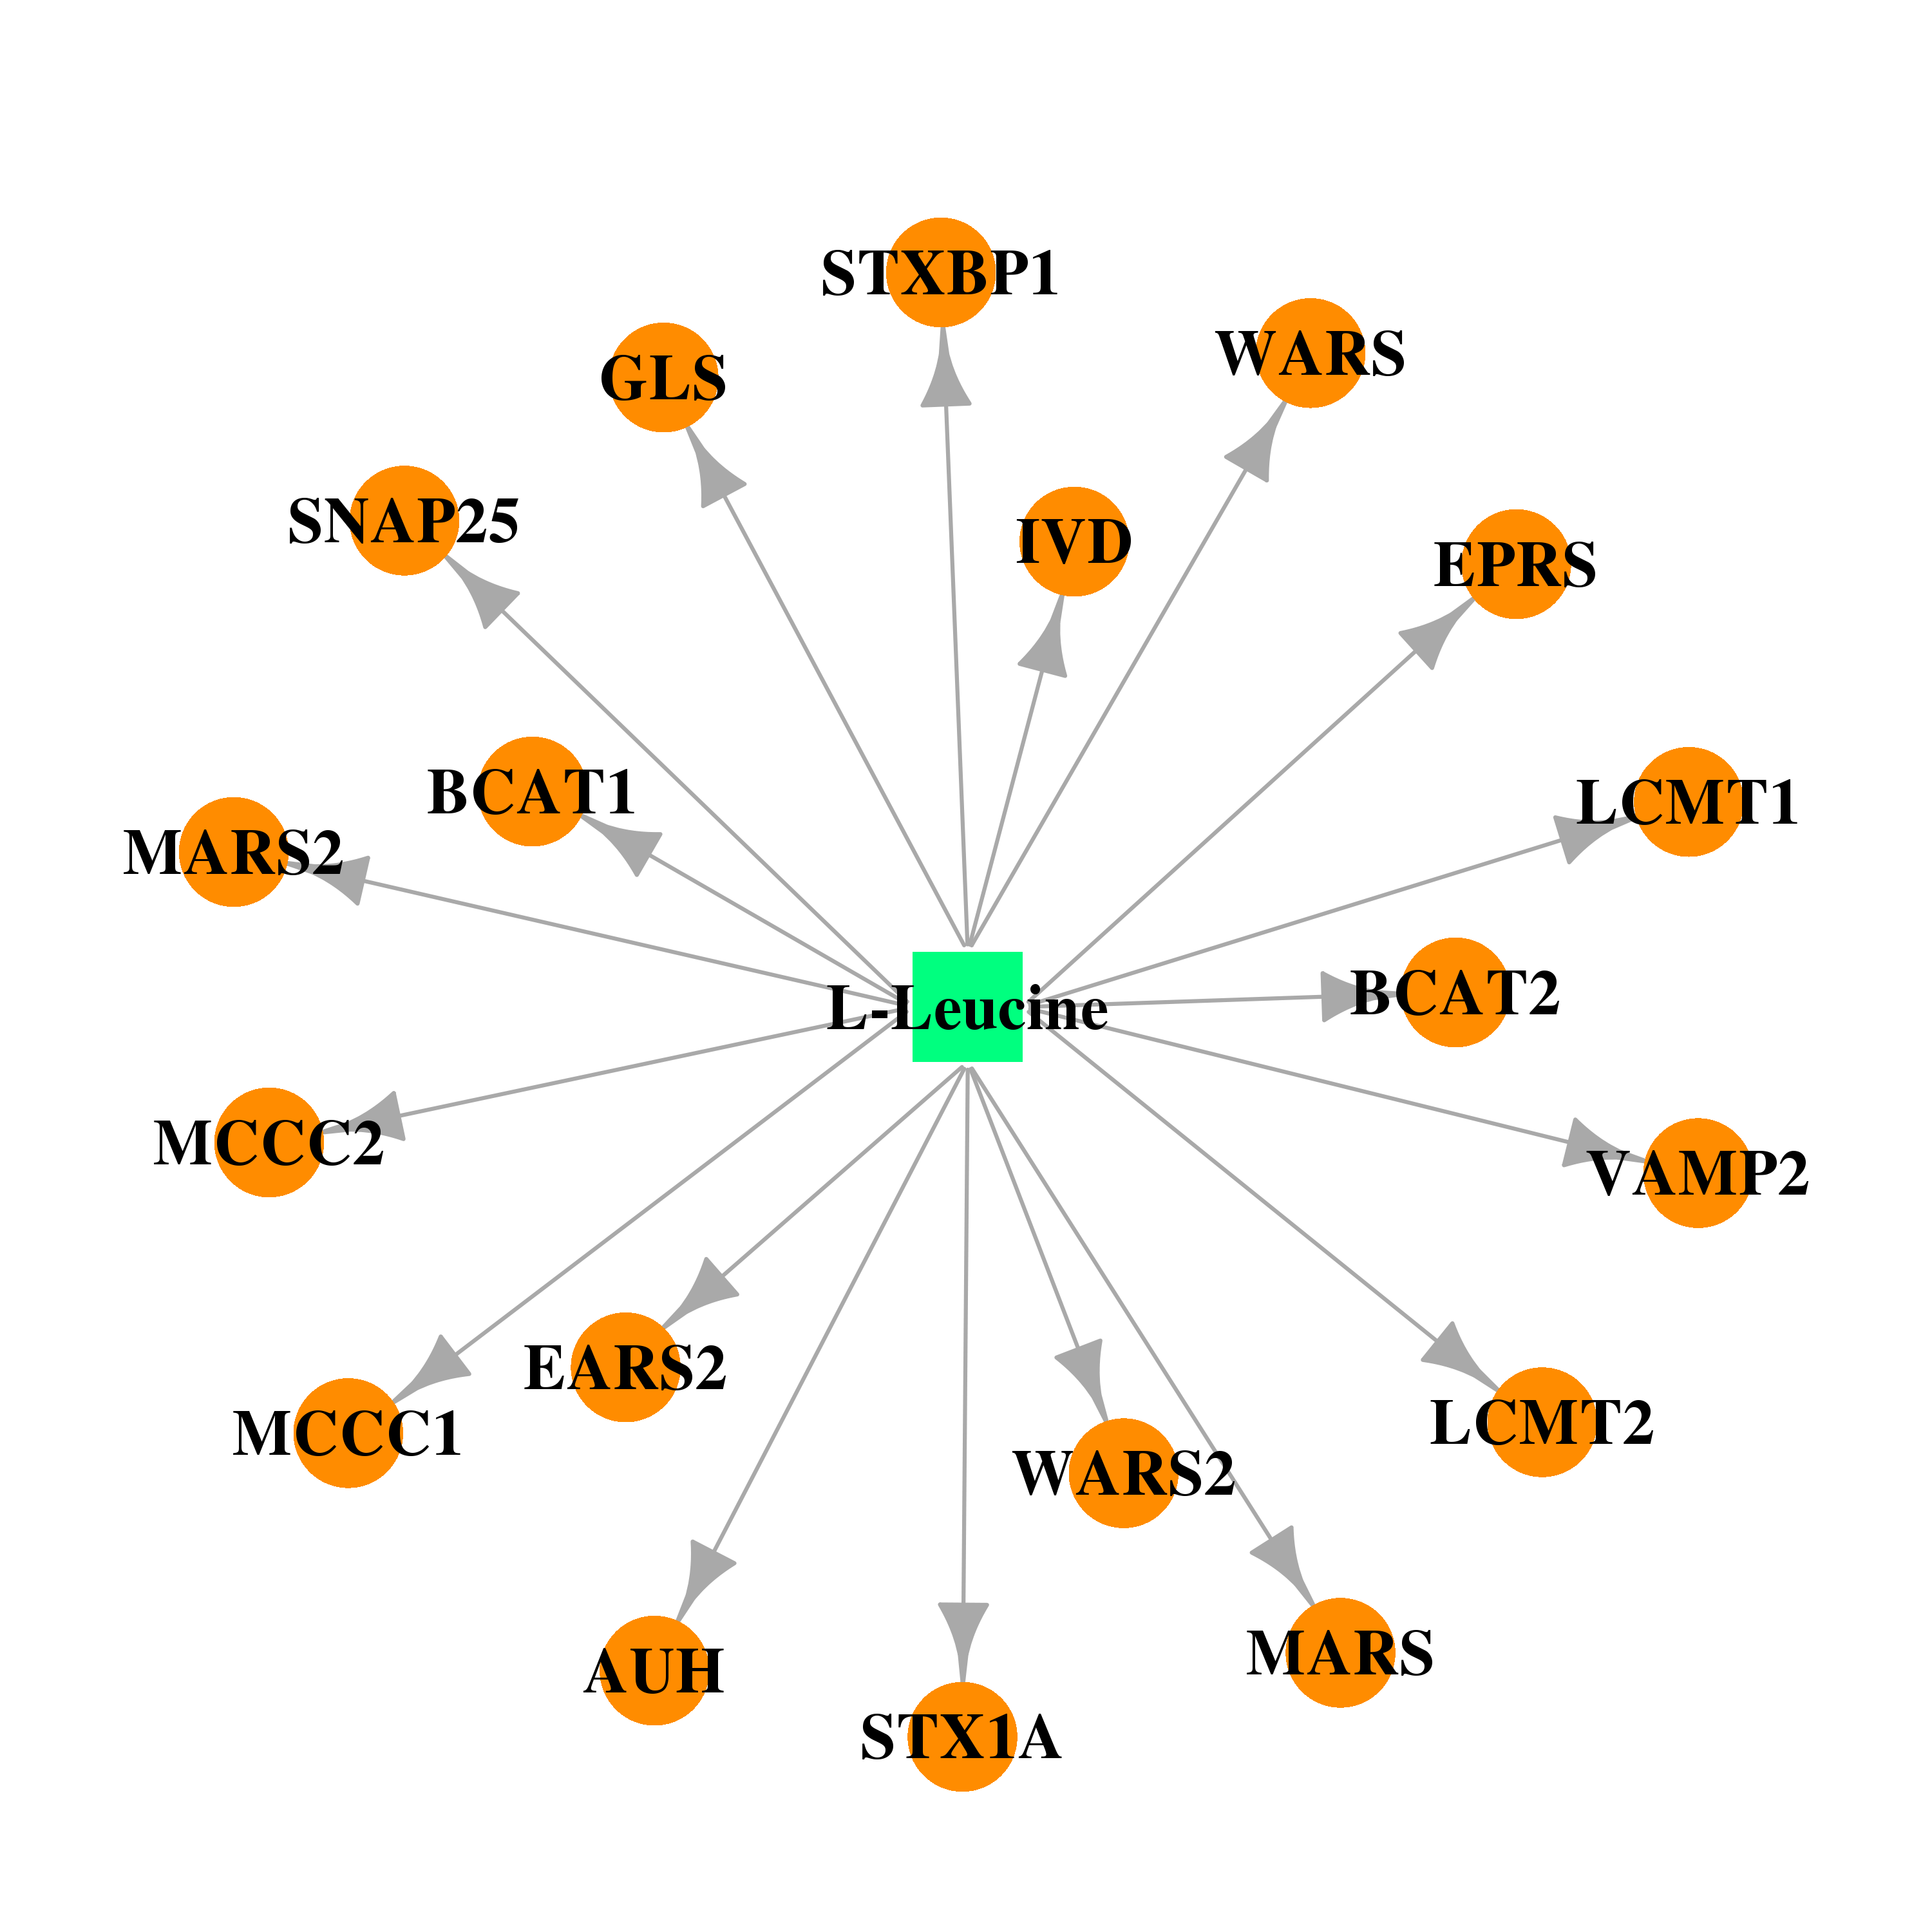 |  |
| DB01033 | methylcrotonoyl-CoA carboxylase 2 (beta) | approved | Mercaptopurine | 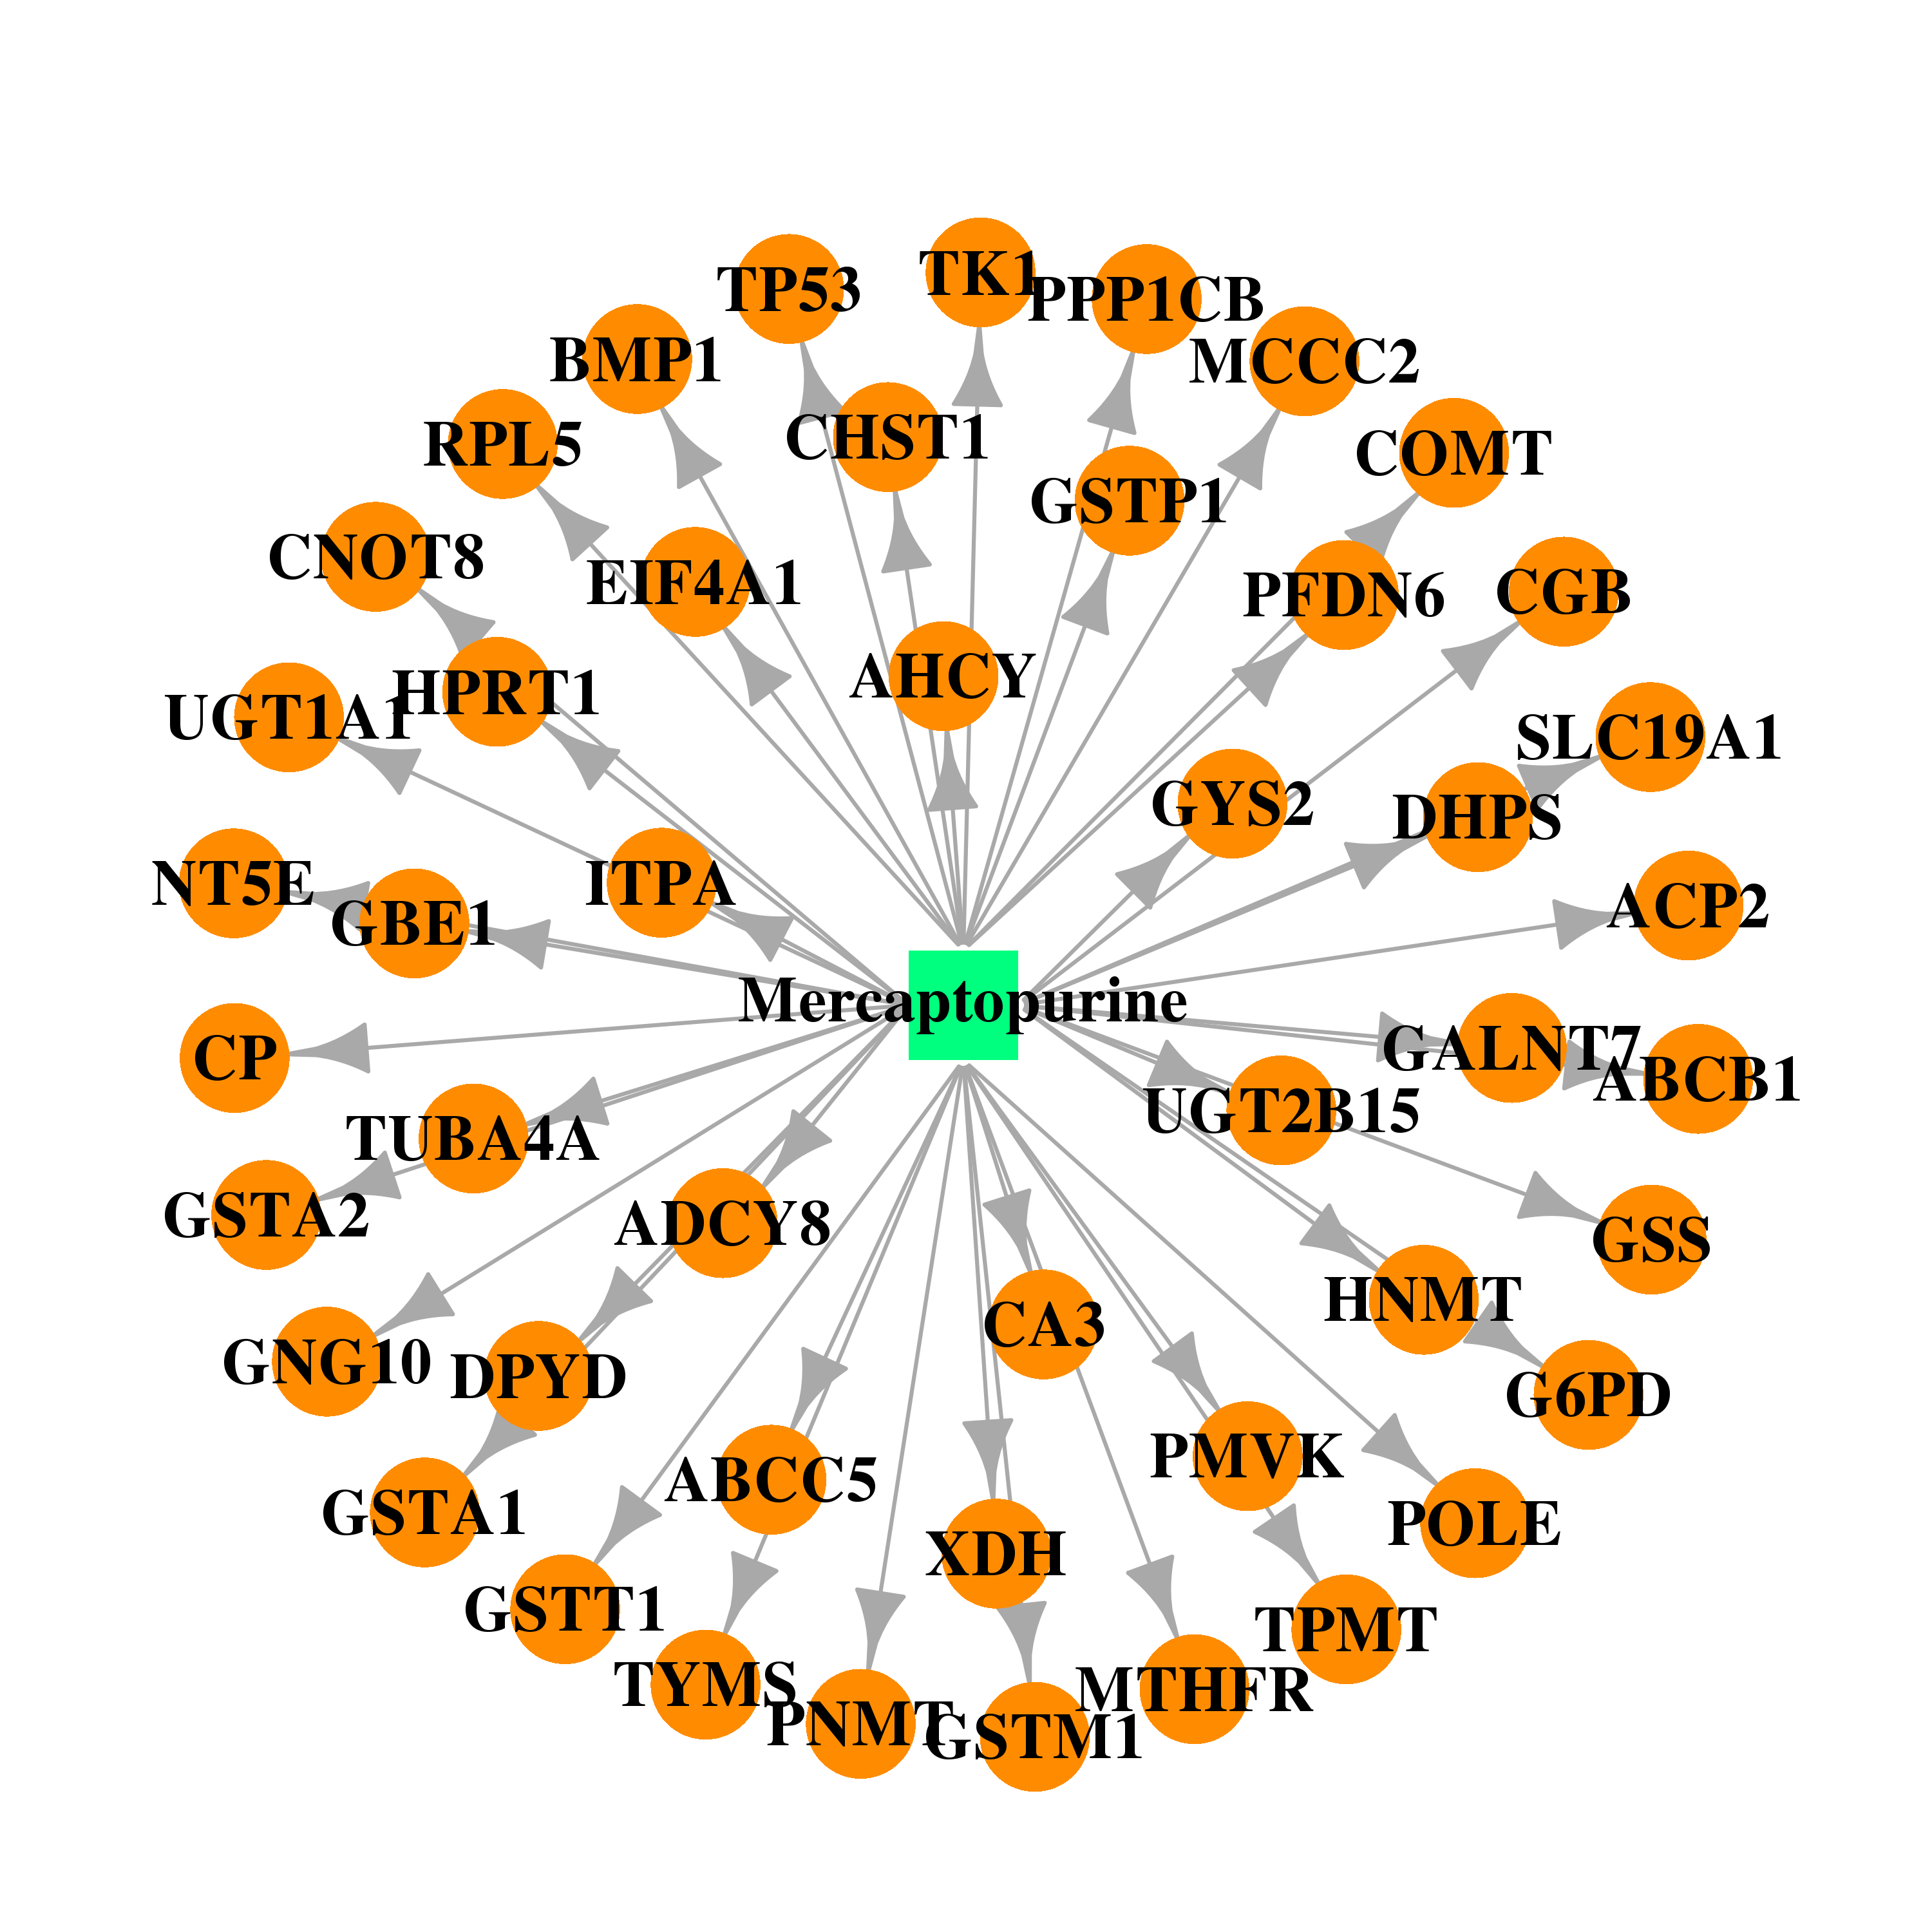 | 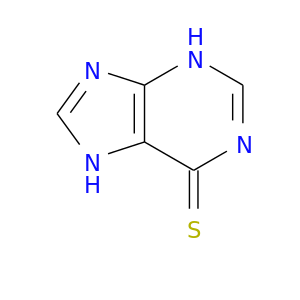 |
| DB00563 | methylcrotonoyl-CoA carboxylase 2 (beta) | approved | Methotrexate |  |  |
| Top |
| Cross referenced IDs for MCCC2 |
| * We obtained these cross-references from Uniprot database. It covers 150 different DBs, 18 categories. http://www.uniprot.org/help/cross_references_section |
: Open all cross reference information
|
Copyright © 2016-Present - The Univsersity of Texas Health Science Center at Houston @ |