|
||||||||||||||||||||||||||||||||||||||||||||||||||||||||||||||||||||||||||||||||||||||||||||||||||||||||||||||||||||||||||||||||||||||||||||||||||||||||||||||||||||||||||||||||||||||||||||||||||||||||||||||||||||||||||||||||||||||||||||||||||||||||||||||||||||||||||||||||||||||||||||||||||||||||||||||||||||||||||
| |
| Phenotypic Information (metabolism pathway, cancer, disease, phenome) |
| |
| |
| Gene-Gene Network Information: Co-Expression Network, Interacting Genes & KEGG |
| |
|


| Gene Summary for WBSCR17 |
| Basic gene info. | Gene symbol | WBSCR17 |
| Gene name | Williams-Beuren syndrome chromosome region 17 | |
| Synonyms | GALNACT17|GALNT16|GALNT20|GALNTL3|GalNAc-T5L | |
| Cytomap | UCSC genome browser: 7q11.23 | |
| Genomic location | chr7 :70597788-71178584 | |
| Type of gene | protein-coding | |
| RefGenes | NM_022479.2, | |
| Ensembl id | ENSG00000185274 | |
| Description | UDP-GalNAc:polypeptide N-acetylgalactosaminyltransferase-like 3UDP-GalNAc:polypeptide N-acetylgalactosaminyltransferase-like protein 3UDP-N-acetyl-alpha-D-galactosamine:polypeptide N-acetylgalactosaminyltransferase 16galNAc-T-like protein 3polypeptide | |
| Modification date | 20141207 | |
| dbXrefs | MIM : 615137 | |
| HGNC : HGNC | ||
| Ensembl : ENSG00000185274 | ||
| HPRD : 15655 | ||
| Vega : OTTHUMG00000129783 | ||
| Protein | UniProt: Q6IS24 go to UniProt's Cross Reference DB Table | |
| Expression | CleanEX: HS_WBSCR17 | |
| BioGPS: 64409 | ||
| Gene Expression Atlas: ENSG00000185274 | ||
| The Human Protein Atlas: ENSG00000185274 | ||
| Pathway | NCI Pathway Interaction Database: WBSCR17 | |
| KEGG: WBSCR17 | ||
| REACTOME: WBSCR17 | ||
| ConsensusPathDB | ||
| Pathway Commons: WBSCR17 | ||
| Metabolism | MetaCyc: WBSCR17 | |
| HUMANCyc: WBSCR17 | ||
| Regulation | Ensembl's Regulation: ENSG00000185274 | |
| miRBase: chr7 :70,597,788-71,178,584 | ||
| TargetScan: NM_022479 | ||
| cisRED: ENSG00000185274 | ||
| Context | iHOP: WBSCR17 | |
| cancer metabolism search in PubMed: WBSCR17 | ||
| UCL Cancer Institute: WBSCR17 | ||
| Assigned class in ccmGDB | B - This gene belongs to cancer gene. | |
| Top |
| Phenotypic Information for WBSCR17(metabolism pathway, cancer, disease, phenome) |
| Cancer | CGAP: WBSCR17 |
| Familial Cancer Database: WBSCR17 | |
| * This gene is included in those cancer gene databases. |
|
|
|
|
|
| . | ||||||||||||||||||||||||||||||||||||||||||||||||||||||||||||||||||||||||||||||||||||||||||||||||||||||||||||||||||||||||||||||||||||||||||||||||||||||||||||||||||||||||||||||||||||||||||||||||||||||||||||||||||||||||||||||||||||||||||||||||||||||||||||||||||||||||||||||||||||||||||||||||||||||||||||||||||||
Oncogene 1 | Significant driver gene in COAD 6, | |||||||||||||||||||||||||||||||||||||||||||||||||||||||||||||||||||||||||||||||||||||||||||||||||||||||||||||||||||||||||||||||||||||||||||||||||||||||||||||||||||||||||||||||||||||||||||||||||||||||||||||||||||||||||||||||||||||||||||||||||||||||||||||||||||||||||||||||||||||||||||||||||||||||||||||||||||||||||
| cf) number; DB name 1 Oncogene; http://nar.oxfordjournals.org/content/35/suppl_1/D721.long, 2 Tumor Suppressor gene; https://bioinfo.uth.edu/TSGene/, 3 Cancer Gene Census; http://www.nature.com/nrc/journal/v4/n3/abs/nrc1299.html, 4 CancerGenes; http://nar.oxfordjournals.org/content/35/suppl_1/D721.long, 5 Network of Cancer Gene; http://ncg.kcl.ac.uk/index.php, 6 http://www.nature.com/nature/journal/v487/n7407/full/nature11252.html, 7Therapeutic Vulnerabilities in Cancer; http://cbio.mskcc.org/cancergenomics/statius/ |
| REACTOME_METABOLISM_OF_PROTEINS | |
| Mutations for WBSCR17 |
| * Under tables are showing count per each tissue to give us broad intuition about tissue specific mutation patterns.You can go to the detailed page for each mutation database's web site. |
| - Statistics for Tissue and Mutation type | Top |
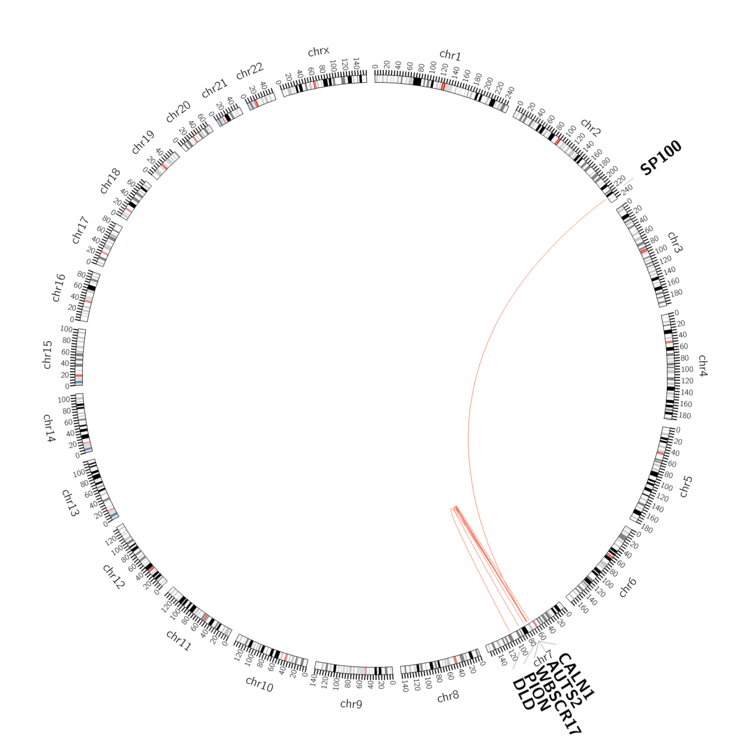 |
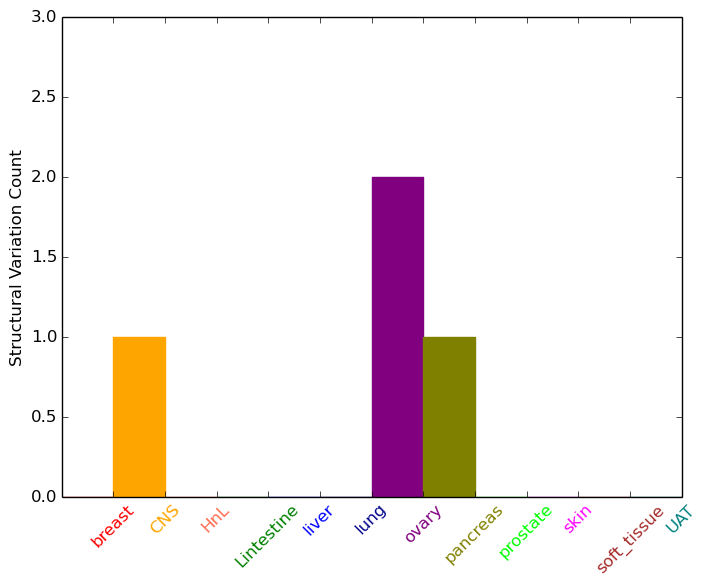
| - For Inter-chromosomal Variations |
| * Inter-chromosomal variantions includes 'interchromosomal amplicon to amplicon', 'interchromosomal amplicon to non-amplified dna', 'interchromosomal insertion', 'Interchromosomal unknown type'. |
 |
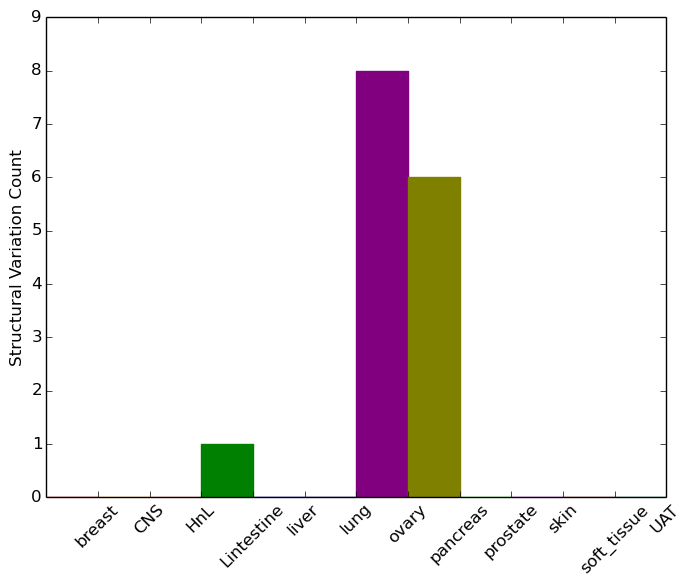
| - For Intra-chromosomal Variations |
| * Intra-chromosomal variantions includes 'intrachromosomal amplicon to amplicon', 'intrachromosomal amplicon to non-amplified dna', 'intrachromosomal deletion', 'intrachromosomal fold-back inversion', 'intrachromosomal inversion', 'intrachromosomal tandem duplication', 'Intrachromosomal unknown type', 'intrachromosomal with inverted orientation', 'intrachromosomal with non-inverted orientation'. |
 |
| Sample | Symbol_a | Chr_a | Start_a | End_a | Symbol_b | Chr_b | Start_b | End_b |
| large_intestine | WBSCR17 | chr7 | 70815897 | 70815897 | CALN1 | chr7 | 71385801 | 71385801 |
| ovary | WBSCR17 | chr7 | 70699900 | 70699920 | chr7 | 70464726 | 70464746 | |
| ovary | WBSCR17 | chr7 | 70710973 | 70710993 | AUTS2 | chr7 | 70065815 | 70065835 |
| ovary | WBSCR17 | chr7 | 70858694 | 70858714 | WBSCR17 | chr7 | 70908867 | 70908887 |
| ovary | WBSCR17 | chr7 | 70923253 | 70923273 | NLGN4X | chr23 | 5986514 | 5986534 |
| ovary | WBSCR17 | chr7 | 70923256 | 70923276 | WBSCR17 | chr7 | 70923687 | 70923707 |
| ovary | WBSCR17 | chr7 | 70923672 | 70923692 | NLGN4X | chr23 | 5986832 | 5986852 |
| ovary | WBSCR17 | chr7 | 70981896 | 70981916 | WBSCR17 | chr7 | 70983668 | 70983688 |
| ovary | WBSCR17 | chr7 | 71074474 | 71074494 | chr7 | 88035818 | 88035838 | |
| pancreas | WBSCR17 | chr7 | 70608724 | 70608744 | WBSCR17 | chr7 | 70608789 | 70608809 |
| pancreas | WBSCR17 | chr7 | 70832400 | 70832420 | WBSCR17 | chr7 | 70832820 | 70832840 |
| pancreas | WBSCR17 | chr7 | 70875687 | 70875707 | chr7 | 65633384 | 65633404 | |
| pancreas | WBSCR17 | chr7 | 70907436 | 70907456 | PION | chr7 | 76978046 | 76978066 |
| pancreas | WBSCR17 | chr7 | 70987356 | 70987376 | WBSCR17 | chr7 | 70987414 | 70987434 |
| pancreas | WBSCR17 | chr7 | 71065840 | 71065860 | chr23 | 8715815 | 8715835 | |
| pancreas | WBSCR17 | chr7 | 71080171 | 71080191 | DLD | chr7 | 107553881 | 107553901 |
| cf) Tissue number; Tissue name (1;Breast, 2;Central_nervous_system, 3;Haematopoietic_and_lymphoid_tissue, 4;Large_intestine, 5;Liver, 6;Lung, 7;Ovary, 8;Pancreas, 9;Prostate, 10;Skin, 11;Soft_tissue, 12;Upper_aerodigestive_tract) |
| * From mRNA Sanger sequences, Chitars2.0 arranged chimeric transcripts. This table shows WBSCR17 related fusion information. |
| ID | Head Gene | Tail Gene | Accession | Gene_a | qStart_a | qEnd_a | Chromosome_a | tStart_a | tEnd_a | Gene_a | qStart_a | qEnd_a | Chromosome_a | tStart_a | tEnd_a |
| DA178830 | SLC39A11 | 1 | 70 | 17 | 70949895 | 70949964 | WBSCR17 | 67 | 514 | 7 | 71130394 | 71175771 | |
| BI001777 | WBSCR17 | 1 | 281 | 7 | 71177662 | 71177943 | WBSCR17 | 280 | 567 | 7 | 71177248 | 71177534 | |
| S60878 | INPP4B | 8 | 34 | 4 | 143719085 | 143719135 | WBSCR17 | 15 | 35 | 7 | 70897786 | 70897806 | |
| Top |
| Mutation type/ Tissue ID | brca | cns | cerv | endome | haematopo | kidn | Lintest | liver | lung | ns | ovary | pancre | prost | skin | stoma | thyro | urina | |||
| Total # sample | 1 | 6 | 4 | 3 | 4 | 2 | 2 | 1 | ||||||||||||
| GAIN (# sample) | 1 | 5 | 3 | 3 | 4 | 2 | 2 | 1 | ||||||||||||
| LOSS (# sample) | 1 | 1 |
| cf) Tissue ID; Tissue type (1; Breast, 2; Central_nervous_system, 3; Cervix, 4; Endometrium, 5; Haematopoietic_and_lymphoid_tissue, 6; Kidney, 7; Large_intestine, 8; Liver, 9; Lung, 10; NS, 11; Ovary, 12; Pancreas, 13; Prostate, 14; Skin, 15; Stomach, 16; Thyroid, 17; Urinary_tract) |
| Top |
|
 |
| Top |
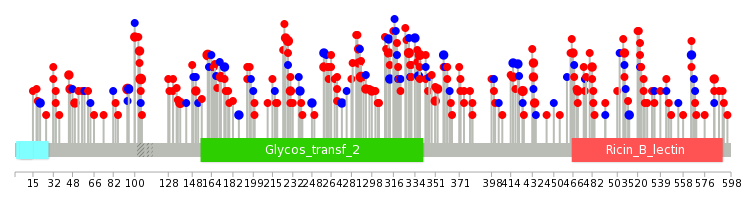
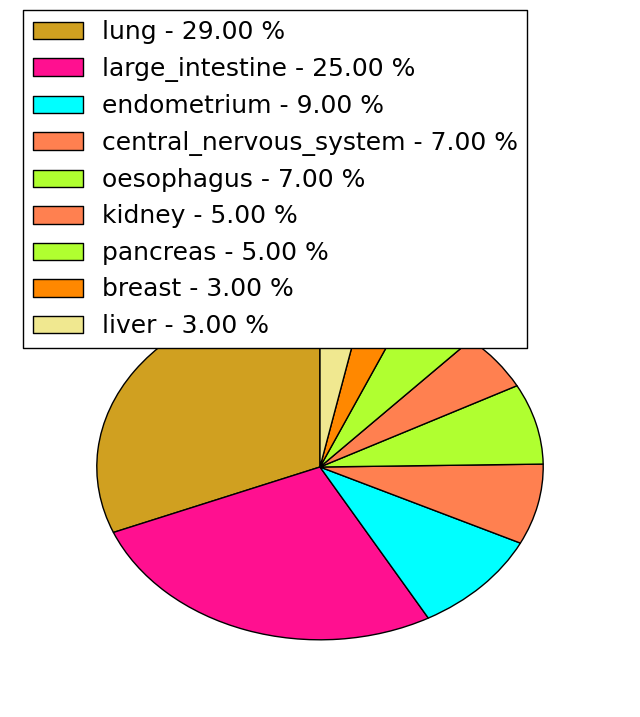
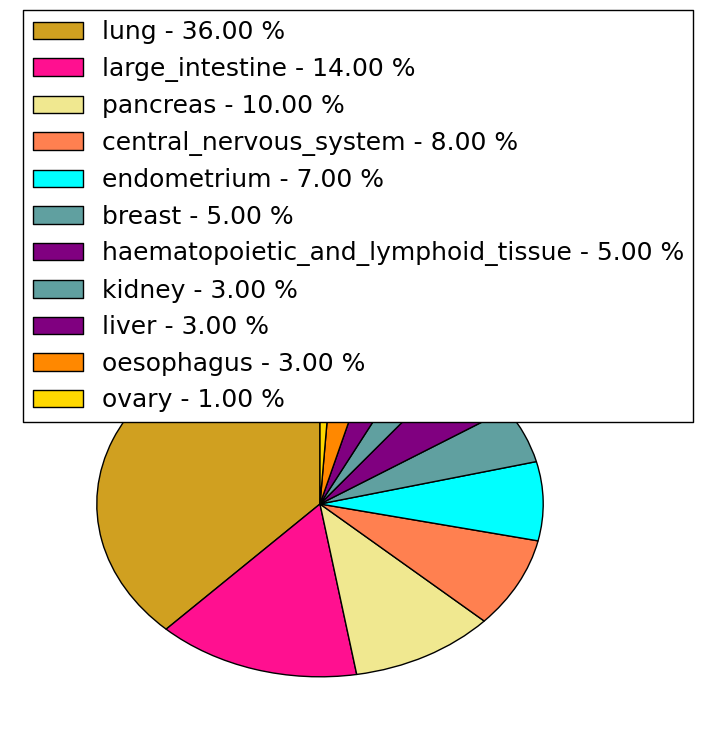
| Stat. for Non-Synonymous SNVs (# total SNVs=177) | (# total SNVs=57) |
 |  |
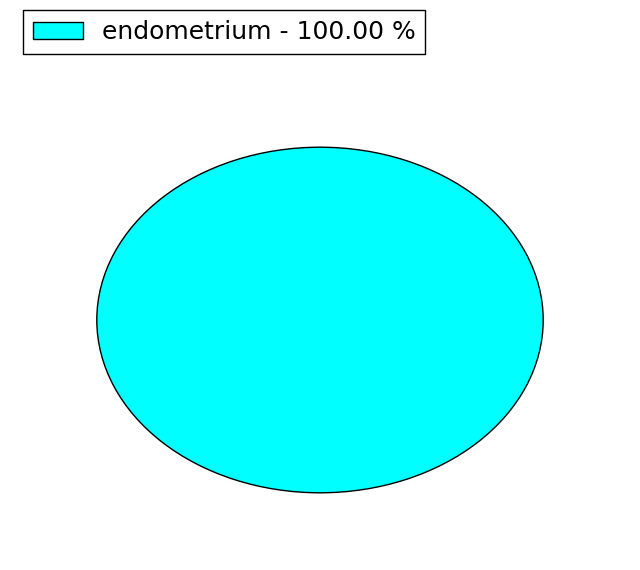
(# total SNVs=1) | (# total SNVs=0) |
 |
| Top |
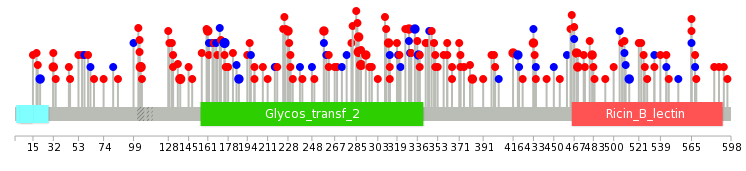
| * When you move the cursor on each content, you can see more deailed mutation information on the Tooltip. Those are primary_site,primary_histology,mutation(aa),pubmedID. |
| GRCh37 position | Mutation(aa) | Unique sampleID count |
| chr7:70853279-70853279 | p.V161M | 4 |
| chr7:70800611-70800611 | p.P105L | 4 |
| chr7:71036319-71036319 | p.G338S | 4 |
| chr7:70800577-70800577 | p.R94W | 4 |
| chr7:70885994-70885994 | p.E289K | 4 |
| chr7:70853312-70853312 | p.V172M | 3 |
| chr7:70800608-70800608 | p.S104F | 3 |
| chr7:70800709-70800709 | p.R138C | 3 |
| chr7:71134961-71134961 | p.P424L | 3 |
| chr7:71036364-71036364 | p.E353Q | 3 |
| Top |
|
 |
| Point Mutation/ Tissue ID | 1 | 2 | 3 | 4 | 5 | 6 | 7 | 8 | 9 | 10 | 11 | 12 | 13 | 14 | 15 | 16 | 17 | 18 | 19 | 20 |
| # sample | 3 | 5 | 35 | 9 | 8 | 6 | 1 | 30 | 14 | 2 | 1 | 48 | 23 | 14 | ||||||
| # mutation | 3 | 5 | 34 | 9 | 8 | 7 | 1 | 29 | 16 | 2 | 1 | 48 | 23 | 18 | ||||||
| nonsynonymous SNV | 3 | 4 | 30 | 7 | 6 | 5 | 1 | 24 | 10 | 1 | 1 | 30 | 19 | 14 | ||||||
| synonymous SNV | 1 | 5 | 2 | 2 | 2 | 5 | 6 | 1 | 18 | 4 | 4 |
| cf) Tissue ID; Tissue type (1; BLCA[Bladder Urothelial Carcinoma], 2; BRCA[Breast invasive carcinoma], 3; CESC[Cervical squamous cell carcinoma and endocervical adenocarcinoma], 4; COAD[Colon adenocarcinoma], 5; GBM[Glioblastoma multiforme], 6; Glioma Low Grade, 7; HNSC[Head and Neck squamous cell carcinoma], 8; KICH[Kidney Chromophobe], 9; KIRC[Kidney renal clear cell carcinoma], 10; KIRP[Kidney renal papillary cell carcinoma], 11; LAML[Acute Myeloid Leukemia], 12; LUAD[Lung adenocarcinoma], 13; LUSC[Lung squamous cell carcinoma], 14; OV[Ovarian serous cystadenocarcinoma ], 15; PAAD[Pancreatic adenocarcinoma], 16; PRAD[Prostate adenocarcinoma], 17; SKCM[Skin Cutaneous Melanoma], 18:STAD[Stomach adenocarcinoma], 19:THCA[Thyroid carcinoma], 20:UCEC[Uterine Corpus Endometrial Carcinoma]) |
| Top |
| * We represented just top 10 SNVs. When you move the cursor on each content, you can see more deailed mutation information on the Tooltip. Those are primary_site, primary_histology, mutation(aa), pubmedID. |
| Genomic Position | Mutation(aa) | Unique sampleID count |
| chr7:70800709 | p.E433E | 3 |
| chr7:70885988 | p.A175A | 3 |
| chr7:71134989 | p.R138C | 3 |
| chr7:70800611 | p.R287W | 3 |
| chr7:70885994 | p.P105L | 3 |
| chr7:70853323 | p.E289K | 3 |
| chr7:71036293 | p.R334R | 2 |
| chr7:71130562 | p.G482R | 2 |
| chr7:70853359 | p.F337F | 2 |
| chr7:71142235 | p.T565M | 2 |
| * Copy number data were extracted from TCGA using R package TCGA-Assembler. The URLs of all public data files on TCGA DCC data server were gathered on Jan-05-2015. Function ProcessCNAData in TCGA-Assembler package was used to obtain gene-level copy number value which is calculated as the average copy number of the genomic region of a gene. |
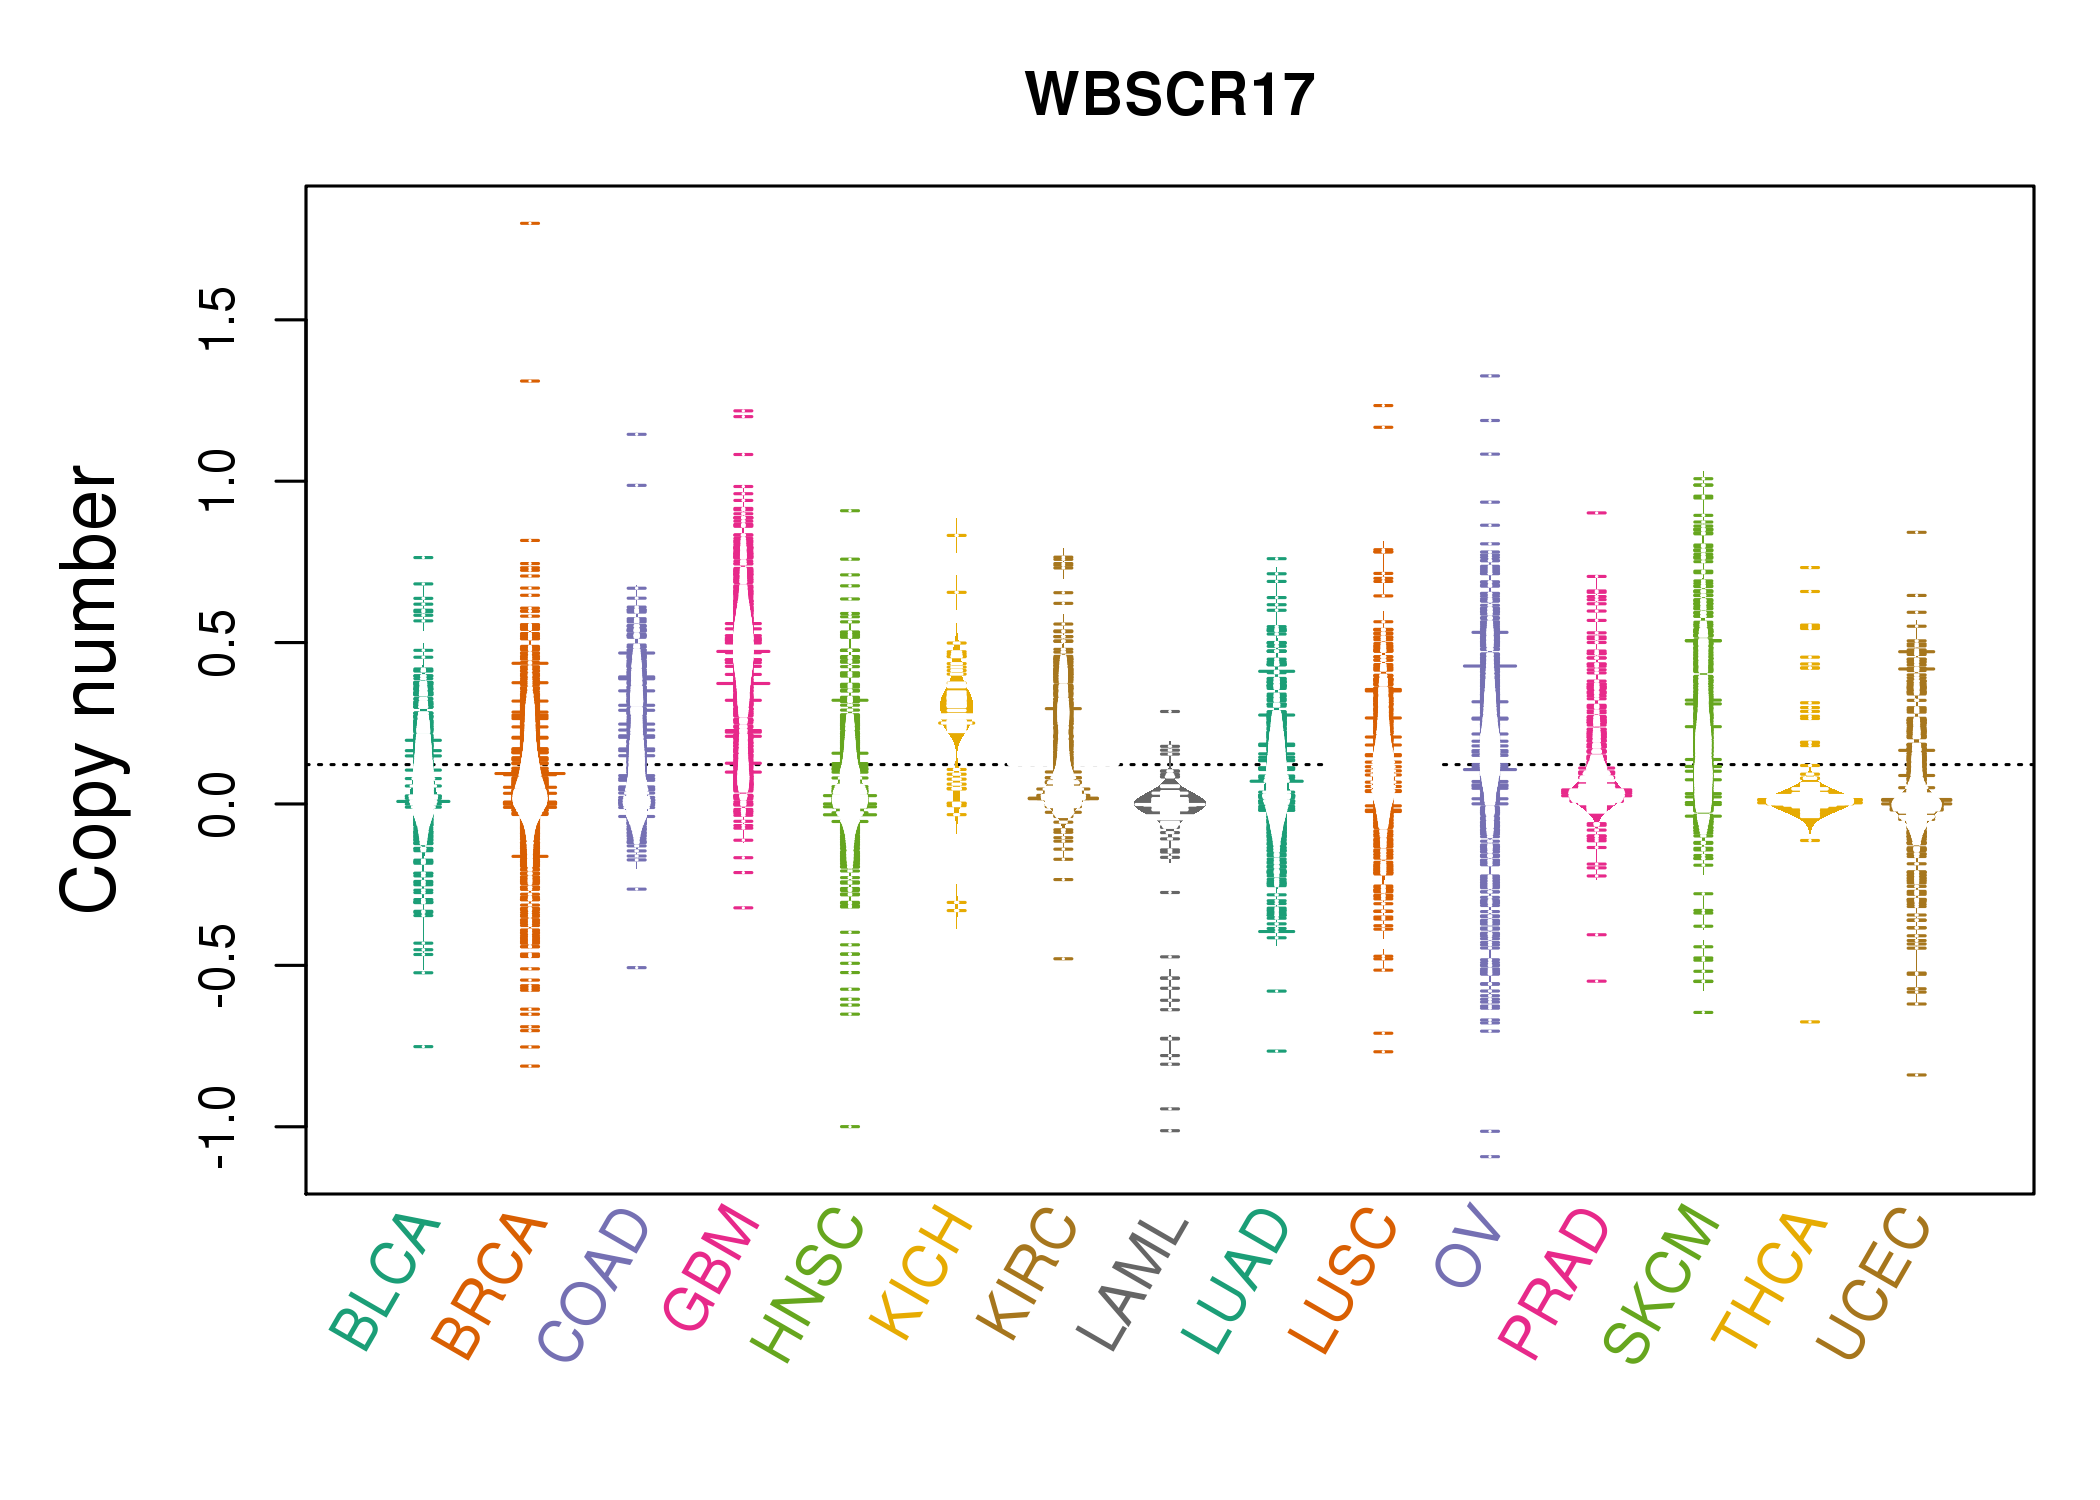 |
| cf) Tissue ID[Tissue type]: BLCA[Bladder Urothelial Carcinoma], BRCA[Breast invasive carcinoma], CESC[Cervical squamous cell carcinoma and endocervical adenocarcinoma], COAD[Colon adenocarcinoma], GBM[Glioblastoma multiforme], Glioma Low Grade, HNSC[Head and Neck squamous cell carcinoma], KICH[Kidney Chromophobe], KIRC[Kidney renal clear cell carcinoma], KIRP[Kidney renal papillary cell carcinoma], LAML[Acute Myeloid Leukemia], LUAD[Lung adenocarcinoma], LUSC[Lung squamous cell carcinoma], OV[Ovarian serous cystadenocarcinoma ], PAAD[Pancreatic adenocarcinoma], PRAD[Prostate adenocarcinoma], SKCM[Skin Cutaneous Melanoma], STAD[Stomach adenocarcinoma], THCA[Thyroid carcinoma], UCEC[Uterine Corpus Endometrial Carcinoma] |
| Top |
| Gene Expression for WBSCR17 |
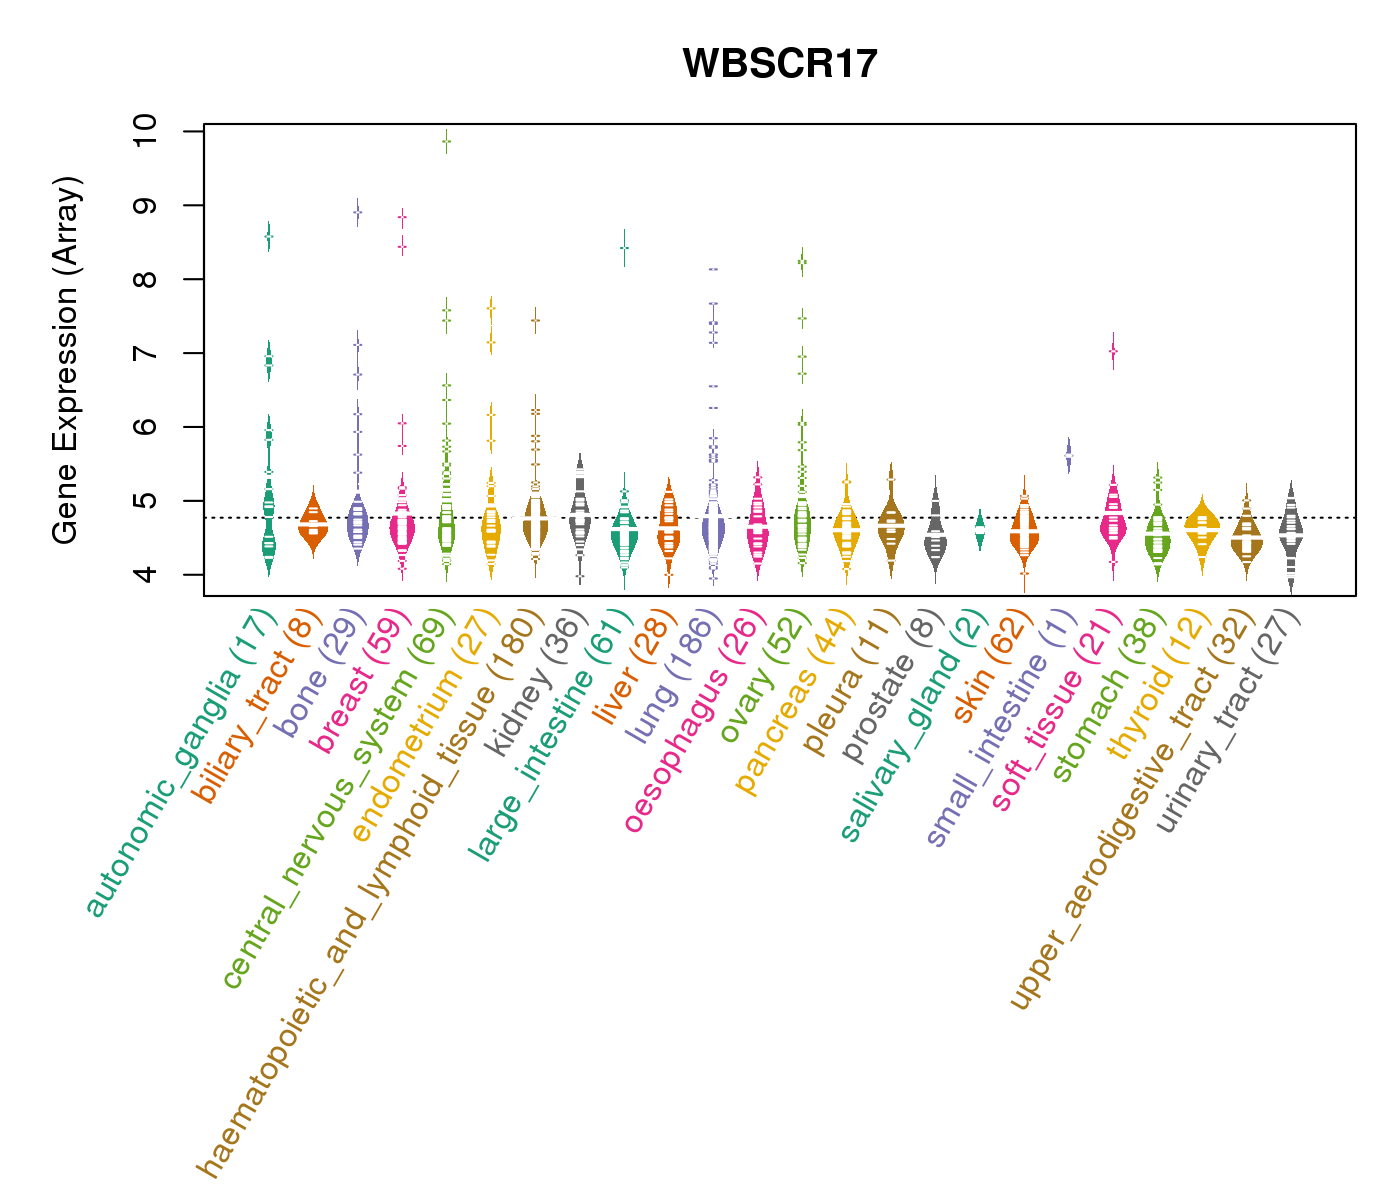
| * CCLE gene expression data were extracted from CCLE_Expression_Entrez_2012-10-18.res: Gene-centric RMA-normalized mRNA expression data. |
 |
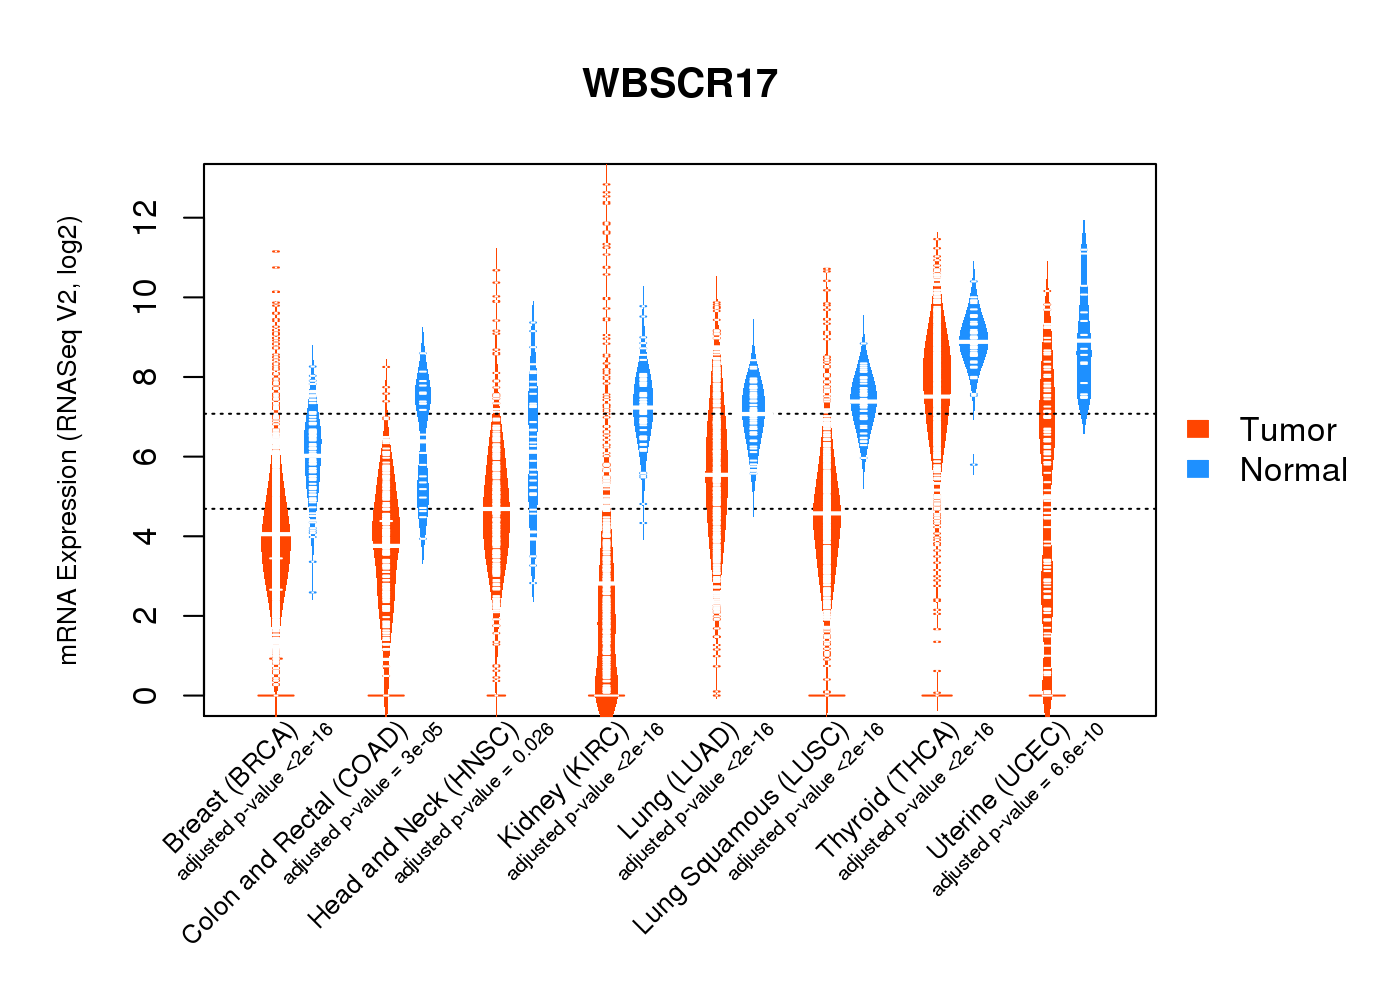
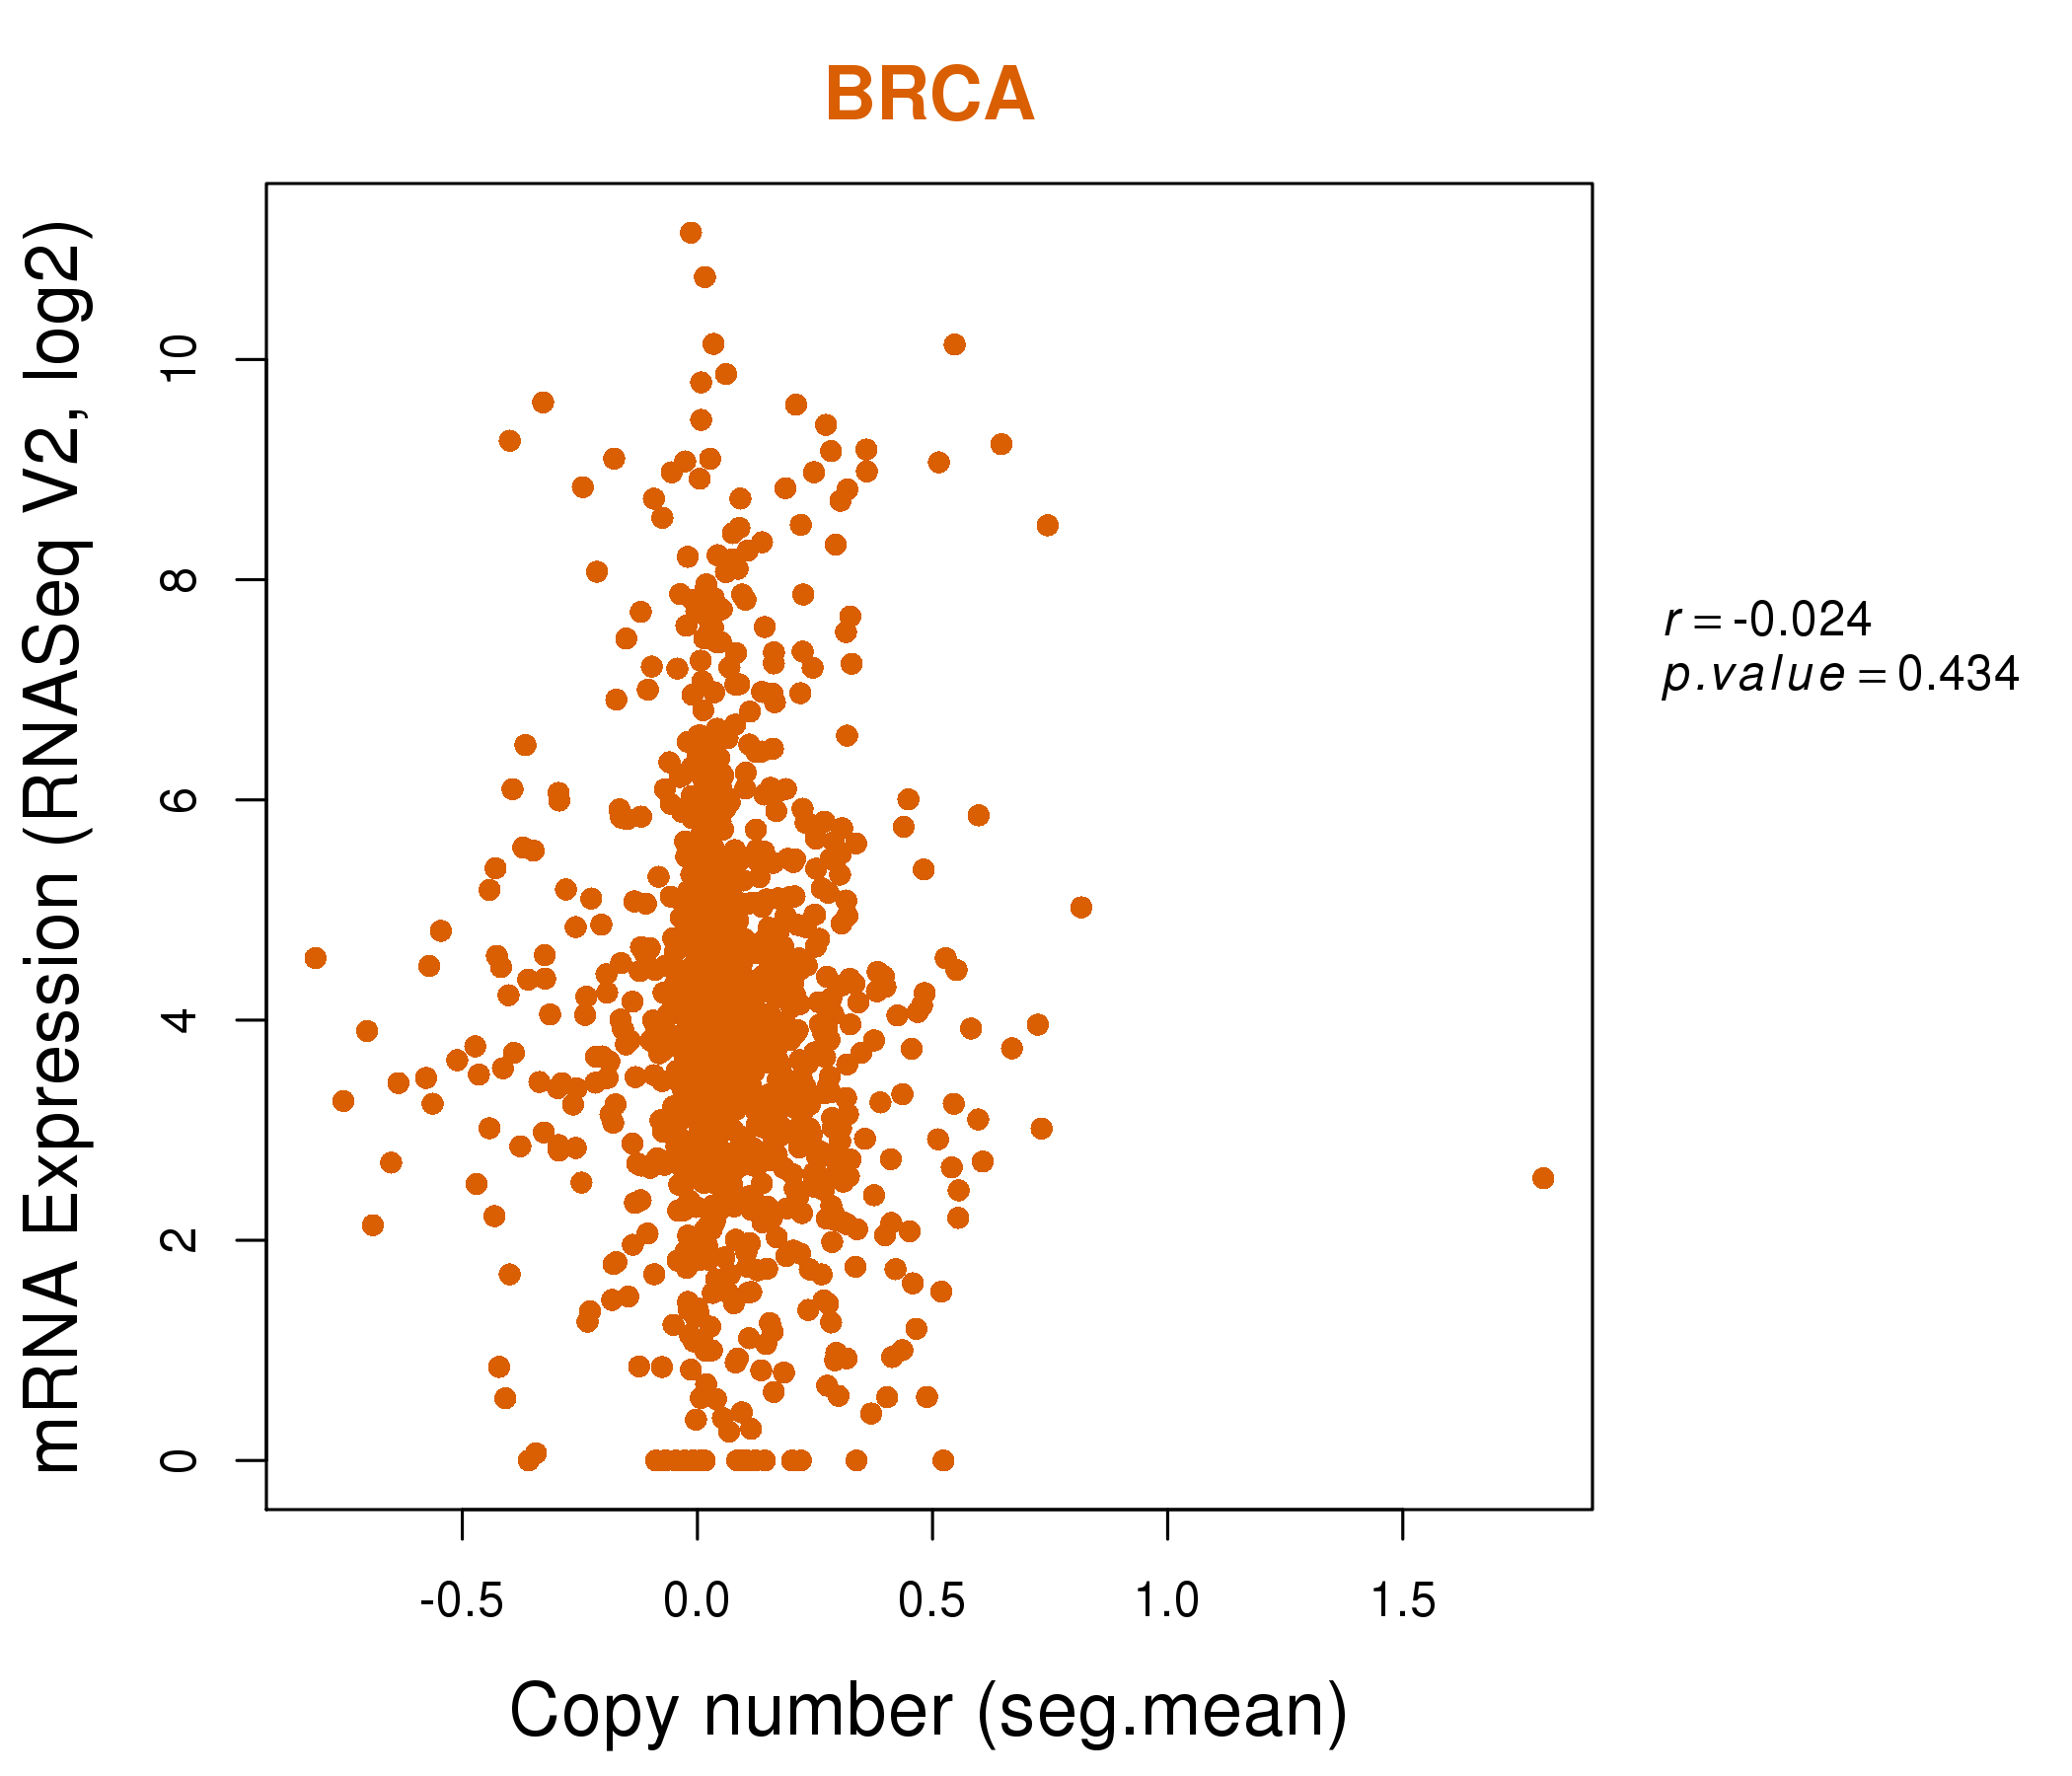
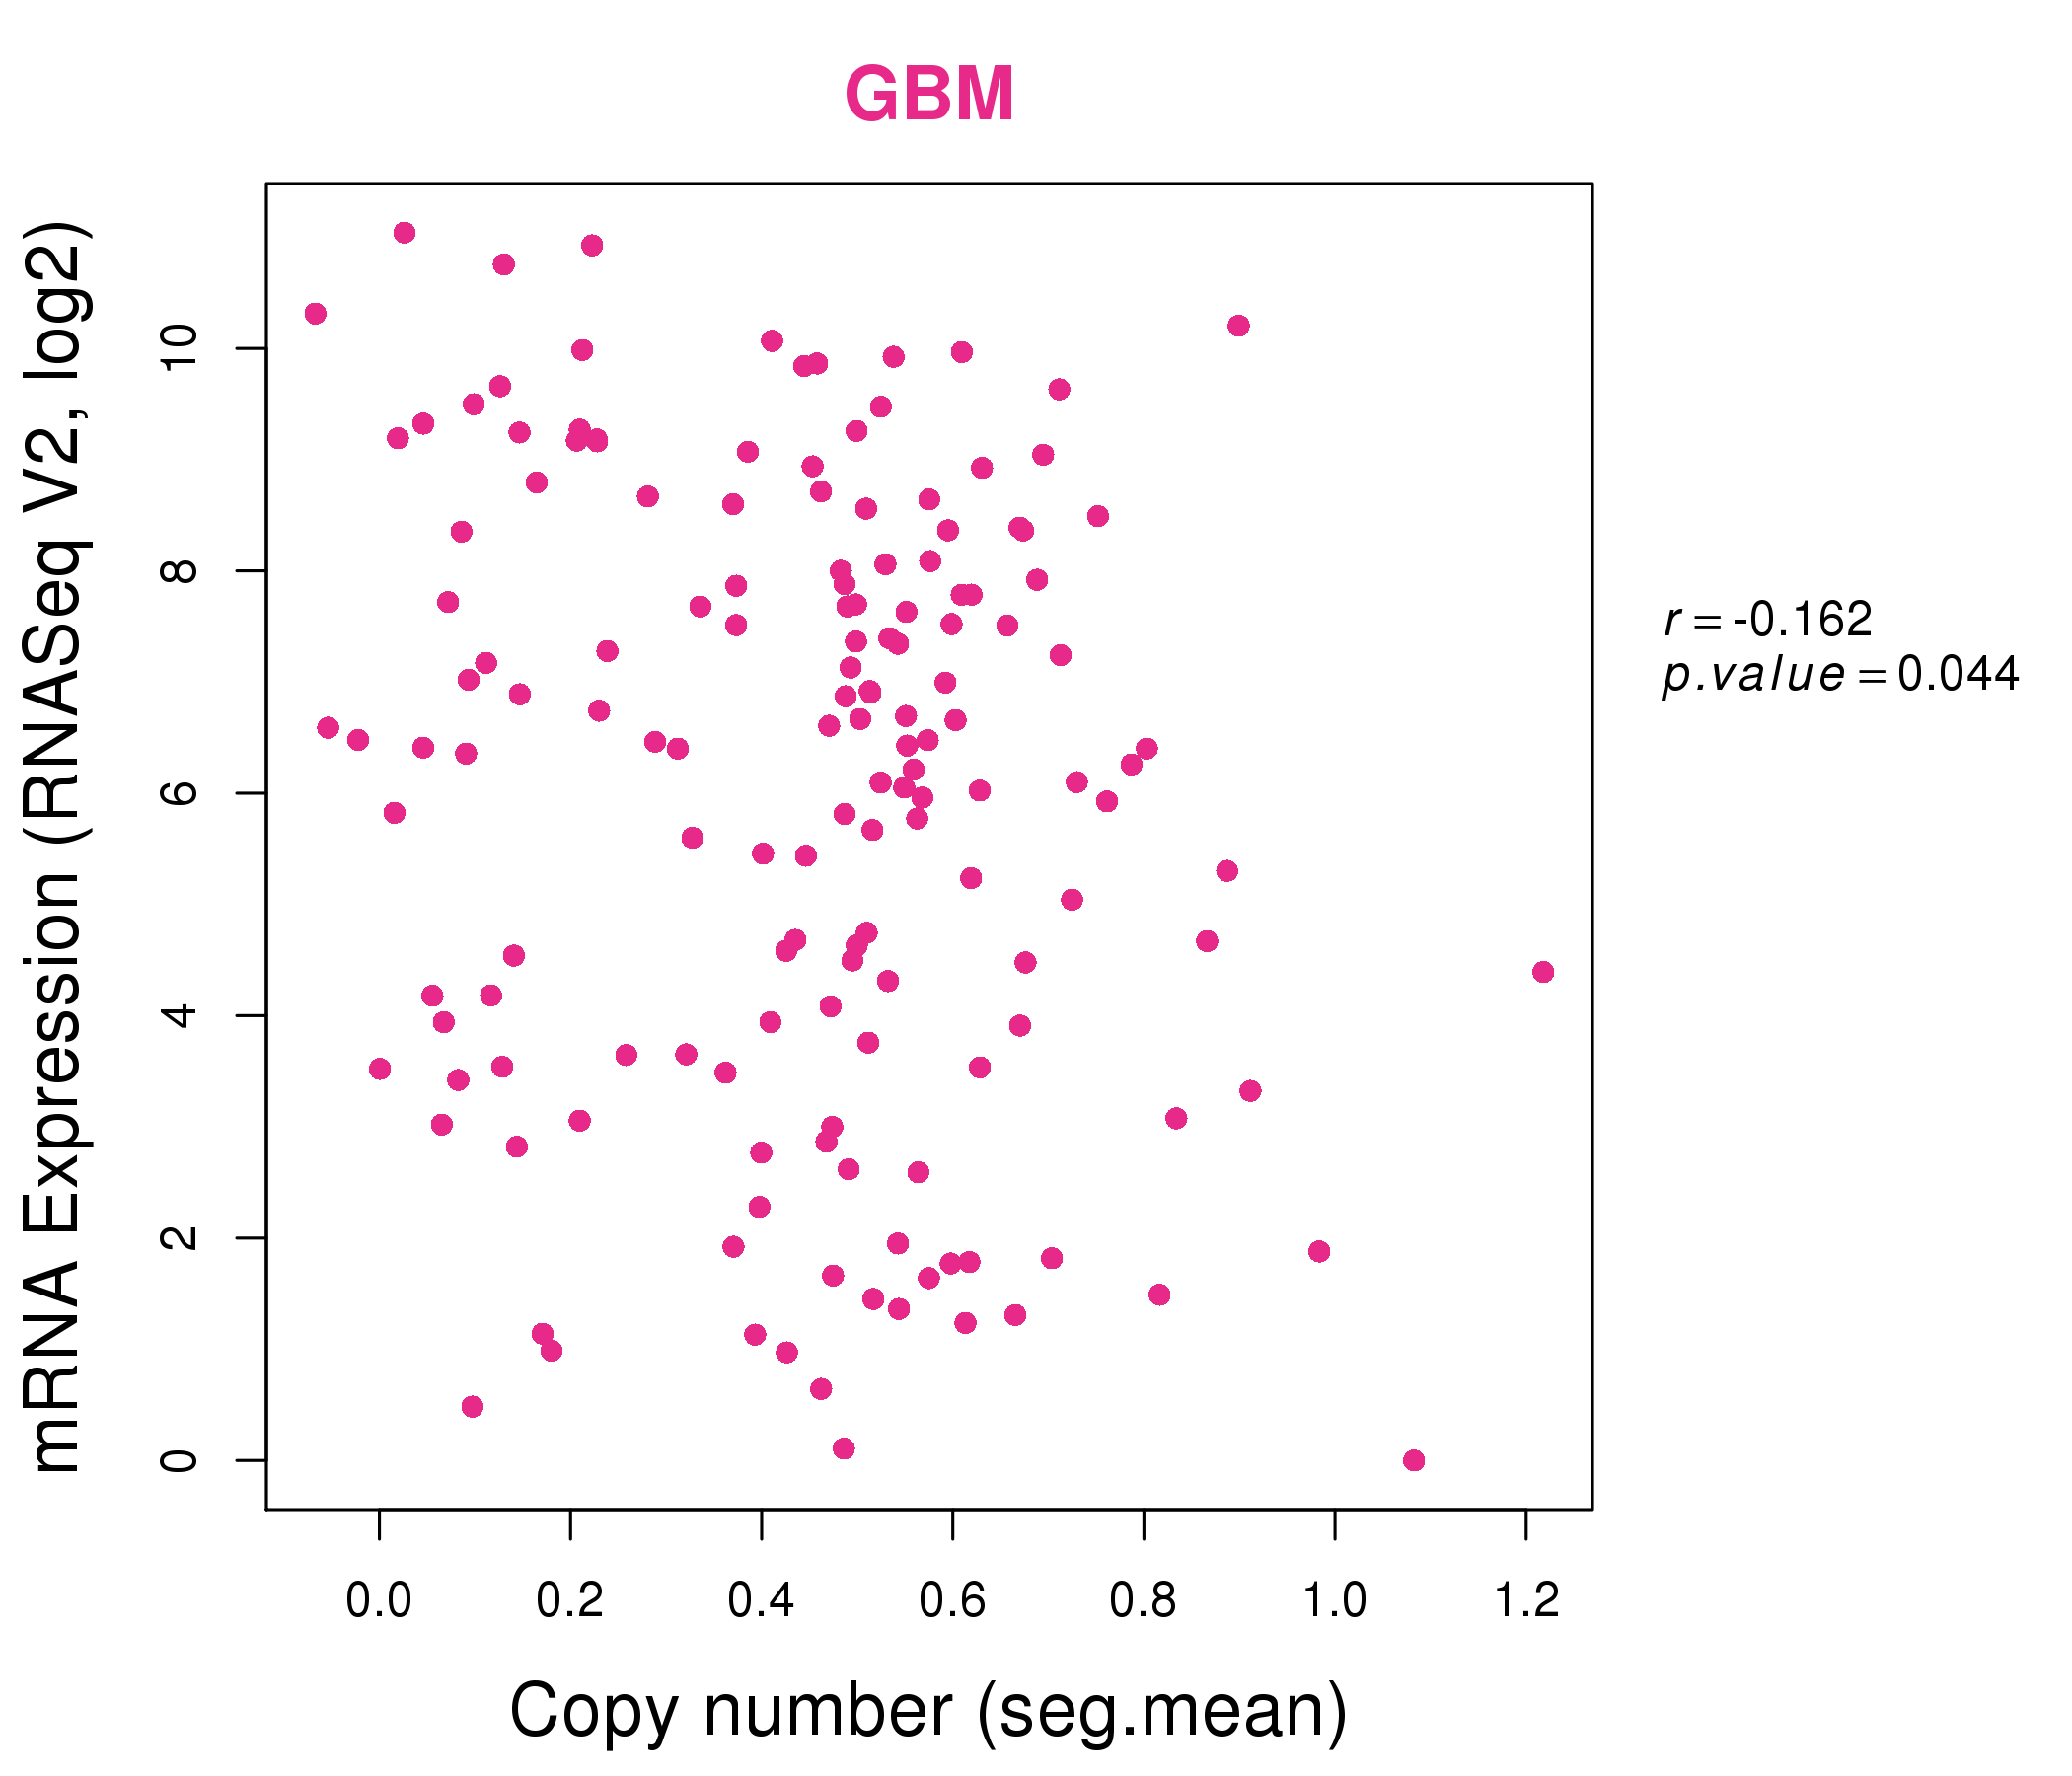
| * Normalized gene expression data of RNASeqV2 was extracted from TCGA using R package TCGA-Assembler. The URLs of all public data files on TCGA DCC data server were gathered at Jan-05-2015. Only eight cancer types have enough normal control samples for differential expression analysis. (t test, adjusted p<0.05 (using Benjamini-Hochberg FDR)) |
 |
| Top |
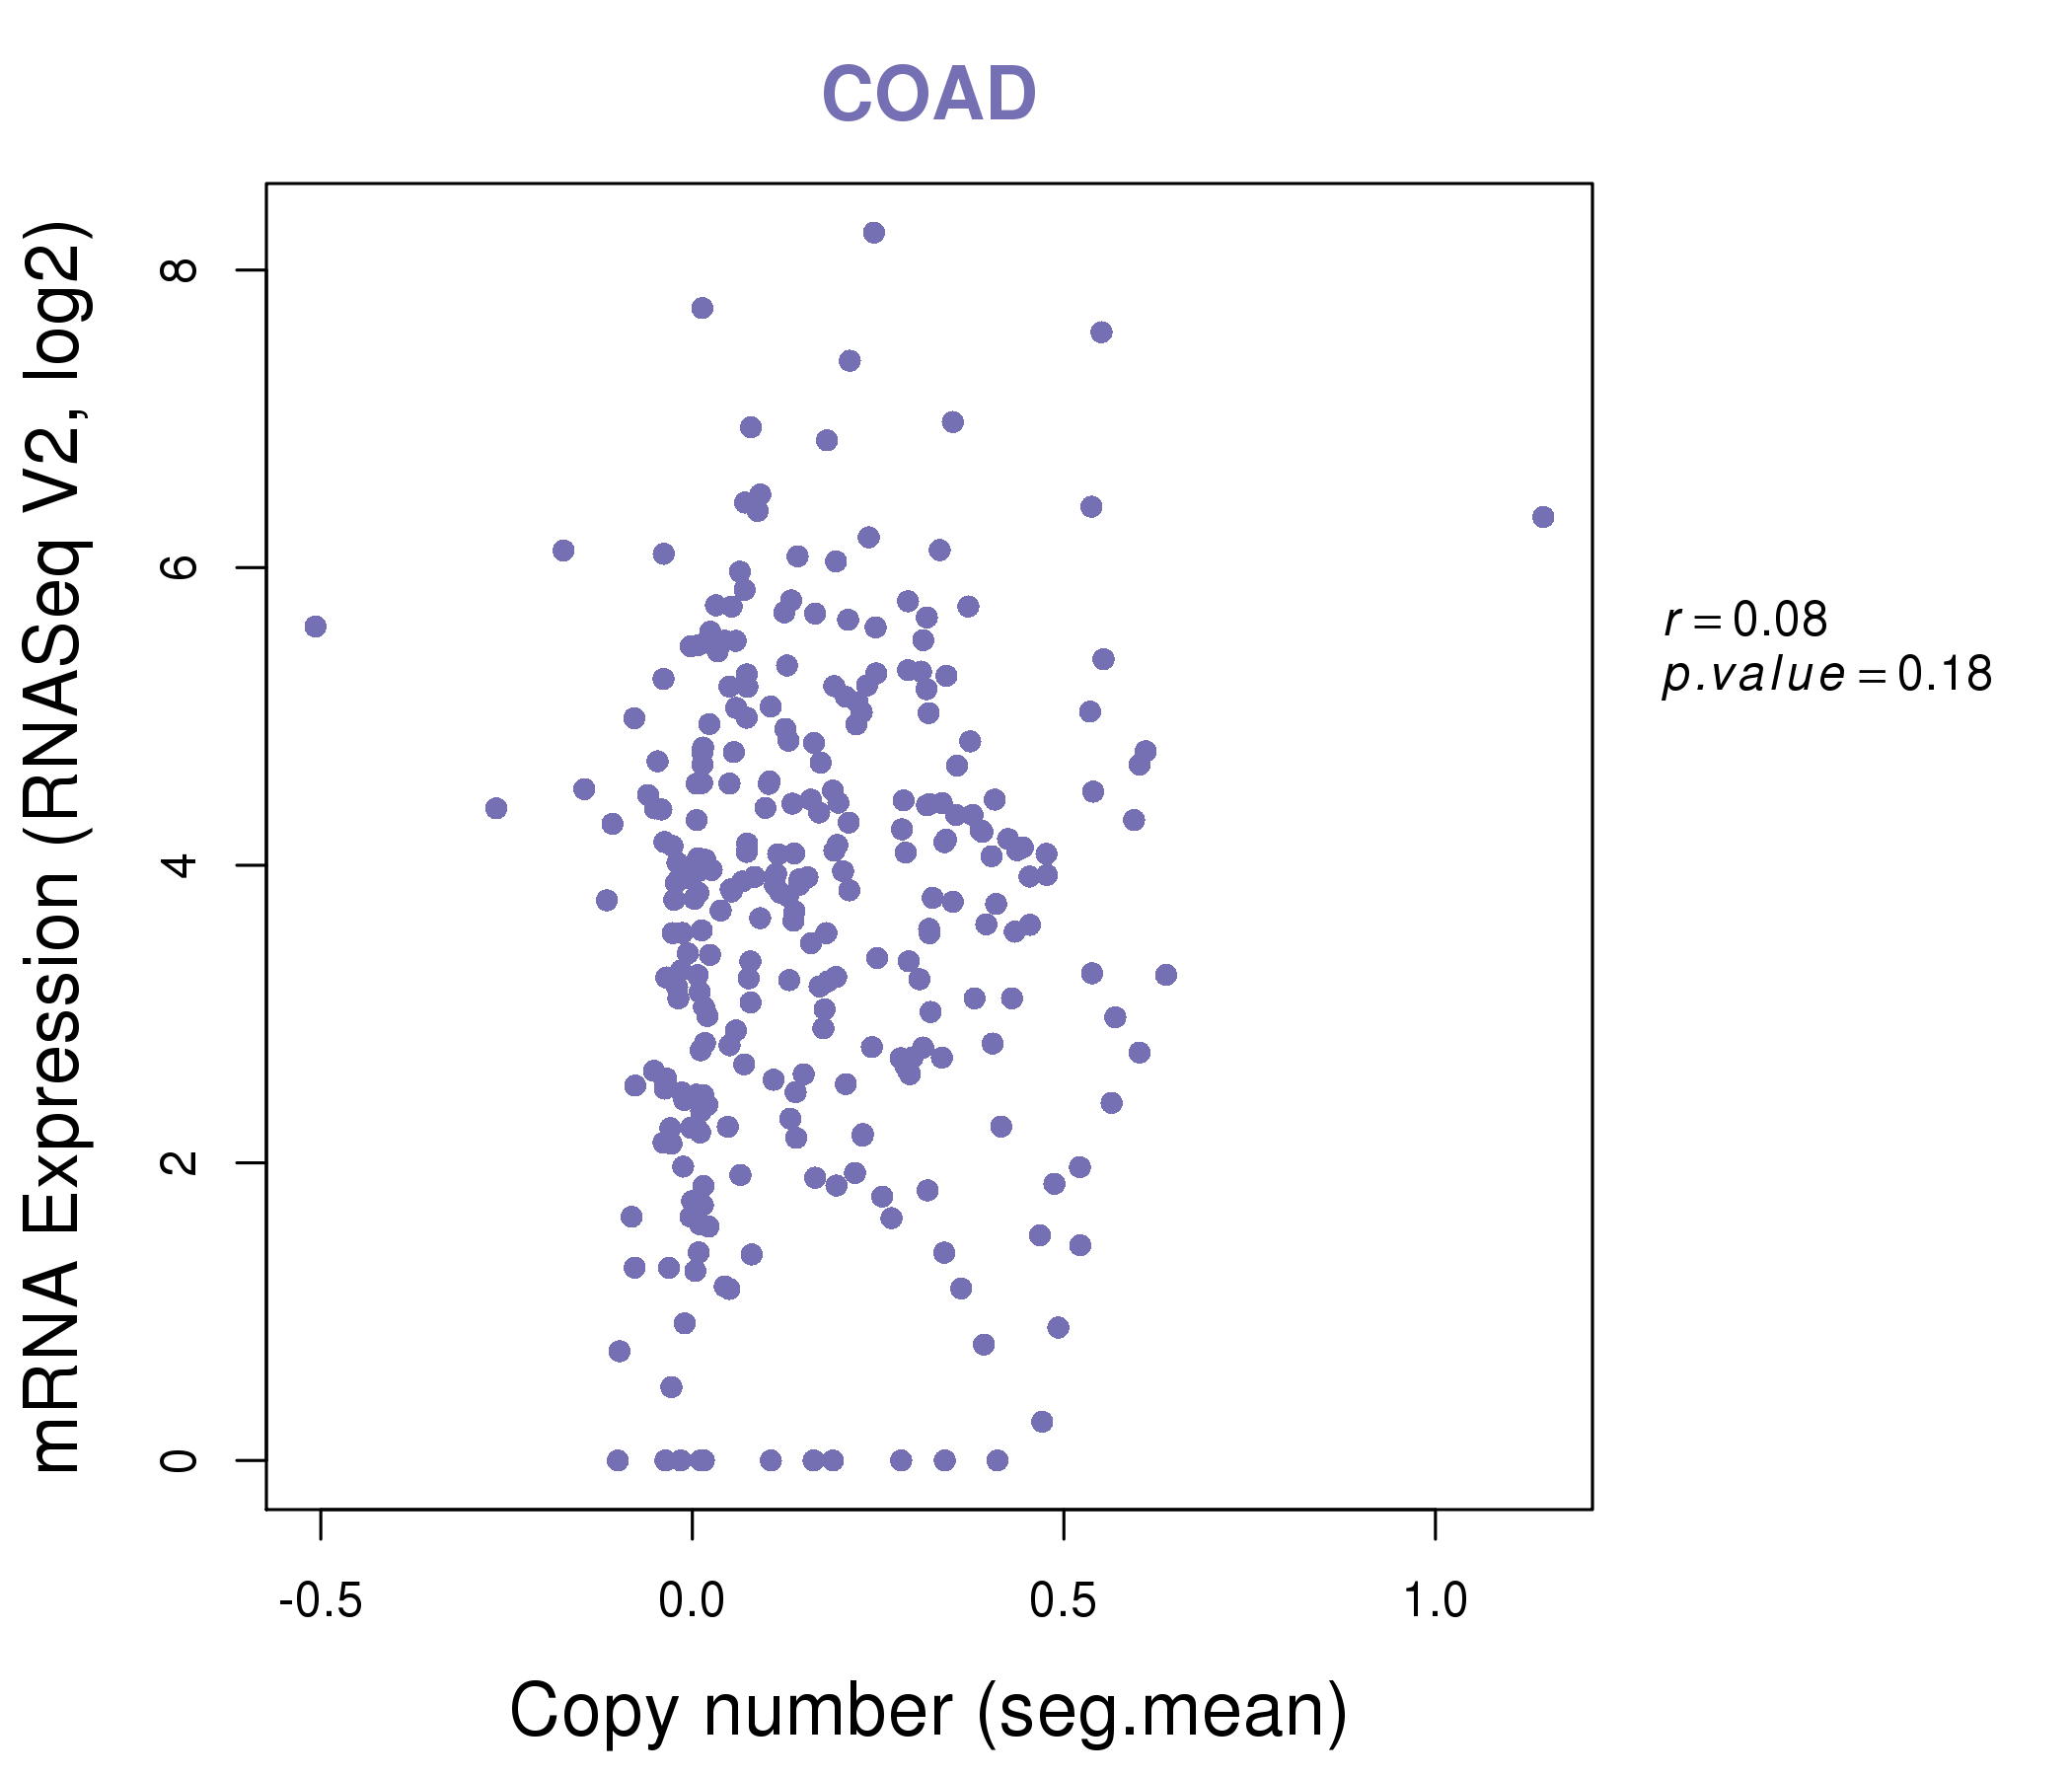
| * This plots show the correlation between CNV and gene expression. |
: Open all plots for all cancer types
 |
|
 |
|
| Top |
| Gene-Gene Network Information |
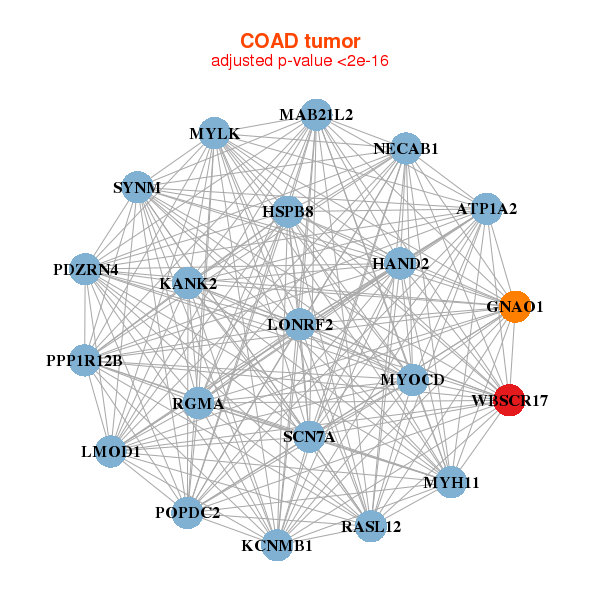
| * Co-Expression network figures were drawn using R package igraph. Only the top 20 genes with the highest correlations were shown. Red circle: input gene, orange circle: cell metabolism gene, sky circle: other gene |
: Open all plots for all cancer types
 |
|
| ACAN,CAPN2,CSPG4,EXTL1,FAM19A3,HCN1,JPH2, KCNG1,MFGE8,OR11H4,PADI2,PGM5P2,PMP2,PTPN14, RLBP1,SLC15A1,SOX6,SPINT4,TRPV4,WBSCR17,ZBTB32 | CD276,CERCAM,CNPY4,COL1A1,COL1A2,COL3A1,COL5A1, COL6A2,EMILIN2,ISLR,KCNB2,MRC2,NGF,OAF, PCOLCE,PRRX2,RCN3,SPON2,THY1,WBSCR17,WNT2 |
 |
|
| ATP1A2,GNAO1,HAND2,HSPB8,KANK2,KCNMB1,LMOD1, LONRF2,MAB21L2,MYH11,MYLK,MYOCD,NECAB1,PDZRN4, POPDC2,PPP1R12B,RASL12,RGMA,SCN7A,SYNM,WBSCR17 | ARHGAP6,C20orf194,CAP2,COPZ2,DENND5A,FBXL2,GNAZ, JAZF1,KIAA1462,LOC100128239,MAP6,HAND2-AS1,PBX3,RILPL1, SCN7A,STX2,TMOD1,TTC7B,TUBG2,WBSCR17,ZBTB47 |

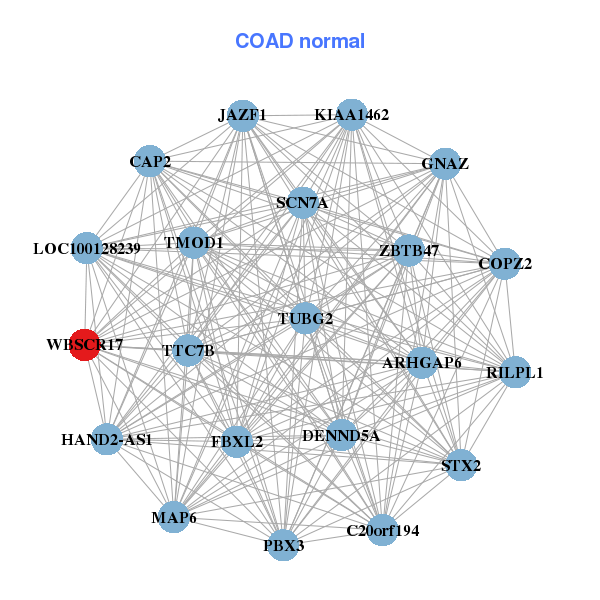
| * Co-Expression network figures were drawn using R package igraph. Only the top 20 genes with the highest correlations were shown. Red circle: input gene, orange circle: cell metabolism gene, sky circle: other gene |
: Open all plots for all cancer types
| Top |
: Open all interacting genes' information including KEGG pathway for all interacting genes from DAVID
| Top |
| Pharmacological Information for WBSCR17 |
| There's no related Drug. |
| Top |
| Cross referenced IDs for WBSCR17 |
| * We obtained these cross-references from Uniprot database. It covers 150 different DBs, 18 categories. http://www.uniprot.org/help/cross_references_section |
: Open all cross reference information
|
Copyright © 2016-Present - The Univsersity of Texas Health Science Center at Houston @ |