|
||||||||||||||||||||||||||||||||||||||||||||||||||||||||||||||||||||||||||||||||||||||||||||||||||||||||||||||||||||||||||||||||||||||||||||||||||||||||||||||||||||||||||||||||||||||||||||||||||||||||||||||||||||||||||||||||||||||||||||||||||||||||||||||||||||||||||||||||||||||||||||||||||||||||||||||||||||||||||
| |
| Phenotypic Information (metabolism pathway, cancer, disease, phenome) |
| |
| |
| Gene-Gene Network Information: Co-Expression Network, Interacting Genes & KEGG |
| |
|


| Gene Summary for POLR1E |
| Basic gene info. | Gene symbol | POLR1E |
| Gene name | polymerase (RNA) I polypeptide E, 53kDa | |
| Synonyms | PAF53|PRAF1 | |
| Cytomap | UCSC genome browser: 9p13.2 | |
| Genomic location | chr9 :37485944-37503693 | |
| Type of gene | protein-coding | |
| RefGenes | NM_001282766.1, NM_022490.2, | |
| Ensembl id | ENSG00000137054 | |
| Description | DNA-directed RNA polymerase I subunit EDNA-directed RNA polymerase I subunit RPA49RNA polymerase I subunit A49RNA polymerase I-associated factor 53polymerase (RNA) I associated factor 1 | |
| Modification date | 20141207 | |
| dbXrefs | HGNC : HGNC | |
| Ensembl : ENSG00000137054 | ||
| HPRD : 15096 | ||
| Vega : OTTHUMG00000019920 | ||
| Protein | UniProt: Q9GZS1 go to UniProt's Cross Reference DB Table | |
| Expression | CleanEX: HS_POLR1E | |
| BioGPS: 64425 | ||
| Gene Expression Atlas: ENSG00000137054 | ||
| The Human Protein Atlas: ENSG00000137054 | ||
| Pathway | NCI Pathway Interaction Database: POLR1E | |
| KEGG: POLR1E | ||
| REACTOME: POLR1E | ||
| ConsensusPathDB | ||
| Pathway Commons: POLR1E | ||
| Metabolism | MetaCyc: POLR1E | |
| HUMANCyc: POLR1E | ||
| Regulation | Ensembl's Regulation: ENSG00000137054 | |
| miRBase: chr9 :37,485,944-37,503,693 | ||
| TargetScan: NM_001282766 | ||
| cisRED: ENSG00000137054 | ||
| Context | iHOP: POLR1E | |
| cancer metabolism search in PubMed: POLR1E | ||
| UCL Cancer Institute: POLR1E | ||
| Assigned class in ccmGDB | B - This gene belongs to cancer gene. | |
| Top |
| Phenotypic Information for POLR1E(metabolism pathway, cancer, disease, phenome) |
| Cancer | CGAP: POLR1E |
| Familial Cancer Database: POLR1E | |
| * This gene is included in those cancer gene databases. |
|
|
|
|
|
| . | ||||||||||||||||||||||||||||||||||||||||||||||||||||||||||||||||||||||||||||||||||||||||||||||||||||||||||||||||||||||||||||||||||||||||||||||||||||||||||||||||||||||||||||||||||||||||||||||||||||||||||||||||||||||||||||||||||||||||||||||||||||||||||||||||||||||||||||||||||||||||||||||||||||||||||||||||||||
Oncogene 1 | Significant driver gene in | |||||||||||||||||||||||||||||||||||||||||||||||||||||||||||||||||||||||||||||||||||||||||||||||||||||||||||||||||||||||||||||||||||||||||||||||||||||||||||||||||||||||||||||||||||||||||||||||||||||||||||||||||||||||||||||||||||||||||||||||||||||||||||||||||||||||||||||||||||||||||||||||||||||||||||||||||||||||||
| cf) number; DB name 1 Oncogene; http://nar.oxfordjournals.org/content/35/suppl_1/D721.long, 2 Tumor Suppressor gene; https://bioinfo.uth.edu/TSGene/, 3 Cancer Gene Census; http://www.nature.com/nrc/journal/v4/n3/abs/nrc1299.html, 4 CancerGenes; http://nar.oxfordjournals.org/content/35/suppl_1/D721.long, 5 Network of Cancer Gene; http://ncg.kcl.ac.uk/index.php, 1Therapeutic Vulnerabilities in Cancer; http://cbio.mskcc.org/cancergenomics/statius/ |
| KEGG_PURINE_METABOLISM KEGG_PYRIMIDINE_METABOLISM | |
| OMIM | |
| Orphanet | |
| Disease | KEGG Disease: POLR1E |
| MedGen: POLR1E (Human Medical Genetics with Condition) | |
| ClinVar: POLR1E | |
| Phenotype | MGI: POLR1E (International Mouse Phenotyping Consortium) |
| PhenomicDB: POLR1E | |
| Mutations for POLR1E |
| * Under tables are showing count per each tissue to give us broad intuition about tissue specific mutation patterns.You can go to the detailed page for each mutation database's web site. |
| There's no structural variation information in COSMIC data for this gene. |
| * From mRNA Sanger sequences, Chitars2.0 arranged chimeric transcripts. This table shows POLR1E related fusion information. |
| ID | Head Gene | Tail Gene | Accession | Gene_a | qStart_a | qEnd_a | Chromosome_a | tStart_a | tEnd_a | Gene_a | qStart_a | qEnd_a | Chromosome_a | tStart_a | tEnd_a |
| Top |
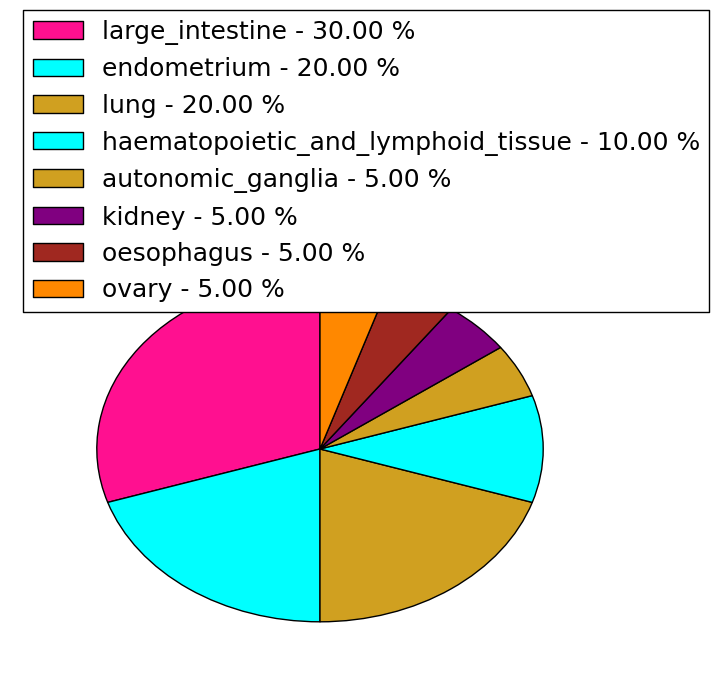
| Mutation type/ Tissue ID | brca | cns | cerv | endome | haematopo | kidn | Lintest | liver | lung | ns | ovary | pancre | prost | skin | stoma | thyro | urina | |||
| Total # sample | 1 | |||||||||||||||||||
| GAIN (# sample) | ||||||||||||||||||||
| LOSS (# sample) | 1 |
| cf) Tissue ID; Tissue type (1; Breast, 2; Central_nervous_system, 3; Cervix, 4; Endometrium, 5; Haematopoietic_and_lymphoid_tissue, 6; Kidney, 7; Large_intestine, 8; Liver, 9; Lung, 10; NS, 11; Ovary, 12; Pancreas, 13; Prostate, 14; Skin, 15; Stomach, 16; Thyroid, 17; Urinary_tract) |
| Top |
|
 |
| Top |
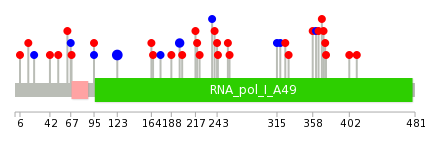
| Stat. for Non-Synonymous SNVs (# total SNVs=20) | (# total SNVs=10) |
 |  |
(# total SNVs=0) | (# total SNVs=0) |
| Top |
| * When you move the cursor on each content, you can see more deailed mutation information on the Tooltip. Those are primary_site,primary_histology,mutation(aa),pubmedID. |
| GRCh37 position | Mutation(aa) | Unique sampleID count |
| chr9:37492679-37492679 | p.A123A | 4 |
| chr9:37495212-37495212 | p.L198L | 2 |
| chr9:37495950-37495950 | p.S240L | 1 |
| chr9:37501827-37501827 | p.K362K | 1 |
| chr9:37486690-37486690 | p.? | 1 |
| chr9:37493645-37493645 | p.L164F | 1 |
| chr9:37495958-37495958 | p.I243V | 1 |
| chr9:37501836-37501836 | p.E365D | 1 |
| chr9:37486692-37486692 | p.? | 1 |
| chr9:37493650-37493650 | p.R166H | 1 |
| Top |
|
 |
| Point Mutation/ Tissue ID | 1 | 2 | 3 | 4 | 5 | 6 | 7 | 8 | 9 | 10 | 11 | 12 | 13 | 14 | 15 | 16 | 17 | 18 | 19 | 20 |
| # sample | 1 | 7 | 2 | 3 | 1 | 1 | 4 | 5 | ||||||||||||
| # mutation | 1 | 5 | 2 | 3 | 1 | 1 | 4 | 5 | ||||||||||||
| nonsynonymous SNV | 1 | 3 | 1 | 1 | 1 | 3 | 4 | |||||||||||||
| synonymous SNV | 2 | 1 | 2 | 1 | 1 | 1 |
| cf) Tissue ID; Tissue type (1; BLCA[Bladder Urothelial Carcinoma], 2; BRCA[Breast invasive carcinoma], 3; CESC[Cervical squamous cell carcinoma and endocervical adenocarcinoma], 4; COAD[Colon adenocarcinoma], 5; GBM[Glioblastoma multiforme], 6; Glioma Low Grade, 7; HNSC[Head and Neck squamous cell carcinoma], 8; KICH[Kidney Chromophobe], 9; KIRC[Kidney renal clear cell carcinoma], 10; KIRP[Kidney renal papillary cell carcinoma], 11; LAML[Acute Myeloid Leukemia], 12; LUAD[Lung adenocarcinoma], 13; LUSC[Lung squamous cell carcinoma], 14; OV[Ovarian serous cystadenocarcinoma ], 15; PAAD[Pancreatic adenocarcinoma], 16; PRAD[Prostate adenocarcinoma], 17; SKCM[Skin Cutaneous Melanoma], 18:STAD[Stomach adenocarcinoma], 19:THCA[Thyroid carcinoma], 20:UCEC[Uterine Corpus Endometrial Carcinoma]) |
| Top |
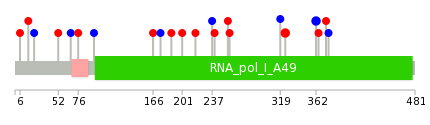
| * We represented just top 10 SNVs. When you move the cursor on each content, you can see more deailed mutation information on the Tooltip. Those are primary_site, primary_histology, mutation(aa), pubmedID. |
| Genomic Position | Mutation(aa) | Unique sampleID count |
| chr9:37501715 | p.R325Q,POLR1E | 2 |
| chr9:37501827 | p.K362K,POLR1E | 2 |
| chr9:37486777 | p.E365D,POLR1E | 1 |
| chr9:37498102 | p.P52S | 1 |
| chr9:37487880 | p.A374P,POLR1E | 1 |
| chr9:37498107 | p.L67L | 1 |
| chr9:37487905 | p.L377L,POLR1E | 1 |
| chr9:37500907 | p.T76S | 1 |
| chr9:37489339 | p.T95T | 1 |
| chr9:37493650 | p.R166H,POLR1E | 1 |
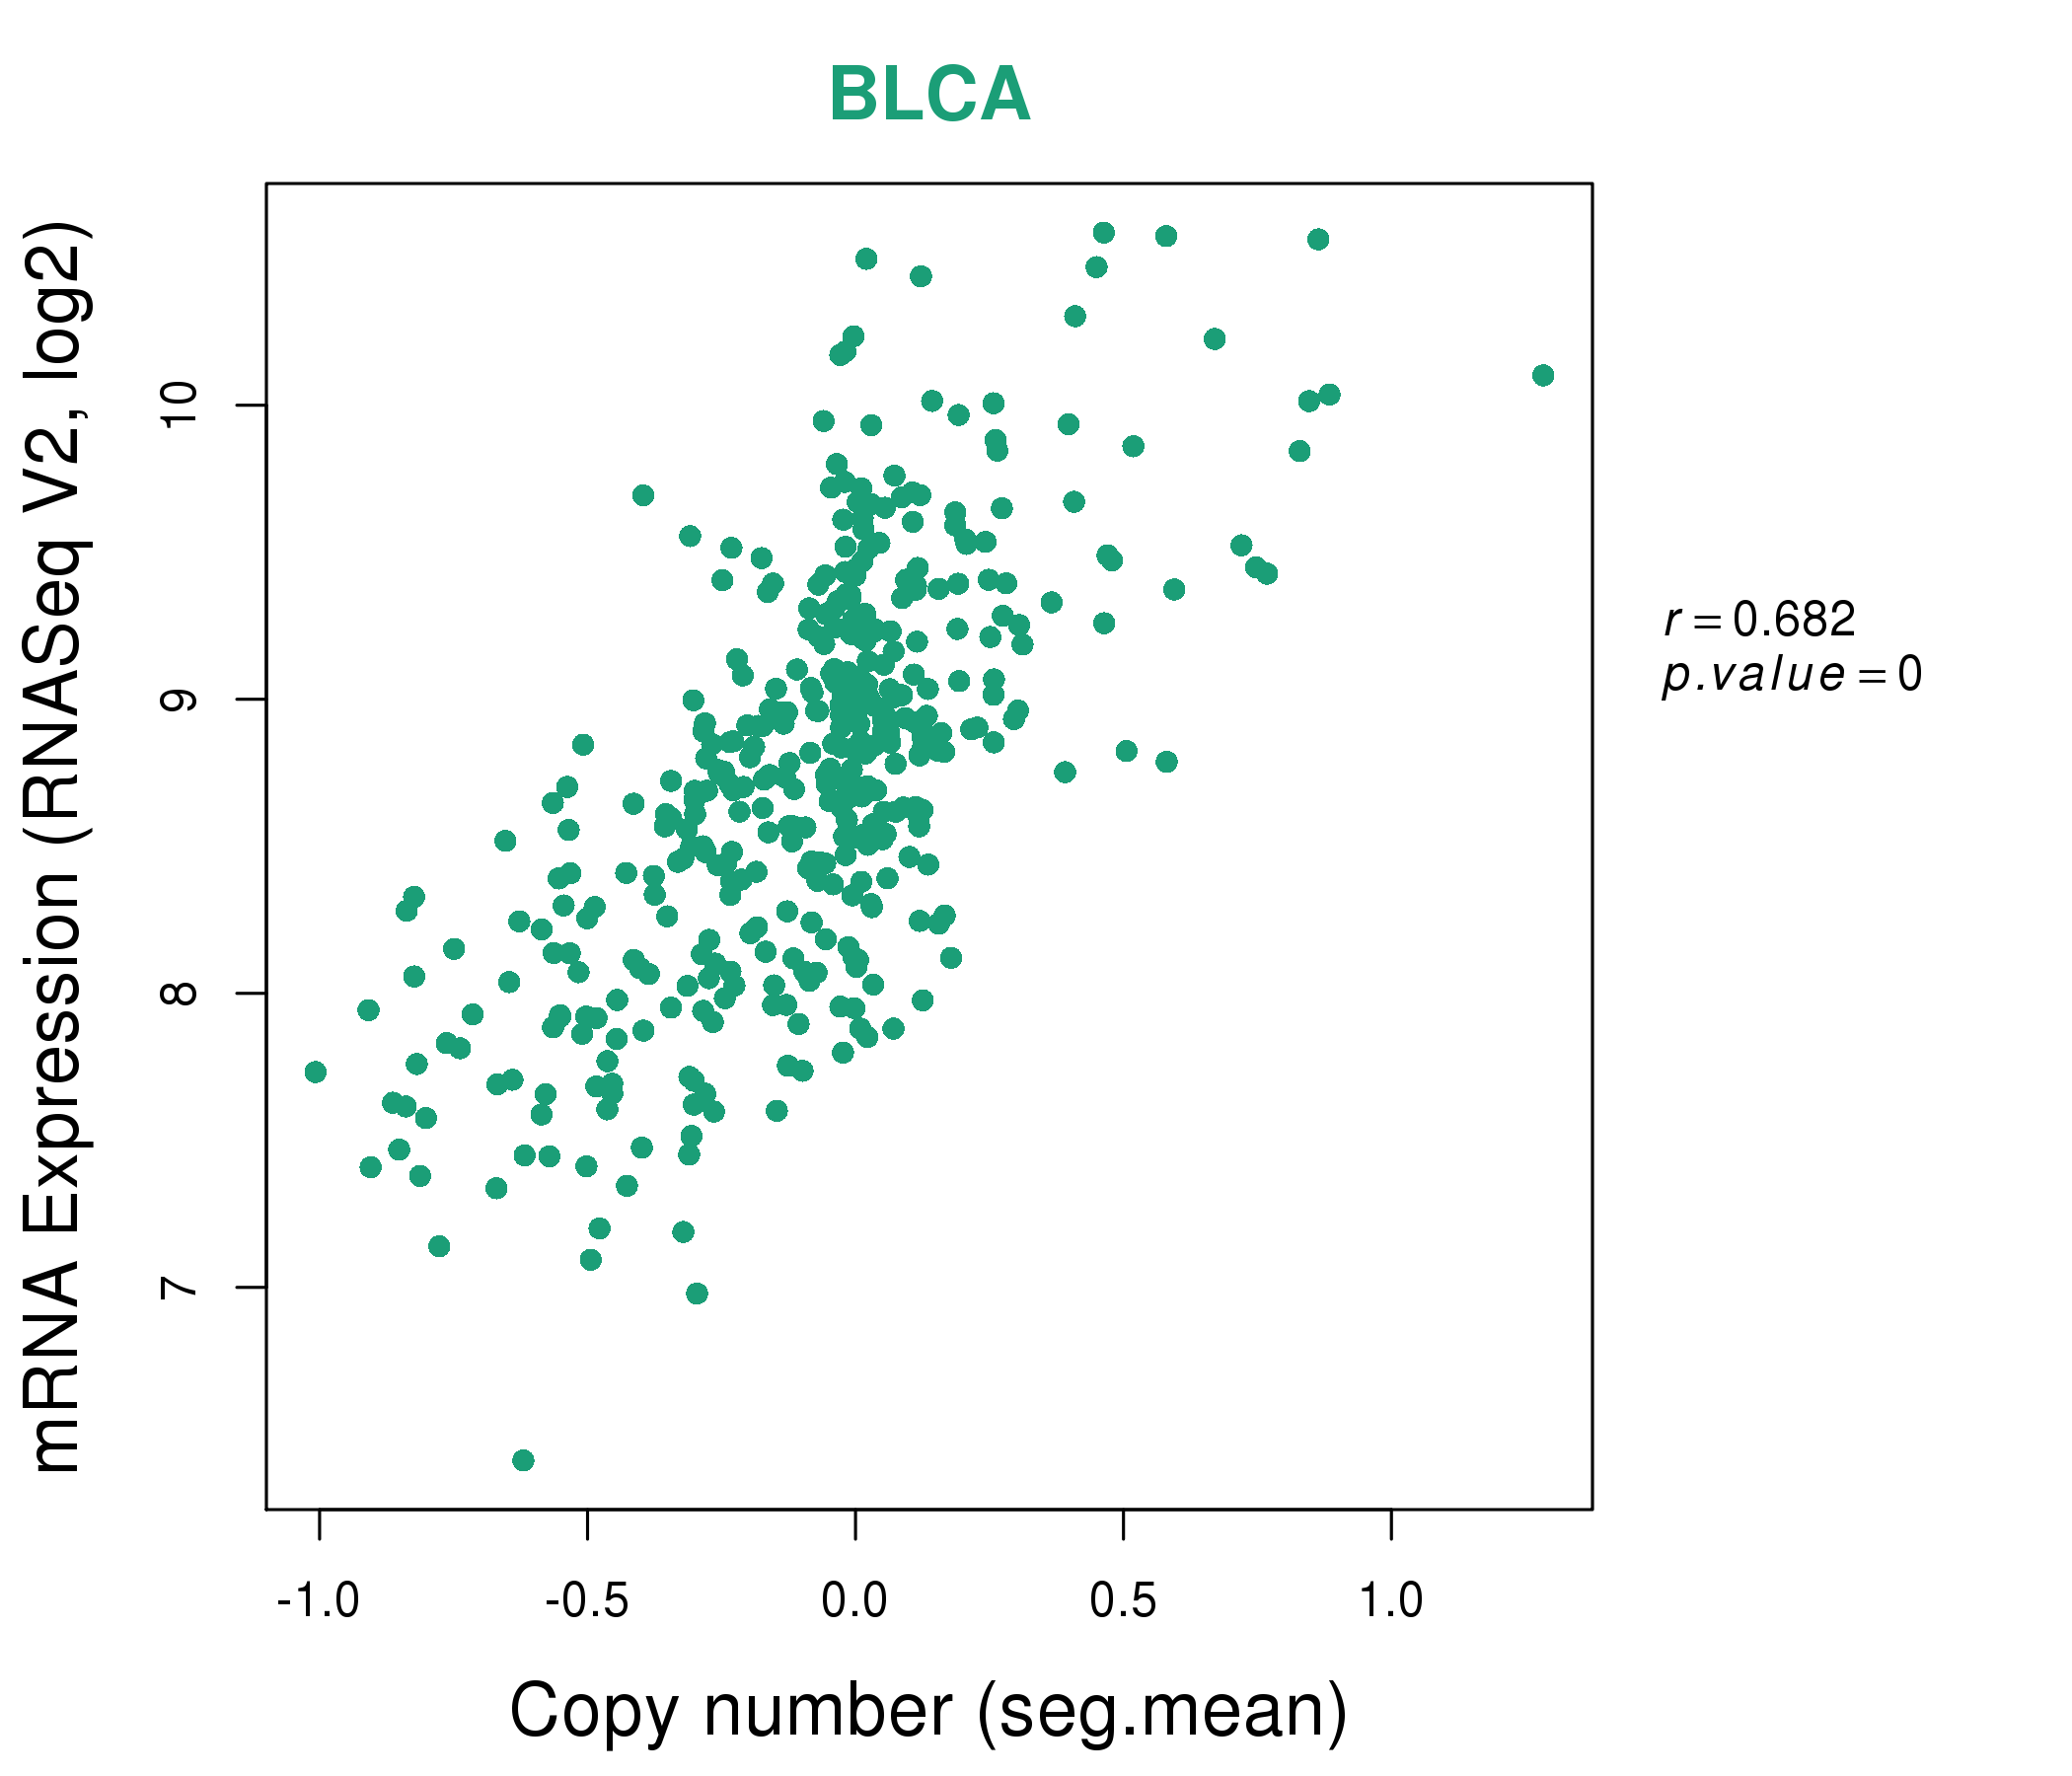
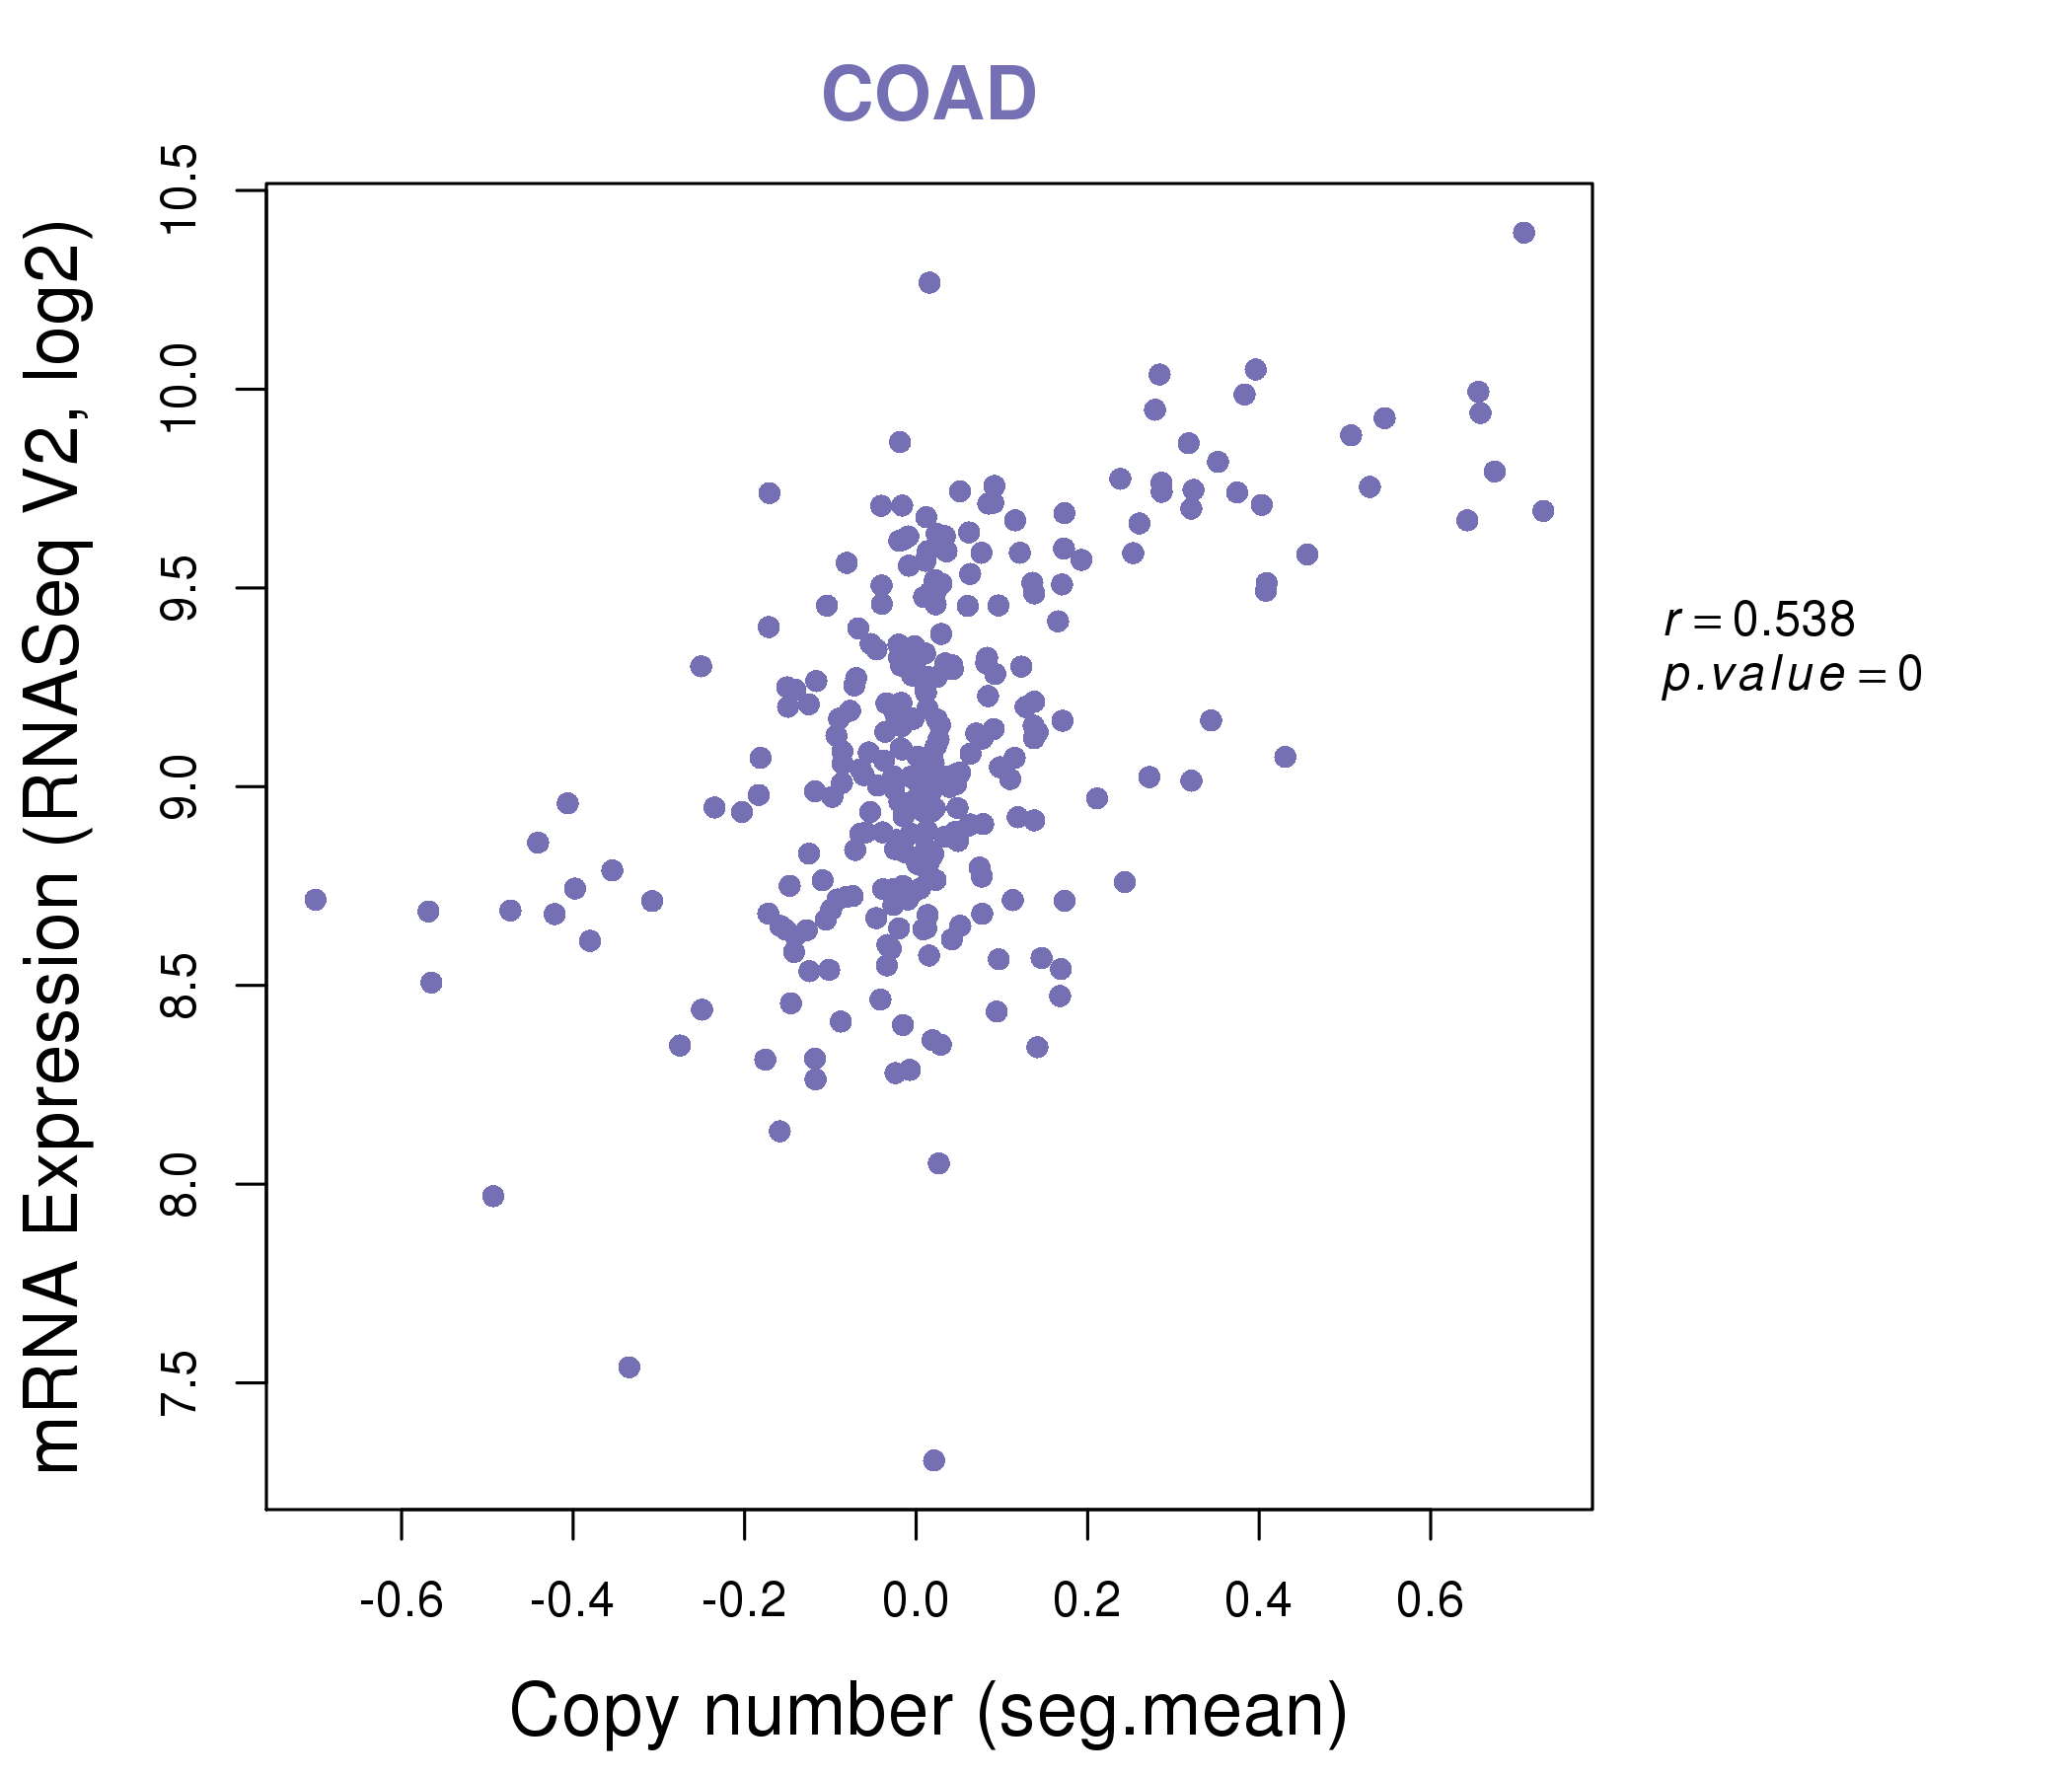
| * Copy number data were extracted from TCGA using R package TCGA-Assembler. The URLs of all public data files on TCGA DCC data server were gathered on Jan-05-2015. Function ProcessCNAData in TCGA-Assembler package was used to obtain gene-level copy number value which is calculated as the average copy number of the genomic region of a gene. |
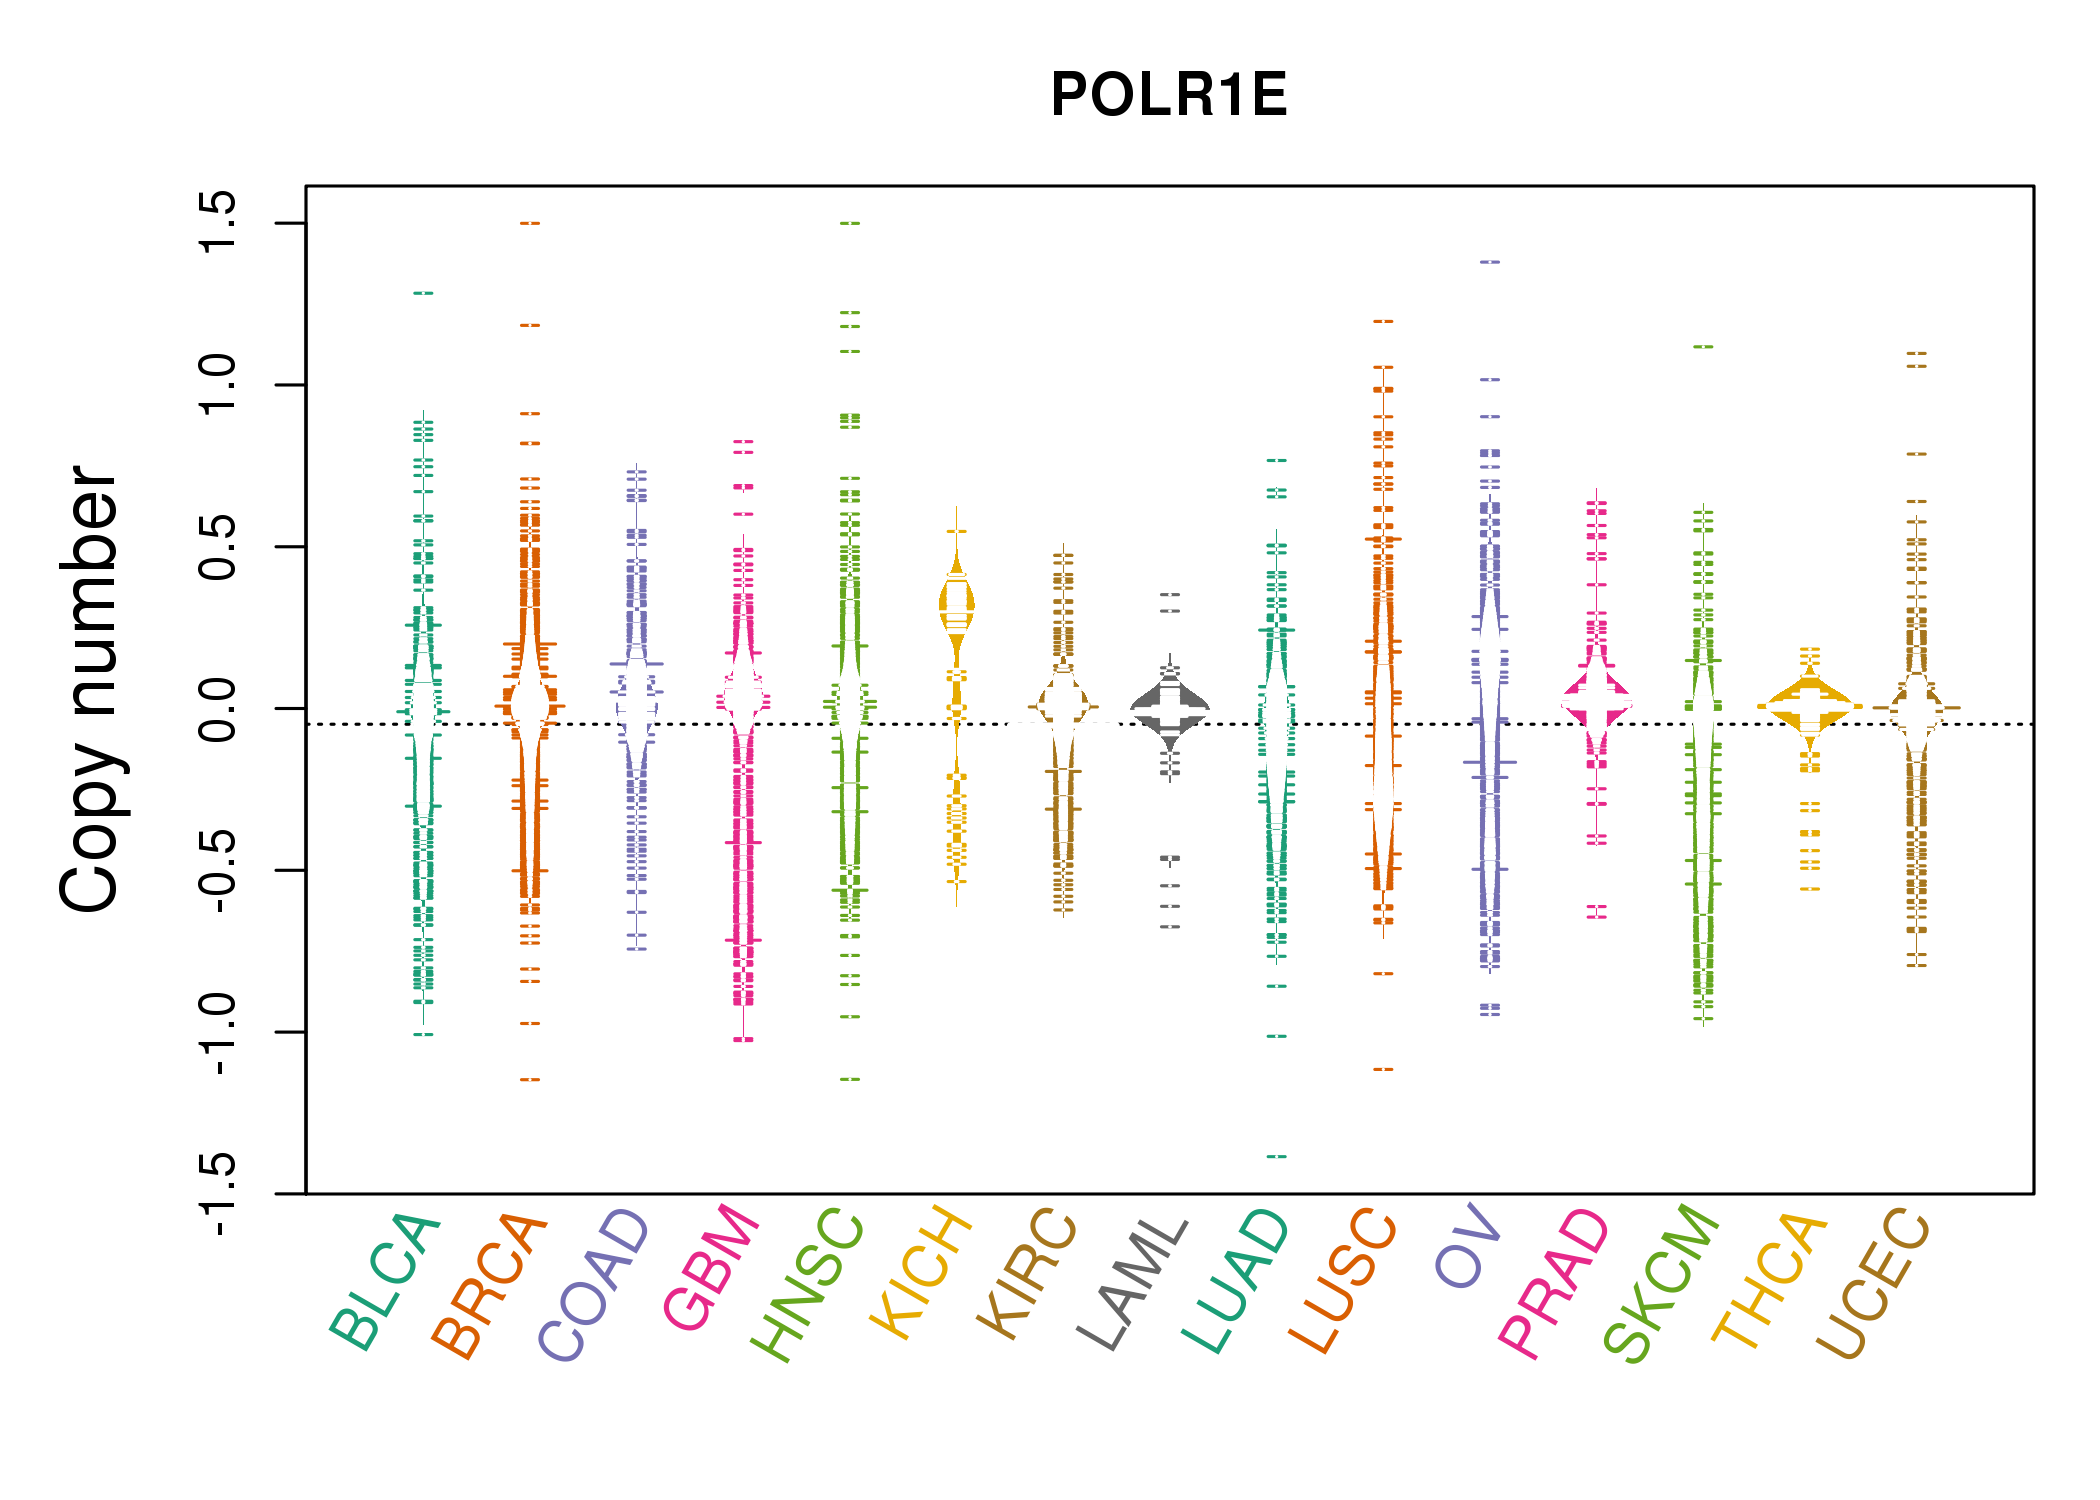 |
| cf) Tissue ID[Tissue type]: BLCA[Bladder Urothelial Carcinoma], BRCA[Breast invasive carcinoma], CESC[Cervical squamous cell carcinoma and endocervical adenocarcinoma], COAD[Colon adenocarcinoma], GBM[Glioblastoma multiforme], Glioma Low Grade, HNSC[Head and Neck squamous cell carcinoma], KICH[Kidney Chromophobe], KIRC[Kidney renal clear cell carcinoma], KIRP[Kidney renal papillary cell carcinoma], LAML[Acute Myeloid Leukemia], LUAD[Lung adenocarcinoma], LUSC[Lung squamous cell carcinoma], OV[Ovarian serous cystadenocarcinoma ], PAAD[Pancreatic adenocarcinoma], PRAD[Prostate adenocarcinoma], SKCM[Skin Cutaneous Melanoma], STAD[Stomach adenocarcinoma], THCA[Thyroid carcinoma], UCEC[Uterine Corpus Endometrial Carcinoma] |
| Top |
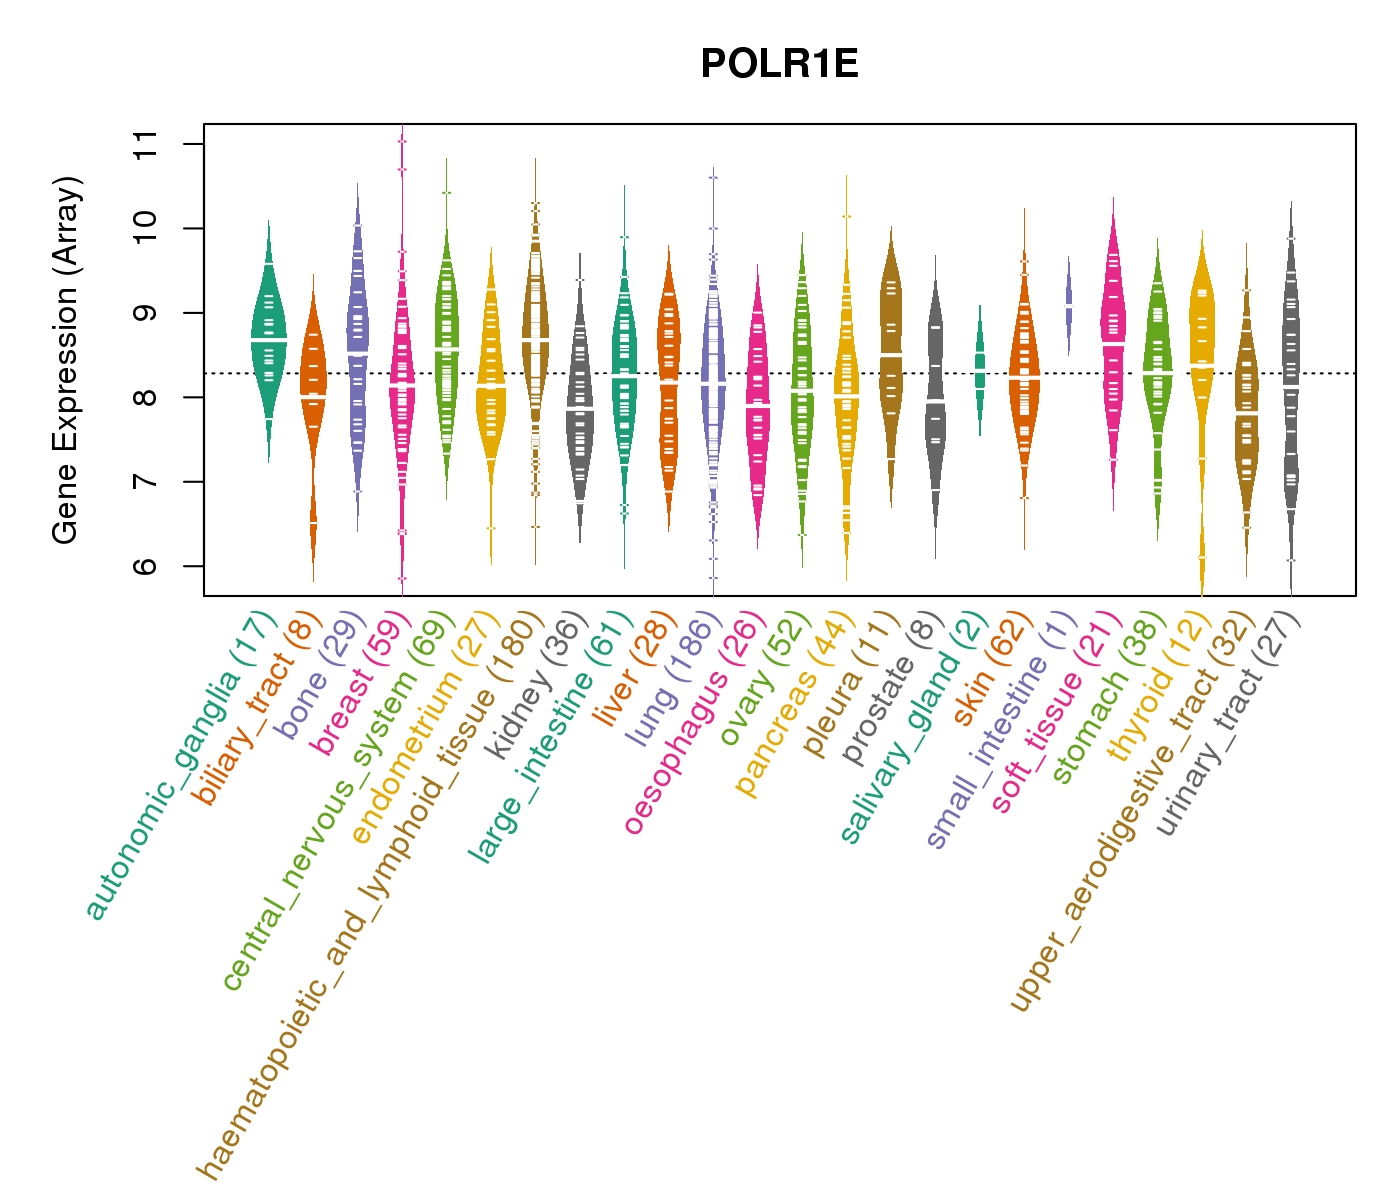
| Gene Expression for POLR1E |
| * CCLE gene expression data were extracted from CCLE_Expression_Entrez_2012-10-18.res: Gene-centric RMA-normalized mRNA expression data. |
 |
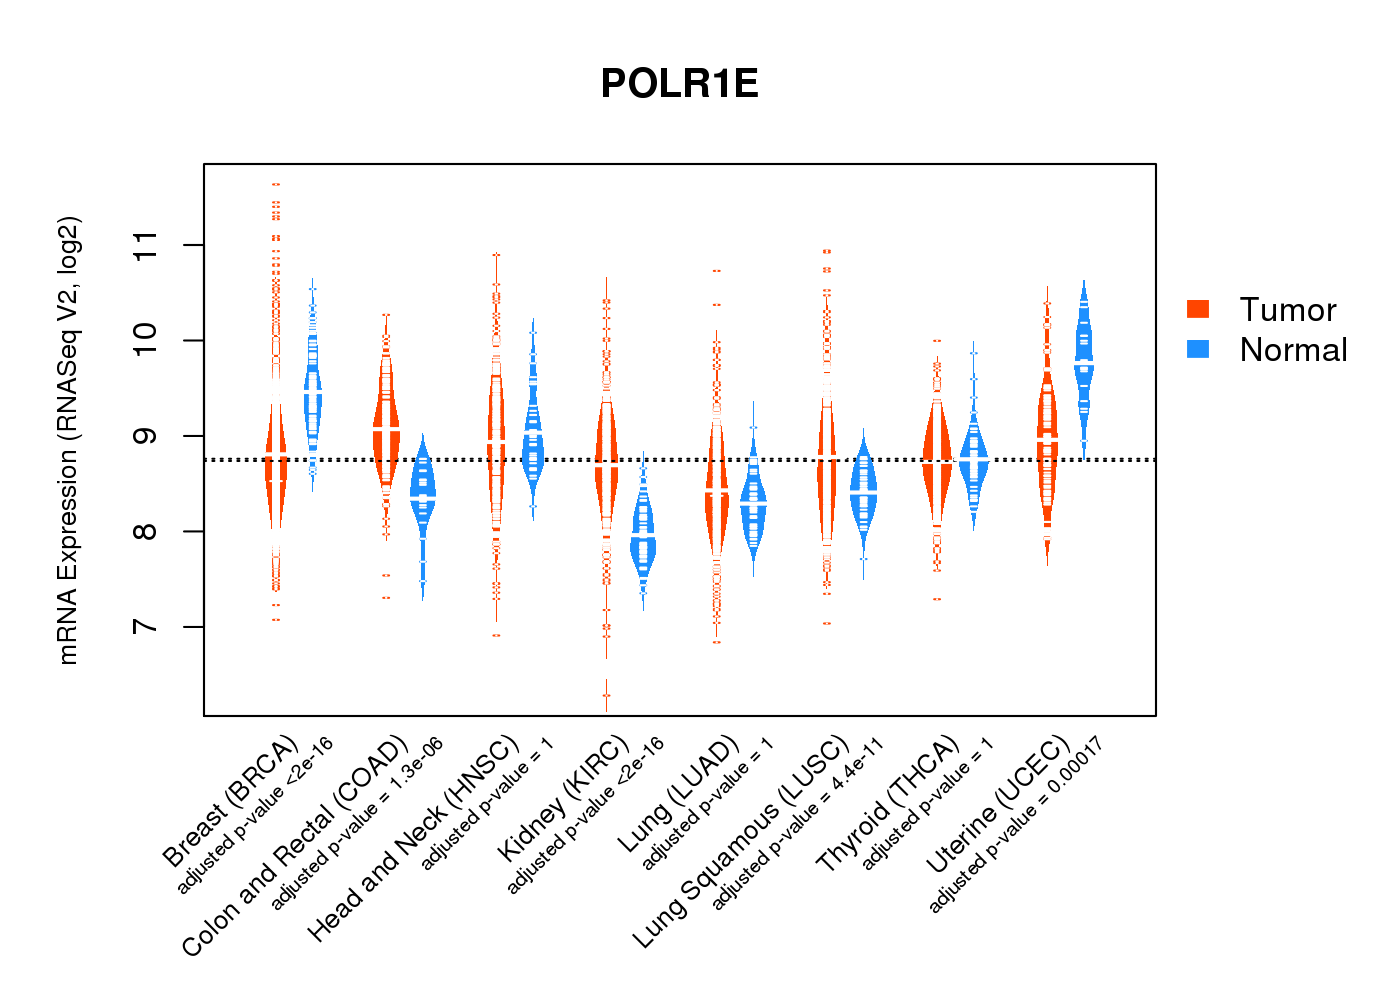
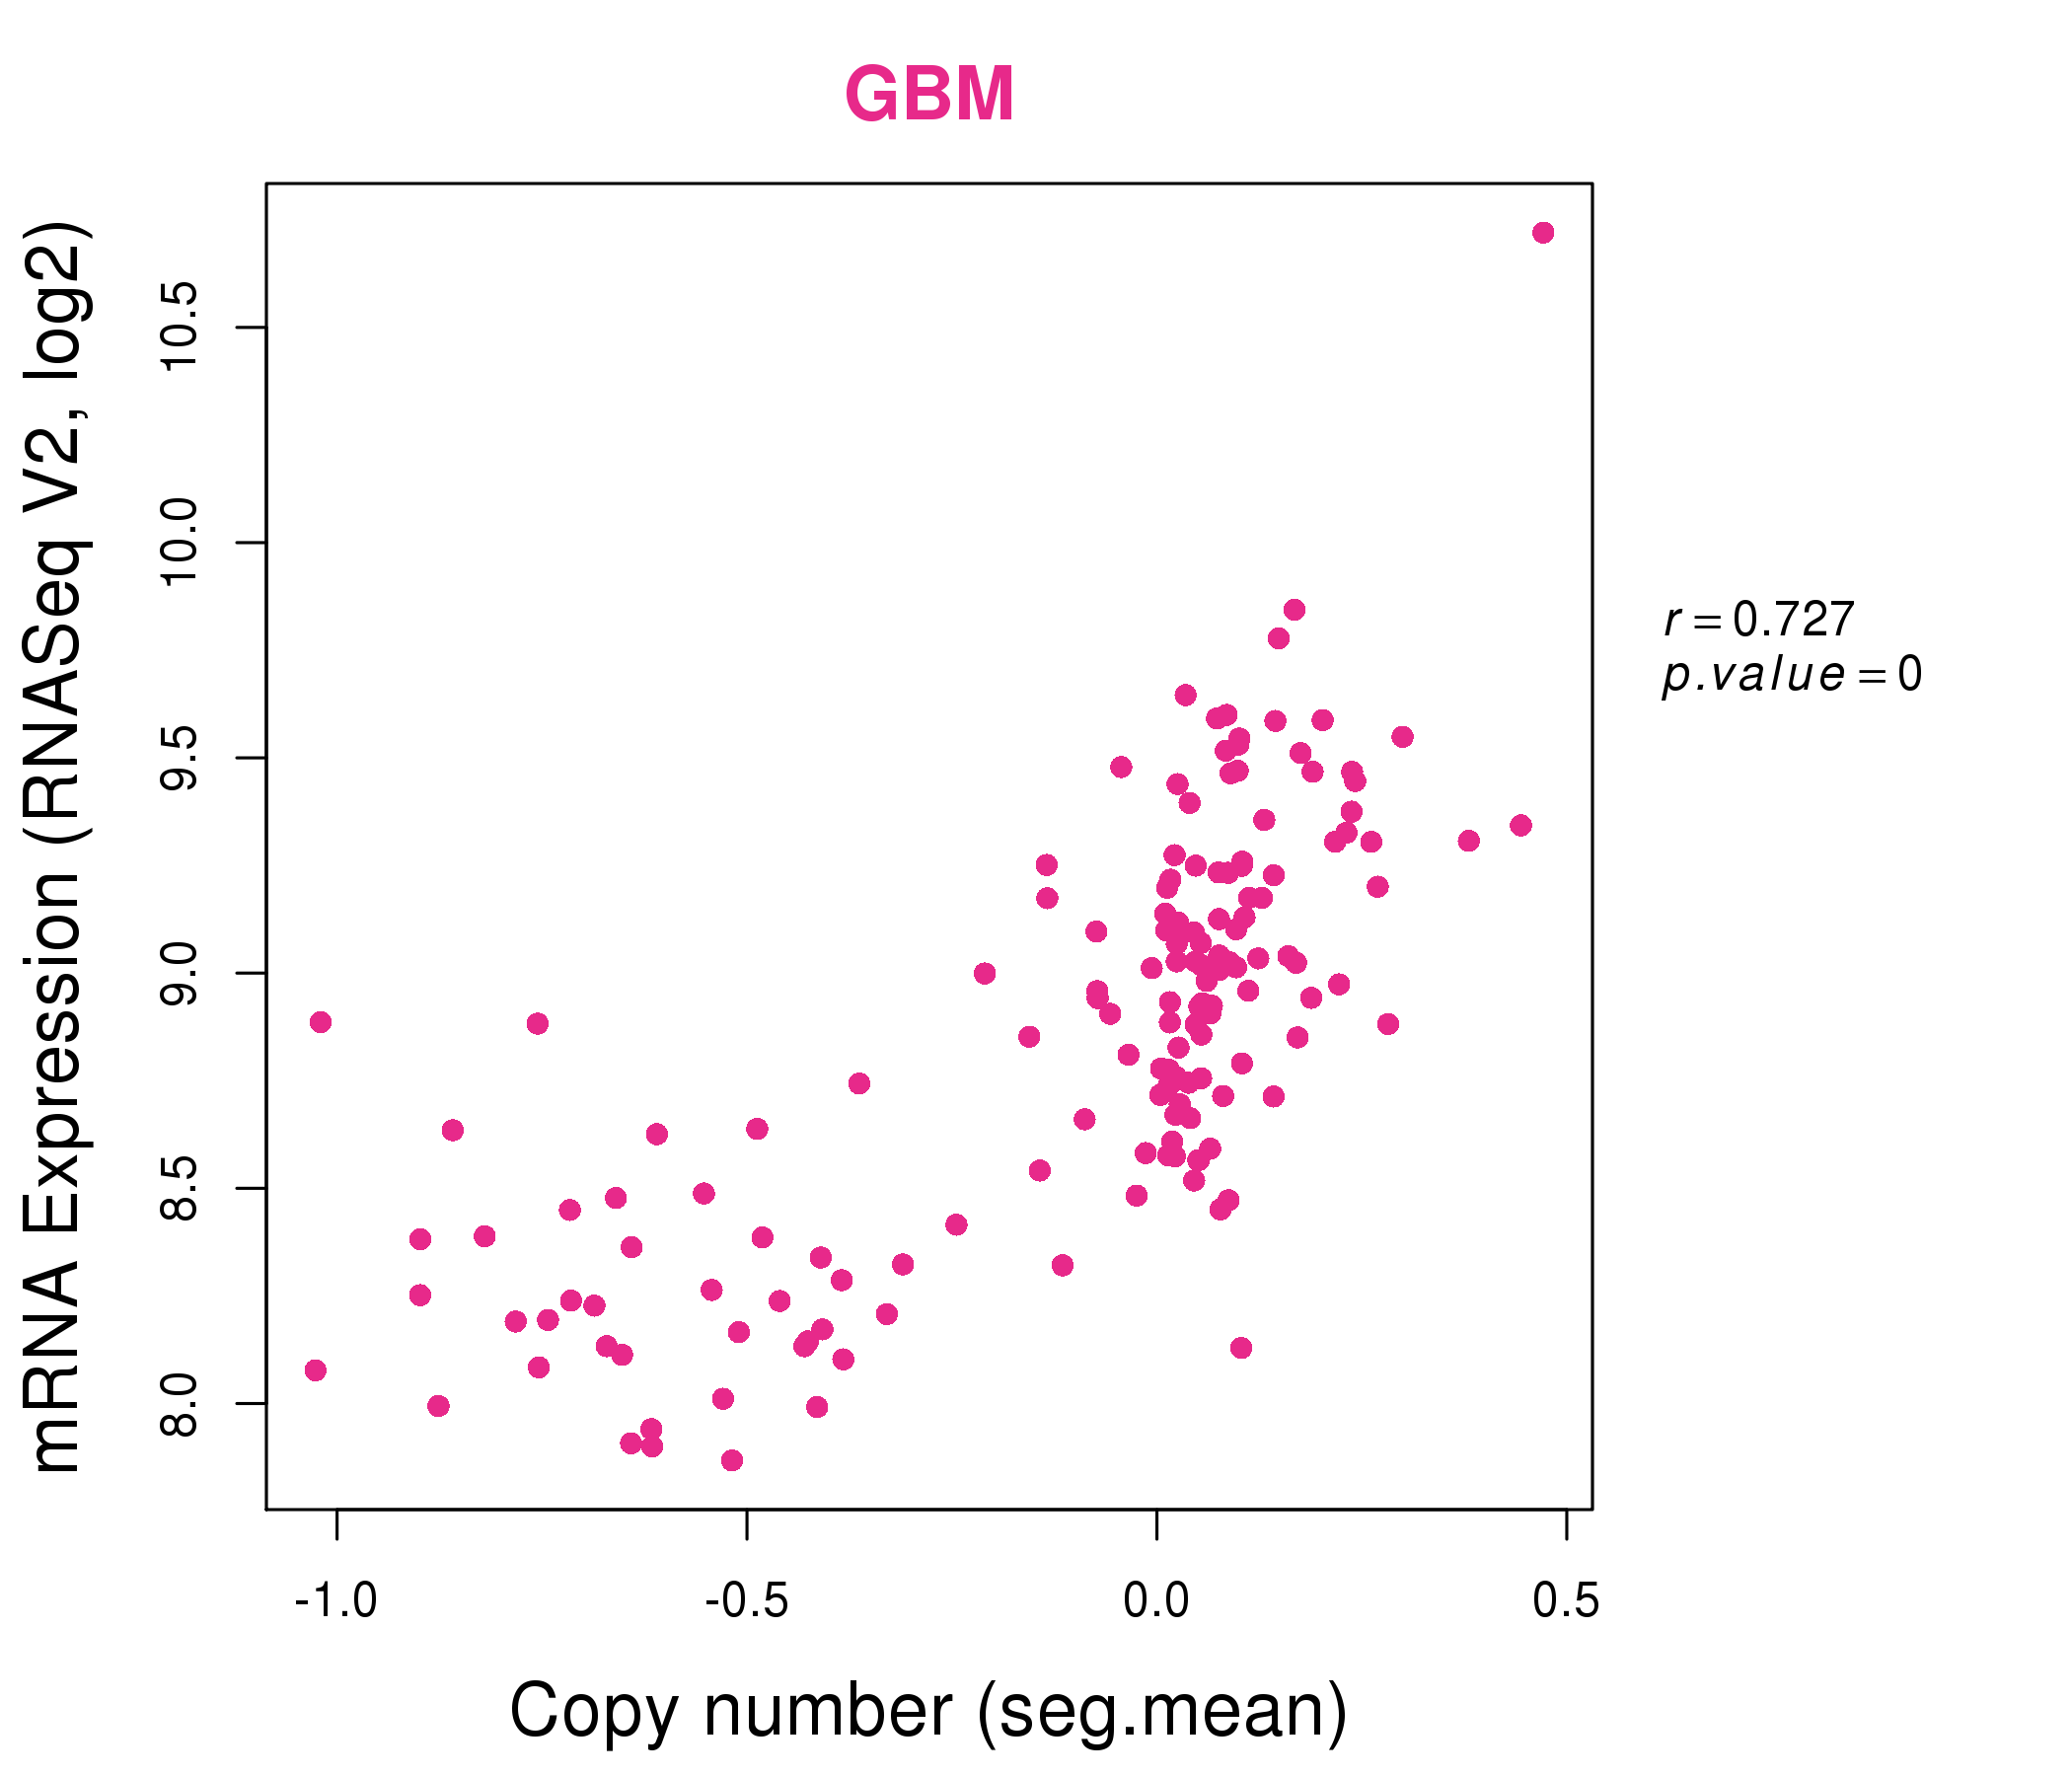
| * Normalized gene expression data of RNASeqV2 was extracted from TCGA using R package TCGA-Assembler. The URLs of all public data files on TCGA DCC data server were gathered at Jan-05-2015. Only eight cancer types have enough normal control samples for differential expression analysis. (t test, adjusted p<0.05 (using Benjamini-Hochberg FDR)) |
 |
| Top |
| * This plots show the correlation between CNV and gene expression. |
: Open all plots for all cancer types
 |
|
 |
|

| Top |
| Gene-Gene Network Information |
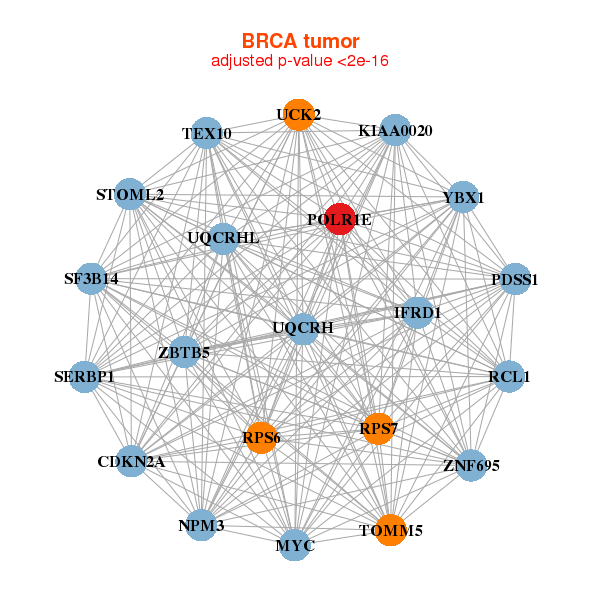
| * Co-Expression network figures were drawn using R package igraph. Only the top 20 genes with the highest correlations were shown. Red circle: input gene, orange circle: cell metabolism gene, sky circle: other gene |
: Open all plots for all cancer types
 |
|
| CDKN2A,IFRD1,KIAA0020,MYC,NPM3,PDSS1,POLR1E, RCL1,RPS6,RPS7,SERBP1,SF3B14,STOML2,TEX10, TOMM5,UCK2,UQCRH,UQCRHL,YBX1,ZBTB5,ZNF695 | ACTR3B,CCNB1IP1,CHKA,CHRM1,DTNB,EIF3D,EIF3L, GNB2L1,IMPDH2,KIAA0020,NACA,EPB41L4A-AS1,NOB1,NONO, NPM1,POLR1E,RPL4,RPL5,RPS18,RPS6,RSL1D1 |
 |
|
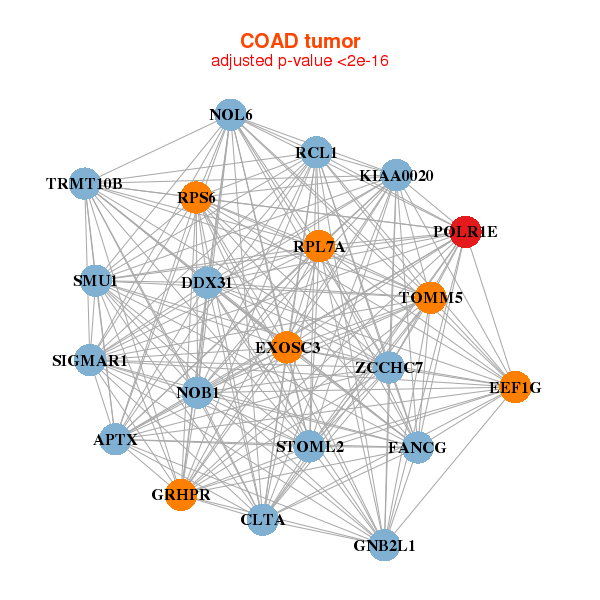
| APTX,CLTA,DDX31,EEF1G,EXOSC3,FANCG,GNB2L1, GRHPR,KIAA0020,NOB1,NOL6,POLR1E,RCL1,TRMT10B, RPL7A,RPS6,SIGMAR1,SMU1,STOML2,TOMM5,ZCCHC7 | ABHD14A,C2orf44,CUEDC2,DDX50,EEF1D,EIF3G,ELP2, FBXO44,IRAK1BP1,LOC158572,LZTFL1,NAP1L1,POLR1E,RBMX2, RPL12,RPL4,TCTN1,TMEM123,ZC3HC1,ZNF496,ZZZ3 |

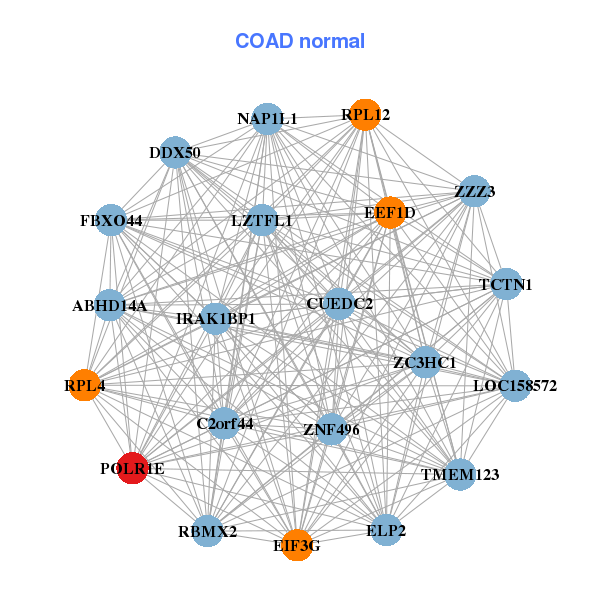
| * Co-Expression network figures were drawn using R package igraph. Only the top 20 genes with the highest correlations were shown. Red circle: input gene, orange circle: cell metabolism gene, sky circle: other gene |
: Open all plots for all cancer types
| Top |
: Open all interacting genes' information including KEGG pathway for all interacting genes from DAVID
| Top |
| Pharmacological Information for POLR1E |
| There's no related Drug. |
| Top |
| Cross referenced IDs for POLR1E |
| * We obtained these cross-references from Uniprot database. It covers 150 different DBs, 18 categories. http://www.uniprot.org/help/cross_references_section |
: Open all cross reference information
|
Copyright © 2016-Present - The Univsersity of Texas Health Science Center at Houston @ |