|
||||||||||||||||||||
| |
| Phenotypic Information (metabolism pathway, cancer, disease, phenome) |
| |
| |
| Gene-Gene Network Information: Co-Expression Network, Interacting Genes & KEGG |
| |
|


| Gene Summary for SHMT2 |
| Basic gene info. | Gene symbol | SHMT2 |
| Gene name | serine hydroxymethyltransferase 2 (mitochondrial) | |
| Synonyms | GLYA|HEL-S-51e|SHMT | |
| Cytomap | UCSC genome browser: 12q12-q14 | |
| Genomic location | chr12 :57624110-57628718 | |
| Type of gene | protein-coding | |
| RefGenes | NM_001166356.1, NM_001166357.1,NM_001166358.1,NM_001166359.1,NM_005412.5, NR_029415.1,NR_029416.1,NR_029417.1,NR_048562.1, | |
| Ensembl id | ENSG00000182199 | |
| Description | GLY A+epididymis secretory sperm binding protein Li 51eglycine auxotroph A, human complement for hamsterglycine hydroxymethyltransferaseserine aldolaseserine hydroxymethylaseserine hydroxymethyltransferase, mitochondrialserine methylasethreonine a | |
| Modification date | 20141207 | |
| dbXrefs | MIM : 138450 | |
| HGNC : HGNC | ||
| Ensembl : ENSG00000182199 | ||
| HPRD : 00717 | ||
| Vega : OTTHUMG00000171246 | ||
| Protein | UniProt: go to UniProt's Cross Reference DB Table | |
| Expression | CleanEX: HS_SHMT2 | |
| BioGPS: 6472 | ||
| Gene Expression Atlas: ENSG00000182199 | ||
| The Human Protein Atlas: ENSG00000182199 | ||
| Pathway | NCI Pathway Interaction Database: SHMT2 | |
| KEGG: SHMT2 | ||
| REACTOME: SHMT2 | ||
| ConsensusPathDB | ||
| Pathway Commons: SHMT2 | ||
| Metabolism | MetaCyc: SHMT2 | |
| HUMANCyc: SHMT2 | ||
| Regulation | Ensembl's Regulation: ENSG00000182199 | |
| miRBase: chr12 :57,624,110-57,628,718 | ||
| TargetScan: NM_001166356 | ||
| cisRED: ENSG00000182199 | ||
| Context | iHOP: SHMT2 | |
| cancer metabolism search in PubMed: SHMT2 | ||
| UCL Cancer Institute: SHMT2 | ||
| Assigned class in ccmGDB | C | |
| Top |
| Phenotypic Information for SHMT2(metabolism pathway, cancer, disease, phenome) |
| Cancer | CGAP: SHMT2 |
| Familial Cancer Database: SHMT2 | |
| * This gene is included in those cancer gene databases. |
|
|
|
|
|
|
| ||||||||||||||
Oncogene 1 | Significant driver gene in | |||||||||||||||||||
| cf) number; DB name 1 Oncogene; http://nar.oxfordjournals.org/content/35/suppl_1/D721.long, 2 Tumor Suppressor gene; https://bioinfo.uth.edu/TSGene/, 3 Cancer Gene Census; http://www.nature.com/nrc/journal/v4/n3/abs/nrc1299.html, 4 CancerGenes; http://nar.oxfordjournals.org/content/35/suppl_1/D721.long, 5 Network of Cancer Gene; http://ncg.kcl.ac.uk/index.php, 1Therapeutic Vulnerabilities in Cancer; http://cbio.mskcc.org/cancergenomics/statius/ |
| KEGG_GLYCINE_SERINE_AND_THREONINE_METABOLISM | |
| OMIM | |
| Orphanet | |
| Disease | KEGG Disease: SHMT2 |
| MedGen: SHMT2 (Human Medical Genetics with Condition) | |
| ClinVar: SHMT2 | |
| Phenotype | MGI: SHMT2 (International Mouse Phenotyping Consortium) |
| PhenomicDB: SHMT2 | |
| Mutations for SHMT2 |
| * Under tables are showing count per each tissue to give us broad intuition about tissue specific mutation patterns.You can go to the detailed page for each mutation database's web site. |
| There's no structural variation information in COSMIC data for this gene. |
| * From mRNA Sanger sequences, Chitars2.0 arranged chimeric transcripts. This table shows SHMT2 related fusion information. |
| ID | Head Gene | Tail Gene | Accession | Gene_a | qStart_a | qEnd_a | Chromosome_a | tStart_a | tEnd_a | Gene_a | qStart_a | qEnd_a | Chromosome_a | tStart_a | tEnd_a |
| BC009320 | COX8A | 49 | 493 | 11 | 63742141 | 63744015 | SHMT2 | 494 | 1567 | 12 | 57626576 | 57628509 | |
| Top |
| There's no copy number variation information in COSMIC data for this gene. |
| Top |
|
 |
| Top |
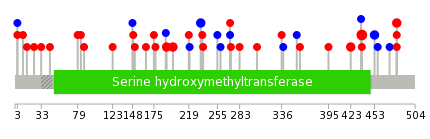
| Stat. for Non-Synonymous SNVs (# total SNVs=32) | (# total SNVs=12) |
 |  |
(# total SNVs=1) | (# total SNVs=0) |
 |
| Top |
| * When you move the cursor on each content, you can see more deailed mutation information on the Tooltip. Those are primary_site,primary_histology,mutation(aa),pubmedID. |
| GRCh37 position | Mutation(aa) | Unique sampleID count |
| chr12:57627816-57627816 | p.R437H | 4 |
| chr12:57628070-57628070 | p.R481C | 2 |
| chr12:57628071-57628071 | p.R481L | 2 |
| chr12:57626053-57626053 | p.E191G | 2 |
| chr12:57627675-57627675 | p.G423S | 2 |
| chr12:57626237-57626237 | p.P199L | 2 |
| chr12:57626616-57626616 | p.R283* | 2 |
| chr12:57626343-57626343 | p.Y234Y | 2 |
| chr12:57627865-57627865 | p.N453N | 2 |
| chr12:57625636-57625636 | p.Y151C | 1 |
| Top |
|
 |
| Point Mutation/ Tissue ID | 1 | 2 | 3 | 4 | 5 | 6 | 7 | 8 | 9 | 10 | 11 | 12 | 13 | 14 | 15 | 16 | 17 | 18 | 19 | 20 |
| # sample | 1 | 8 | 3 | 3 | 2 | 1 | 1 | 4 | 4 | 5 | ||||||||||
| # mutation | 1 | 8 | 3 | 3 | 2 | 1 | 1 | 4 | 5 | 5 | ||||||||||
| nonsynonymous SNV | 1 | 5 | 2 | 2 | 2 | 1 | 2 | 3 | 4 | |||||||||||
| synonymous SNV | 3 | 1 | 1 | 1 | 2 | 2 | 1 |
| cf) Tissue ID; Tissue type (1; BLCA[Bladder Urothelial Carcinoma], 2; BRCA[Breast invasive carcinoma], 3; CESC[Cervical squamous cell carcinoma and endocervical adenocarcinoma], 4; COAD[Colon adenocarcinoma], 5; GBM[Glioblastoma multiforme], 6; Glioma Low Grade, 7; HNSC[Head and Neck squamous cell carcinoma], 8; KICH[Kidney Chromophobe], 9; KIRC[Kidney renal clear cell carcinoma], 10; KIRP[Kidney renal papillary cell carcinoma], 11; LAML[Acute Myeloid Leukemia], 12; LUAD[Lung adenocarcinoma], 13; LUSC[Lung squamous cell carcinoma], 14; OV[Ovarian serous cystadenocarcinoma ], 15; PAAD[Pancreatic adenocarcinoma], 16; PRAD[Prostate adenocarcinoma], 17; SKCM[Skin Cutaneous Melanoma], 18:STAD[Stomach adenocarcinoma], 19:THCA[Thyroid carcinoma], 20:UCEC[Uterine Corpus Endometrial Carcinoma]) |
| Top |
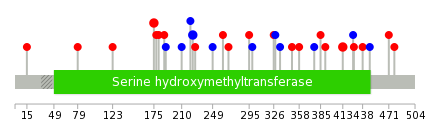
| * We represented just top 10 SNVs. When you move the cursor on each content, you can see more deailed mutation information on the Tooltip. Those are primary_site, primary_histology, mutation(aa), pubmedID. |
| Genomic Position | Mutation(aa) | Unique sampleID count |
| chr12:57627675 | p.G413S,SHMT2 | 2 |
| chr12:57626343 | p.Y224Y,SHMT2 | 2 |
| chr12:57626004 | p.G175S,SHMT2 | 2 |
| chr12:57626605 | p.I188M,SHMT2 | 1 |
| chr12:57626045 | p.R349W,SHMT2 | 1 |
| chr12:57627019 | p.F190F,SHMT2 | 1 |
| chr12:57627814 | p.R358Q,SHMT2 | 1 |
| chr12:57626051 | p.P178L,SHMT2 | 1 |
| chr12:57627032 | p.R377R,SHMT2 | 1 |
| chr12:57627815 | p.G181V,SHMT2 | 1 |
| * Copy number data were extracted from TCGA using R package TCGA-Assembler. The URLs of all public data files on TCGA DCC data server were gathered on Jan-05-2015. Function ProcessCNAData in TCGA-Assembler package was used to obtain gene-level copy number value which is calculated as the average copy number of the genomic region of a gene. |
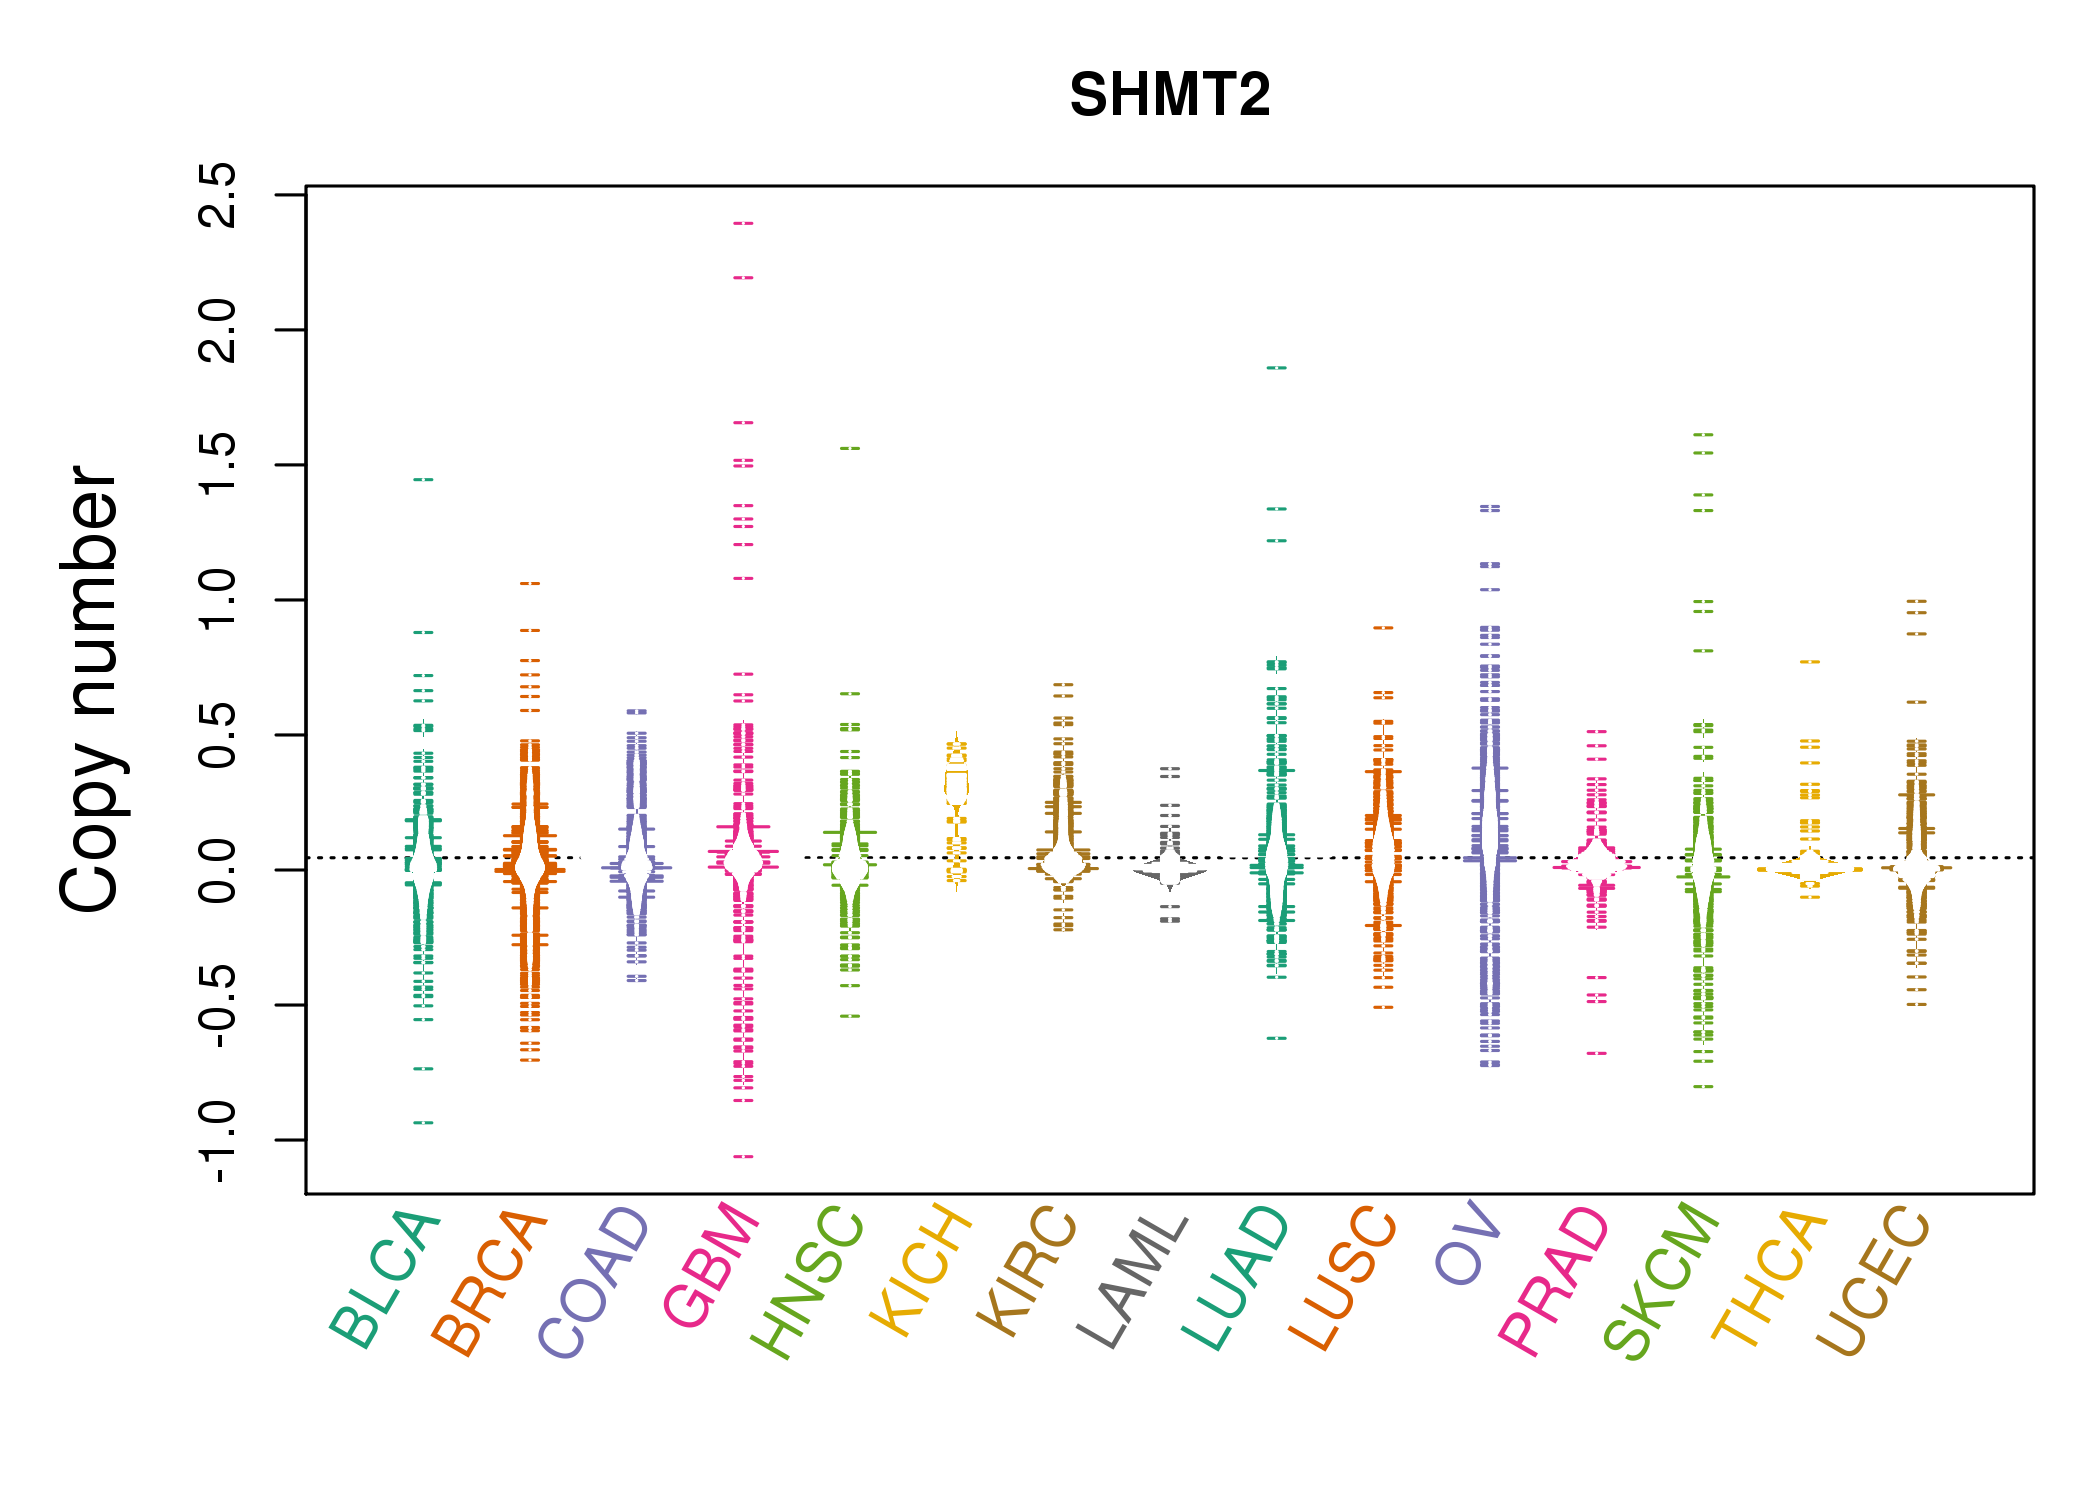 |
| cf) Tissue ID[Tissue type]: BLCA[Bladder Urothelial Carcinoma], BRCA[Breast invasive carcinoma], CESC[Cervical squamous cell carcinoma and endocervical adenocarcinoma], COAD[Colon adenocarcinoma], GBM[Glioblastoma multiforme], Glioma Low Grade, HNSC[Head and Neck squamous cell carcinoma], KICH[Kidney Chromophobe], KIRC[Kidney renal clear cell carcinoma], KIRP[Kidney renal papillary cell carcinoma], LAML[Acute Myeloid Leukemia], LUAD[Lung adenocarcinoma], LUSC[Lung squamous cell carcinoma], OV[Ovarian serous cystadenocarcinoma ], PAAD[Pancreatic adenocarcinoma], PRAD[Prostate adenocarcinoma], SKCM[Skin Cutaneous Melanoma], STAD[Stomach adenocarcinoma], THCA[Thyroid carcinoma], UCEC[Uterine Corpus Endometrial Carcinoma] |
| Top |
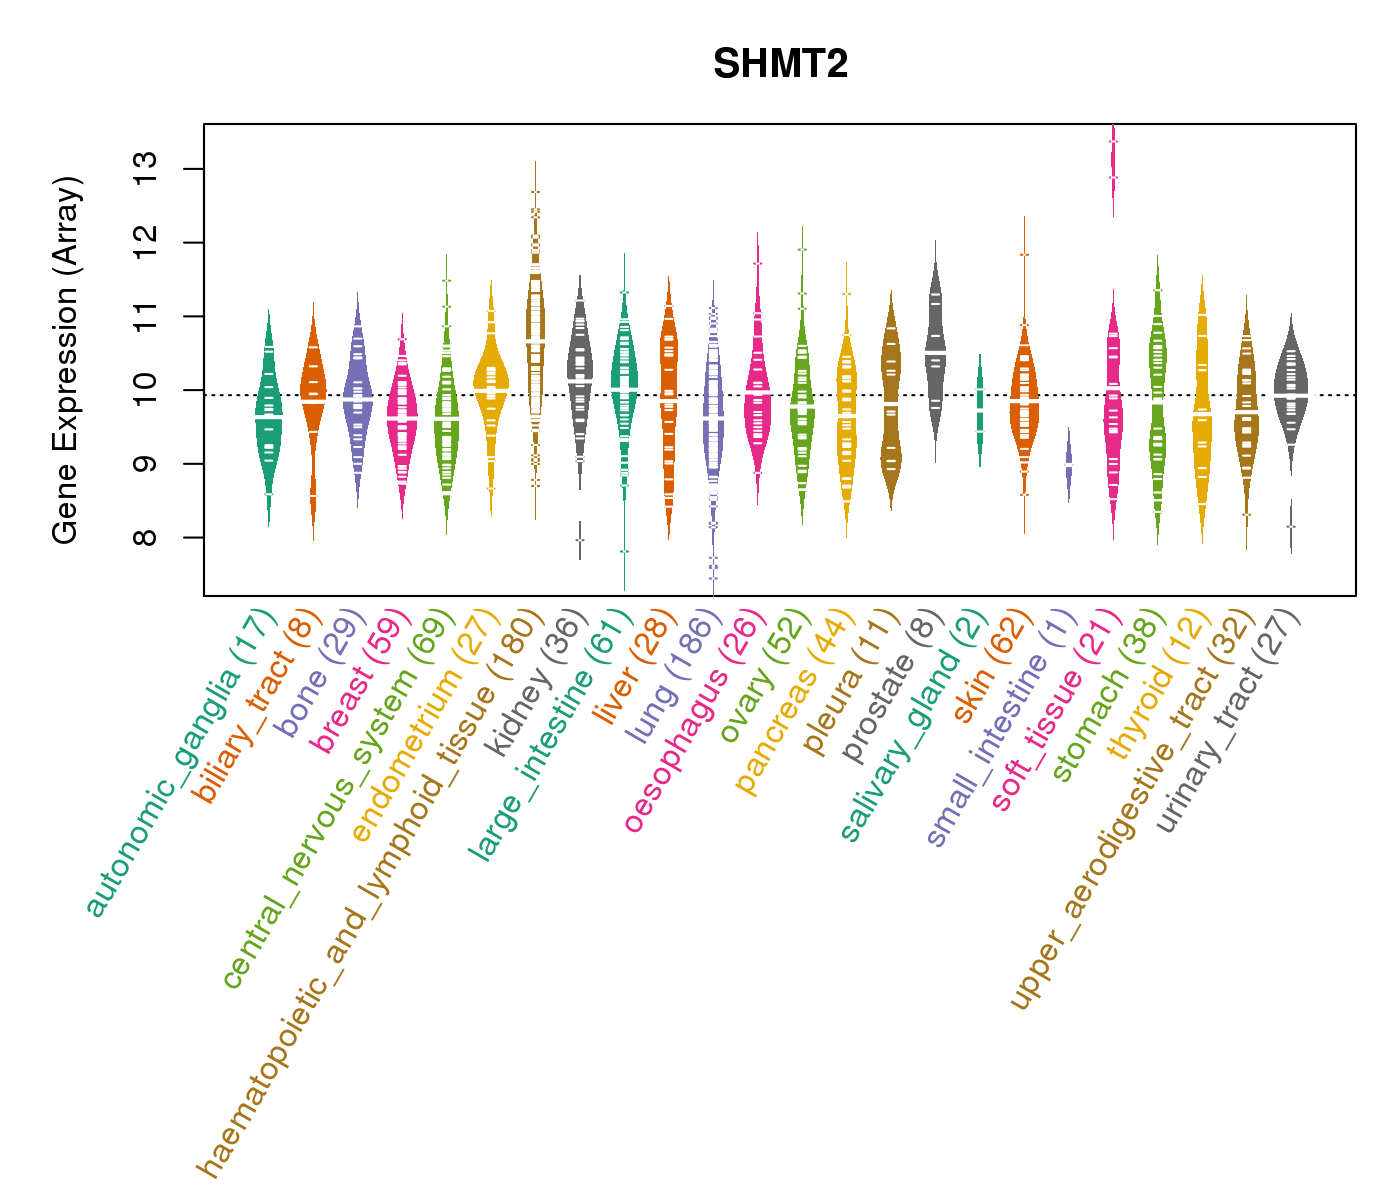
| Gene Expression for SHMT2 |
| * CCLE gene expression data were extracted from CCLE_Expression_Entrez_2012-10-18.res: Gene-centric RMA-normalized mRNA expression data. |
 |
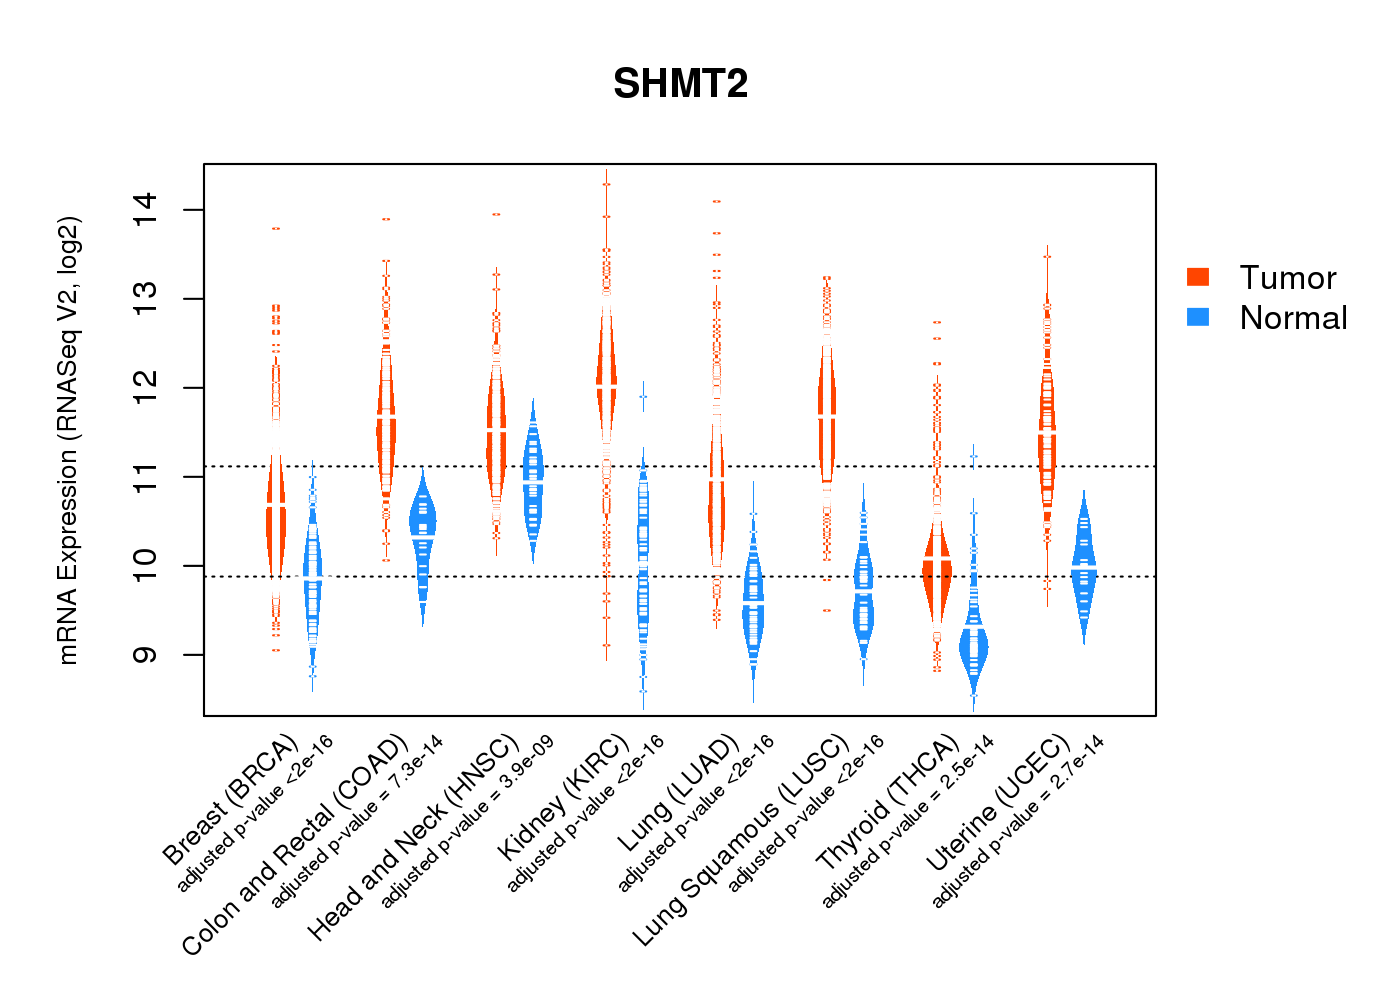
| * Normalized gene expression data of RNASeqV2 was extracted from TCGA using R package TCGA-Assembler. The URLs of all public data files on TCGA DCC data server were gathered at Jan-05-2015. Only eight cancer types have enough normal control samples for differential expression analysis. (t test, adjusted p<0.05 (using Benjamini-Hochberg FDR)) |
 |
| Top |
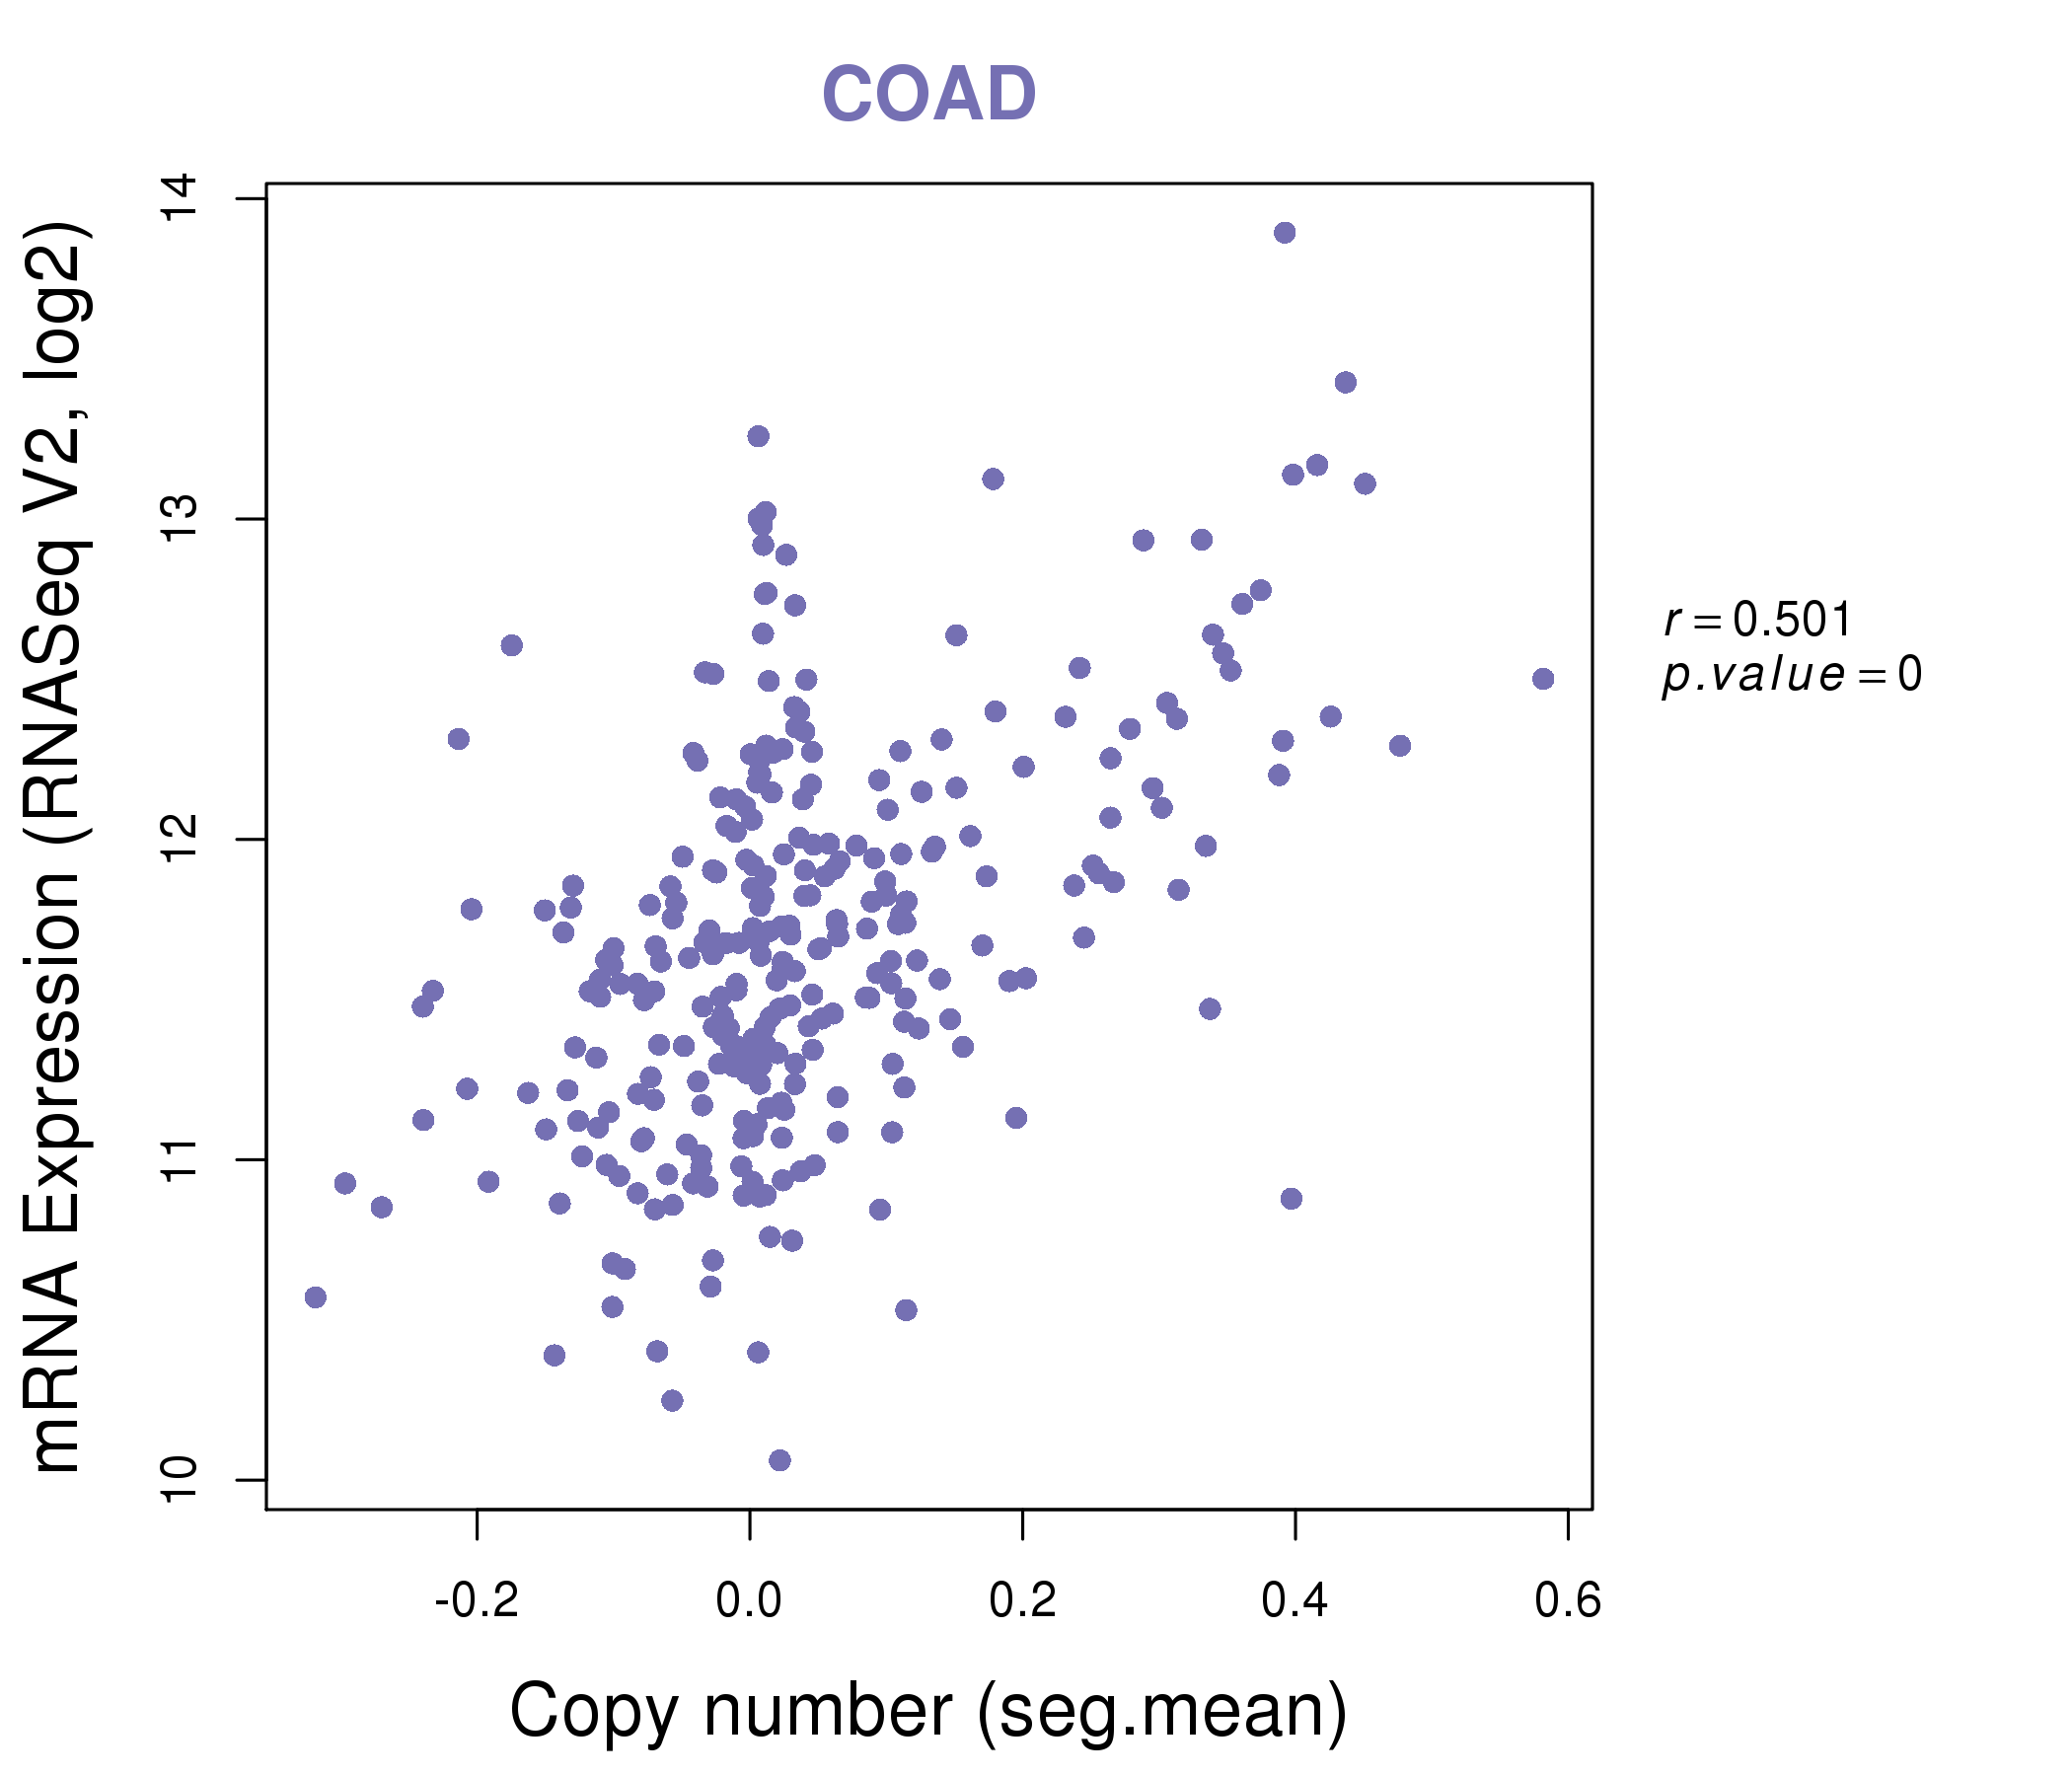
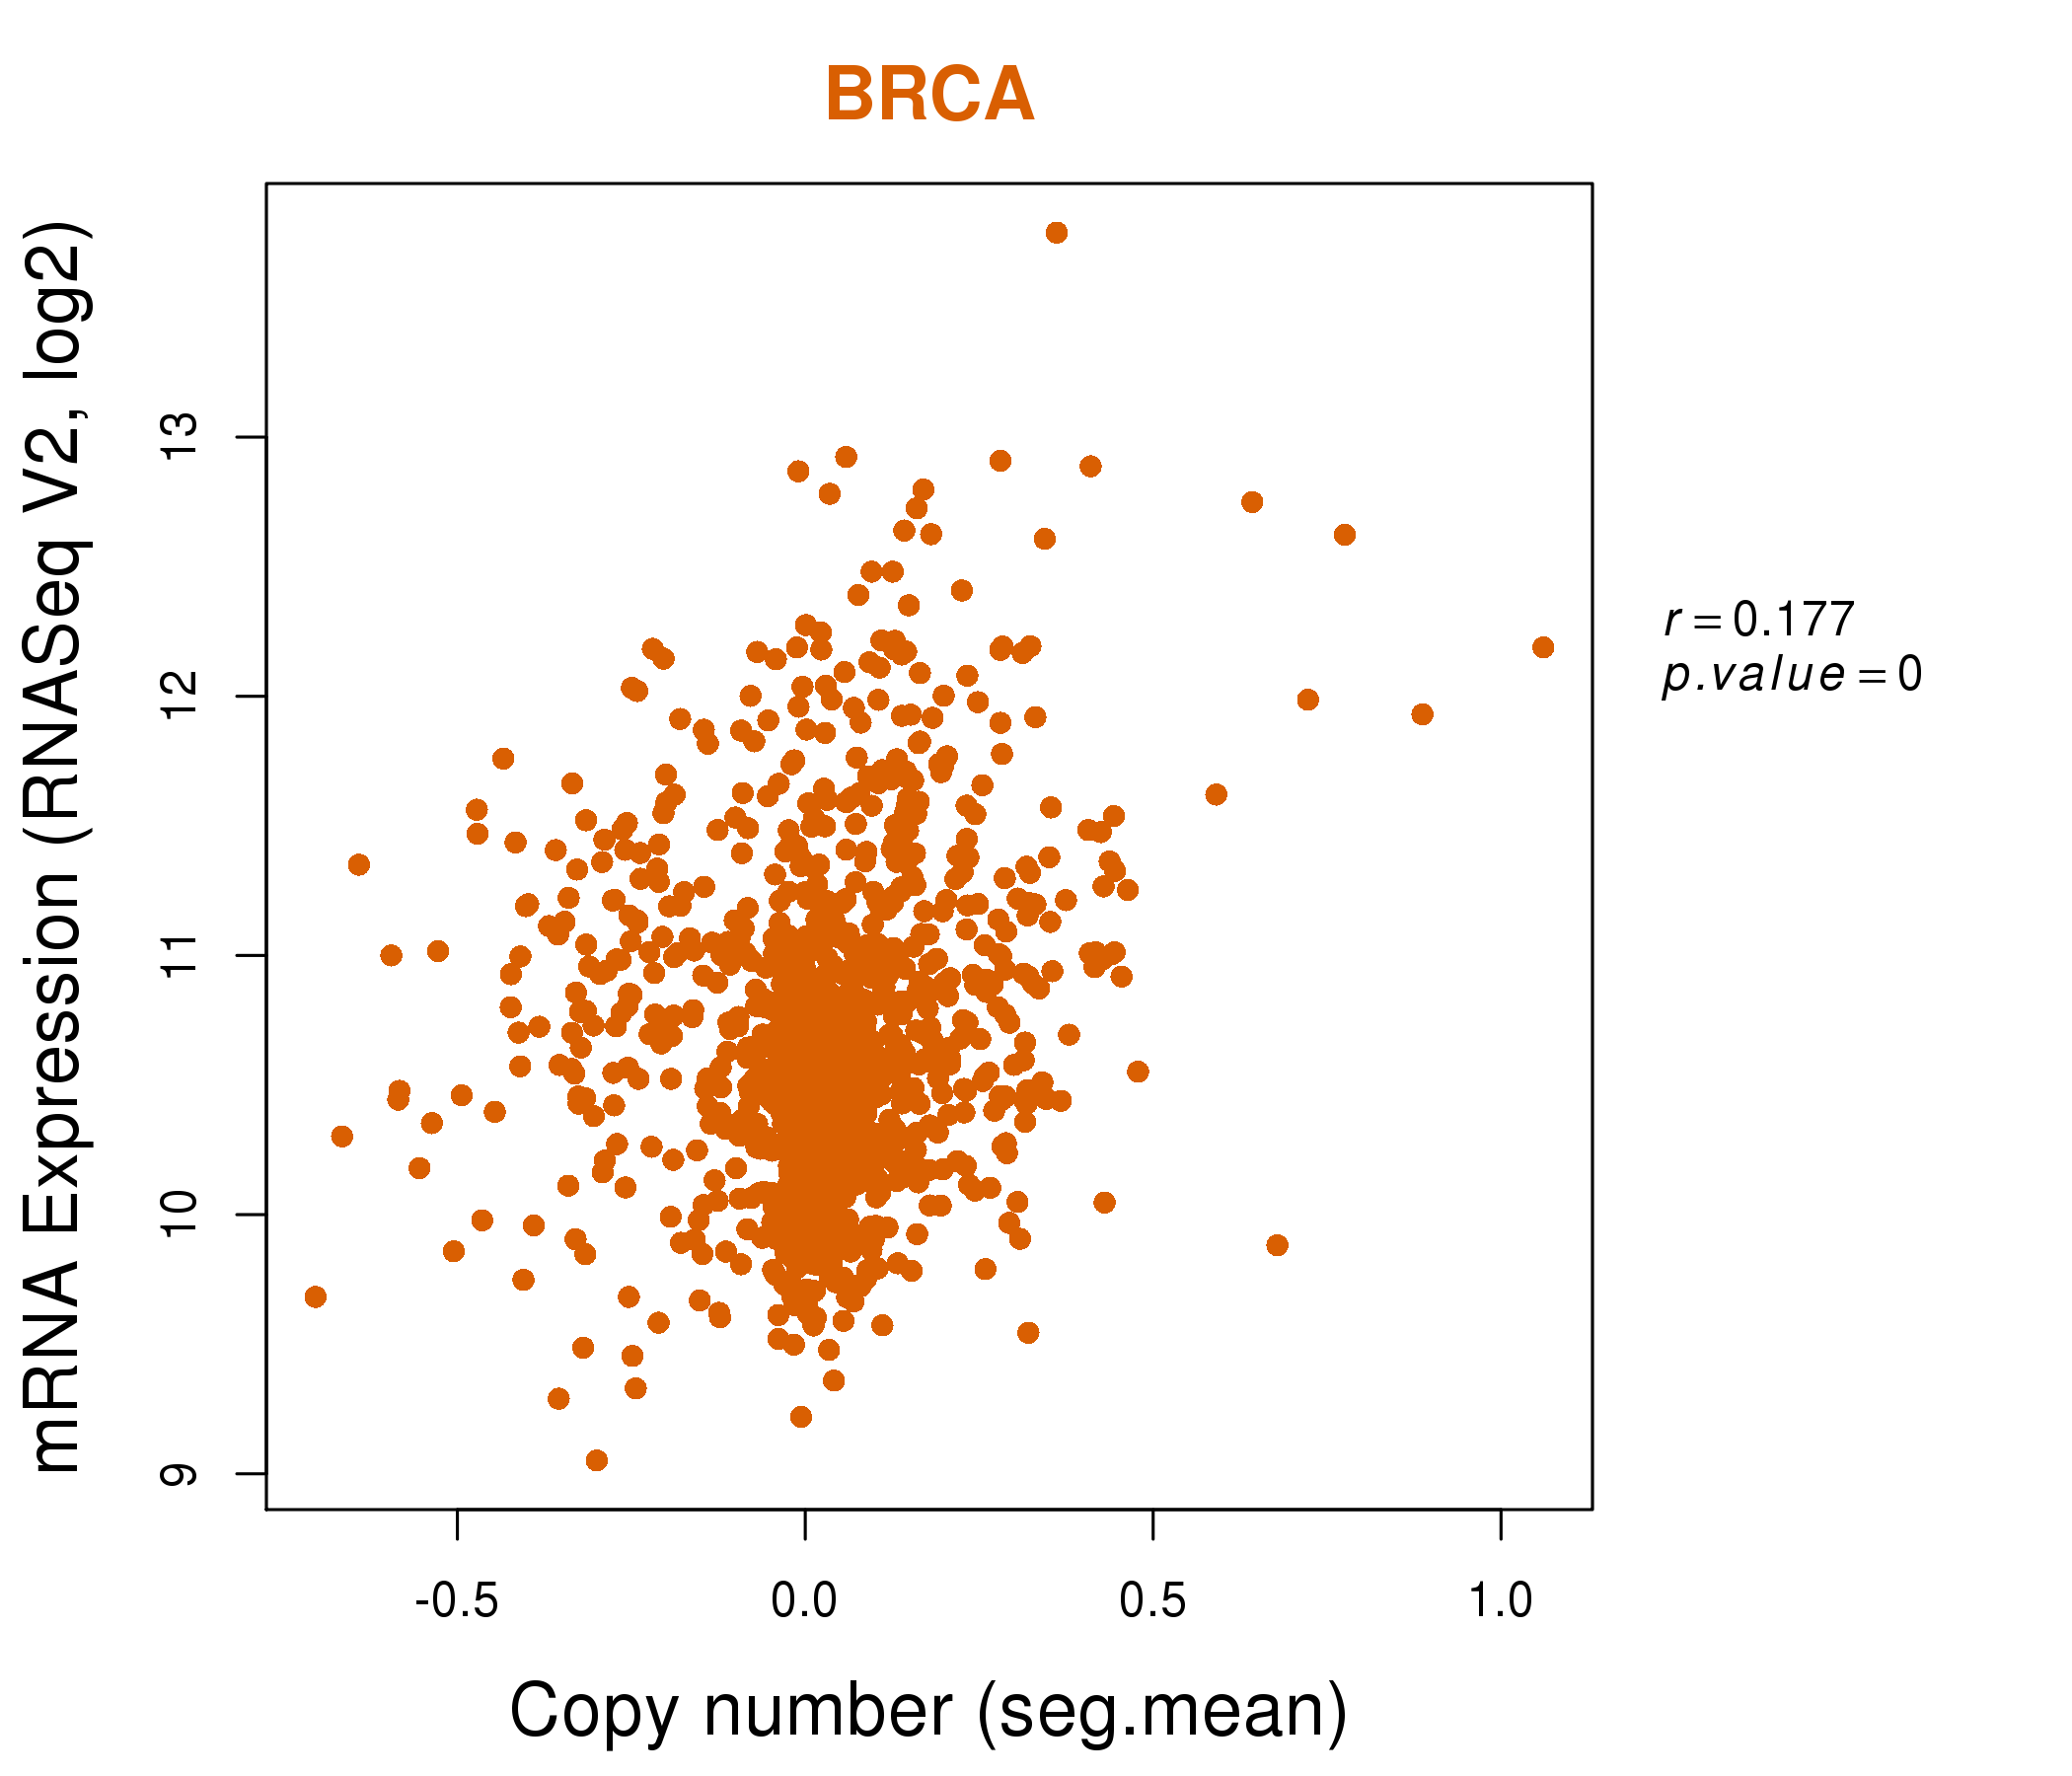
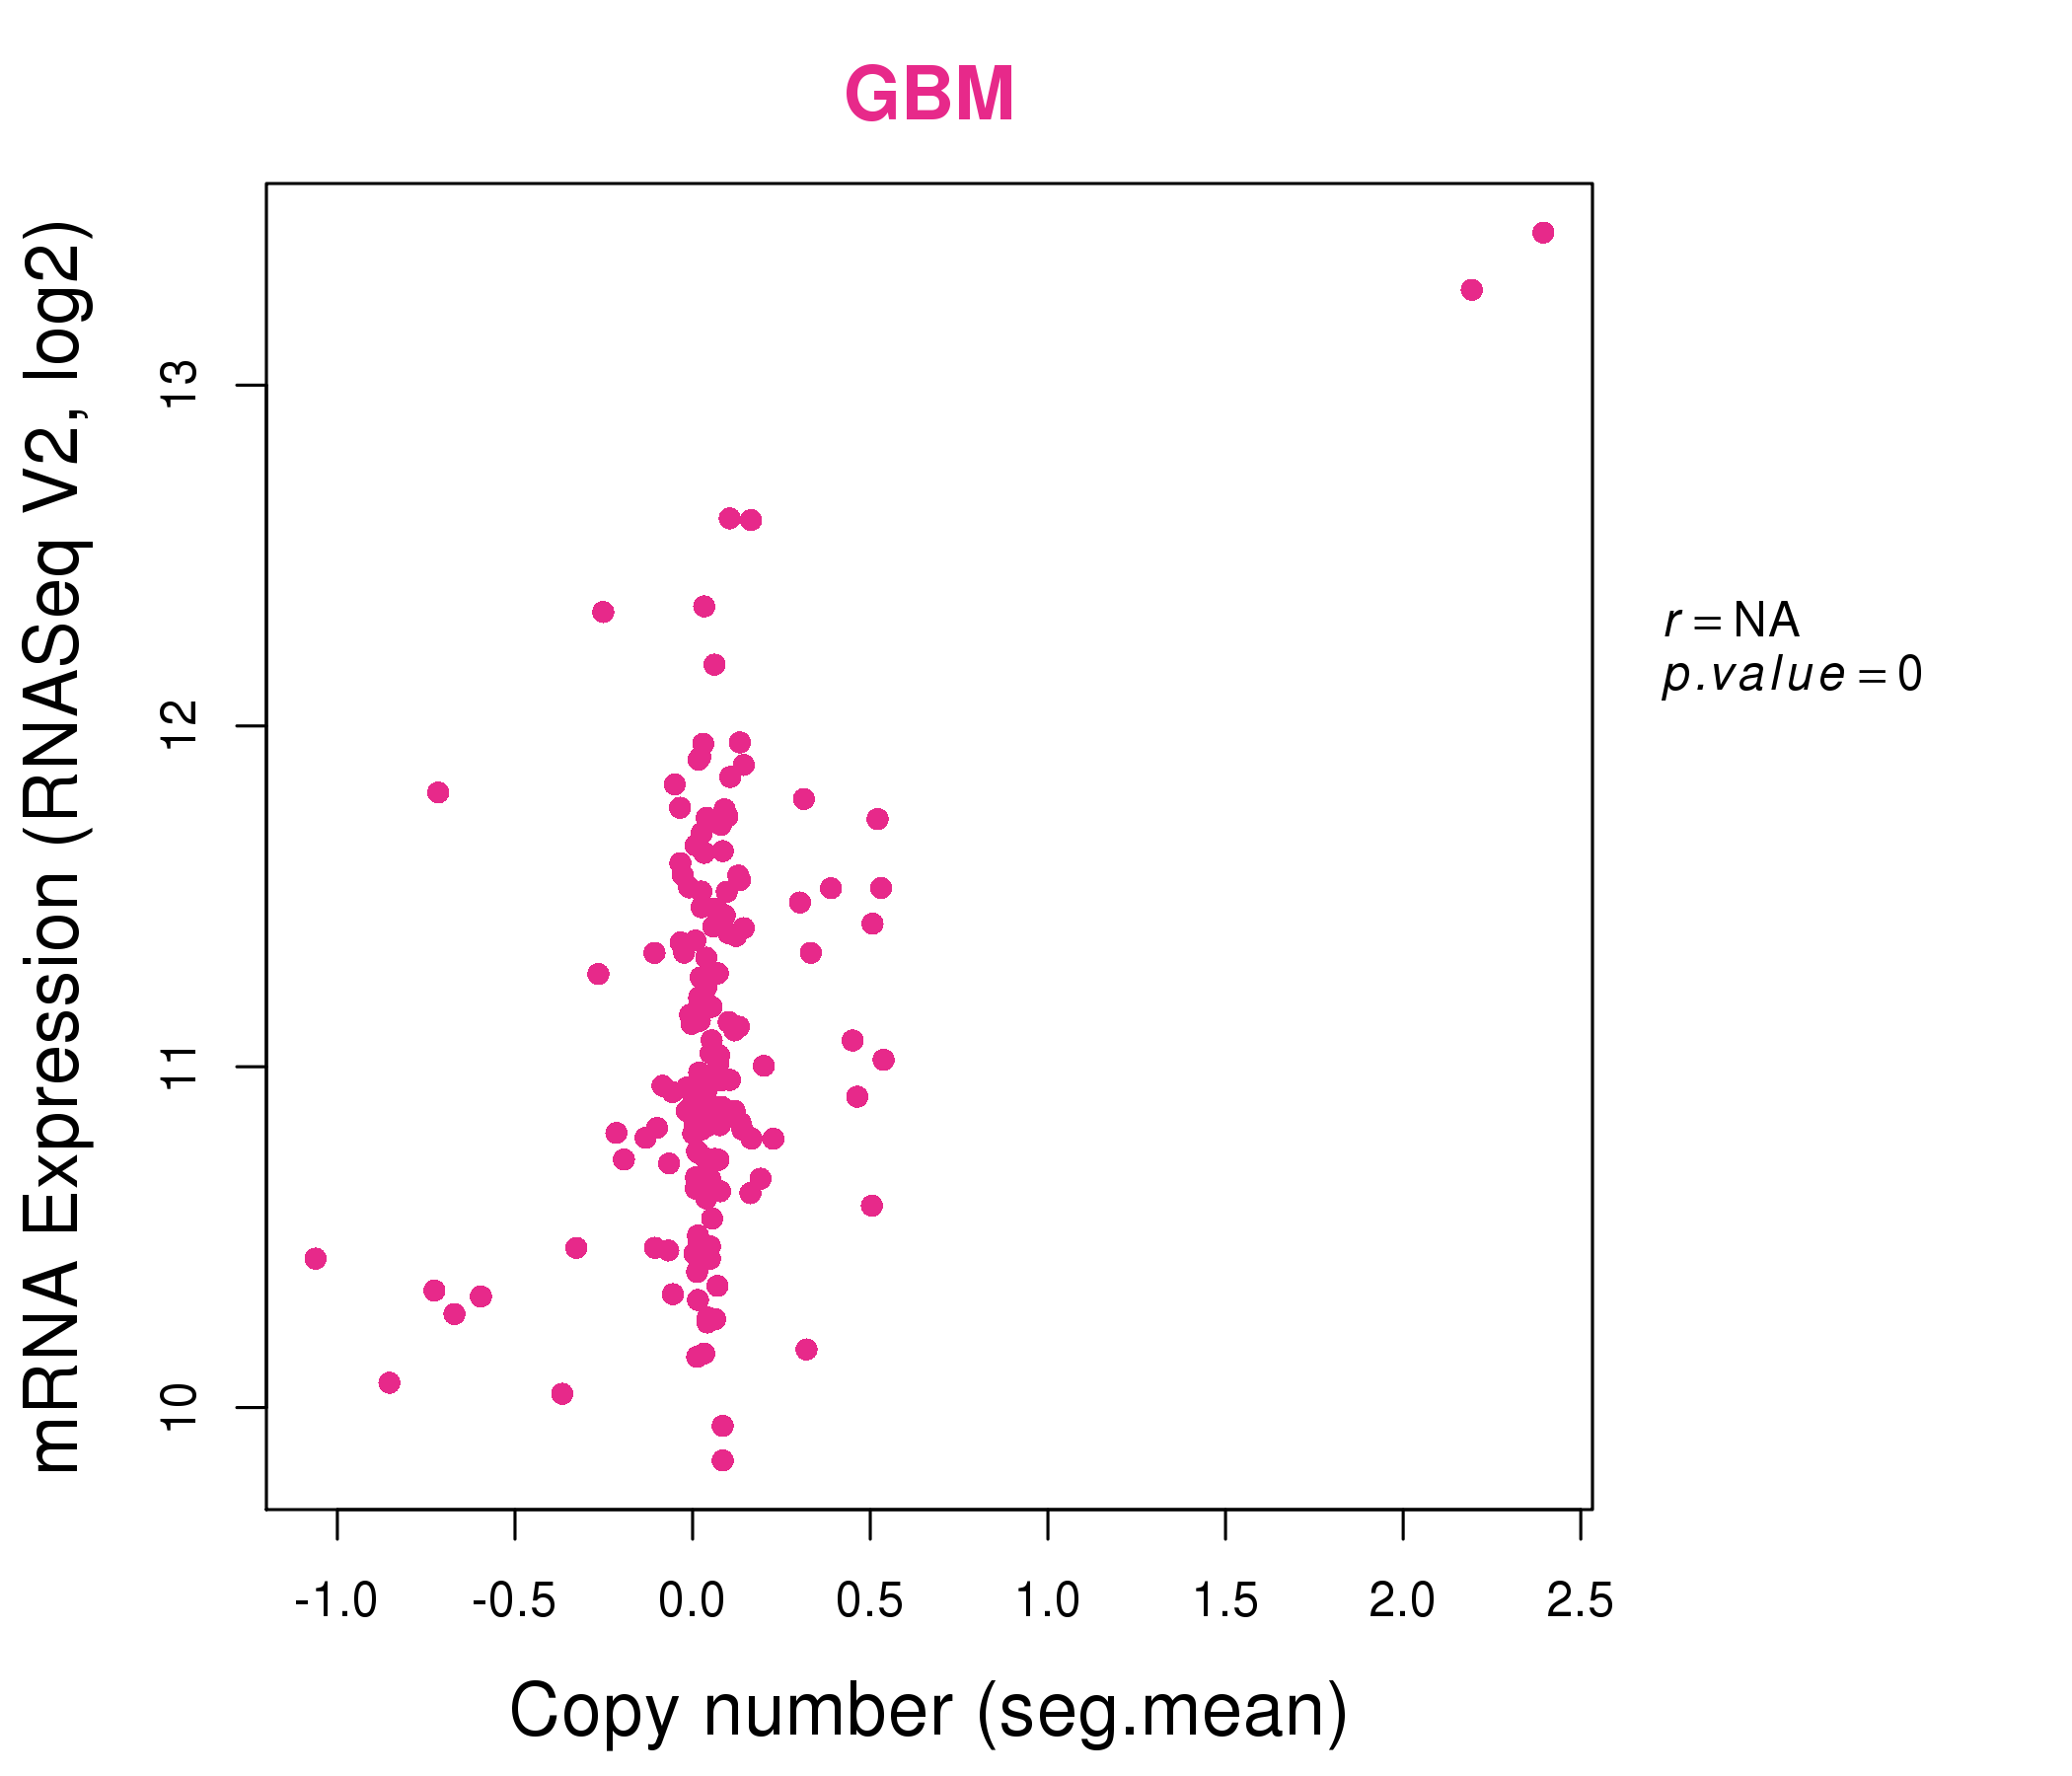
| * This plots show the correlation between CNV and gene expression. |
: Open all plots for all cancer types
 |
|
 |
|
| Top |
| Gene-Gene Network Information |
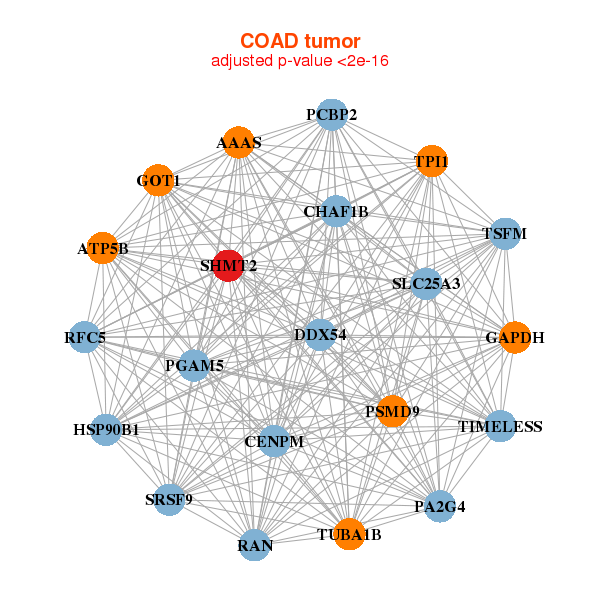
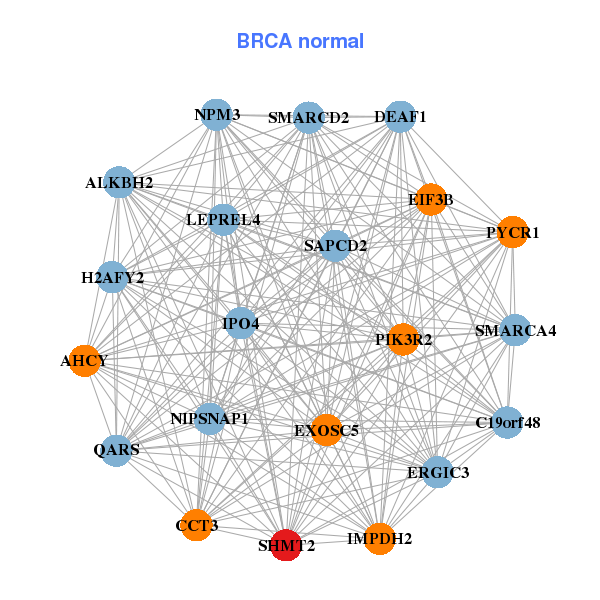
| * Co-Expression network figures were drawn using R package igraph. Only the top 20 genes with the highest correlations were shown. Red circle: input gene, orange circle: cell metabolism gene, sky circle: other gene |
: Open all plots for all cancer types
 |
| ||||
| AURKB,CCT7,CDT1,EIF2S2,FAM64A,GAPDH,LMNB2, MARS,NXPH4,PLK1,RAN,RANBP1,SHMT2,TPI1, TROAP,TUBA1B,TUBA1C,UQCRH,UQCRHL,WDR4,YARS | AHCY,ALKBH2,C19orf48,SAPCD2,CCT3,DEAF1,EIF3B, ERGIC3,EXOSC5,H2AFY2,IMPDH2,IPO4,NIPSNAP1,NPM3, PIK3R2,PYCR1,QARS,LEPREL4,SHMT2,SMARCA4,SMARCD2 | ||||
 |
| ||||
| AAAS,ATP5B,CENPM,CHAF1B,DDX54,GAPDH,GOT1, HSP90B1,PA2G4,PCBP2,PGAM5,PSMD9,RAN,RFC5, SRSF9,SHMT2,SLC25A3,TIMELESS,TPI1,TSFM,TUBA1B | AURKB,CCNB2,CDC20,CDCA5,CDCA8,CDT1,FANCG, HJURP,KIF18A,KIF2C,MCM2,NUSAP1,PLK1,PTDSS1, PTTG1,SHMT2,SSRP1,TK1,TRAIP,TRAP1,UBE2C |
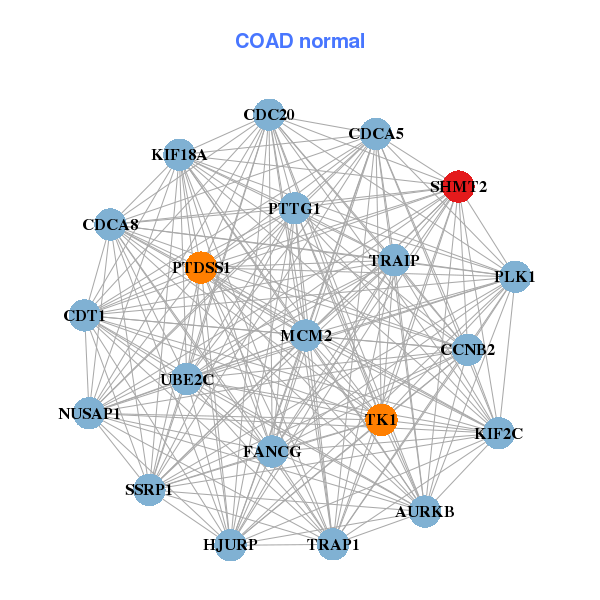
| * Co-Expression network figures were drawn using R package igraph. Only the top 20 genes with the highest correlations were shown. Red circle: input gene, orange circle: cell metabolism gene, sky circle: other gene |
: Open all plots for all cancer types
| Top |
: Open all interacting genes' information including KEGG pathway for all interacting genes from DAVID
| Top |
| Pharmacological Information for SHMT2 |
| DB Category | DB Name | DB's ID and Url link |
| * Gene Centered Interaction Network. |
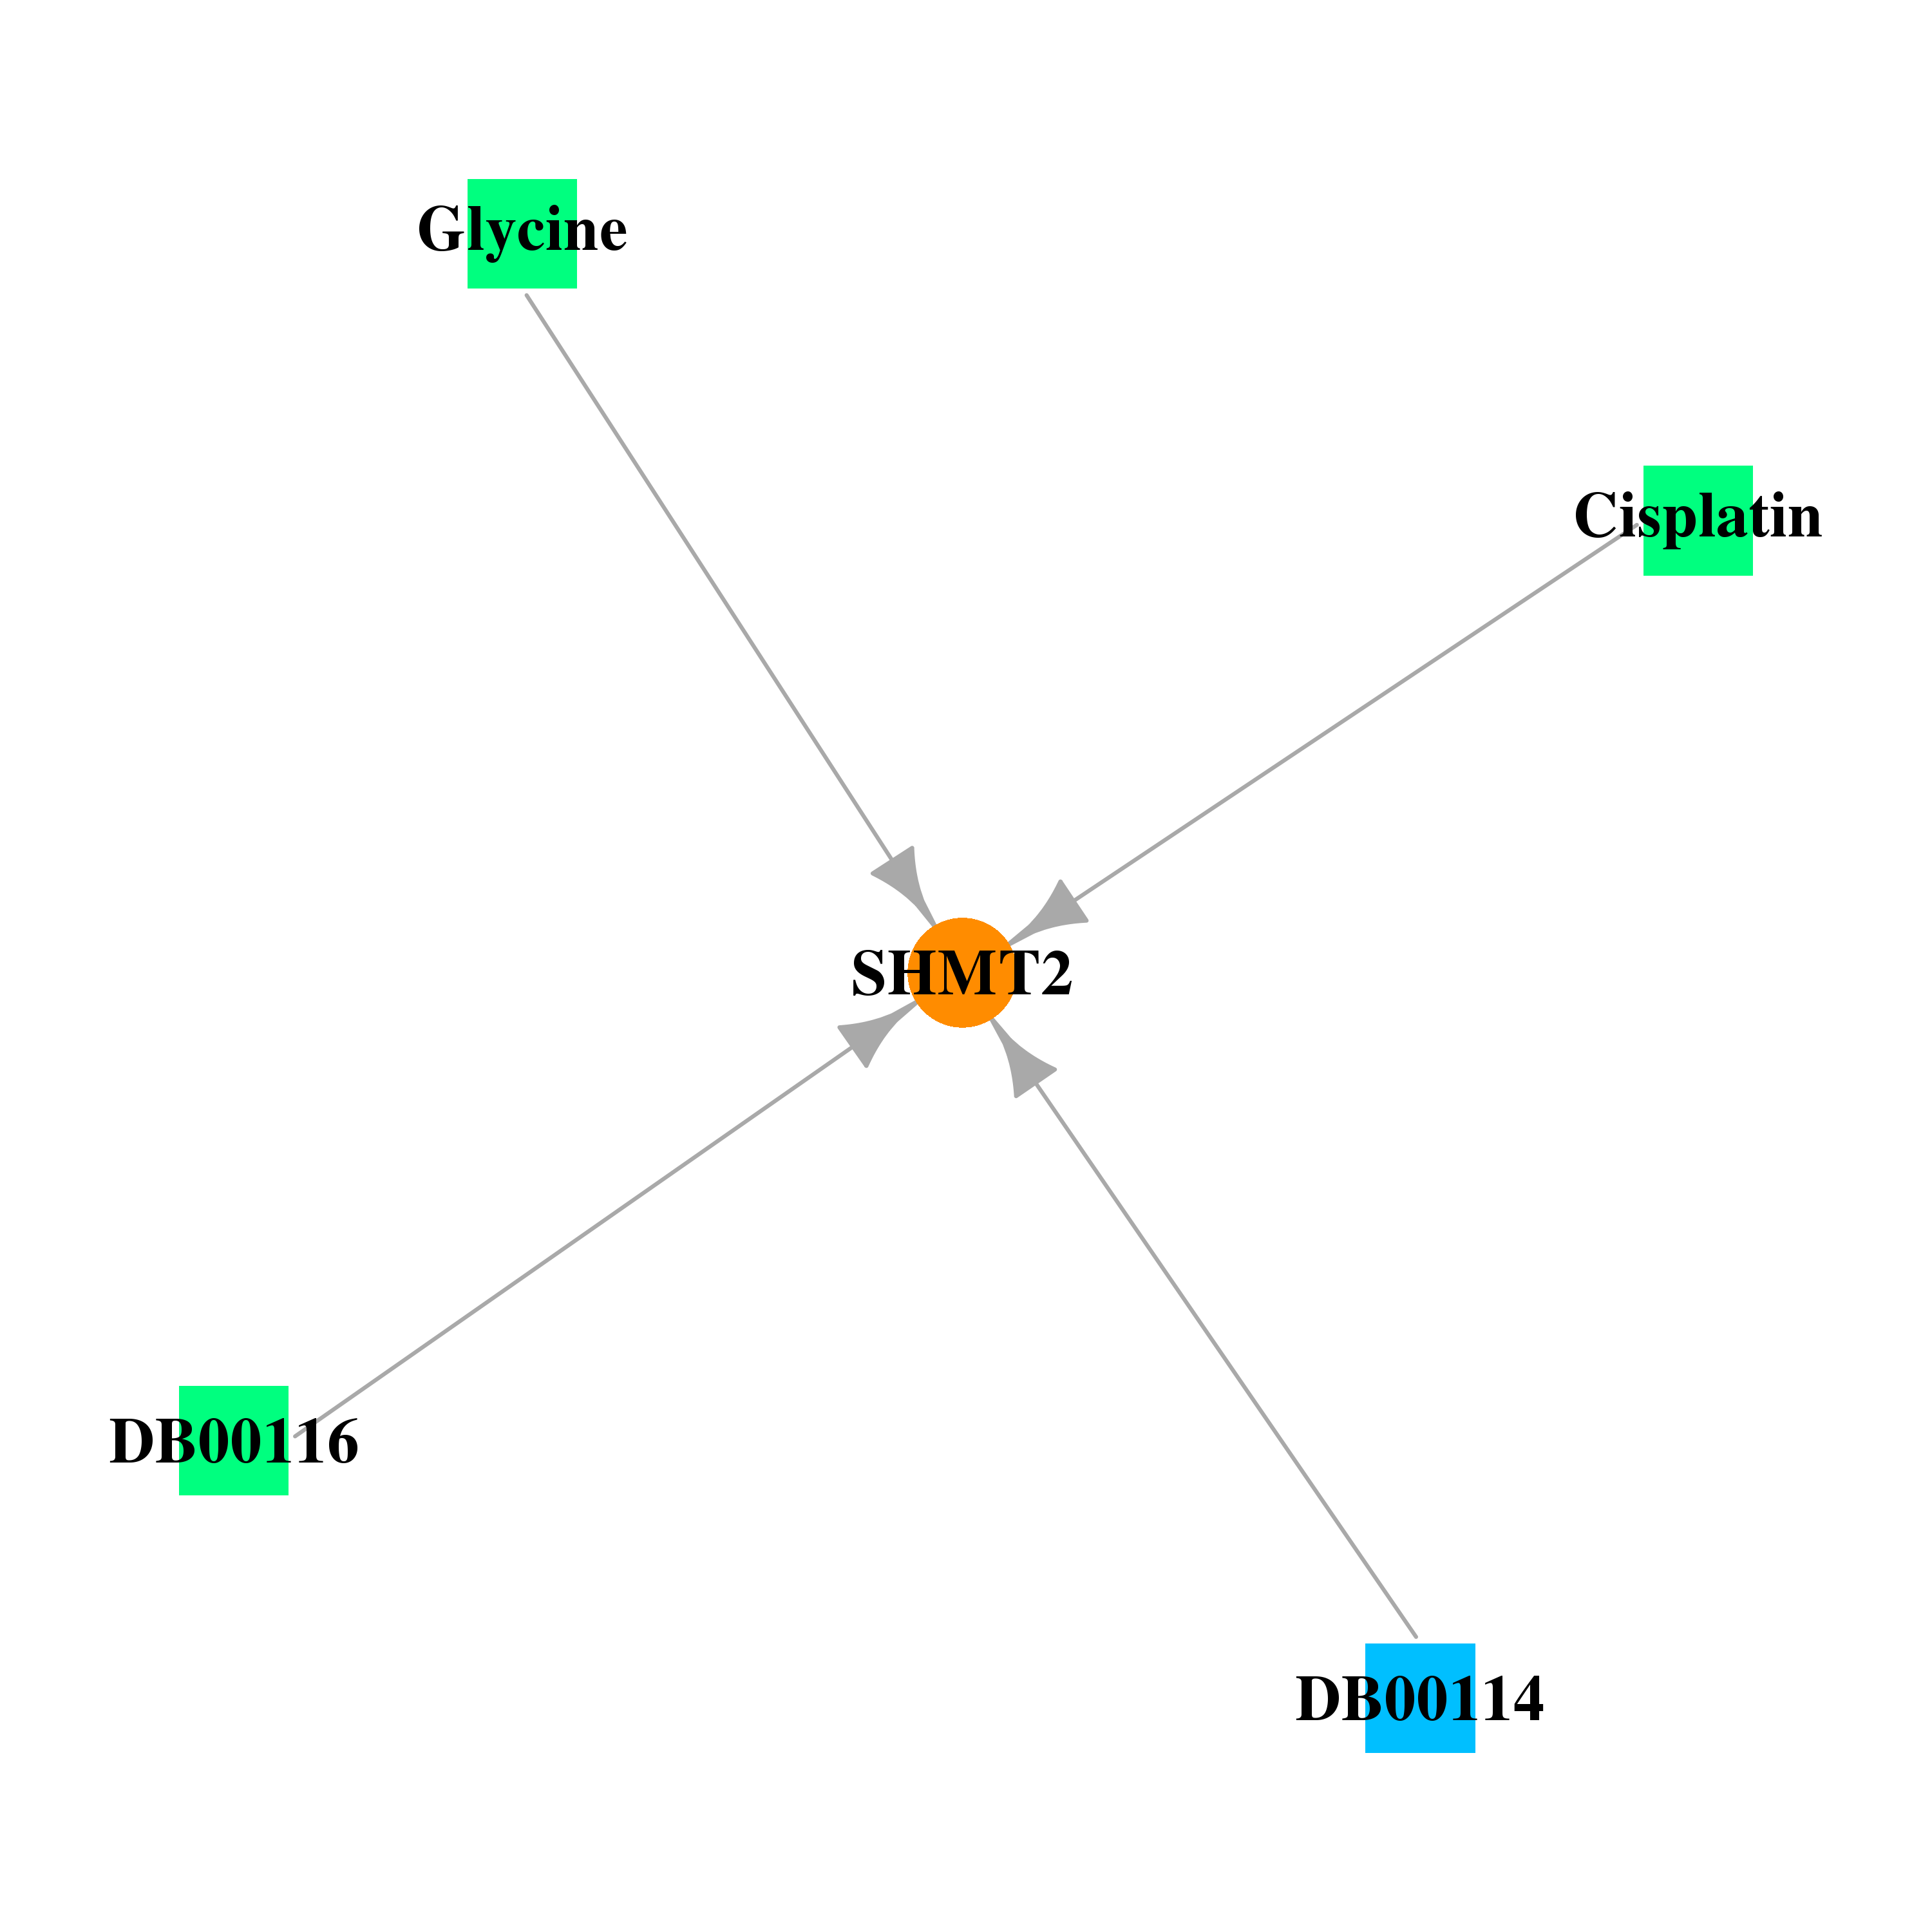 |
| * Drug Centered Interaction Network. |
| DrugBank ID | Target Name | Drug Groups | Generic Name | Drug Centered Network | Drug Structure |
| DB00114 | serine hydroxymethyltransferase 2 (mitochondrial) | nutraceutical | Pyridoxal Phosphate |  |  |
| DB00116 | serine hydroxymethyltransferase 2 (mitochondrial) | approved; nutraceutical | Tetrahydrofolic acid | 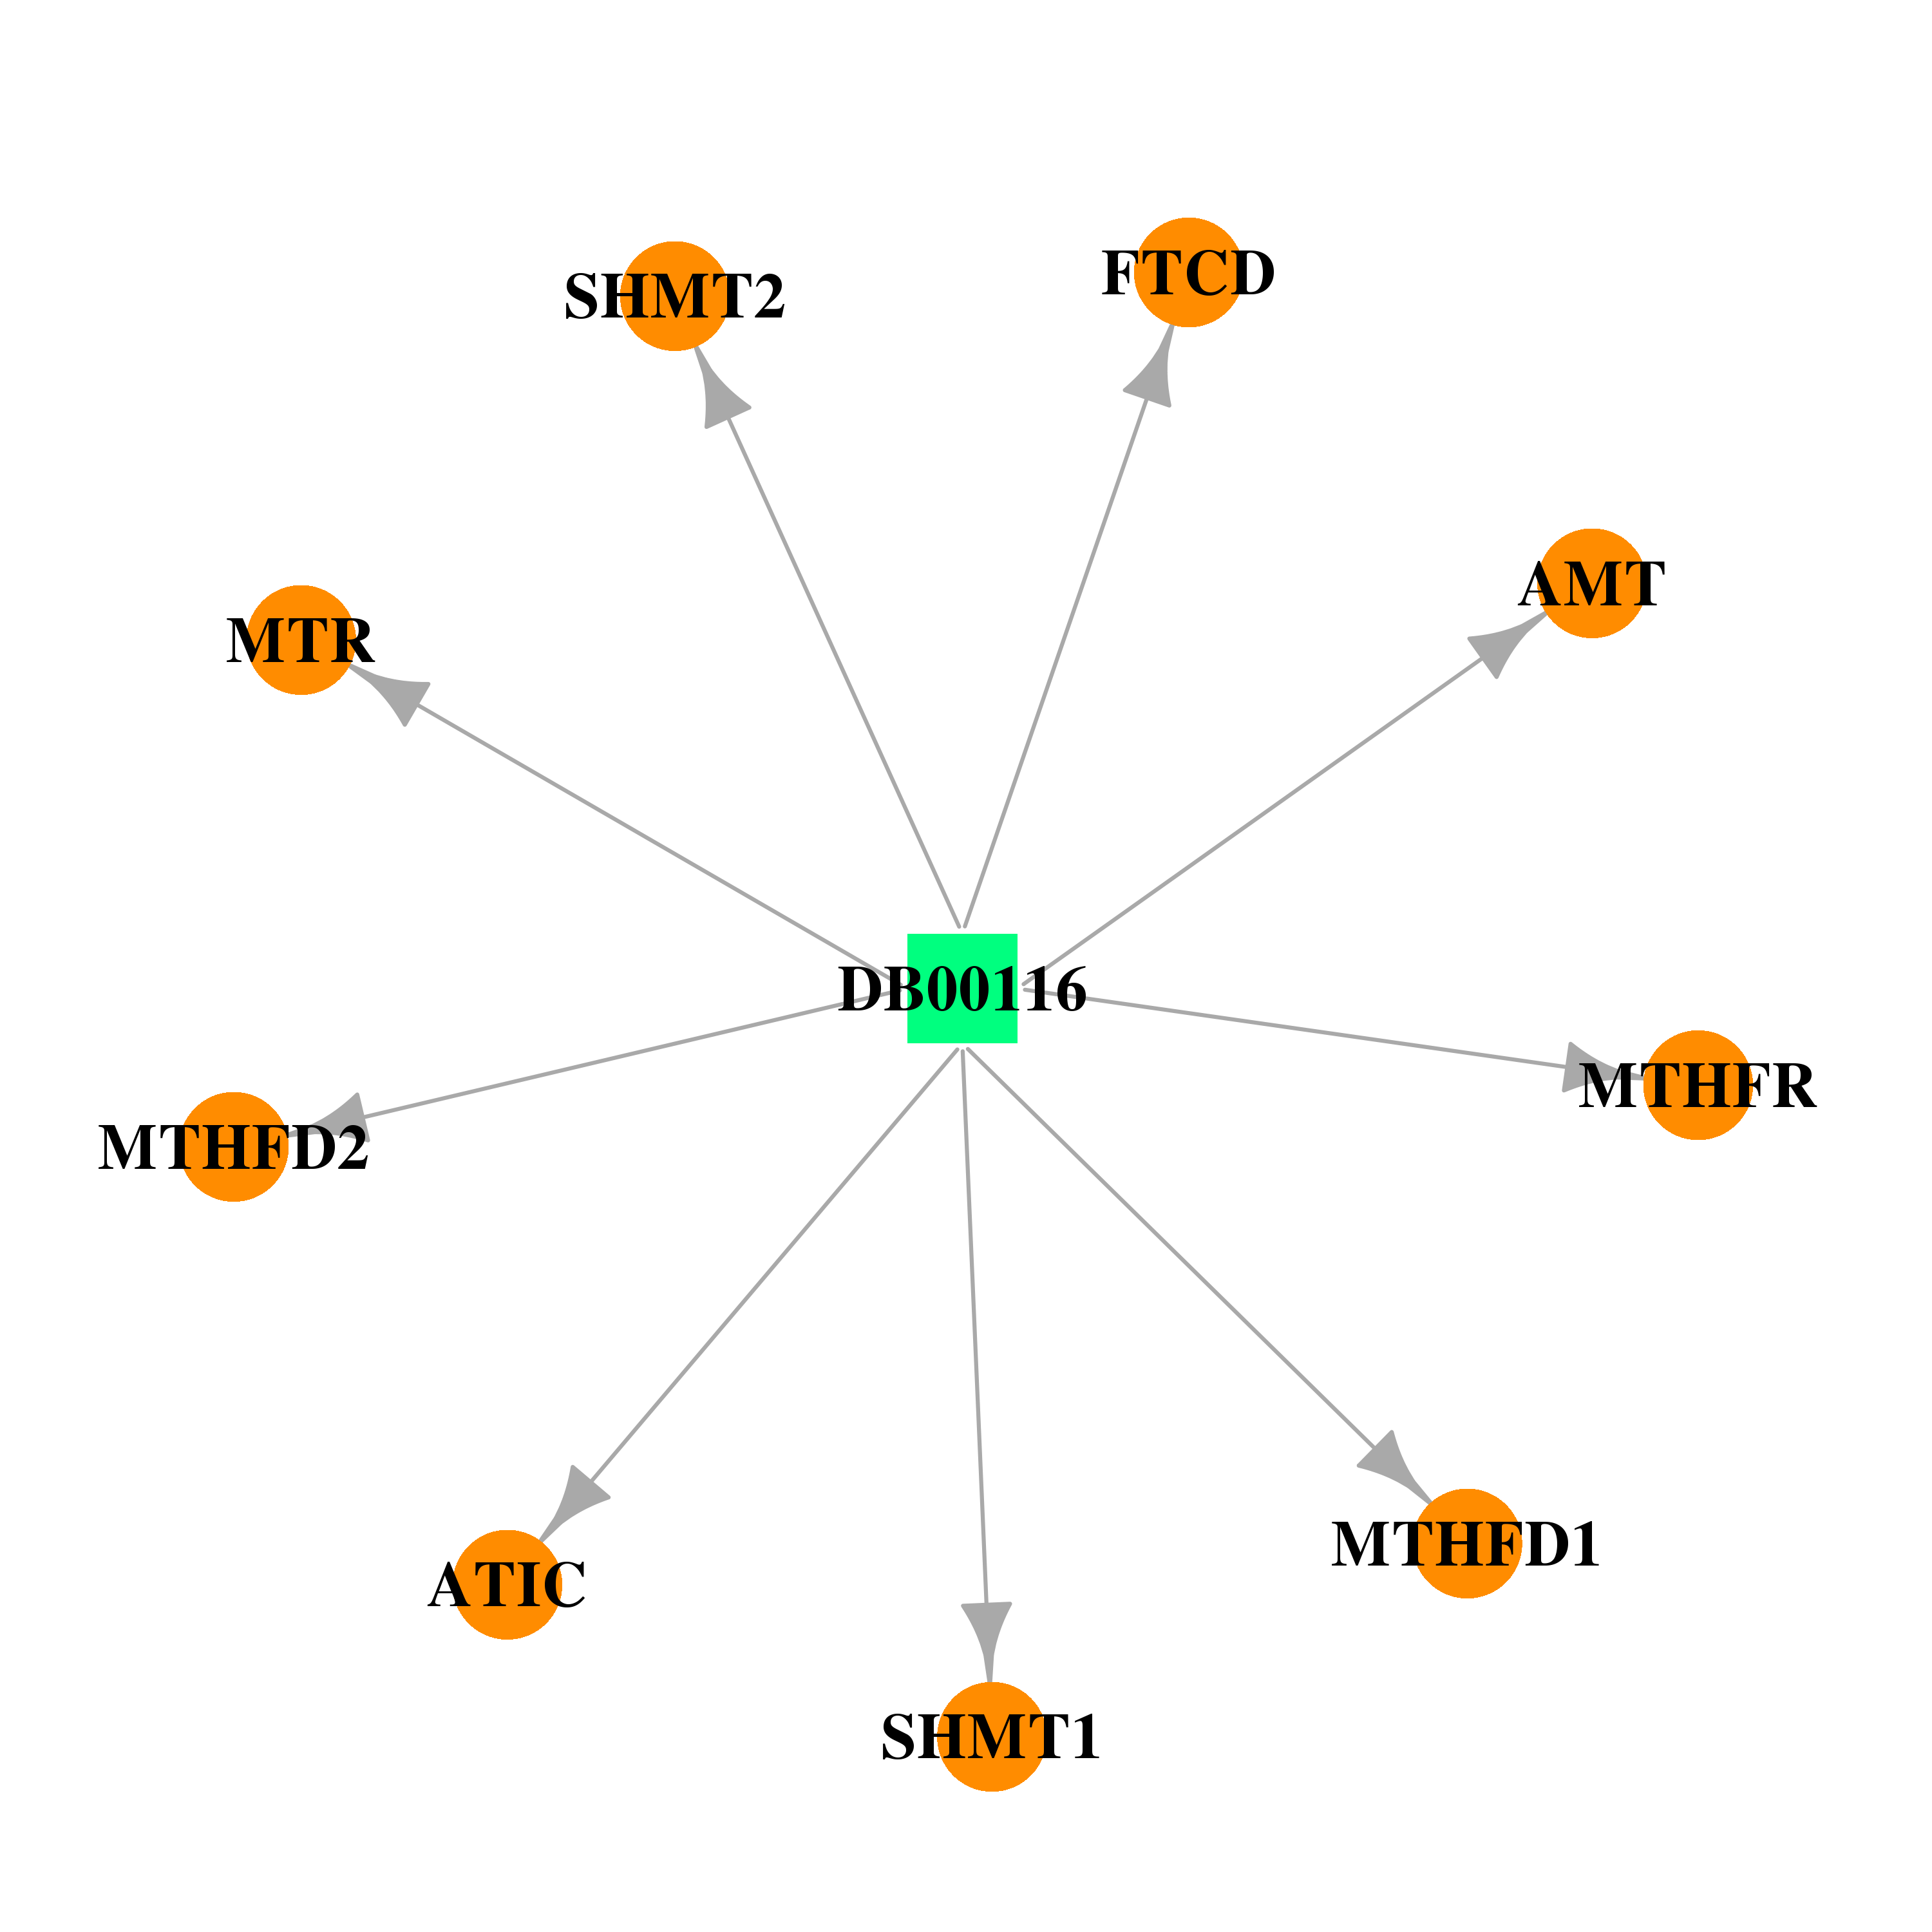 | 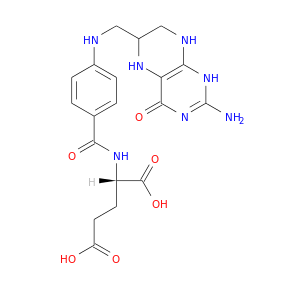 |
| DB00145 | serine hydroxymethyltransferase 2 (mitochondrial) | approved; nutraceutical | Glycine |  |  |
| DB00515 | serine hydroxymethyltransferase 2 (mitochondrial) | approved | Cisplatin |  |  |
| Top |
| Cross referenced IDs for SHMT2 |
| * We obtained these cross-references from Uniprot database. It covers 150 different DBs, 18 categories. http://www.uniprot.org/help/cross_references_section |
: Open all cross reference information
|
Copyright © 2016-Present - The Univsersity of Texas Health Science Center at Houston @ |