|
|||||||||||||||||||||||||||||||||||||||||||||||||||||||||||||||||||||||||||||||||||||||||||||||||||||||||||||||||||||||||||||||||||||||||||||||||||||||||||||||||||||||||||||||||||||||||||||||||||||||||||||||||||||||||||||||||||||||||||||||||||||||||||||||||||||||||||||||||||||||||||||||||||||||||||||||||||||||||||||||||||||||||||||||||||||||||||||||||||||
| |
| Phenotypic Information (metabolism pathway, cancer, disease, phenome) |
| |
| |
| Gene-Gene Network Information: Co-Expression Network, Interacting Genes & KEGG |
| |
|


| Gene Summary for SI |
| Top |
| Phenotypic Information for SI(metabolism pathway, cancer, disease, phenome) |
| Cancer | CGAP: SI |
| Familial Cancer Database: SI | |
| * This gene is included in those cancer gene databases. |
|
|
|
|
|
| . | |||||||||||||||||||||||||||||||||||||||||||||||||||||||||||||||||||||||||||||||||||||||||||||||||||||||||||||||||||||||||||||||||||||||||||||||||||||||||||||||||||||||||||||||||||||||||||||||||||||||||||||||||||||||||||||||||||||||||||||||||||||||||||||||||||||||||||||||||||||||||||||||||||||||||||||||||||||||||||||||||||||||||||||||||||||||||||||||
Oncogene 1 | Significant driver gene in | ||||||||||||||||||||||||||||||||||||||||||||||||||||||||||||||||||||||||||||||||||||||||||||||||||||||||||||||||||||||||||||||||||||||||||||||||||||||||||||||||||||||||||||||||||||||||||||||||||||||||||||||||||||||||||||||||||||||||||||||||||||||||||||||||||||||||||||||||||||||||||||||||||||||||||||||||||||||||||||||||||||||||||||||||||||||||||||||||||||
| cf) number; DB name 1 Oncogene; http://nar.oxfordjournals.org/content/35/suppl_1/D721.long, 2 Tumor Suppressor gene; https://bioinfo.uth.edu/TSGene/, 3 Cancer Gene Census; http://www.nature.com/nrc/journal/v4/n3/abs/nrc1299.html, 4 CancerGenes; http://nar.oxfordjournals.org/content/35/suppl_1/D721.long, 5 Network of Cancer Gene; http://ncg.kcl.ac.uk/index.php, 1Therapeutic Vulnerabilities in Cancer; http://cbio.mskcc.org/cancergenomics/statius/ |
| KEGG_STARCH_AND_SUCROSE_METABOLISM REACTOME_METABOLISM_OF_CARBOHYDRATES | |
| OMIM | 222900; phenotype. 609845; gene. |
| Orphanet | 306436; Congenital sucrase-isomaltase deficiency with starch intolerance. 306446; Congenital sucrase-isomaltase deficiency with minimal starch tolerance. 306462; Congenital sucrase-isomaltase deficiency without starch intolerance. 306474; Congenital sucrase-isomaltase deficiency with starch and lactose intolerance. 306486; Congenital sucrase-isomaltase deficiency without sucrose intolerance. |
| Disease | KEGG Disease: SI |
| MedGen: SI (Human Medical Genetics with Condition) | |
| ClinVar: SI | |
| Phenotype | MGI: SI (International Mouse Phenotyping Consortium) |
| PhenomicDB: SI | |
| Mutations for SI |
| * Under tables are showing count per each tissue to give us broad intuition about tissue specific mutation patterns.You can go to the detailed page for each mutation database's web site. |
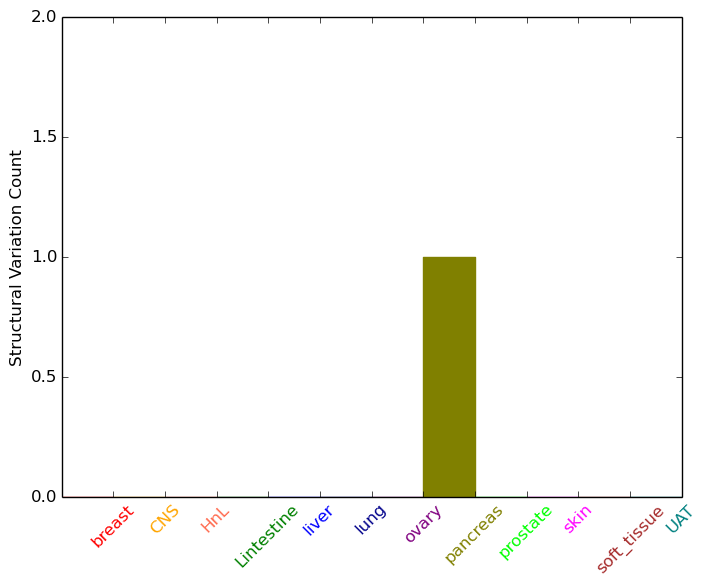
| - Statistics for Tissue and Mutation type | Top |
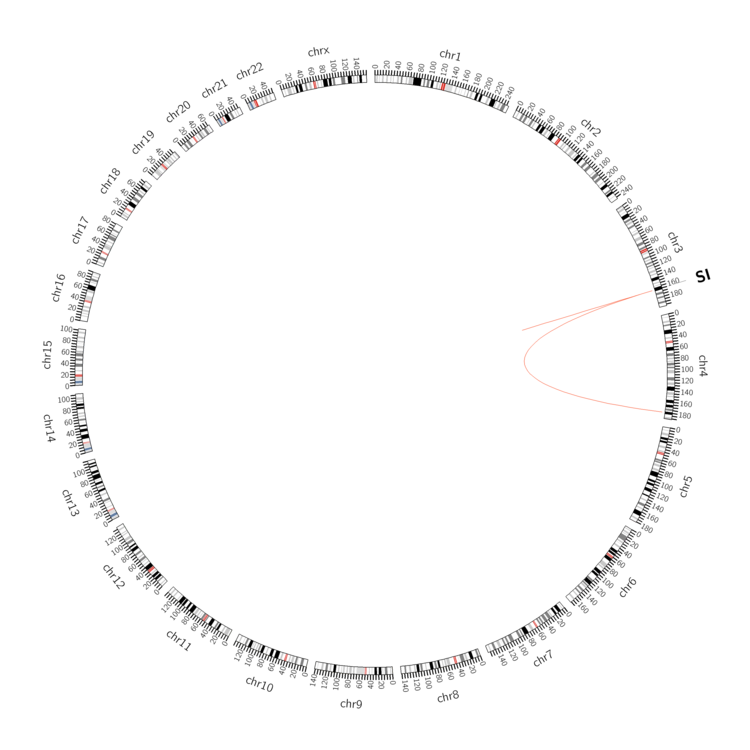 |
| - For Inter-chromosomal Variations |
| * Inter-chromosomal variantions includes 'interchromosomal amplicon to amplicon', 'interchromosomal amplicon to non-amplified dna', 'interchromosomal insertion', 'Interchromosomal unknown type'. |
 |
| - For Intra-chromosomal Variations |
| * Intra-chromosomal variantions includes 'intrachromosomal amplicon to amplicon', 'intrachromosomal amplicon to non-amplified dna', 'intrachromosomal deletion', 'intrachromosomal fold-back inversion', 'intrachromosomal inversion', 'intrachromosomal tandem duplication', 'Intrachromosomal unknown type', 'intrachromosomal with inverted orientation', 'intrachromosomal with non-inverted orientation'. |
 |
| Sample | Symbol_a | Chr_a | Start_a | End_a | Symbol_b | Chr_b | Start_b | End_b |
| pancreas | SI | chr3 | 164768063 | 164768263 | SI | chr3 | 164761867 | 164762067 |
| cf) Tissue number; Tissue name (1;Breast, 2;Central_nervous_system, 3;Haematopoietic_and_lymphoid_tissue, 4;Large_intestine, 5;Liver, 6;Lung, 7;Ovary, 8;Pancreas, 9;Prostate, 10;Skin, 11;Soft_tissue, 12;Upper_aerodigestive_tract) |
| * From mRNA Sanger sequences, Chitars2.0 arranged chimeric transcripts. This table shows SI related fusion information. |
| ID | Head Gene | Tail Gene | Accession | Gene_a | qStart_a | qEnd_a | Chromosome_a | tStart_a | tEnd_a | Gene_a | qStart_a | qEnd_a | Chromosome_a | tStart_a | tEnd_a |
| BF907120 | SI | 241 | 269 | 3 | 164723644 | 164723672 | IFIH1 | 269 | 374 | 2 | 163128764 | 163128869 | |
| Top |
| Mutation type/ Tissue ID | brca | cns | cerv | endome | haematopo | kidn | Lintest | liver | lung | ns | ovary | pancre | prost | skin | stoma | thyro | urina | |||
| Total # sample | 1 | 1 | ||||||||||||||||||
| GAIN (# sample) | 1 | |||||||||||||||||||
| LOSS (# sample) | 1 |
| cf) Tissue ID; Tissue type (1; Breast, 2; Central_nervous_system, 3; Cervix, 4; Endometrium, 5; Haematopoietic_and_lymphoid_tissue, 6; Kidney, 7; Large_intestine, 8; Liver, 9; Lung, 10; NS, 11; Ovary, 12; Pancreas, 13; Prostate, 14; Skin, 15; Stomach, 16; Thyroid, 17; Urinary_tract) |
| Top |
|
 |
| Top |
| Stat. for Non-Synonymous SNVs (# total SNVs=416) | (# total SNVs=62) |
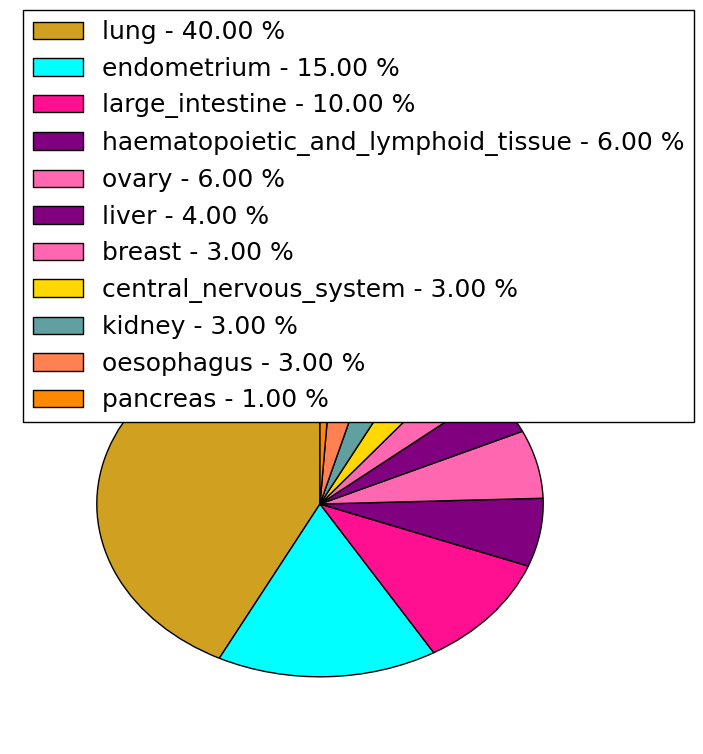 | 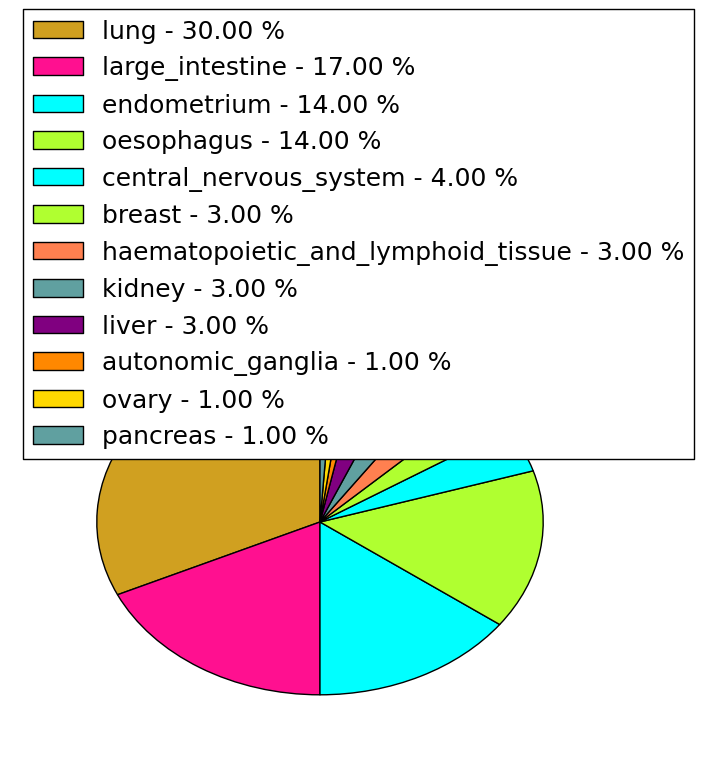 |
(# total SNVs=3) | (# total SNVs=4) |
 |  |
| Top |
| * When you move the cursor on each content, you can see more deailed mutation information on the Tooltip. Those are primary_site,primary_histology,mutation(aa),pubmedID. |
| GRCh37 position | Mutation(aa) | Unique sampleID count |
| chr3:164737556-164737556 | p.W1086* | 10 |
| chr3:164786967-164786967 | p.R91T | 5 |
| chr3:164737500-164737500 | p.R1105C | 4 |
| chr3:164783091-164783091 | p.W255* | 4 |
| chr3:164767590-164767590 | p.P529L | 4 |
| chr3:164785145-164785145 | p.K206K | 4 |
| chr3:164764781-164764781 | p.P579S | 4 |
| chr3:164735642-164735642 | p.T1180T | 3 |
| chr3:164741402-164741402 | p.R1019C | 3 |
| chr3:164727117-164727117 | p.E1377* | 3 |
| Top |
|
 |
| Point Mutation/ Tissue ID | 1 | 2 | 3 | 4 | 5 | 6 | 7 | 8 | 9 | 10 | 11 | 12 | 13 | 14 | 15 | 16 | 17 | 18 | 19 | 20 |
| # sample | 7 | 8 | 1 | 26 | 4 | 34 | 12 | 2 | 73 | 35 | 13 | 1 | 61 | 22 | 1 | 28 | ||||
| # mutation | 7 | 8 | 1 | 28 | 4 | 40 | 12 | 2 | 98 | 45 | 13 | 1 | 82 | 27 | 1 | 65 | ||||
| nonsynonymous SNV | 5 | 7 | 1 | 21 | 2 | 30 | 10 | 2 | 78 | 42 | 13 | 65 | 17 | 56 | ||||||
| synonymous SNV | 2 | 1 | 7 | 2 | 10 | 2 | 20 | 3 | 1 | 17 | 10 | 1 | 9 |
| cf) Tissue ID; Tissue type (1; BLCA[Bladder Urothelial Carcinoma], 2; BRCA[Breast invasive carcinoma], 3; CESC[Cervical squamous cell carcinoma and endocervical adenocarcinoma], 4; COAD[Colon adenocarcinoma], 5; GBM[Glioblastoma multiforme], 6; Glioma Low Grade, 7; HNSC[Head and Neck squamous cell carcinoma], 8; KICH[Kidney Chromophobe], 9; KIRC[Kidney renal clear cell carcinoma], 10; KIRP[Kidney renal papillary cell carcinoma], 11; LAML[Acute Myeloid Leukemia], 12; LUAD[Lung adenocarcinoma], 13; LUSC[Lung squamous cell carcinoma], 14; OV[Ovarian serous cystadenocarcinoma ], 15; PAAD[Pancreatic adenocarcinoma], 16; PRAD[Prostate adenocarcinoma], 17; SKCM[Skin Cutaneous Melanoma], 18:STAD[Stomach adenocarcinoma], 19:THCA[Thyroid carcinoma], 20:UCEC[Uterine Corpus Endometrial Carcinoma]) |
| Top |
| * We represented just top 10 SNVs. When you move the cursor on each content, you can see more deailed mutation information on the Tooltip. Those are primary_site, primary_histology, mutation(aa), pubmedID. |
| Genomic Position | Mutation(aa) | Unique sampleID count |
| chr3:164785145 | p.K206K | 4 |
| chr3:164783108 | p.R250C | 3 |
| chr3:164786619 | p.G125A | 3 |
| chr3:164785146 | p.K206R | 3 |
| chr3:164730802 | p.R940I | 2 |
| chr3:164785148 | p.L1458L | 2 |
| chr3:164786518 | p.E937K | 2 |
| chr3:164764781 | p.N1790N | 2 |
| chr3:164786616 | p.E1304K | 2 |
| chr3:164732915 | p.V126A | 2 |
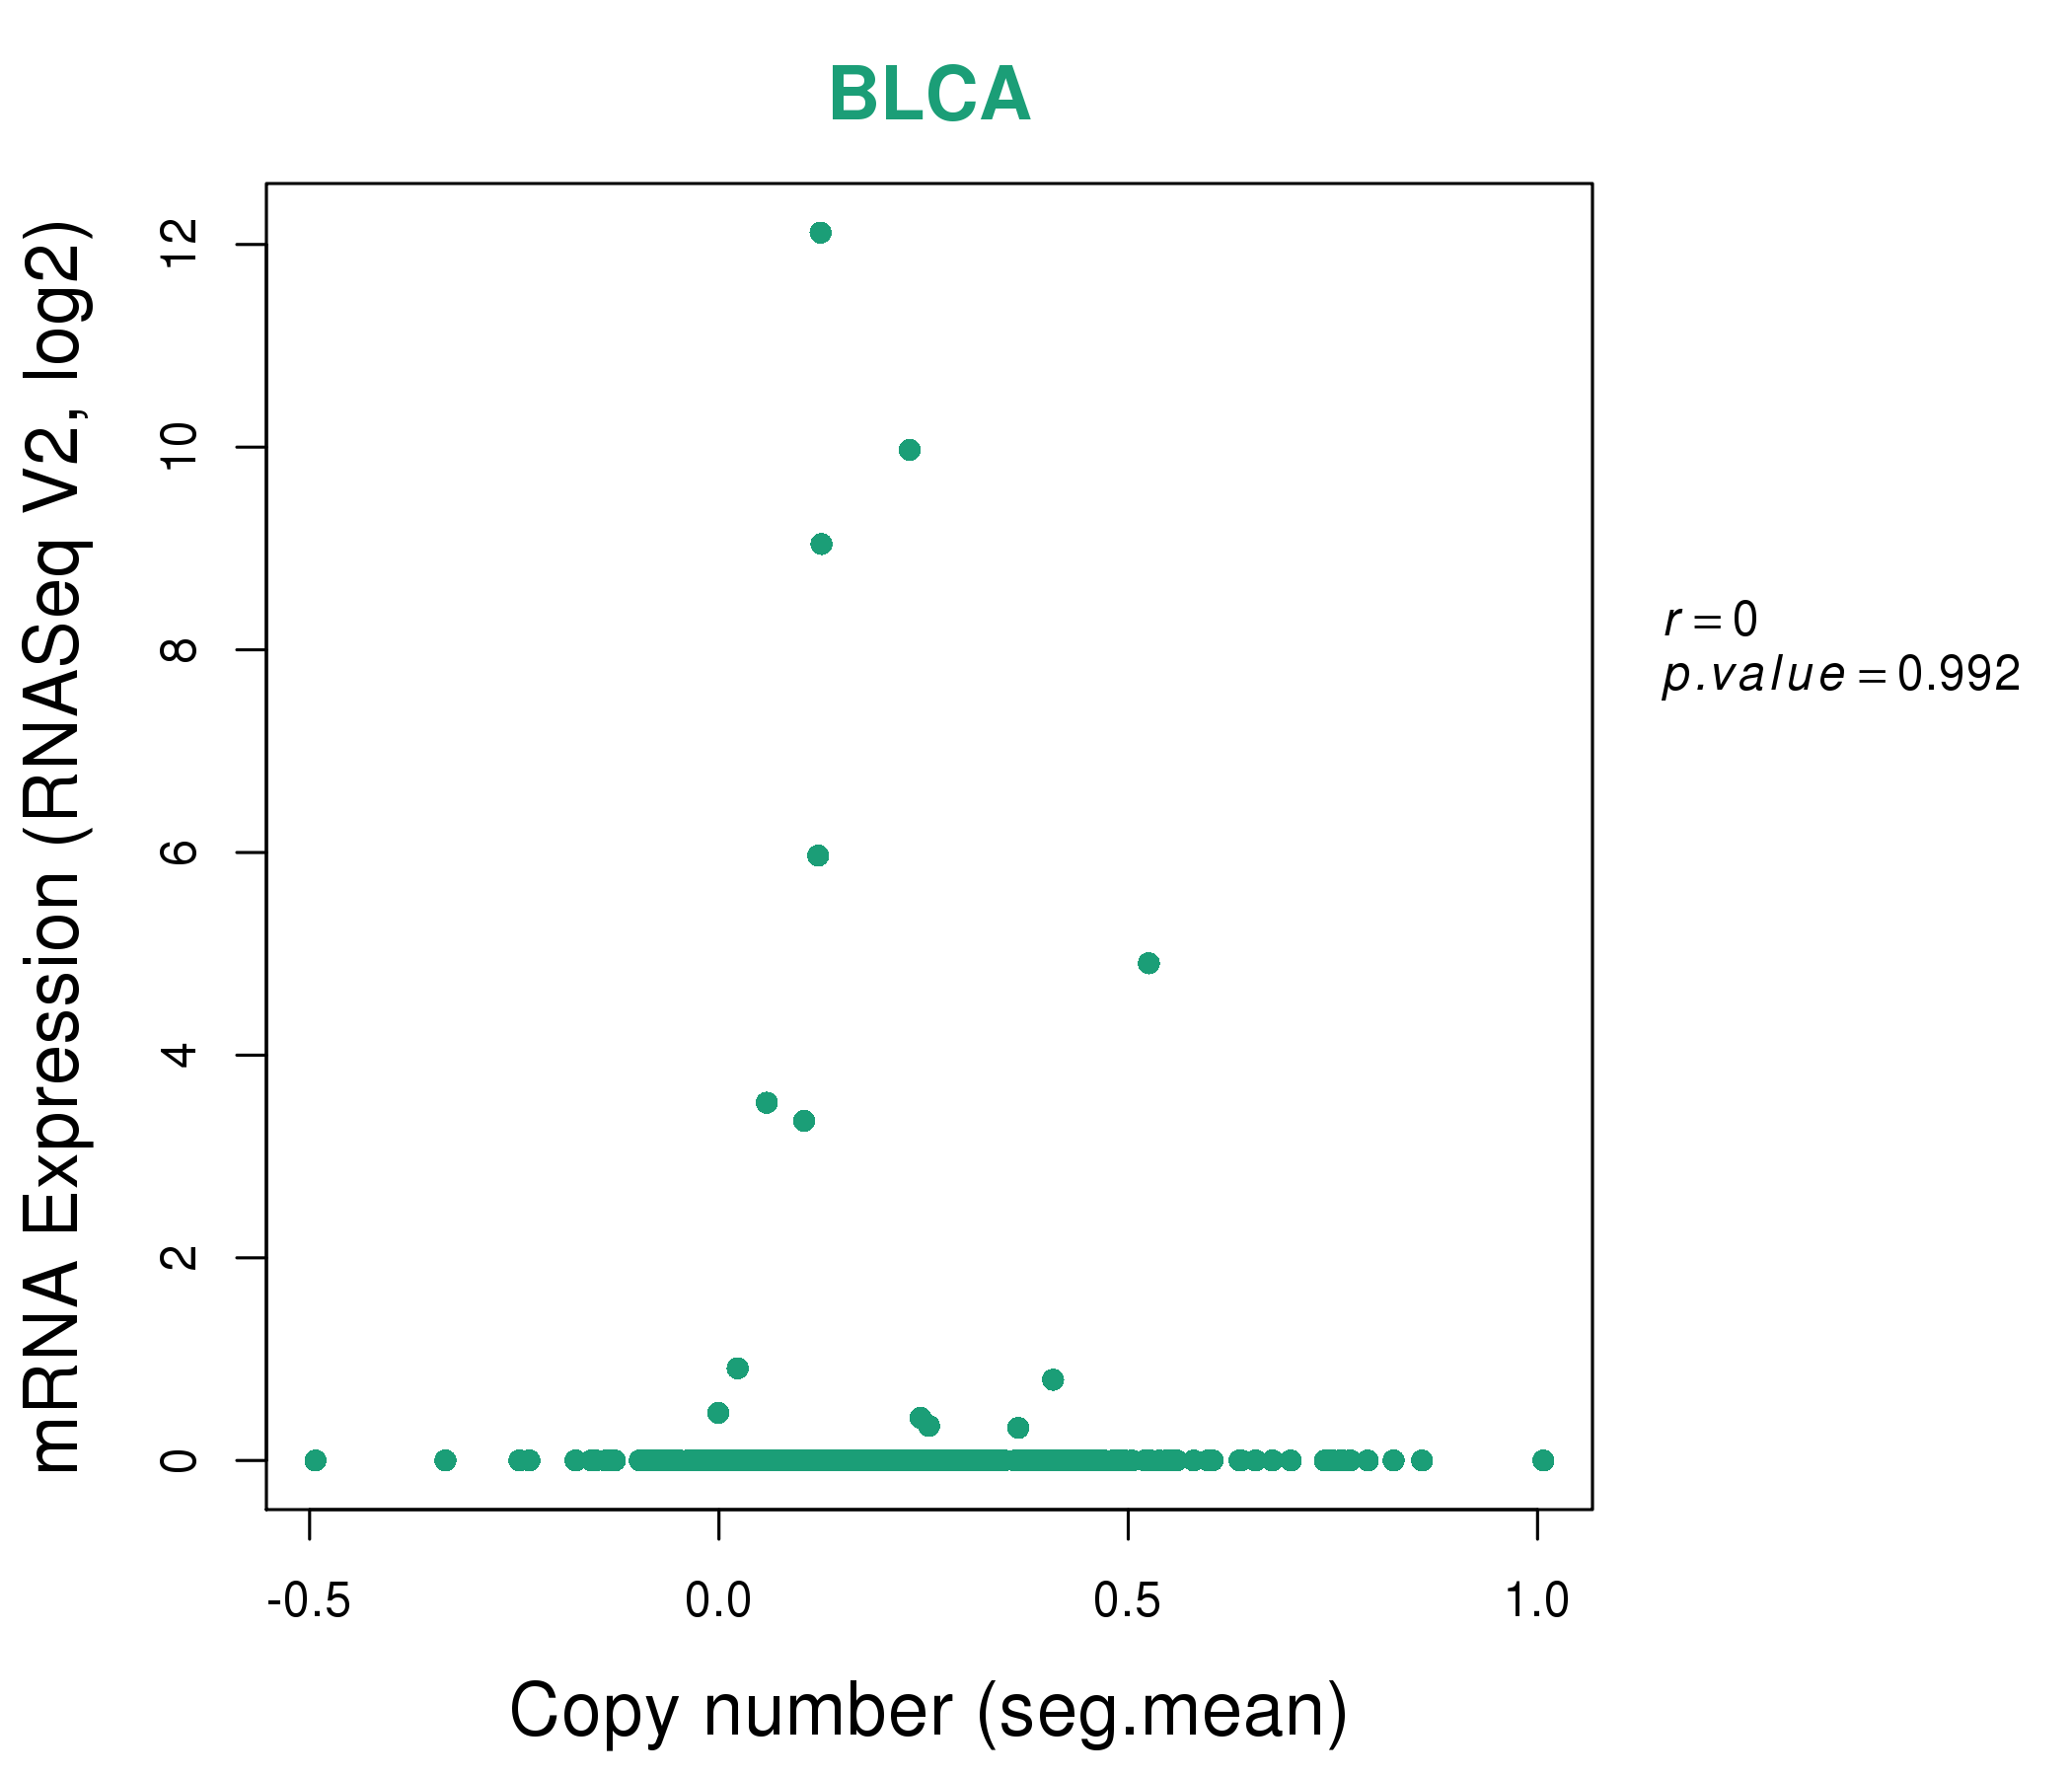
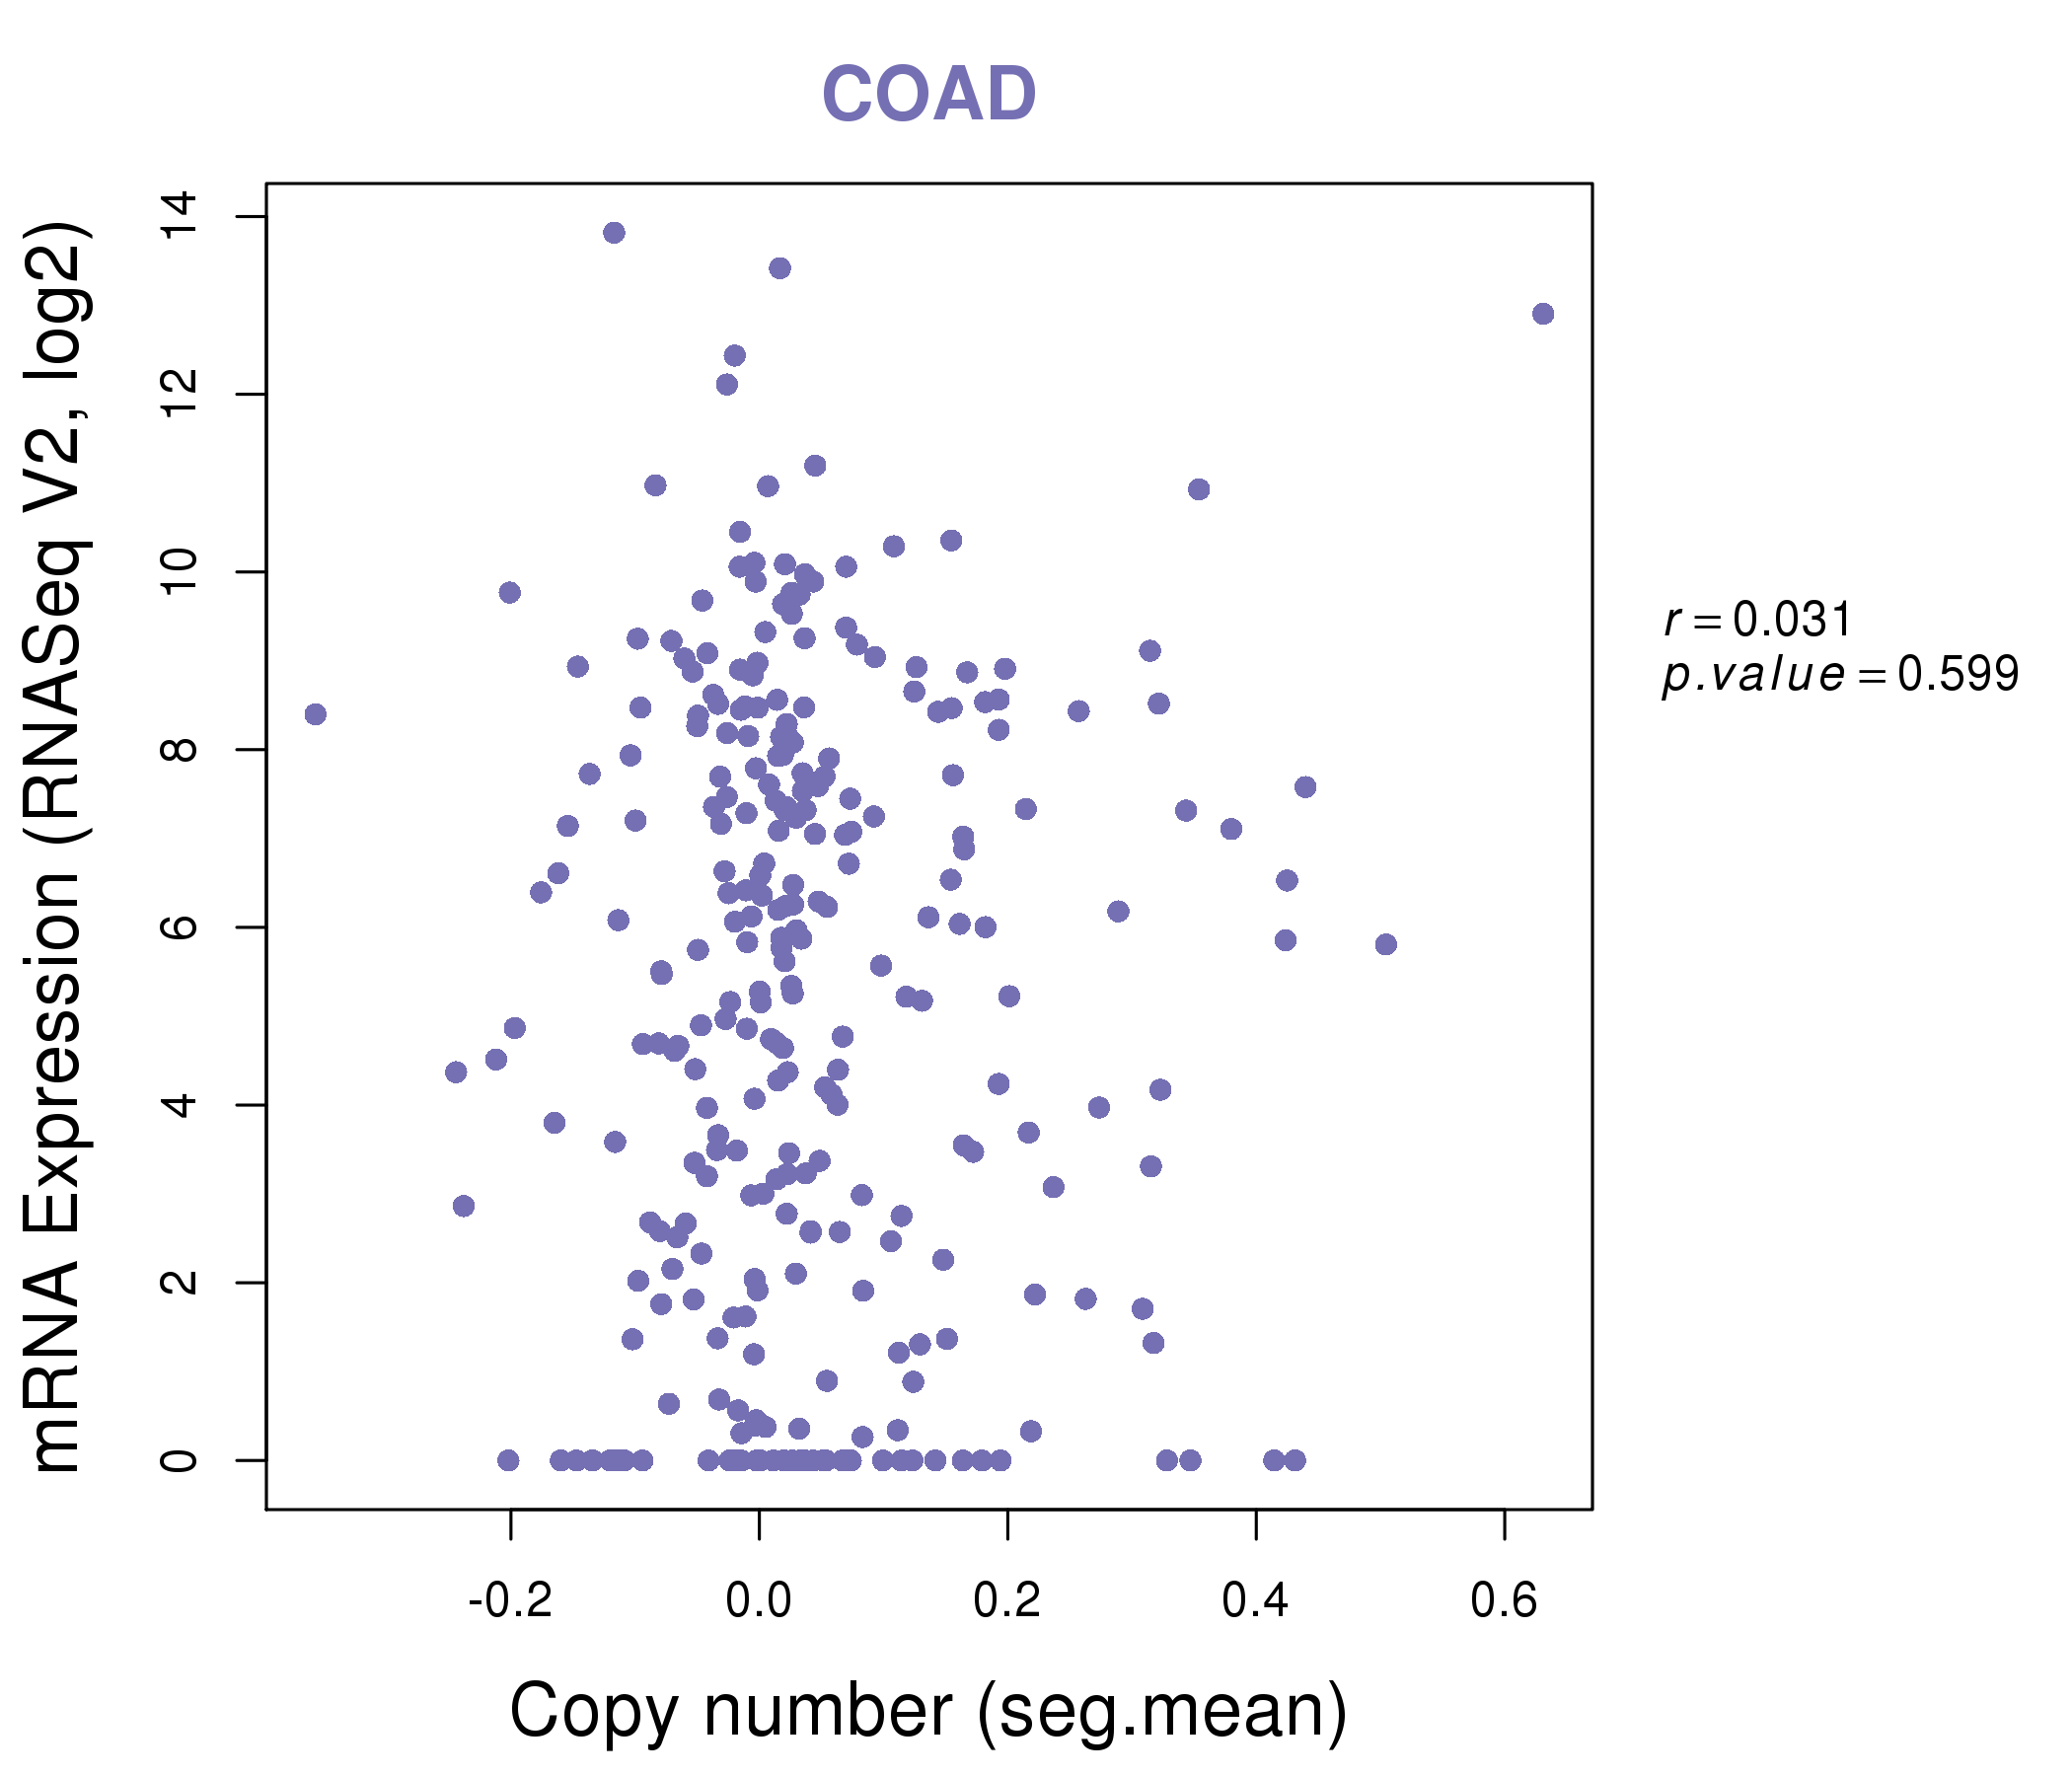
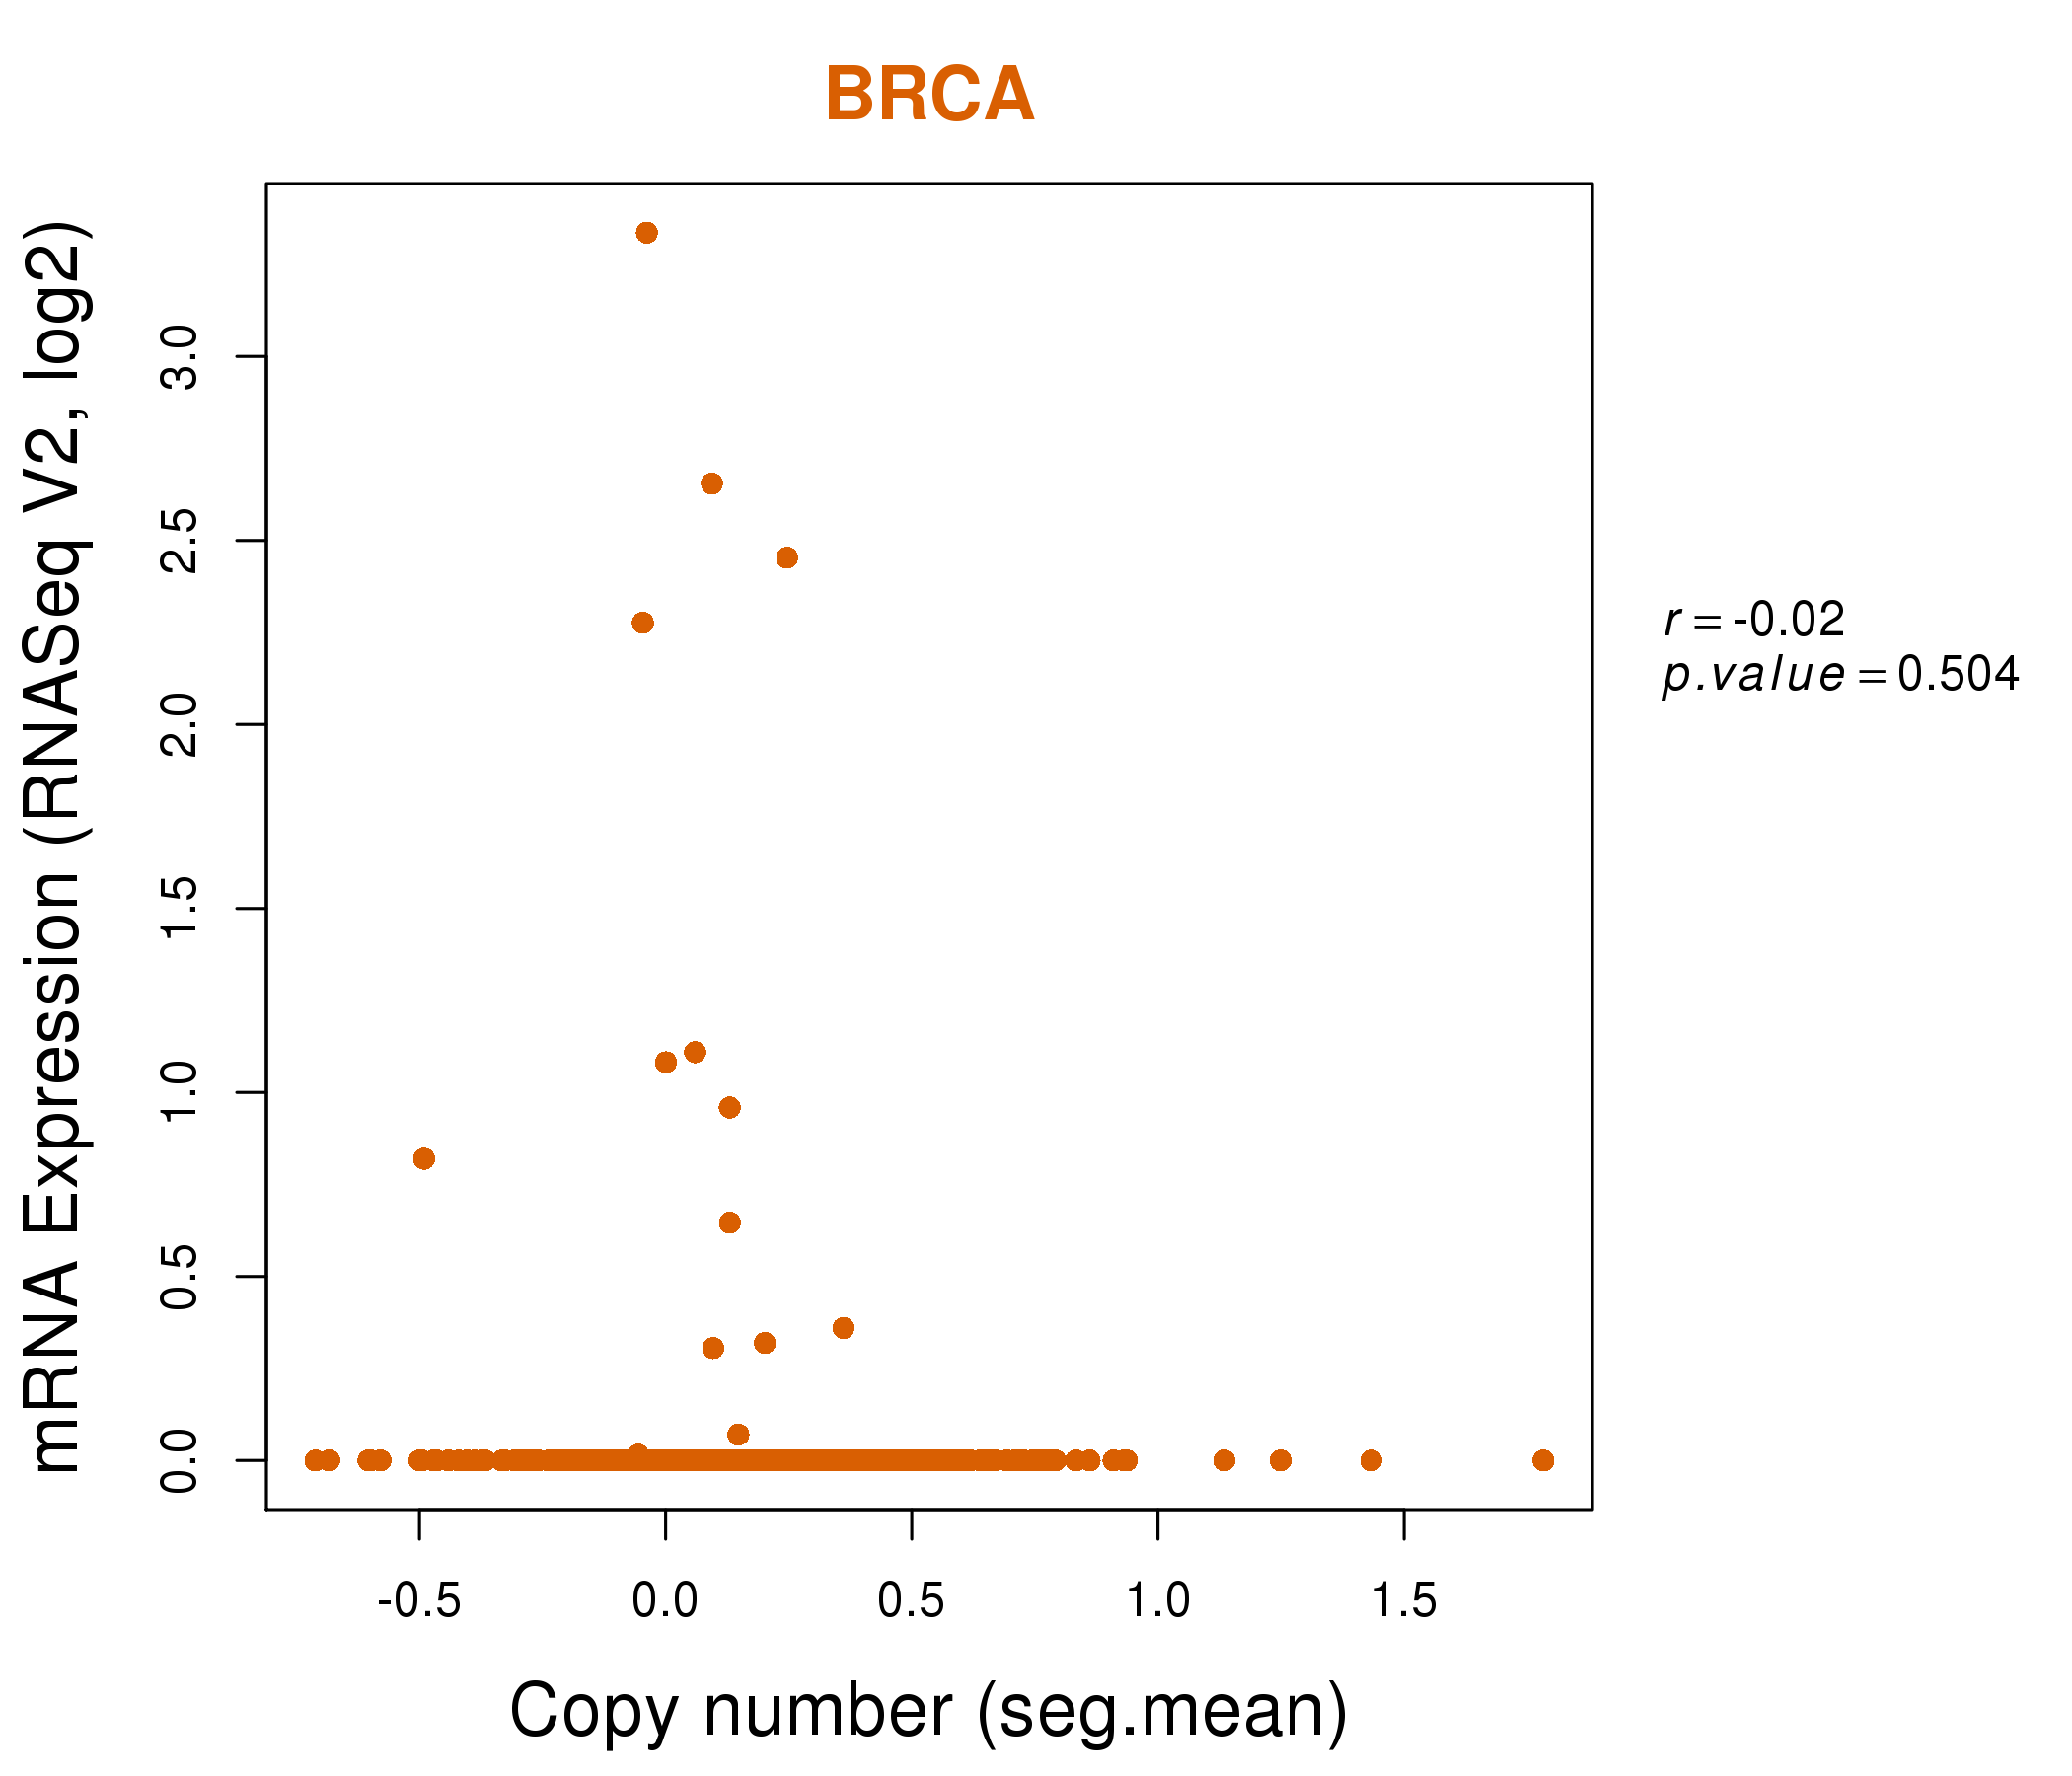
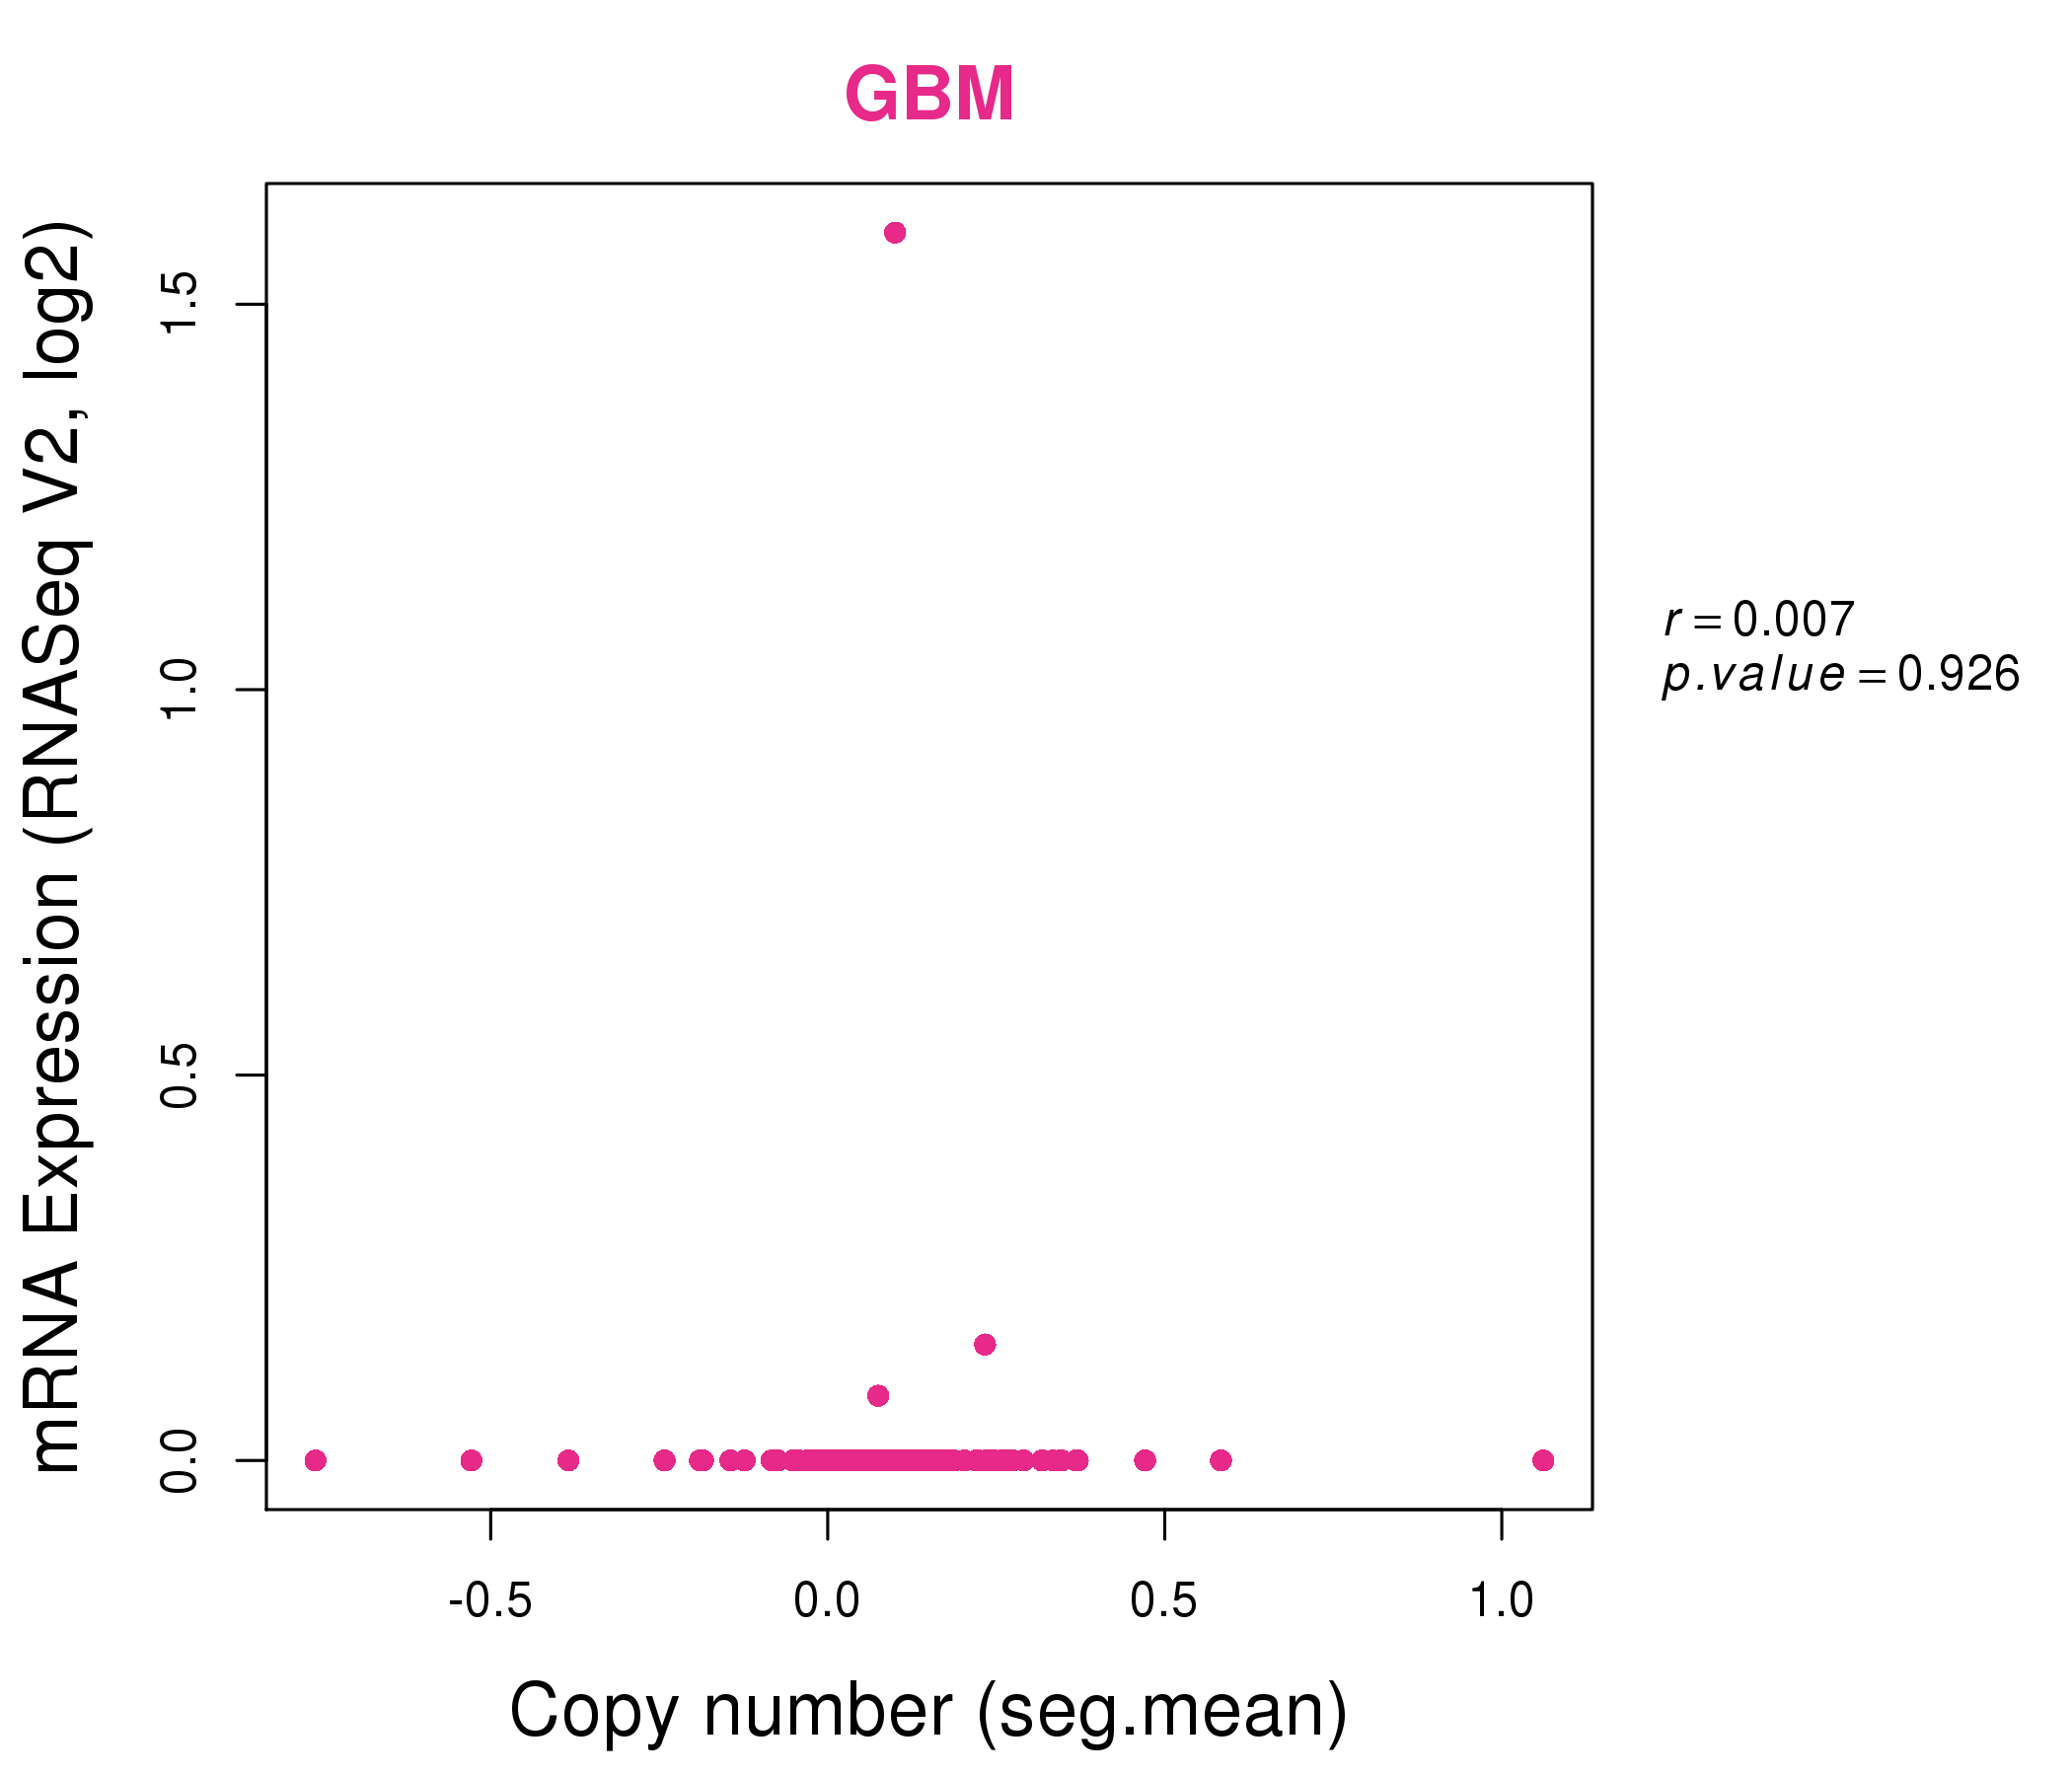
| * Copy number data were extracted from TCGA using R package TCGA-Assembler. The URLs of all public data files on TCGA DCC data server were gathered on Jan-05-2015. Function ProcessCNAData in TCGA-Assembler package was used to obtain gene-level copy number value which is calculated as the average copy number of the genomic region of a gene. |
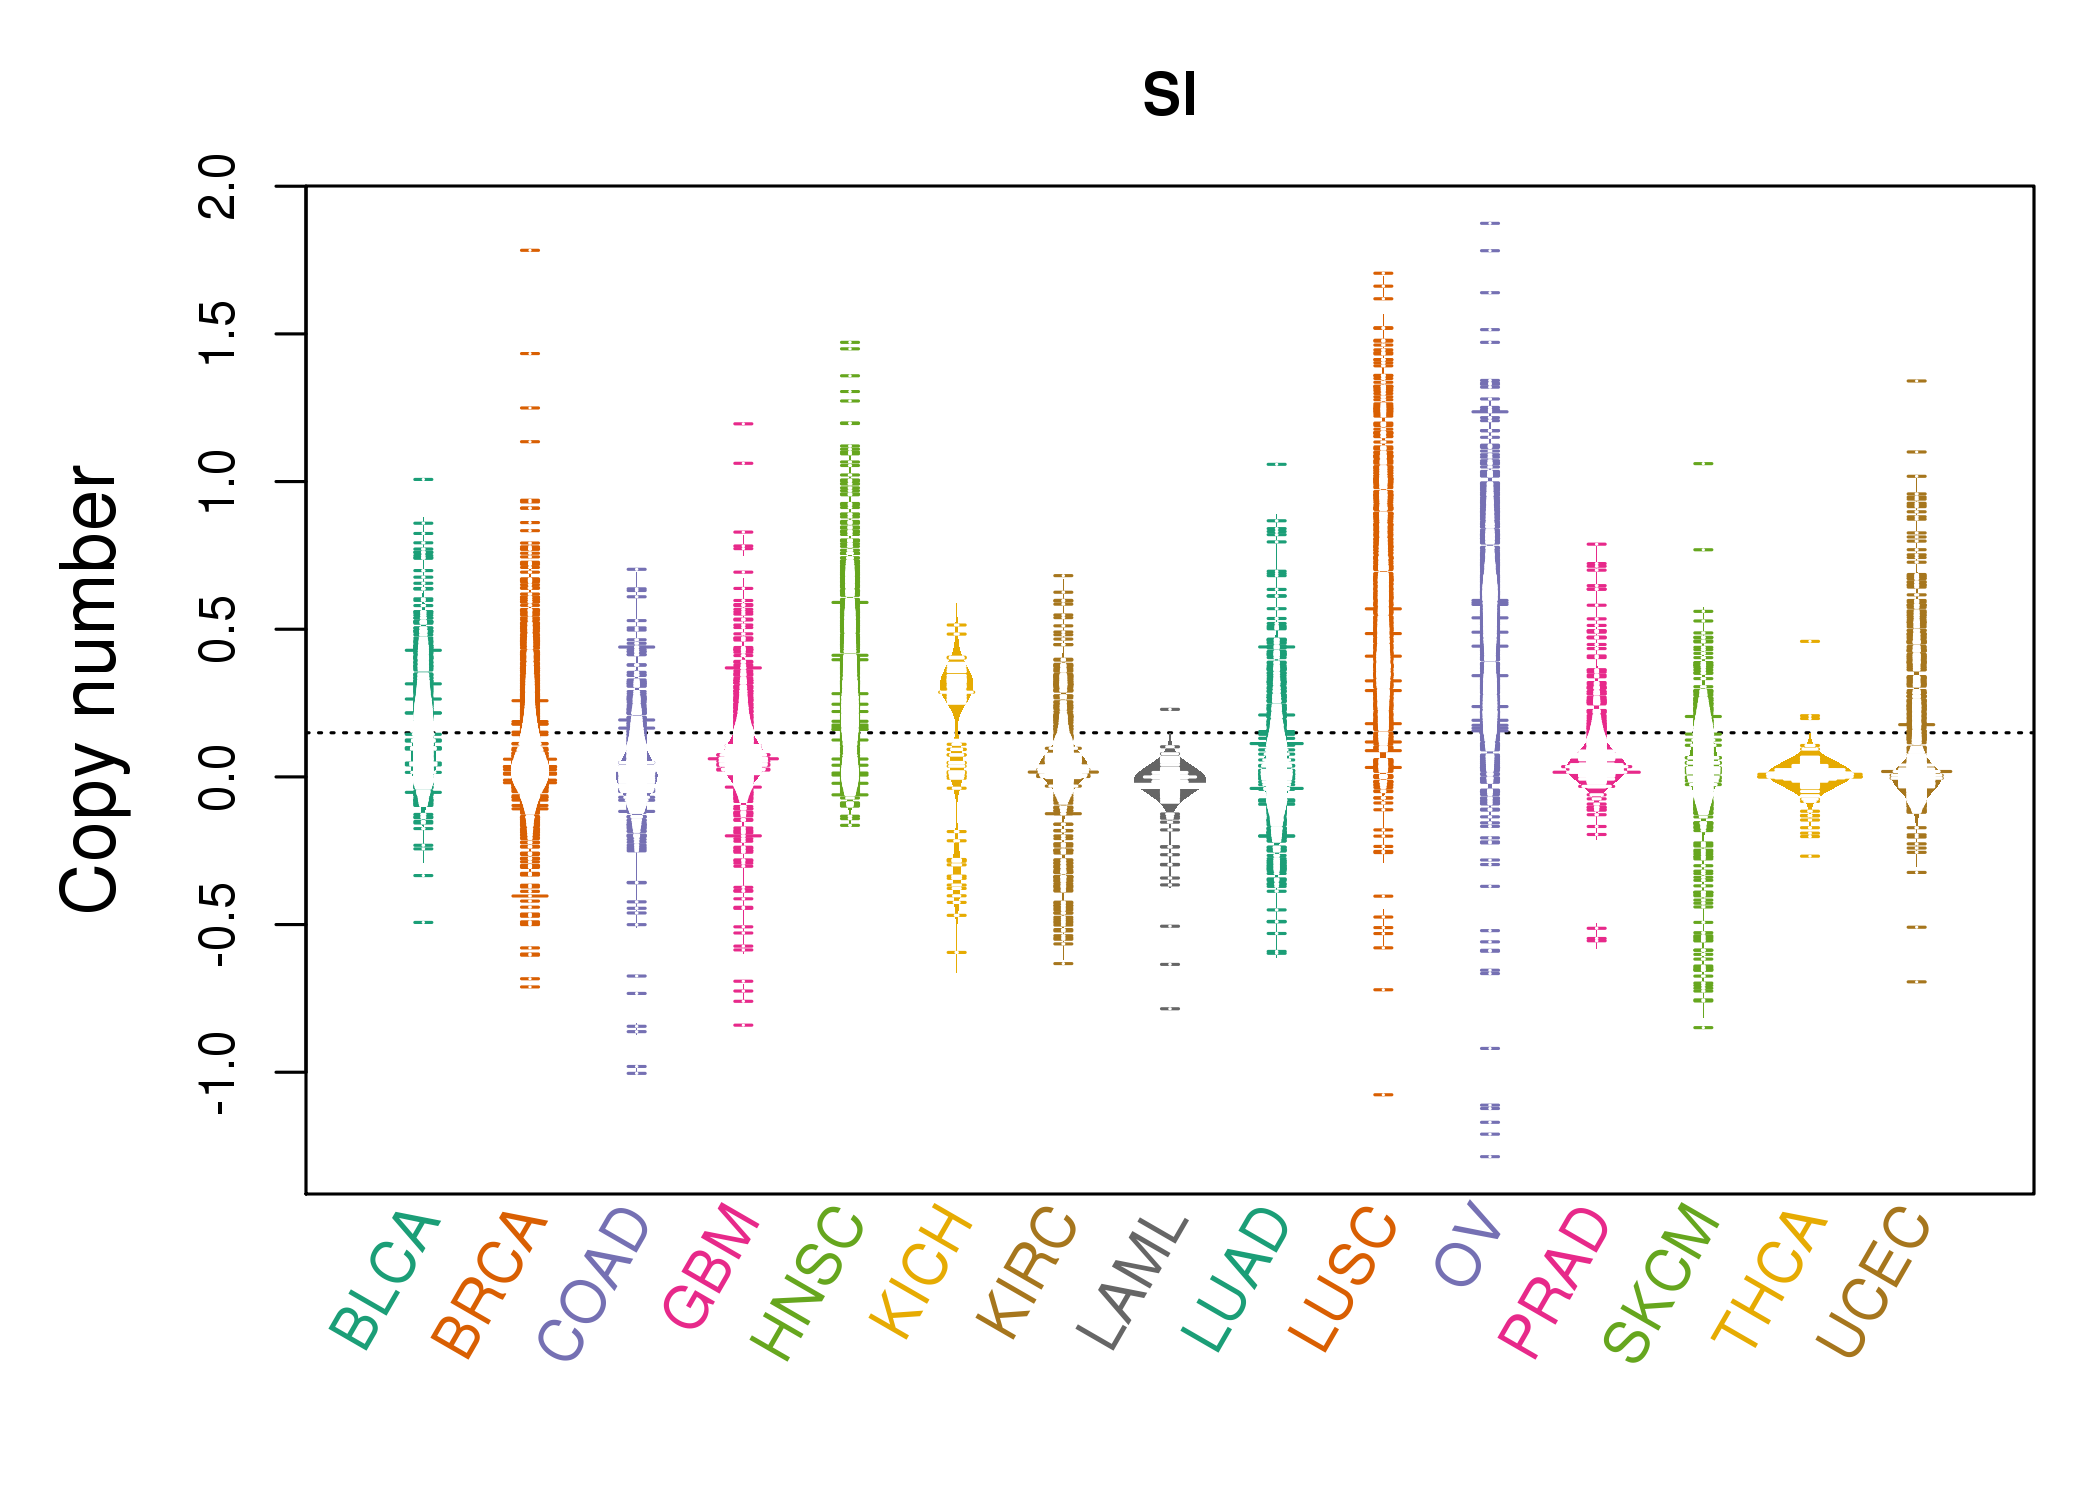 |
| cf) Tissue ID[Tissue type]: BLCA[Bladder Urothelial Carcinoma], BRCA[Breast invasive carcinoma], CESC[Cervical squamous cell carcinoma and endocervical adenocarcinoma], COAD[Colon adenocarcinoma], GBM[Glioblastoma multiforme], Glioma Low Grade, HNSC[Head and Neck squamous cell carcinoma], KICH[Kidney Chromophobe], KIRC[Kidney renal clear cell carcinoma], KIRP[Kidney renal papillary cell carcinoma], LAML[Acute Myeloid Leukemia], LUAD[Lung adenocarcinoma], LUSC[Lung squamous cell carcinoma], OV[Ovarian serous cystadenocarcinoma ], PAAD[Pancreatic adenocarcinoma], PRAD[Prostate adenocarcinoma], SKCM[Skin Cutaneous Melanoma], STAD[Stomach adenocarcinoma], THCA[Thyroid carcinoma], UCEC[Uterine Corpus Endometrial Carcinoma] |
| Top |
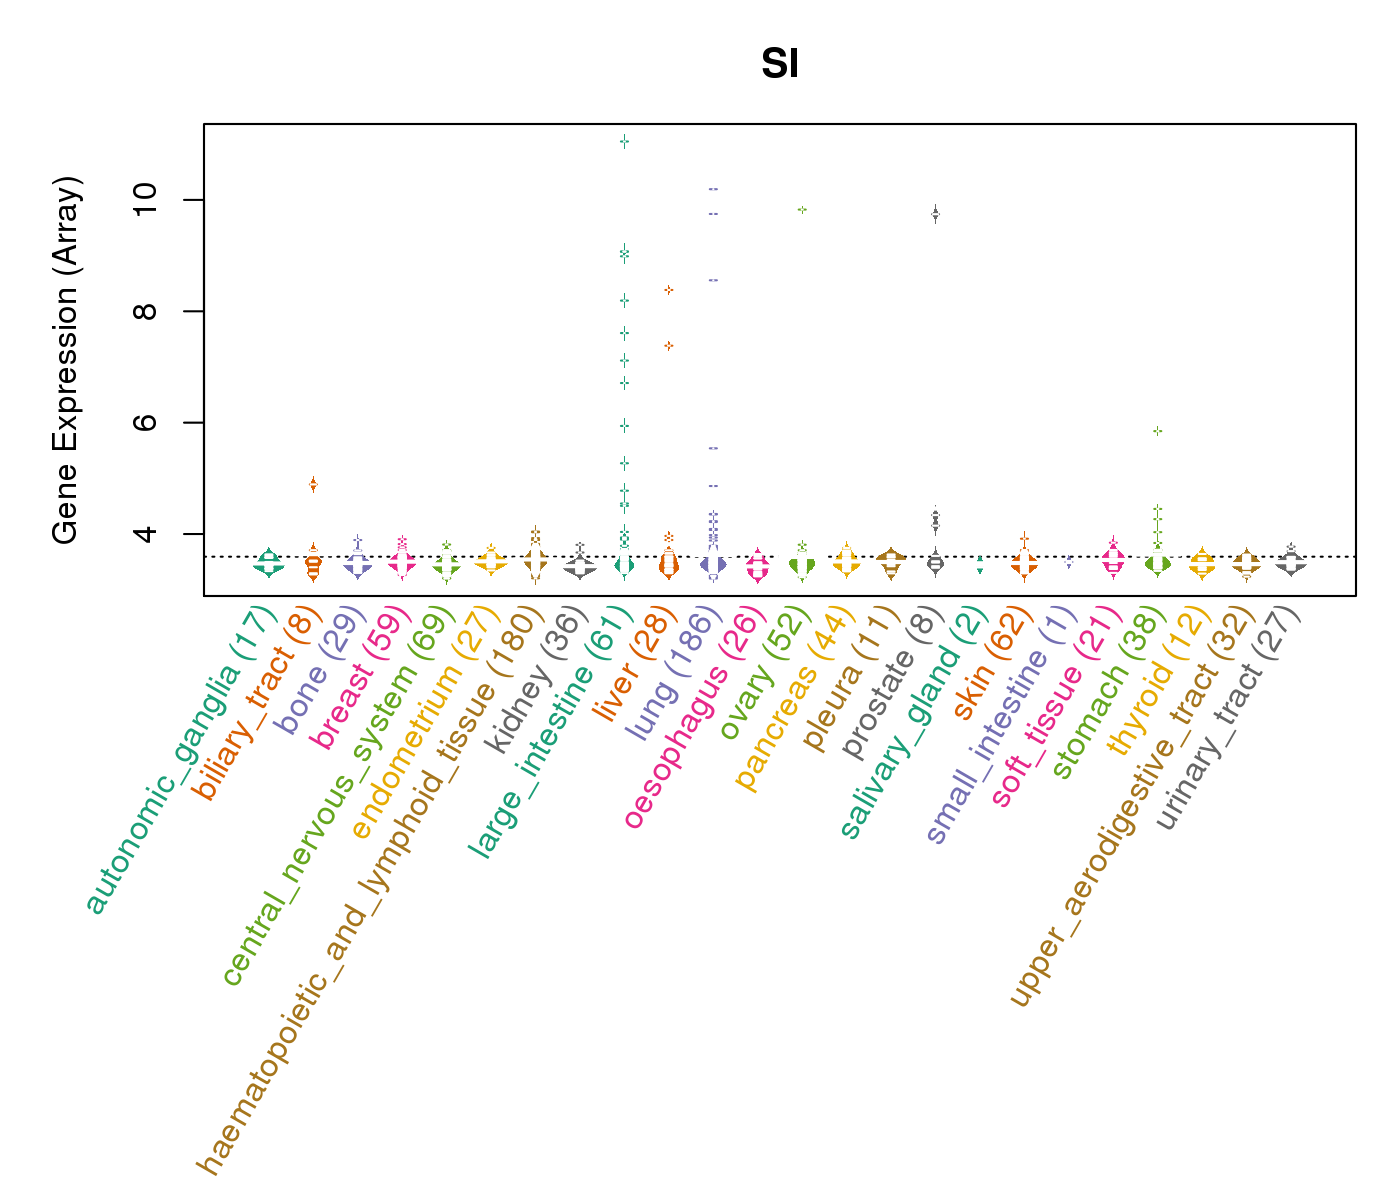
| Gene Expression for SI |
| * CCLE gene expression data were extracted from CCLE_Expression_Entrez_2012-10-18.res: Gene-centric RMA-normalized mRNA expression data. |
 |
| * Normalized gene expression data of RNASeqV2 was extracted from TCGA using R package TCGA-Assembler. The URLs of all public data files on TCGA DCC data server were gathered at Jan-05-2015. Only eight cancer types have enough normal control samples for differential expression analysis. (t test, adjusted p<0.05 (using Benjamini-Hochberg FDR)) |
 |
| Top |
| * This plots show the correlation between CNV and gene expression. |
: Open all plots for all cancer types
 |
|
 |
|
| Top |
| Gene-Gene Network Information |
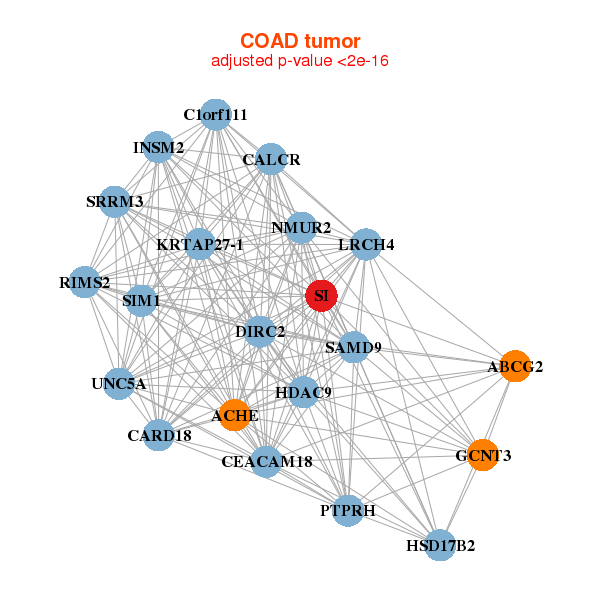
| * Co-Expression network figures were drawn using R package igraph. Only the top 20 genes with the highest correlations were shown. Red circle: input gene, orange circle: cell metabolism gene, sky circle: other gene |
: Open all plots for all cancer types
 |
| ||||
| AKAP8,ANO8,BRD4,C19orf44,CC2D1A,CCDC130,CHERP, DCAF15,DDA1,ELL,GTPBP3,MAU2,MED26,MRI1, MYO9B,RFX1,SIN3B,TSSK6,TYK2,WIZ,YJEFN3 | ABCC10,ANKRD11,CEP164,CUL9,GIGYF1,MAU2,ZSWIM8, LENG8,MAPK8IP3,MBD1,MINK1,MYO15B,NEURL4,NISCH, PGS1,RTEL1,SIN3B,TAF1C,TUBGCP6,ZNF335,ZNF646 | ||||
 |
| ||||
| AKAP8L,BRD4,SOGA1,CCDC130,COLQ,CRTC1,CUL9, DOCK6,ELL,MAU2,MLLT1,MYO9B,NISCH,PKD1, PPP1R12C,SEMA6C,SIN3B,SYNGAP1,TYK2,WIZ,ZNF333 | ASXL1,ATXN2,PRRC2B,CEP164,CHD6,CRAMP1L,GIGYF1, INTS3,L3MBTL1,LZTR1,NISCH,OBSCN,PPT2,SETD5, SFSWAP,SIN3B,SSH1,SYNGAP1,ZC3H7B,ZDHHC8,ZNF142 |

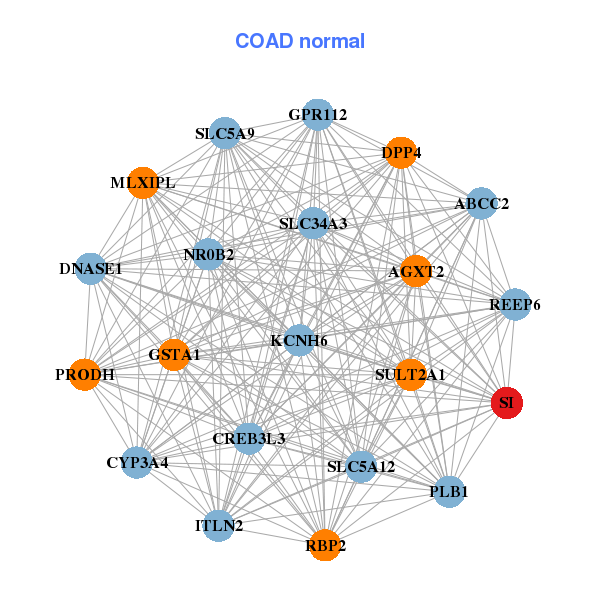
| * Co-Expression network figures were drawn using R package igraph. Only the top 20 genes with the highest correlations were shown. Red circle: input gene, orange circle: cell metabolism gene, sky circle: other gene |
: Open all plots for all cancer types
| Top |
: Open all interacting genes' information including KEGG pathway for all interacting genes from DAVID
| Top |
| Pharmacological Information for SI |
| DB Category | DB Name | DB's ID and Url link |
| Chemistry | BindingDB | P14410; -. |
| Chemistry | ChEMBL | CHEMBL2748; -. |
| Organism-specific databases | PharmGKB | PA35758; -. |
| Organism-specific databases | CTD | 6476; -. |
| * Gene Centered Interaction Network. |
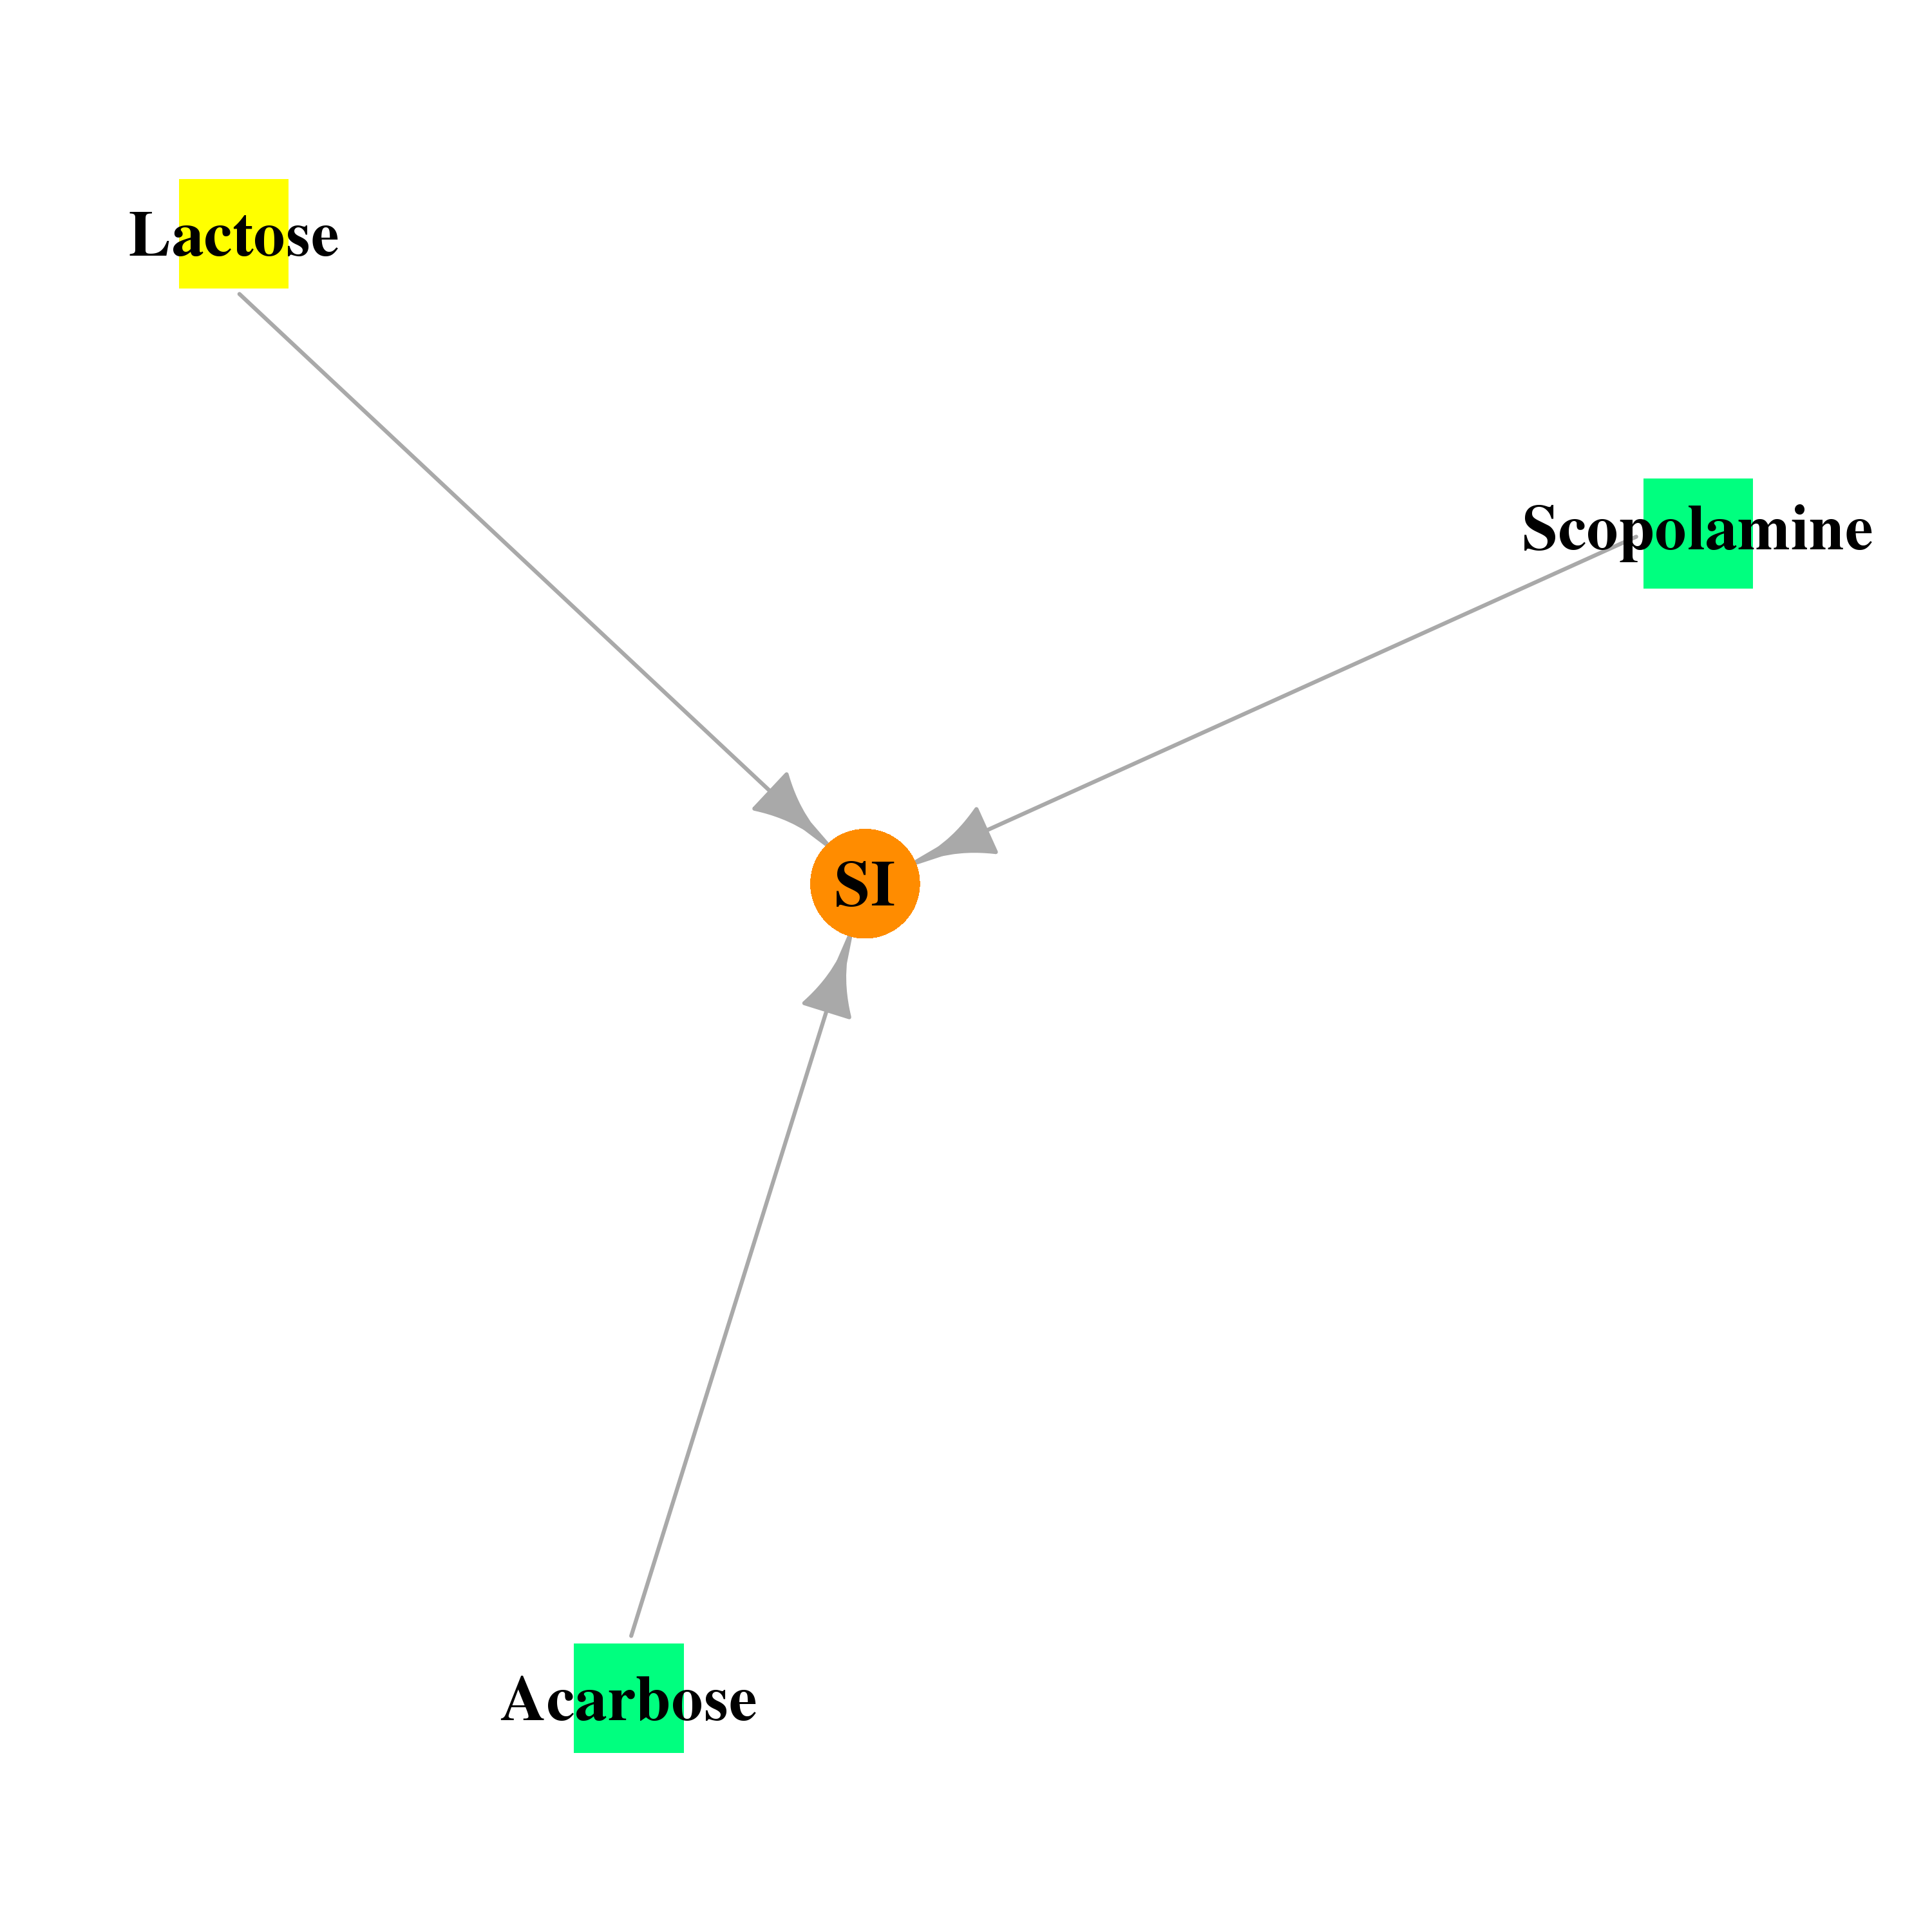 |
| * Drug Centered Interaction Network. |
| DrugBank ID | Target Name | Drug Groups | Generic Name | Drug Centered Network | Drug Structure |
| DB00284 | sucrase-isomaltase (alpha-glucosidase) | approved; investigational | Acarbose |  |  |
| DB00747 | sucrase-isomaltase (alpha-glucosidase) | approved | Scopolamine | 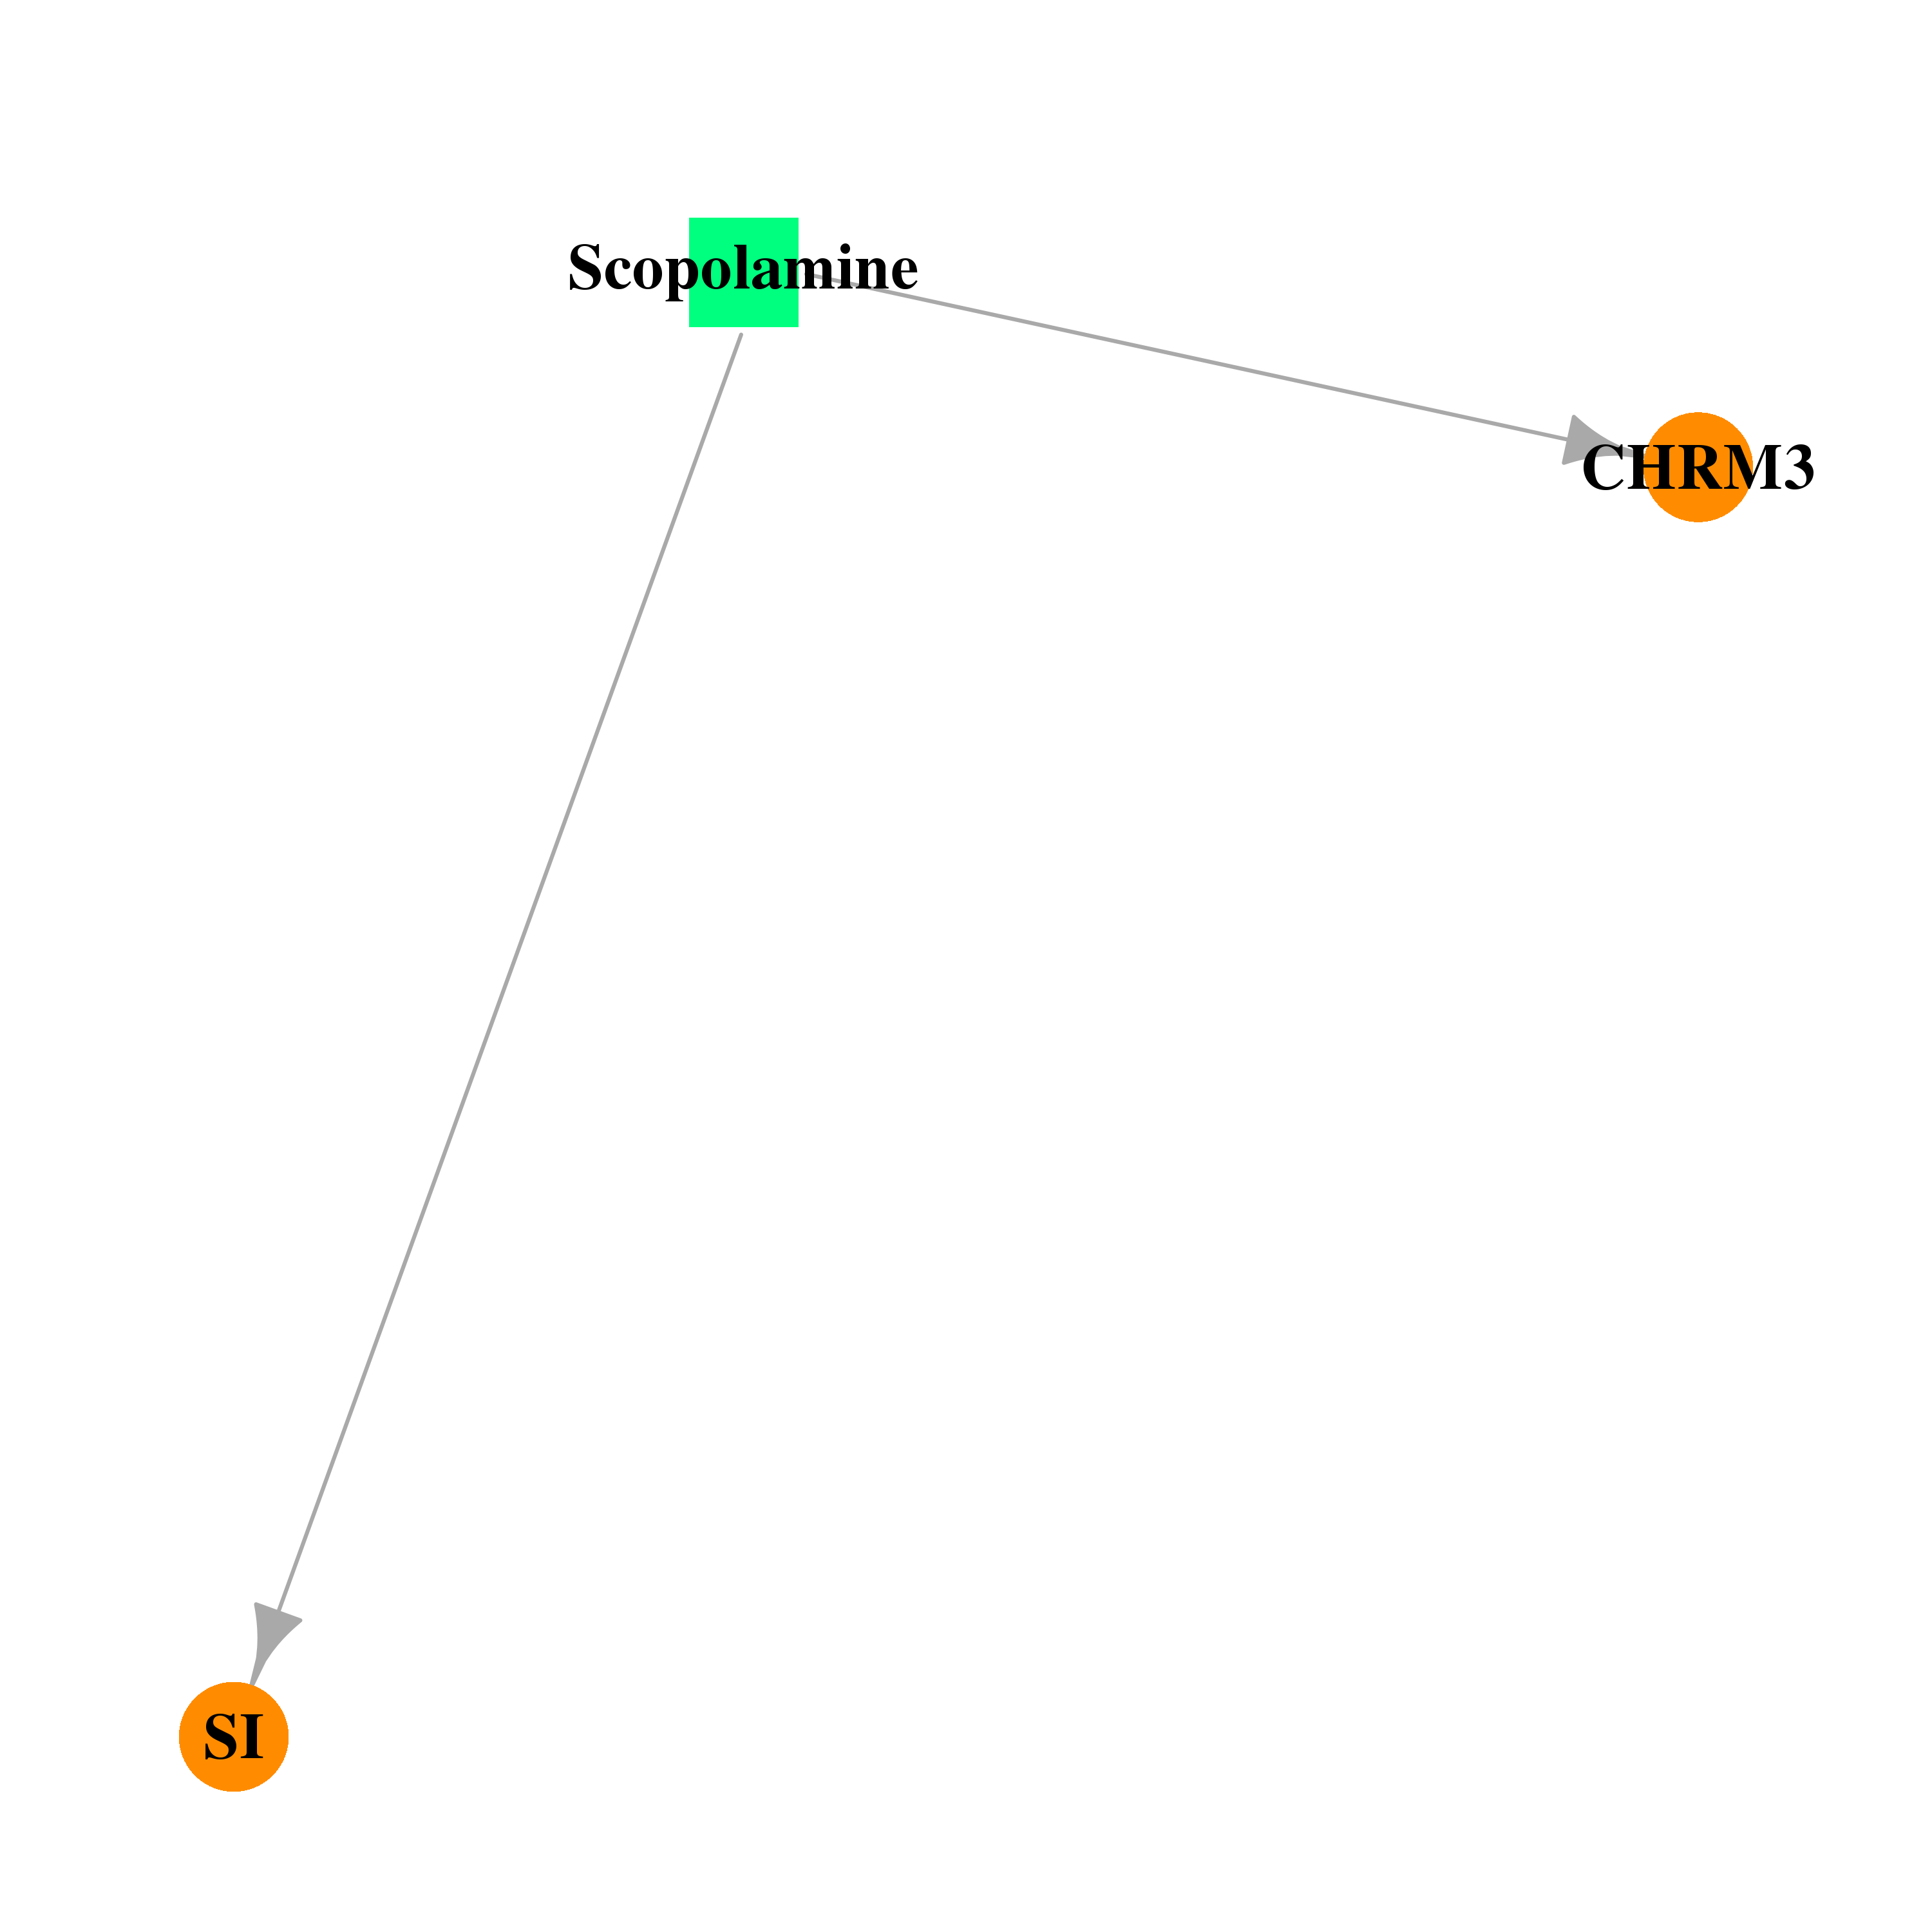 |  |
| DB04465 | sucrase-isomaltase (alpha-glucosidase) | experimental | Lactose |  |  |
| Top |
| Cross referenced IDs for SI |
| * We obtained these cross-references from Uniprot database. It covers 150 different DBs, 18 categories. http://www.uniprot.org/help/cross_references_section |
: Open all cross reference information
|
Copyright © 2016-Present - The Univsersity of Texas Health Science Center at Houston @ |