|
||||||||||||||||||||
| |
| Phenotypic Information (metabolism pathway, cancer, disease, phenome) |
| |
| |
| Gene-Gene Network Information: Co-Expression Network, Interacting Genes & KEGG |
| |
|


| Gene Summary for IPPK |
| Basic gene info. | Gene symbol | IPPK |
| Gene name | inositol 1,3,4,5,6-pentakisphosphate 2-kinase | |
| Synonyms | C9orf12|INSP5K2|IP5K|IPK1|bA476B13.1 | |
| Cytomap | UCSC genome browser: 9q22.31 | |
| Genomic location | chr9 :95375465-95432547 | |
| Type of gene | protein-coding | |
| RefGenes | NM_022755.5, | |
| Ensembl id | ENSG00000127080 | |
| Description | IPK1 homologbA476B13.1 (novel protein)inositol-pentakisphosphate 2-kinaseins(1,3,4,5,6)P5 2-kinaseinsP5 2-kinase | |
| Modification date | 20141207 | |
| dbXrefs | HGNC : HGNC | |
| Ensembl : ENSG00000127080 | ||
| HPRD : 10799 | ||
| Vega : OTTHUMG00000020231 | ||
| Protein | UniProt: go to UniProt's Cross Reference DB Table | |
| Expression | CleanEX: HS_IPPK | |
| BioGPS: 64768 | ||
| Gene Expression Atlas: ENSG00000127080 | ||
| The Human Protein Atlas: ENSG00000127080 | ||
| Pathway | NCI Pathway Interaction Database: IPPK | |
| KEGG: IPPK | ||
| REACTOME: IPPK | ||
| ConsensusPathDB | ||
| Pathway Commons: IPPK | ||
| Metabolism | MetaCyc: IPPK | |
| HUMANCyc: IPPK | ||
| Regulation | Ensembl's Regulation: ENSG00000127080 | |
| miRBase: chr9 :95,375,465-95,432,547 | ||
| TargetScan: NM_022755 | ||
| cisRED: ENSG00000127080 | ||
| Context | iHOP: IPPK | |
| cancer metabolism search in PubMed: IPPK | ||
| UCL Cancer Institute: IPPK | ||
| Assigned class in ccmGDB | C | |
| Top |
| Phenotypic Information for IPPK(metabolism pathway, cancer, disease, phenome) |
| Cancer | CGAP: IPPK |
| Familial Cancer Database: IPPK | |
| * This gene is included in those cancer gene databases. |
|
|
|
|
|
| . | ||||||||||||||
Oncogene 1 | Significant driver gene in | |||||||||||||||||||
| cf) number; DB name 1 Oncogene; http://nar.oxfordjournals.org/content/35/suppl_1/D721.long, 2 Tumor Suppressor gene; https://bioinfo.uth.edu/TSGene/, 3 Cancer Gene Census; http://www.nature.com/nrc/journal/v4/n3/abs/nrc1299.html, 4 CancerGenes; http://nar.oxfordjournals.org/content/35/suppl_1/D721.long, 5 Network of Cancer Gene; http://ncg.kcl.ac.uk/index.php, 1Therapeutic Vulnerabilities in Cancer; http://cbio.mskcc.org/cancergenomics/statius/ |
| KEGG_INOSITOL_PHOSPHATE_METABOLISM | |
| OMIM | |
| Orphanet | |
| Disease | KEGG Disease: IPPK |
| MedGen: IPPK (Human Medical Genetics with Condition) | |
| ClinVar: IPPK | |
| Phenotype | MGI: IPPK (International Mouse Phenotyping Consortium) |
| PhenomicDB: IPPK | |
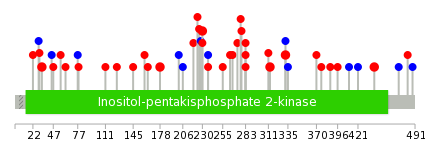
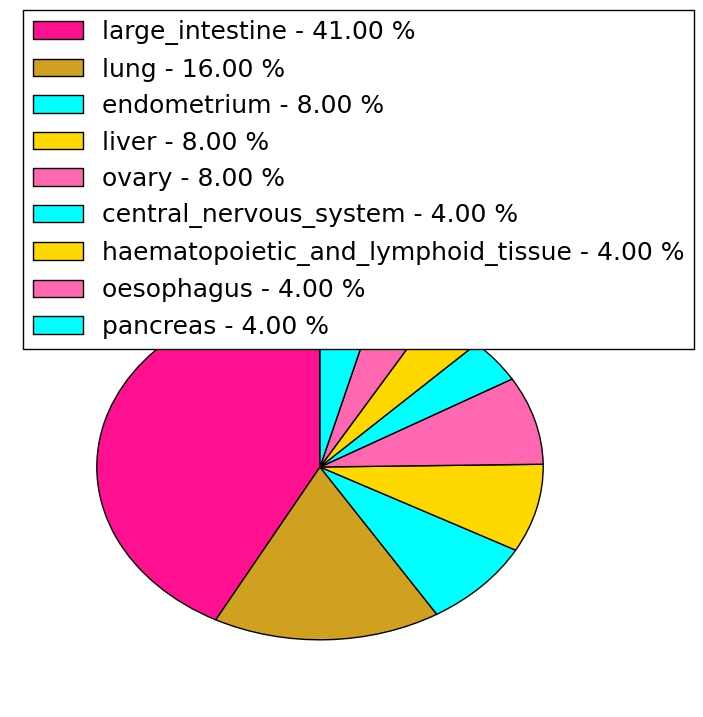
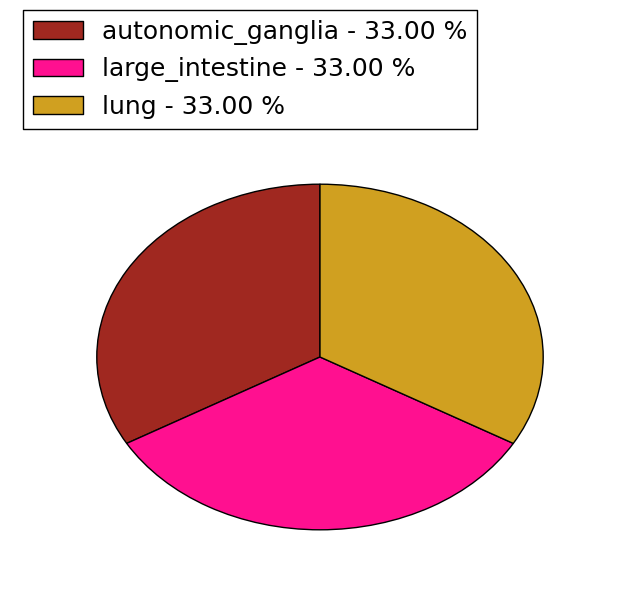
| Mutations for IPPK |
| * Under tables are showing count per each tissue to give us broad intuition about tissue specific mutation patterns.You can go to the detailed page for each mutation database's web site. |
| There's no structural variation information in COSMIC data for this gene. |
| * From mRNA Sanger sequences, Chitars2.0 arranged chimeric transcripts. This table shows IPPK related fusion information. |
| ID | Head Gene | Tail Gene | Accession | Gene_a | qStart_a | qEnd_a | Chromosome_a | tStart_a | tEnd_a | Gene_a | qStart_a | qEnd_a | Chromosome_a | tStart_a | tEnd_a |
| CF595670 | CORO2A | 5 | 67 | 9 | 100934909 | 100934971 | IPPK | 65 | 411 | 9 | 95398014 | 95415281 | |
| Top |
| There's no copy number variation information in COSMIC data for this gene. |
| Top |
|
 |
| Top |
| Stat. for Non-Synonymous SNVs (# total SNVs=24) | (# total SNVs=7) |
 |  |
(# total SNVs=3) | (# total SNVs=0) |
 |
| Top |
| * When you move the cursor on each content, you can see more deailed mutation information on the Tooltip. Those are primary_site,primary_histology,mutation(aa),pubmedID. |
| GRCh37 position | Mutation(aa) | Unique sampleID count |
| chr9:95420948-95420948 | p.R33W | 2 |
| chr9:95397513-95397513 | p.L332M | 2 |
| chr9:95378269-95378269 | p.D441H | 2 |
| chr9:95397569-95397569 | p.S313L | 2 |
| chr9:95405063-95405063 | p.S178R | 2 |
| chr9:95400352-95400352 | p.P283A | 2 |
| chr9:95400511-95400511 | p.W230R | 2 |
| chr9:95400522-95400522 | p.P226L | 1 |
| chr9:95396712-95396712 | p.L376F | 1 |
| chr9:95411734-95411734 | p.? | 1 |
| Top |
|
 |
| Point Mutation/ Tissue ID | 1 | 2 | 3 | 4 | 5 | 6 | 7 | 8 | 9 | 10 | 11 | 12 | 13 | 14 | 15 | 16 | 17 | 18 | 19 | 20 |
| # sample | 2 | 2 | 8 | 1 | 1 | 2 | 1 | 1 | 2 | 1 | 3 | 5 | 1 | |||||||
| # mutation | 2 | 2 | 7 | 1 | 1 | 2 | 1 | 1 | 2 | 1 | 3 | 7 | 2 | |||||||
| nonsynonymous SNV | 2 | 5 | 1 | 2 | 1 | 1 | 2 | 2 | 6 | 2 | ||||||||||
| synonymous SNV | 2 | 2 | 1 | 1 | 1 | 1 |
| cf) Tissue ID; Tissue type (1; BLCA[Bladder Urothelial Carcinoma], 2; BRCA[Breast invasive carcinoma], 3; CESC[Cervical squamous cell carcinoma and endocervical adenocarcinoma], 4; COAD[Colon adenocarcinoma], 5; GBM[Glioblastoma multiforme], 6; Glioma Low Grade, 7; HNSC[Head and Neck squamous cell carcinoma], 8; KICH[Kidney Chromophobe], 9; KIRC[Kidney renal clear cell carcinoma], 10; KIRP[Kidney renal papillary cell carcinoma], 11; LAML[Acute Myeloid Leukemia], 12; LUAD[Lung adenocarcinoma], 13; LUSC[Lung squamous cell carcinoma], 14; OV[Ovarian serous cystadenocarcinoma ], 15; PAAD[Pancreatic adenocarcinoma], 16; PRAD[Prostate adenocarcinoma], 17; SKCM[Skin Cutaneous Melanoma], 18:STAD[Stomach adenocarcinoma], 19:THCA[Thyroid carcinoma], 20:UCEC[Uterine Corpus Endometrial Carcinoma]) |
| Top |
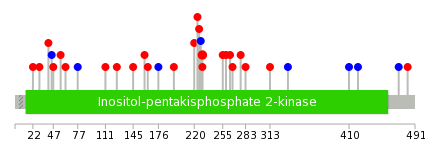
| * We represented just top 10 SNVs. When you move the cursor on each content, you can see more deailed mutation information on the Tooltip. Those are primary_site, primary_histology, mutation(aa), pubmedID. |
| Genomic Position | Mutation(aa) | Unique sampleID count |
| chr9:95400511 | p.W230R | 2 |
| chr9:95420923 | p.S45S | 1 |
| chr9:95400409 | p.A228A | 1 |
| chr9:95410357 | p.R41K | 1 |
| chr9:95420957 | p.P226L | 1 |
| chr9:95400423 | p.V30I | 1 |
| chr9:95410369 | p.E482K | 1 |
| chr9:95378146 | p.R224W | 1 |
| chr9:95432206 | p.V22A | 1 |
| chr9:95400434 | p.N471N | 1 |
| * Copy number data were extracted from TCGA using R package TCGA-Assembler. The URLs of all public data files on TCGA DCC data server were gathered on Jan-05-2015. Function ProcessCNAData in TCGA-Assembler package was used to obtain gene-level copy number value which is calculated as the average copy number of the genomic region of a gene. |
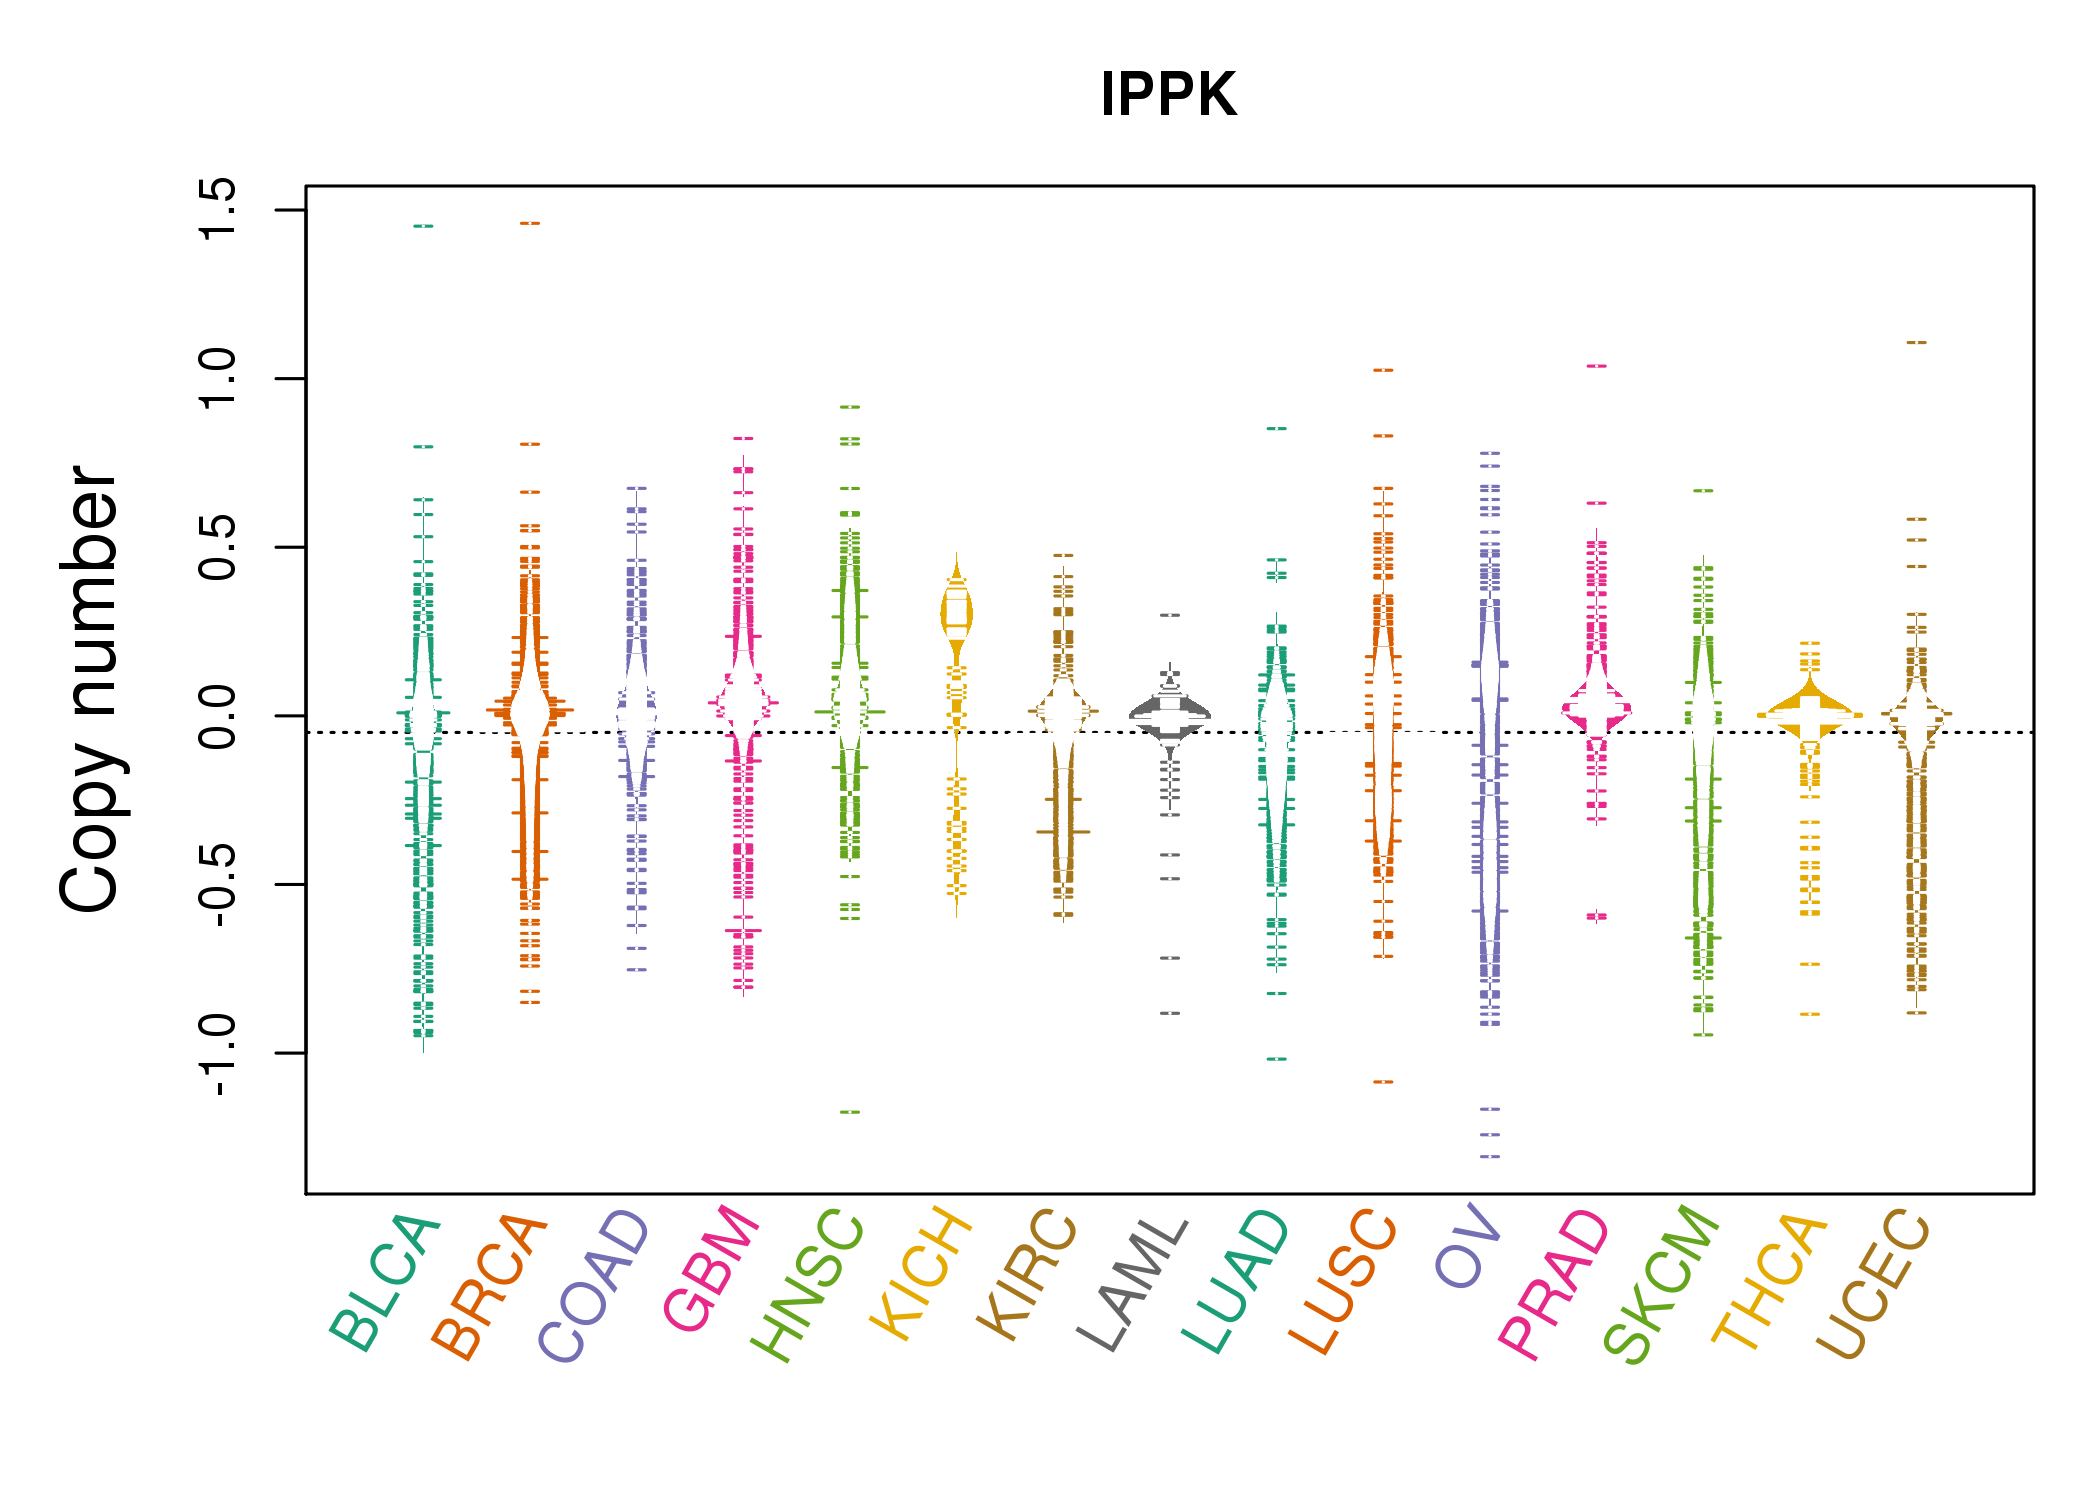 |
| cf) Tissue ID[Tissue type]: BLCA[Bladder Urothelial Carcinoma], BRCA[Breast invasive carcinoma], CESC[Cervical squamous cell carcinoma and endocervical adenocarcinoma], COAD[Colon adenocarcinoma], GBM[Glioblastoma multiforme], Glioma Low Grade, HNSC[Head and Neck squamous cell carcinoma], KICH[Kidney Chromophobe], KIRC[Kidney renal clear cell carcinoma], KIRP[Kidney renal papillary cell carcinoma], LAML[Acute Myeloid Leukemia], LUAD[Lung adenocarcinoma], LUSC[Lung squamous cell carcinoma], OV[Ovarian serous cystadenocarcinoma ], PAAD[Pancreatic adenocarcinoma], PRAD[Prostate adenocarcinoma], SKCM[Skin Cutaneous Melanoma], STAD[Stomach adenocarcinoma], THCA[Thyroid carcinoma], UCEC[Uterine Corpus Endometrial Carcinoma] |
| Top |
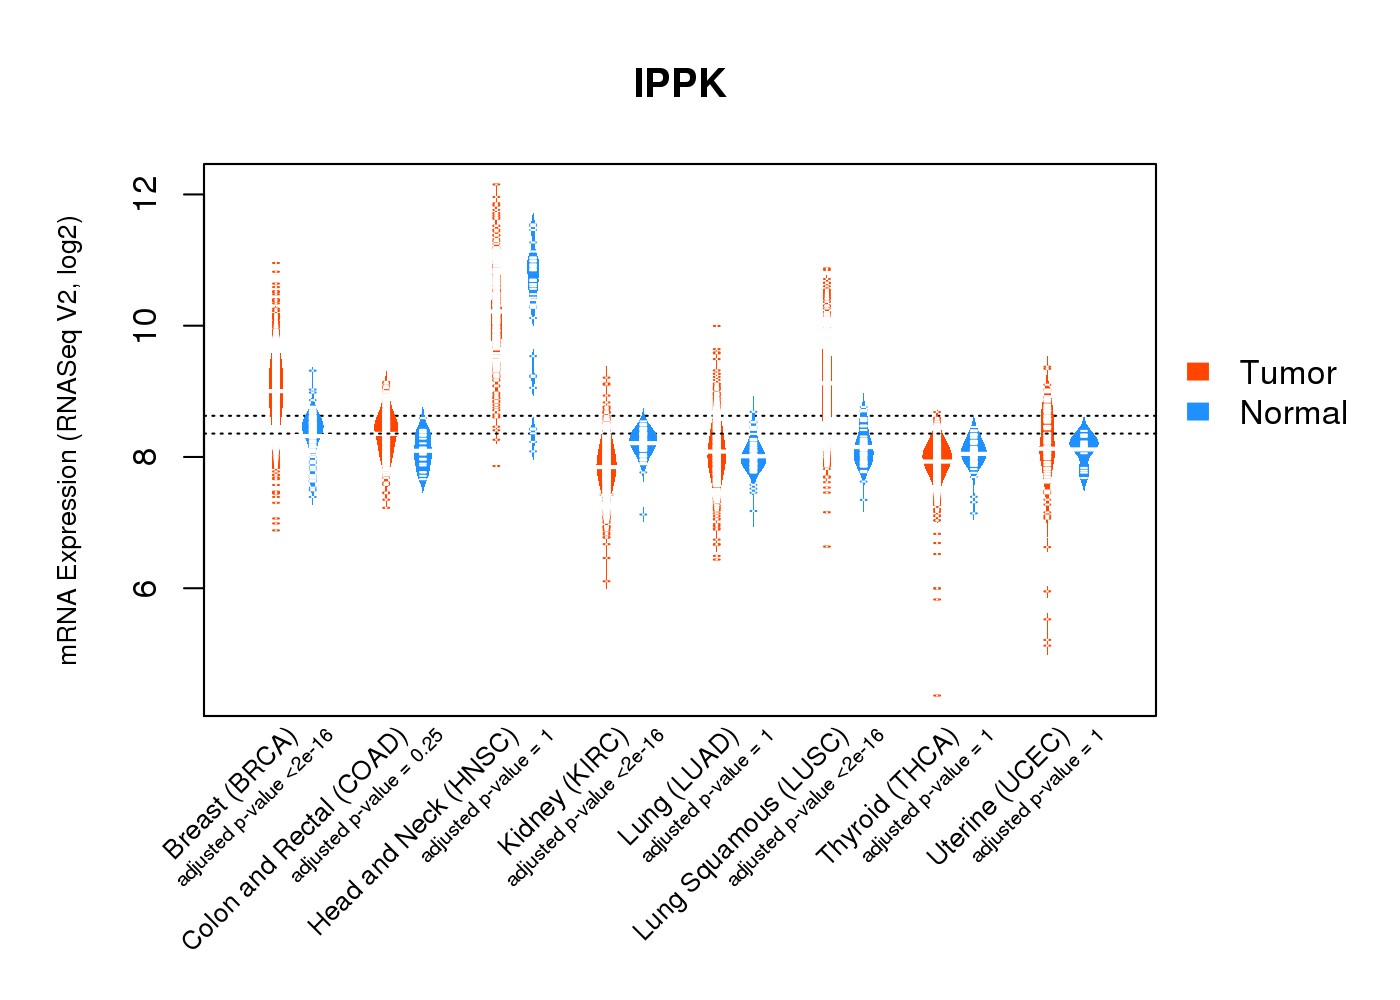
| Gene Expression for IPPK |
| * CCLE gene expression data were extracted from CCLE_Expression_Entrez_2012-10-18.res: Gene-centric RMA-normalized mRNA expression data. |
 |
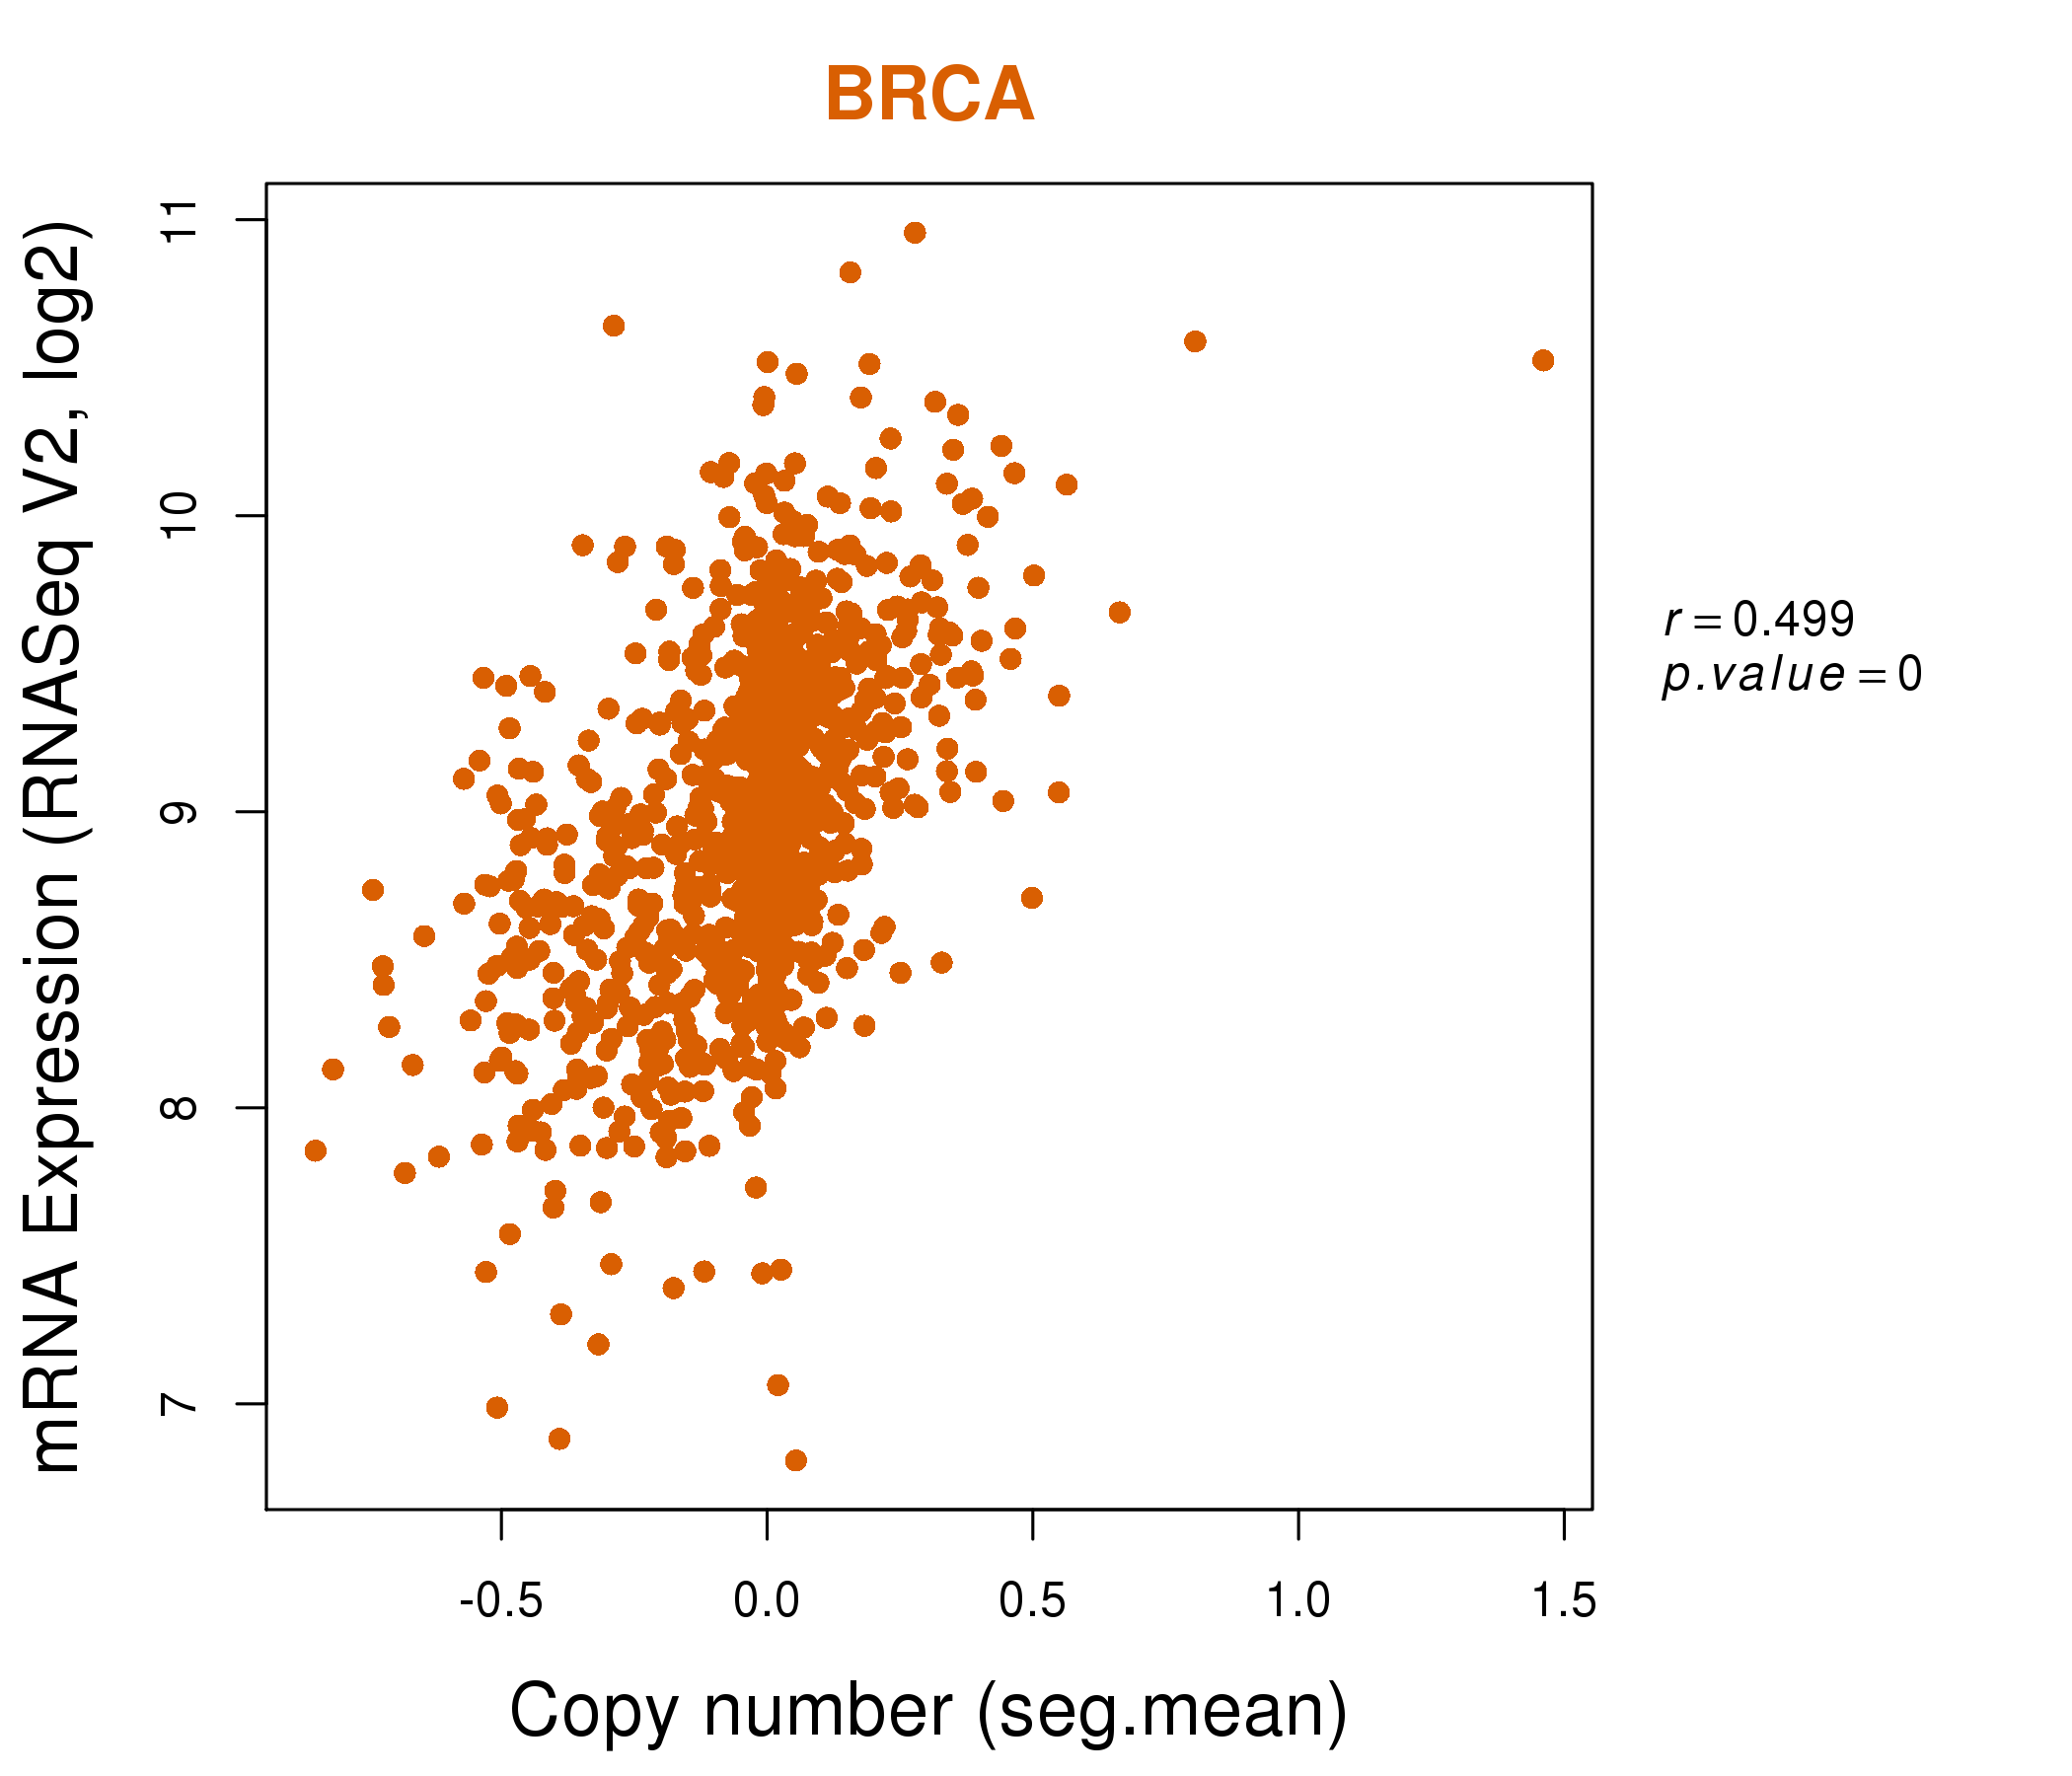
| * Normalized gene expression data of RNASeqV2 was extracted from TCGA using R package TCGA-Assembler. The URLs of all public data files on TCGA DCC data server were gathered at Jan-05-2015. Only eight cancer types have enough normal control samples for differential expression analysis. (t test, adjusted p<0.05 (using Benjamini-Hochberg FDR)) |
 |
| Top |
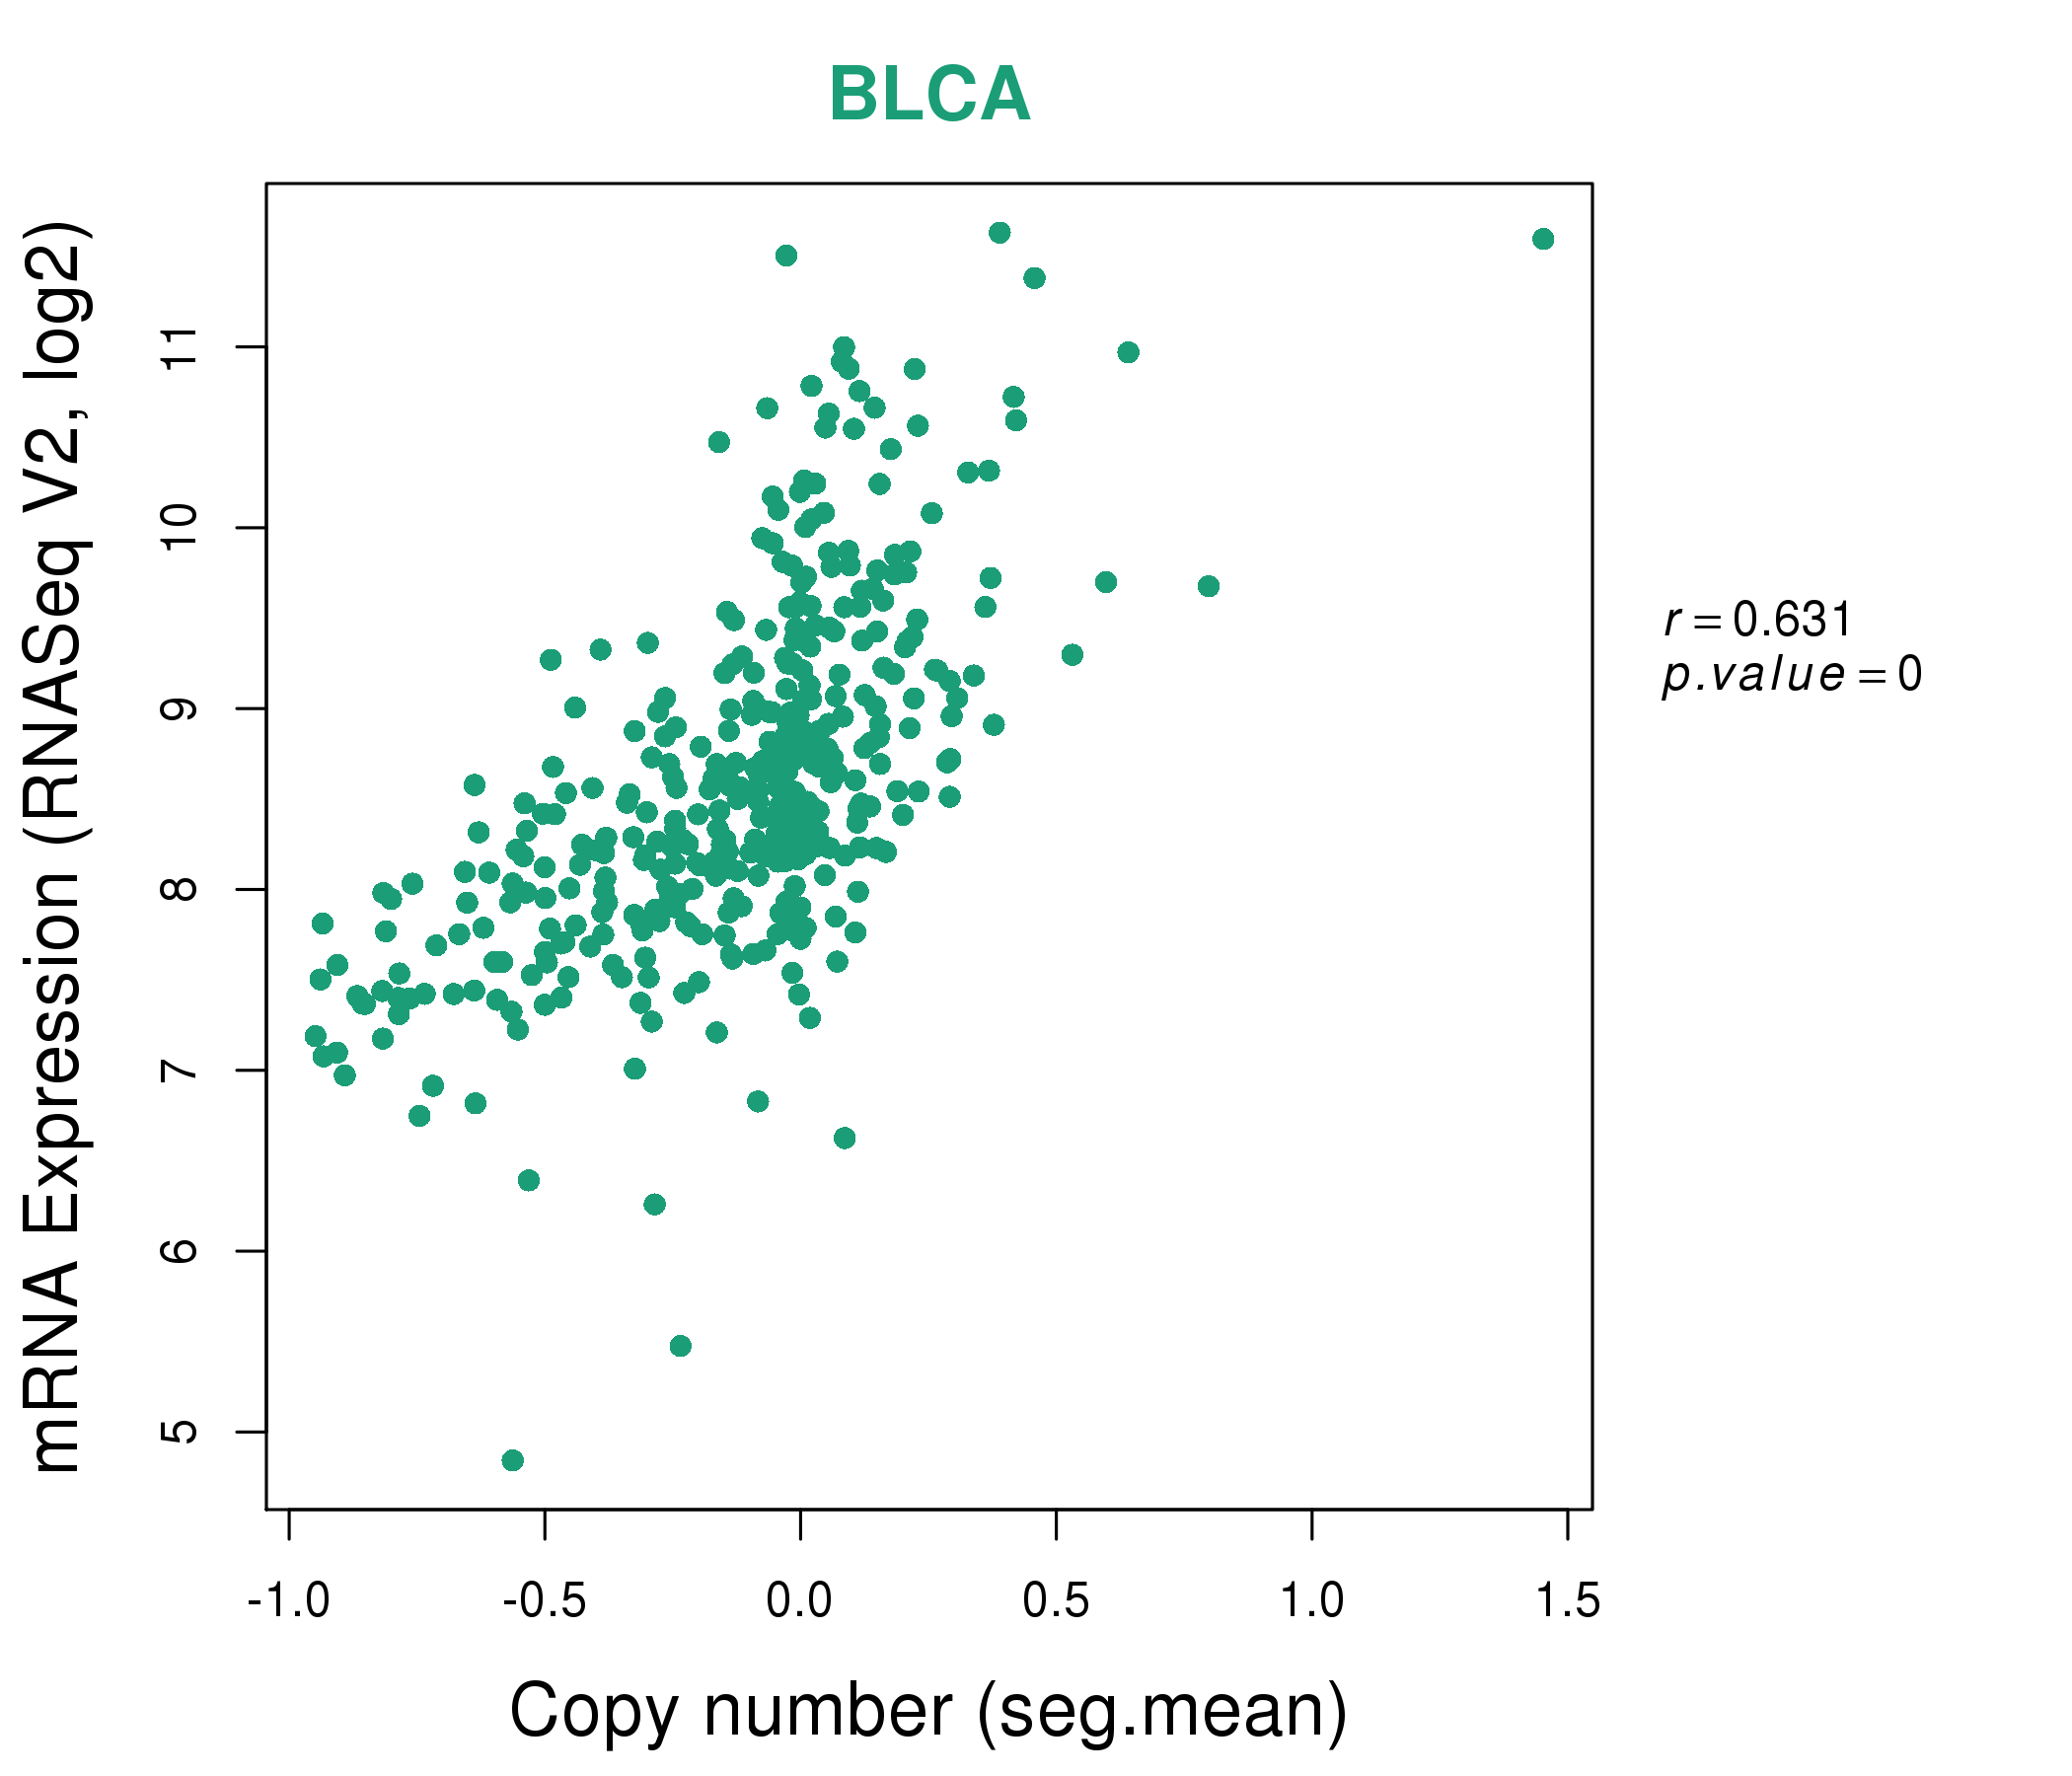
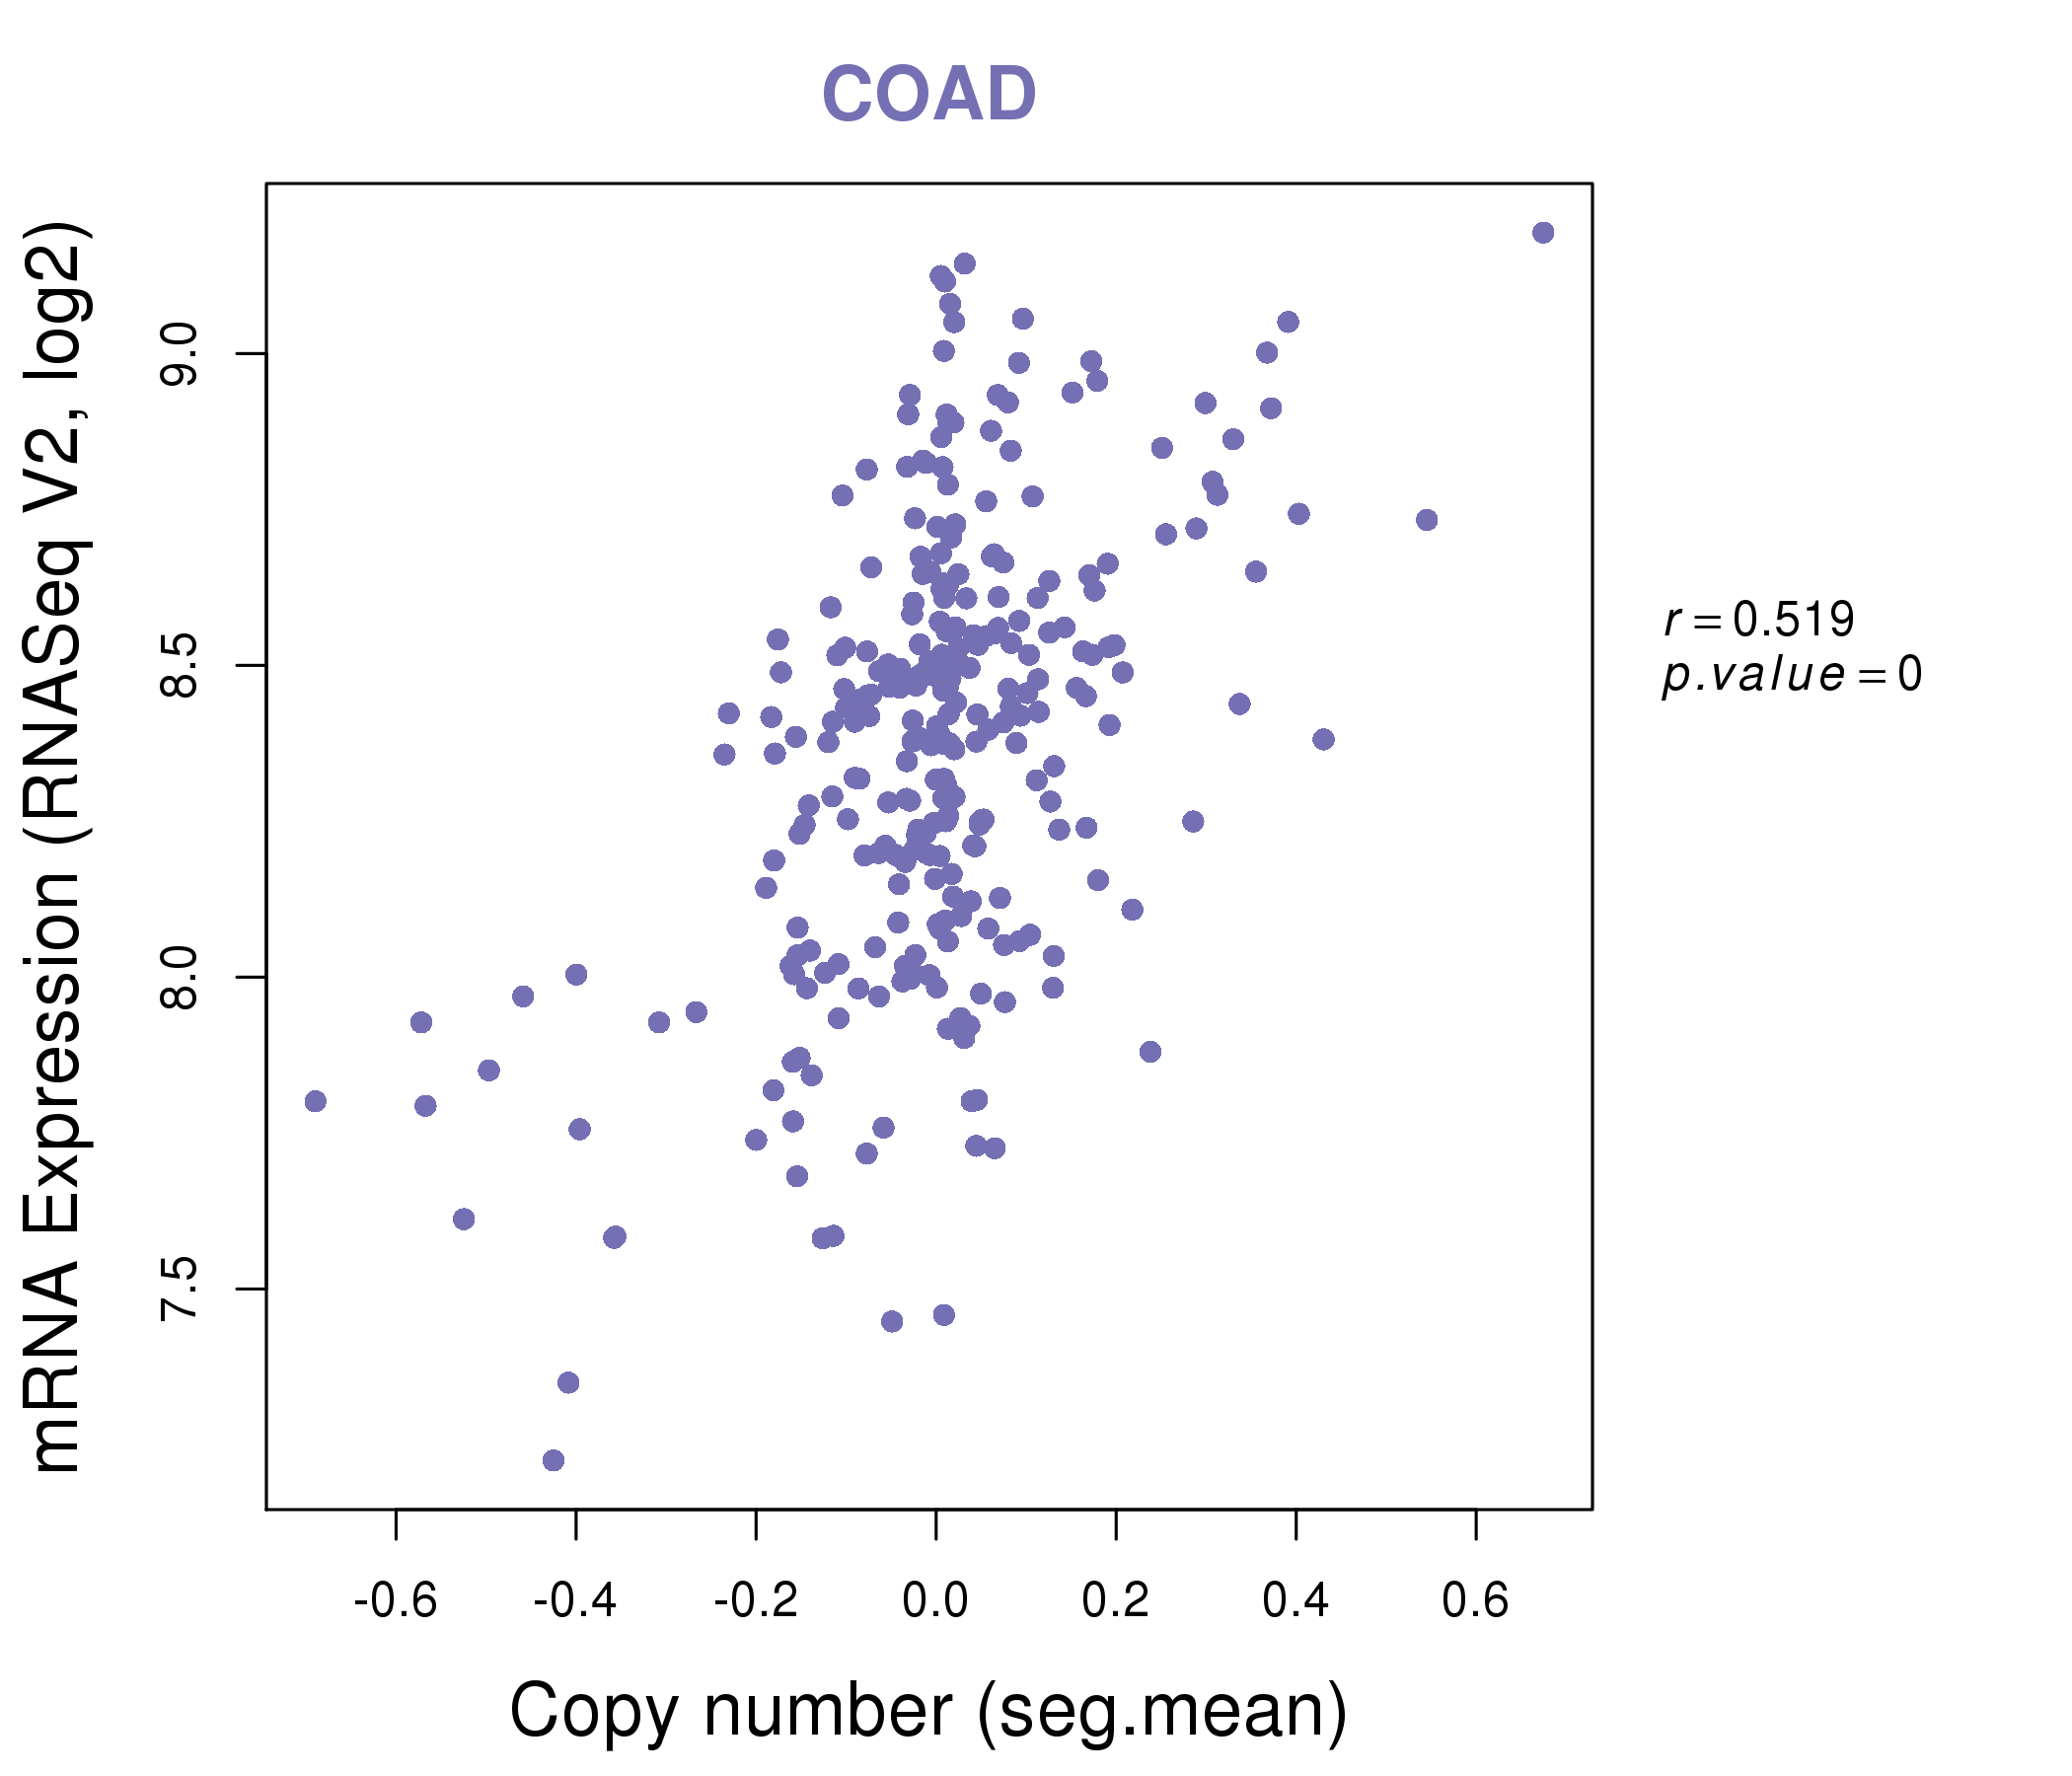
| * This plots show the correlation between CNV and gene expression. |
: Open all plots for all cancer types
 |
|
 |
|

| Top |
| Gene-Gene Network Information |
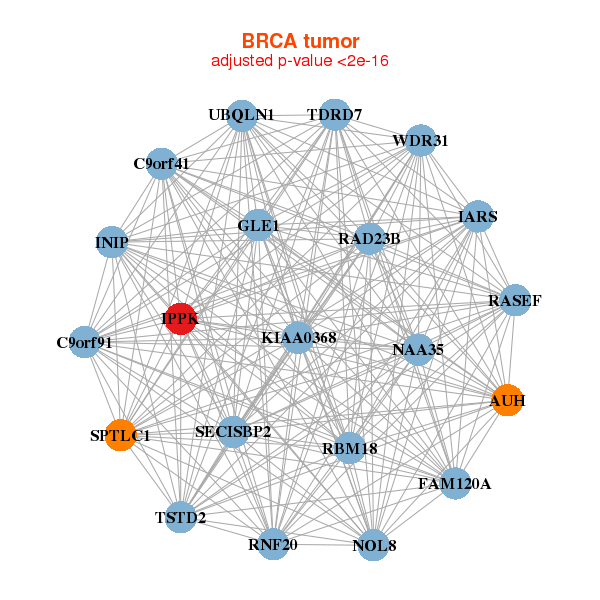
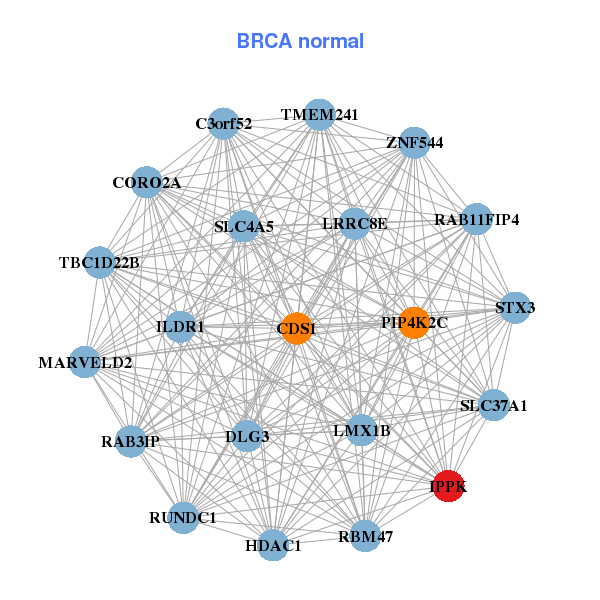
| * Co-Expression network figures were drawn using R package igraph. Only the top 20 genes with the highest correlations were shown. Red circle: input gene, orange circle: cell metabolism gene, sky circle: other gene |
: Open all plots for all cancer types
 |
|
| AUH,C9orf41,INIP,C9orf91,FAM120A,GLE1,IARS, IPPK,KIAA0368,NAA35,NOL8,RAD23B,RASEF,RBM18, RNF20,SECISBP2,SPTLC1,TDRD7,TSTD2,UBQLN1,WDR31 | TMEM241,C3orf52,CDS1,CORO2A,DLG3,HDAC1,ILDR1, IPPK,LMX1B,LRRC8E,MARVELD2,PIP4K2C,RAB11FIP4,RAB3IP, RBM47,RUNDC1,SLC37A1,SLC4A5,STX3,TBC1D22B,ZNF544 |
 |
|
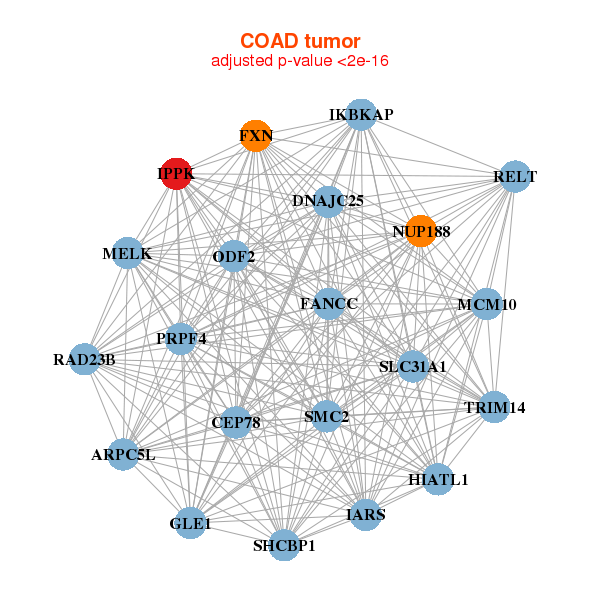
| ARPC5L,CEP78,DNAJC25,FANCC,FXN,GLE1,HIATL1, IARS,IKBKAP,IPPK,MCM10,MELK,NUP188,ODF2, PRPF4,RAD23B,RELT,SHCBP1,SLC31A1,SMC2,TRIM14 | CDC25A,FUT4,IPPK,KCTD5,KLHL18,LRRC59,MCL1, NOP2,NSUN2,PDE12,PHLDA2,PIGW,PSME3,PTPN1, RDH13,SERPINB8,SRSF2,SRRT,TOMM40,TUBB4B,WDR4 |
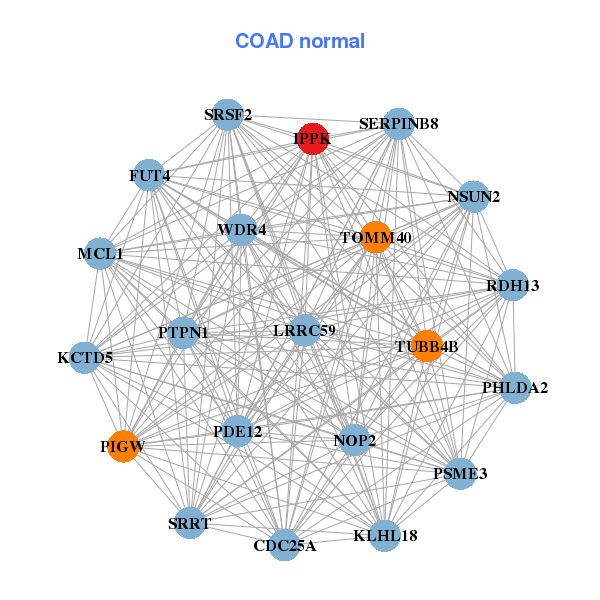
| * Co-Expression network figures were drawn using R package igraph. Only the top 20 genes with the highest correlations were shown. Red circle: input gene, orange circle: cell metabolism gene, sky circle: other gene |
: Open all plots for all cancer types
| Top |
: Open all interacting genes' information including KEGG pathway for all interacting genes from DAVID
| Top |
| Pharmacological Information for IPPK |
| There's no related Drug. |
| Top |
| Cross referenced IDs for IPPK |
| * We obtained these cross-references from Uniprot database. It covers 150 different DBs, 18 categories. http://www.uniprot.org/help/cross_references_section |
: Open all cross reference information
|
Copyright © 2016-Present - The Univsersity of Texas Health Science Center at Houston @ |