|
||||||||||||||||||||
| |
| Phenotypic Information (metabolism pathway, cancer, disease, phenome) |
| |
| |
| Gene-Gene Network Information: Co-Expression Network, Interacting Genes & KEGG |
| |
|


| Gene Summary for ST3GAL2 |
| Basic gene info. | Gene symbol | ST3GAL2 |
| Gene name | ST3 beta-galactoside alpha-2,3-sialyltransferase 2 | |
| Synonyms | Gal-NAc6S|SIAT4B|ST3GALII|ST3GalA.2 | |
| Cytomap | UCSC genome browser: 16q22.1 | |
| Genomic location | chr16 :70413337-70472991 | |
| Type of gene | protein-coding | |
| RefGenes | NM_006927.3, | |
| Ensembl id | ENSG00000157350 | |
| Description | CMP-N-acetylneuraminate-beta-galactosamide-alpha-2,3-sialyltransferase 2Gal-beta-1,3-GalNAc-alpha-2,3-sialyltransferaseSIAT4-BST3Gal IIalpha 2,3-ST 2beta-galactoside alpha-2,3-sialyltransferase 2beta-galactoside alpha-2,3-sialytransferasesialyltran | |
| Modification date | 20141207 | |
| dbXrefs | MIM : 607188 | |
| HGNC : HGNC | ||
| Ensembl : ENSG00000157350 | ||
| HPRD : 06220 | ||
| Protein | UniProt: go to UniProt's Cross Reference DB Table | |
| Expression | CleanEX: HS_ST3GAL2 | |
| BioGPS: 6483 | ||
| Gene Expression Atlas: ENSG00000157350 | ||
| The Human Protein Atlas: ENSG00000157350 | ||
| Pathway | NCI Pathway Interaction Database: ST3GAL2 | |
| KEGG: ST3GAL2 | ||
| REACTOME: ST3GAL2 | ||
| ConsensusPathDB | ||
| Pathway Commons: ST3GAL2 | ||
| Metabolism | MetaCyc: ST3GAL2 | |
| HUMANCyc: ST3GAL2 | ||
| Regulation | Ensembl's Regulation: ENSG00000157350 | |
| miRBase: chr16 :70,413,337-70,472,991 | ||
| TargetScan: NM_006927 | ||
| cisRED: ENSG00000157350 | ||
| Context | iHOP: ST3GAL2 | |
| cancer metabolism search in PubMed: ST3GAL2 | ||
| UCL Cancer Institute: ST3GAL2 | ||
| Assigned class in ccmGDB | C | |
| Top |
| Phenotypic Information for ST3GAL2(metabolism pathway, cancer, disease, phenome) |
| Cancer | CGAP: ST3GAL2 |
| Familial Cancer Database: ST3GAL2 | |
| * This gene is included in those cancer gene databases. |
|
|
|
|
|
|
| ||||||||||||||
Oncogene 1 | Significant driver gene in | |||||||||||||||||||
| cf) number; DB name 1 Oncogene; http://nar.oxfordjournals.org/content/35/suppl_1/D721.long, 2 Tumor Suppressor gene; https://bioinfo.uth.edu/TSGene/, 3 Cancer Gene Census; http://www.nature.com/nrc/journal/v4/n3/abs/nrc1299.html, 4 CancerGenes; http://nar.oxfordjournals.org/content/35/suppl_1/D721.long, 5 Network of Cancer Gene; http://ncg.kcl.ac.uk/index.php, 1Therapeutic Vulnerabilities in Cancer; http://cbio.mskcc.org/cancergenomics/statius/ |
| REACTOME_METABOLISM_OF_PROTEINS REACTOME_METABOLISM_OF_CARBOHYDRATES | |
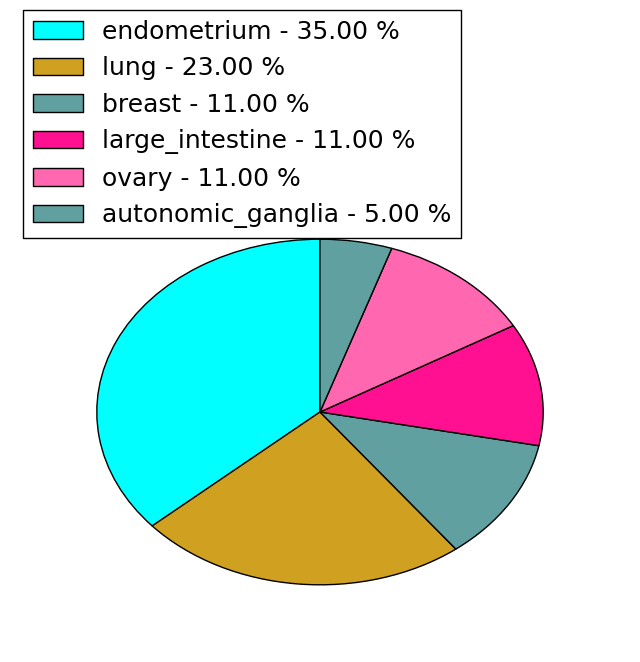
| Mutations for ST3GAL2 |
| * Under tables are showing count per each tissue to give us broad intuition about tissue specific mutation patterns.You can go to the detailed page for each mutation database's web site. |
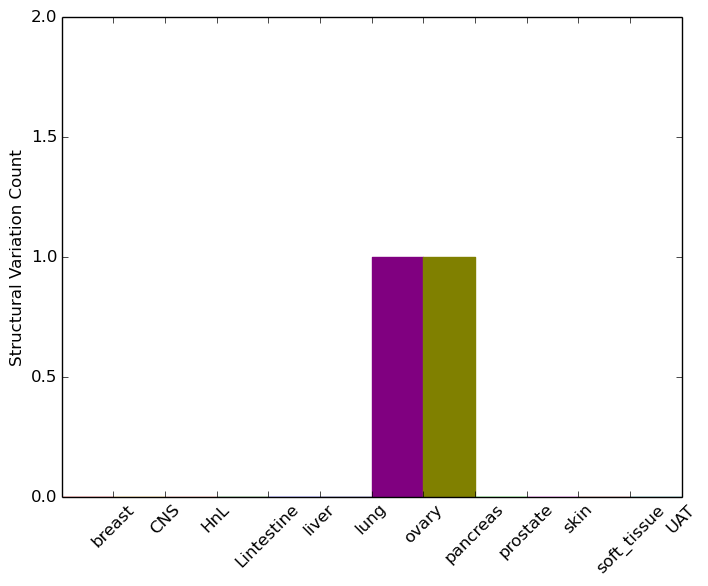
| - Statistics for Tissue and Mutation type | Top |
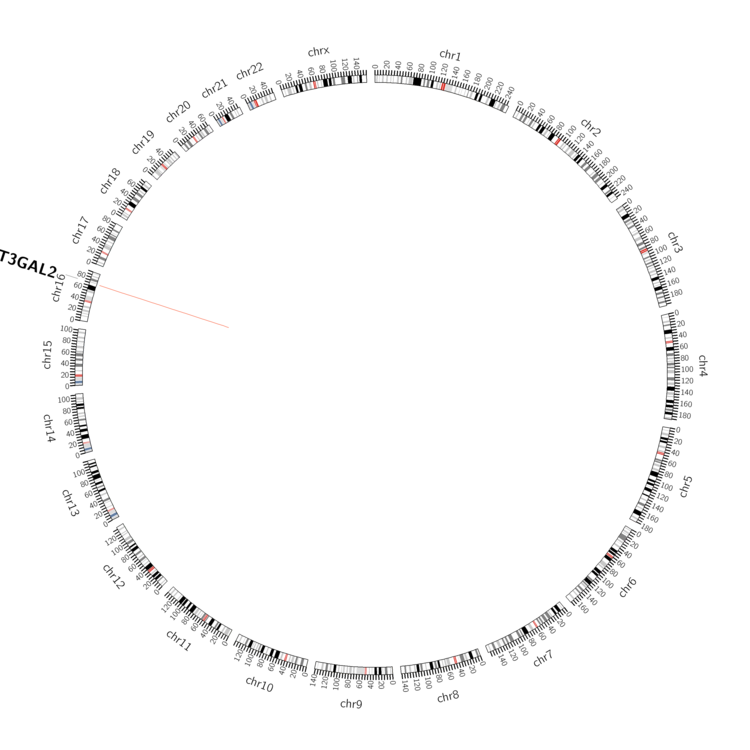 |
| - For Inter-chromosomal Variations |
| There's no inter-chromosomal structural variation. |
| - For Intra-chromosomal Variations |
| * Intra-chromosomal variantions includes 'intrachromosomal amplicon to amplicon', 'intrachromosomal amplicon to non-amplified dna', 'intrachromosomal deletion', 'intrachromosomal fold-back inversion', 'intrachromosomal inversion', 'intrachromosomal tandem duplication', 'Intrachromosomal unknown type', 'intrachromosomal with inverted orientation', 'intrachromosomal with non-inverted orientation'. |
 |
| Sample | Symbol_a | Chr_a | Start_a | End_a | Symbol_b | Chr_b | Start_b | End_b |
| ovary | ST3GAL2 | chr16 | 70414855 | 70414875 | ST3GAL2 | chr16 | 70414989 | 70415009 |
| pancreas | ST3GAL2 | chr16 | 70419577 | 70419597 | ST3GAL2 | chr16 | 70419764 | 70419784 |
| cf) Tissue number; Tissue name (1;Breast, 2;Central_nervous_system, 3;Haematopoietic_and_lymphoid_tissue, 4;Large_intestine, 5;Liver, 6;Lung, 7;Ovary, 8;Pancreas, 9;Prostate, 10;Skin, 11;Soft_tissue, 12;Upper_aerodigestive_tract) |
| * From mRNA Sanger sequences, Chitars2.0 arranged chimeric transcripts. This table shows ST3GAL2 related fusion information. |
| ID | Head Gene | Tail Gene | Accession | Gene_a | qStart_a | qEnd_a | Chromosome_a | tStart_a | tEnd_a | Gene_a | qStart_a | qEnd_a | Chromosome_a | tStart_a | tEnd_a |
| BC048338 | CYBA | 1 | 1415 | 16 | 88711495 | 88717438 | ST3GAL2 | 1410 | 1577 | 16 | 70413415 | 70413581 | |
| AW895060 | BASP1 | 8 | 150 | 5 | 17275736 | 17275879 | ST3GAL2 | 148 | 236 | 16 | 70417611 | 70417699 | |
| Top |
| There's no copy number variation information in COSMIC data for this gene. |
| Top |
|
 |
| Top |
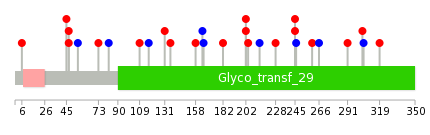
| Stat. for Non-Synonymous SNVs (# total SNVs=17) | (# total SNVs=6) |
 |  |
(# total SNVs=1) | (# total SNVs=0) |
 |
| Top |
| * When you move the cursor on each content, you can see more deailed mutation information on the Tooltip. Those are primary_site,primary_histology,mutation(aa),pubmedID. |
| GRCh37 position | Mutation(aa) | Unique sampleID count |
| chr16:70417119-70417119 | p.S245P | 2 |
| chr16:70422306-70422306 | p.W226L | 1 |
| chr16:70428933-70428933 | p.R162Q | 1 |
| chr16:70432295-70432295 | p.R47W | 1 |
| chr16:70415607-70415607 | p.V346V | 1 |
| chr16:70422317-70422317 | p.L222L | 1 |
| chr16:70428945-70428945 | p.S158L | 1 |
| chr16:70432418-70432418 | p.R6W | 1 |
| chr16:70415690-70415690 | p.E319Q | 1 |
| chr16:70422341-70422341 | p.F214F | 1 |
| Top |
|
 |
| Point Mutation/ Tissue ID | 1 | 2 | 3 | 4 | 5 | 6 | 7 | 8 | 9 | 10 | 11 | 12 | 13 | 14 | 15 | 16 | 17 | 18 | 19 | 20 |
| # sample | 3 | 2 | 5 | 2 | 3 | 5 | 1 | 5 | ||||||||||||
| # mutation | 3 | 2 | 5 | 2 | 4 | 5 | 1 | 6 | ||||||||||||
| nonsynonymous SNV | 1 | 1 | 3 | 2 | 1 | 5 | 1 | 6 | ||||||||||||
| synonymous SNV | 2 | 1 | 2 | 3 |
| cf) Tissue ID; Tissue type (1; BLCA[Bladder Urothelial Carcinoma], 2; BRCA[Breast invasive carcinoma], 3; CESC[Cervical squamous cell carcinoma and endocervical adenocarcinoma], 4; COAD[Colon adenocarcinoma], 5; GBM[Glioblastoma multiforme], 6; Glioma Low Grade, 7; HNSC[Head and Neck squamous cell carcinoma], 8; KICH[Kidney Chromophobe], 9; KIRC[Kidney renal clear cell carcinoma], 10; KIRP[Kidney renal papillary cell carcinoma], 11; LAML[Acute Myeloid Leukemia], 12; LUAD[Lung adenocarcinoma], 13; LUSC[Lung squamous cell carcinoma], 14; OV[Ovarian serous cystadenocarcinoma ], 15; PAAD[Pancreatic adenocarcinoma], 16; PRAD[Prostate adenocarcinoma], 17; SKCM[Skin Cutaneous Melanoma], 18:STAD[Stomach adenocarcinoma], 19:THCA[Thyroid carcinoma], 20:UCEC[Uterine Corpus Endometrial Carcinoma]) |
| Top |
| * We represented just top 10 SNVs. When you move the cursor on each content, you can see more deailed mutation information on the Tooltip. Those are primary_site, primary_histology, mutation(aa), pubmedID. |
| Genomic Position | Mutation(aa) | Unique sampleID count |
| chr16:70417119 | p.S245A | 2 |
| chr16:70428945 | p.S82S | 1 |
| chr16:70432418 | p.A260T | 1 |
| chr16:70417114 | p.R73C | 1 |
| chr16:70429011 | p.F246F | 1 |
| chr16:70429027 | p.A55A | 1 |
| chr16:70422301 | p.R47L | 1 |
| chr16:70429067 | p.A228T | 1 |
| chr16:70422341 | p.R47W | 1 |
| chr16:70432107 | p.F214F | 1 |
| * Copy number data were extracted from TCGA using R package TCGA-Assembler. The URLs of all public data files on TCGA DCC data server were gathered on Jan-05-2015. Function ProcessCNAData in TCGA-Assembler package was used to obtain gene-level copy number value which is calculated as the average copy number of the genomic region of a gene. |
 |
| cf) Tissue ID[Tissue type]: BLCA[Bladder Urothelial Carcinoma], BRCA[Breast invasive carcinoma], CESC[Cervical squamous cell carcinoma and endocervical adenocarcinoma], COAD[Colon adenocarcinoma], GBM[Glioblastoma multiforme], Glioma Low Grade, HNSC[Head and Neck squamous cell carcinoma], KICH[Kidney Chromophobe], KIRC[Kidney renal clear cell carcinoma], KIRP[Kidney renal papillary cell carcinoma], LAML[Acute Myeloid Leukemia], LUAD[Lung adenocarcinoma], LUSC[Lung squamous cell carcinoma], OV[Ovarian serous cystadenocarcinoma ], PAAD[Pancreatic adenocarcinoma], PRAD[Prostate adenocarcinoma], SKCM[Skin Cutaneous Melanoma], STAD[Stomach adenocarcinoma], THCA[Thyroid carcinoma], UCEC[Uterine Corpus Endometrial Carcinoma] |
| Top |
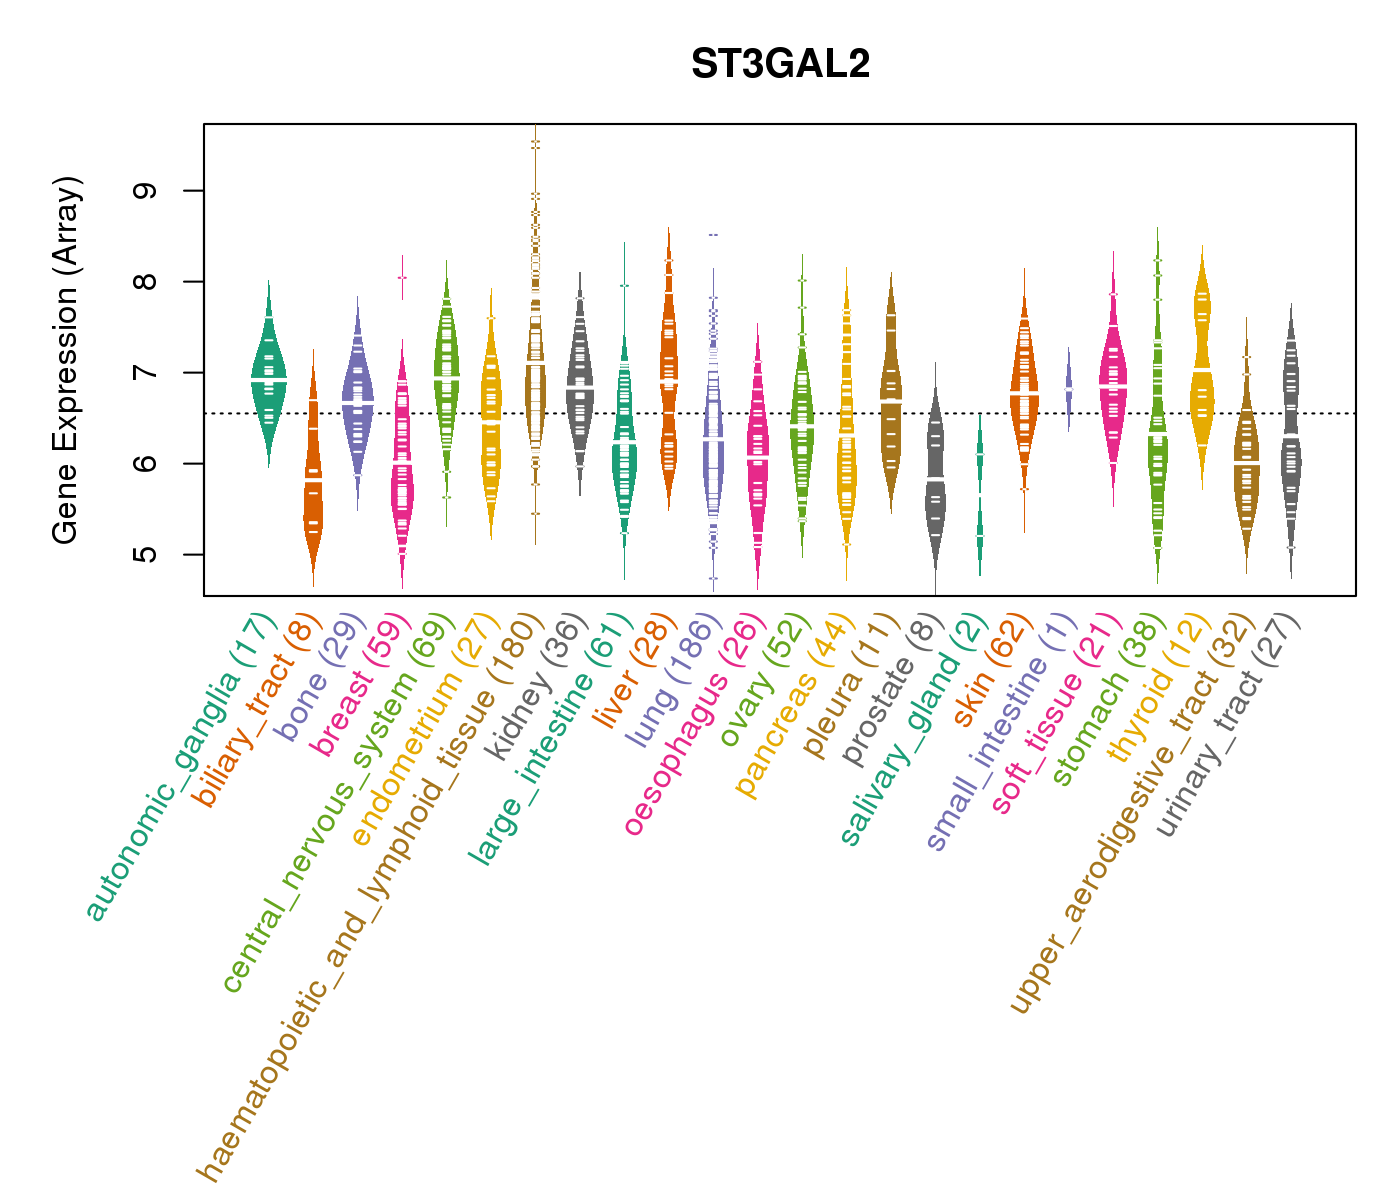
| Gene Expression for ST3GAL2 |
| * CCLE gene expression data were extracted from CCLE_Expression_Entrez_2012-10-18.res: Gene-centric RMA-normalized mRNA expression data. |
 |
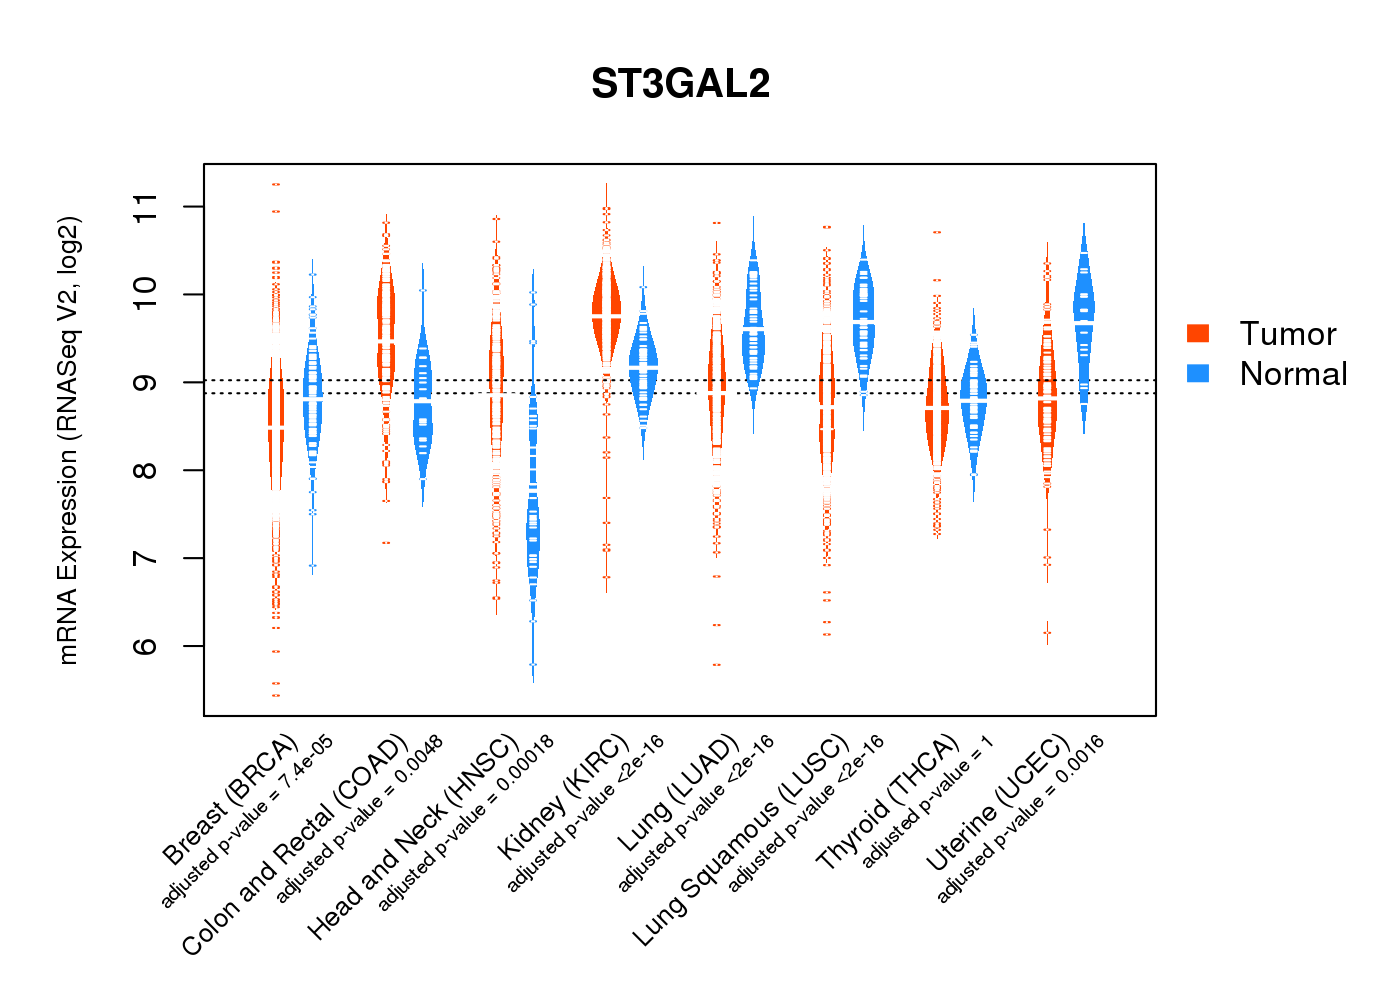
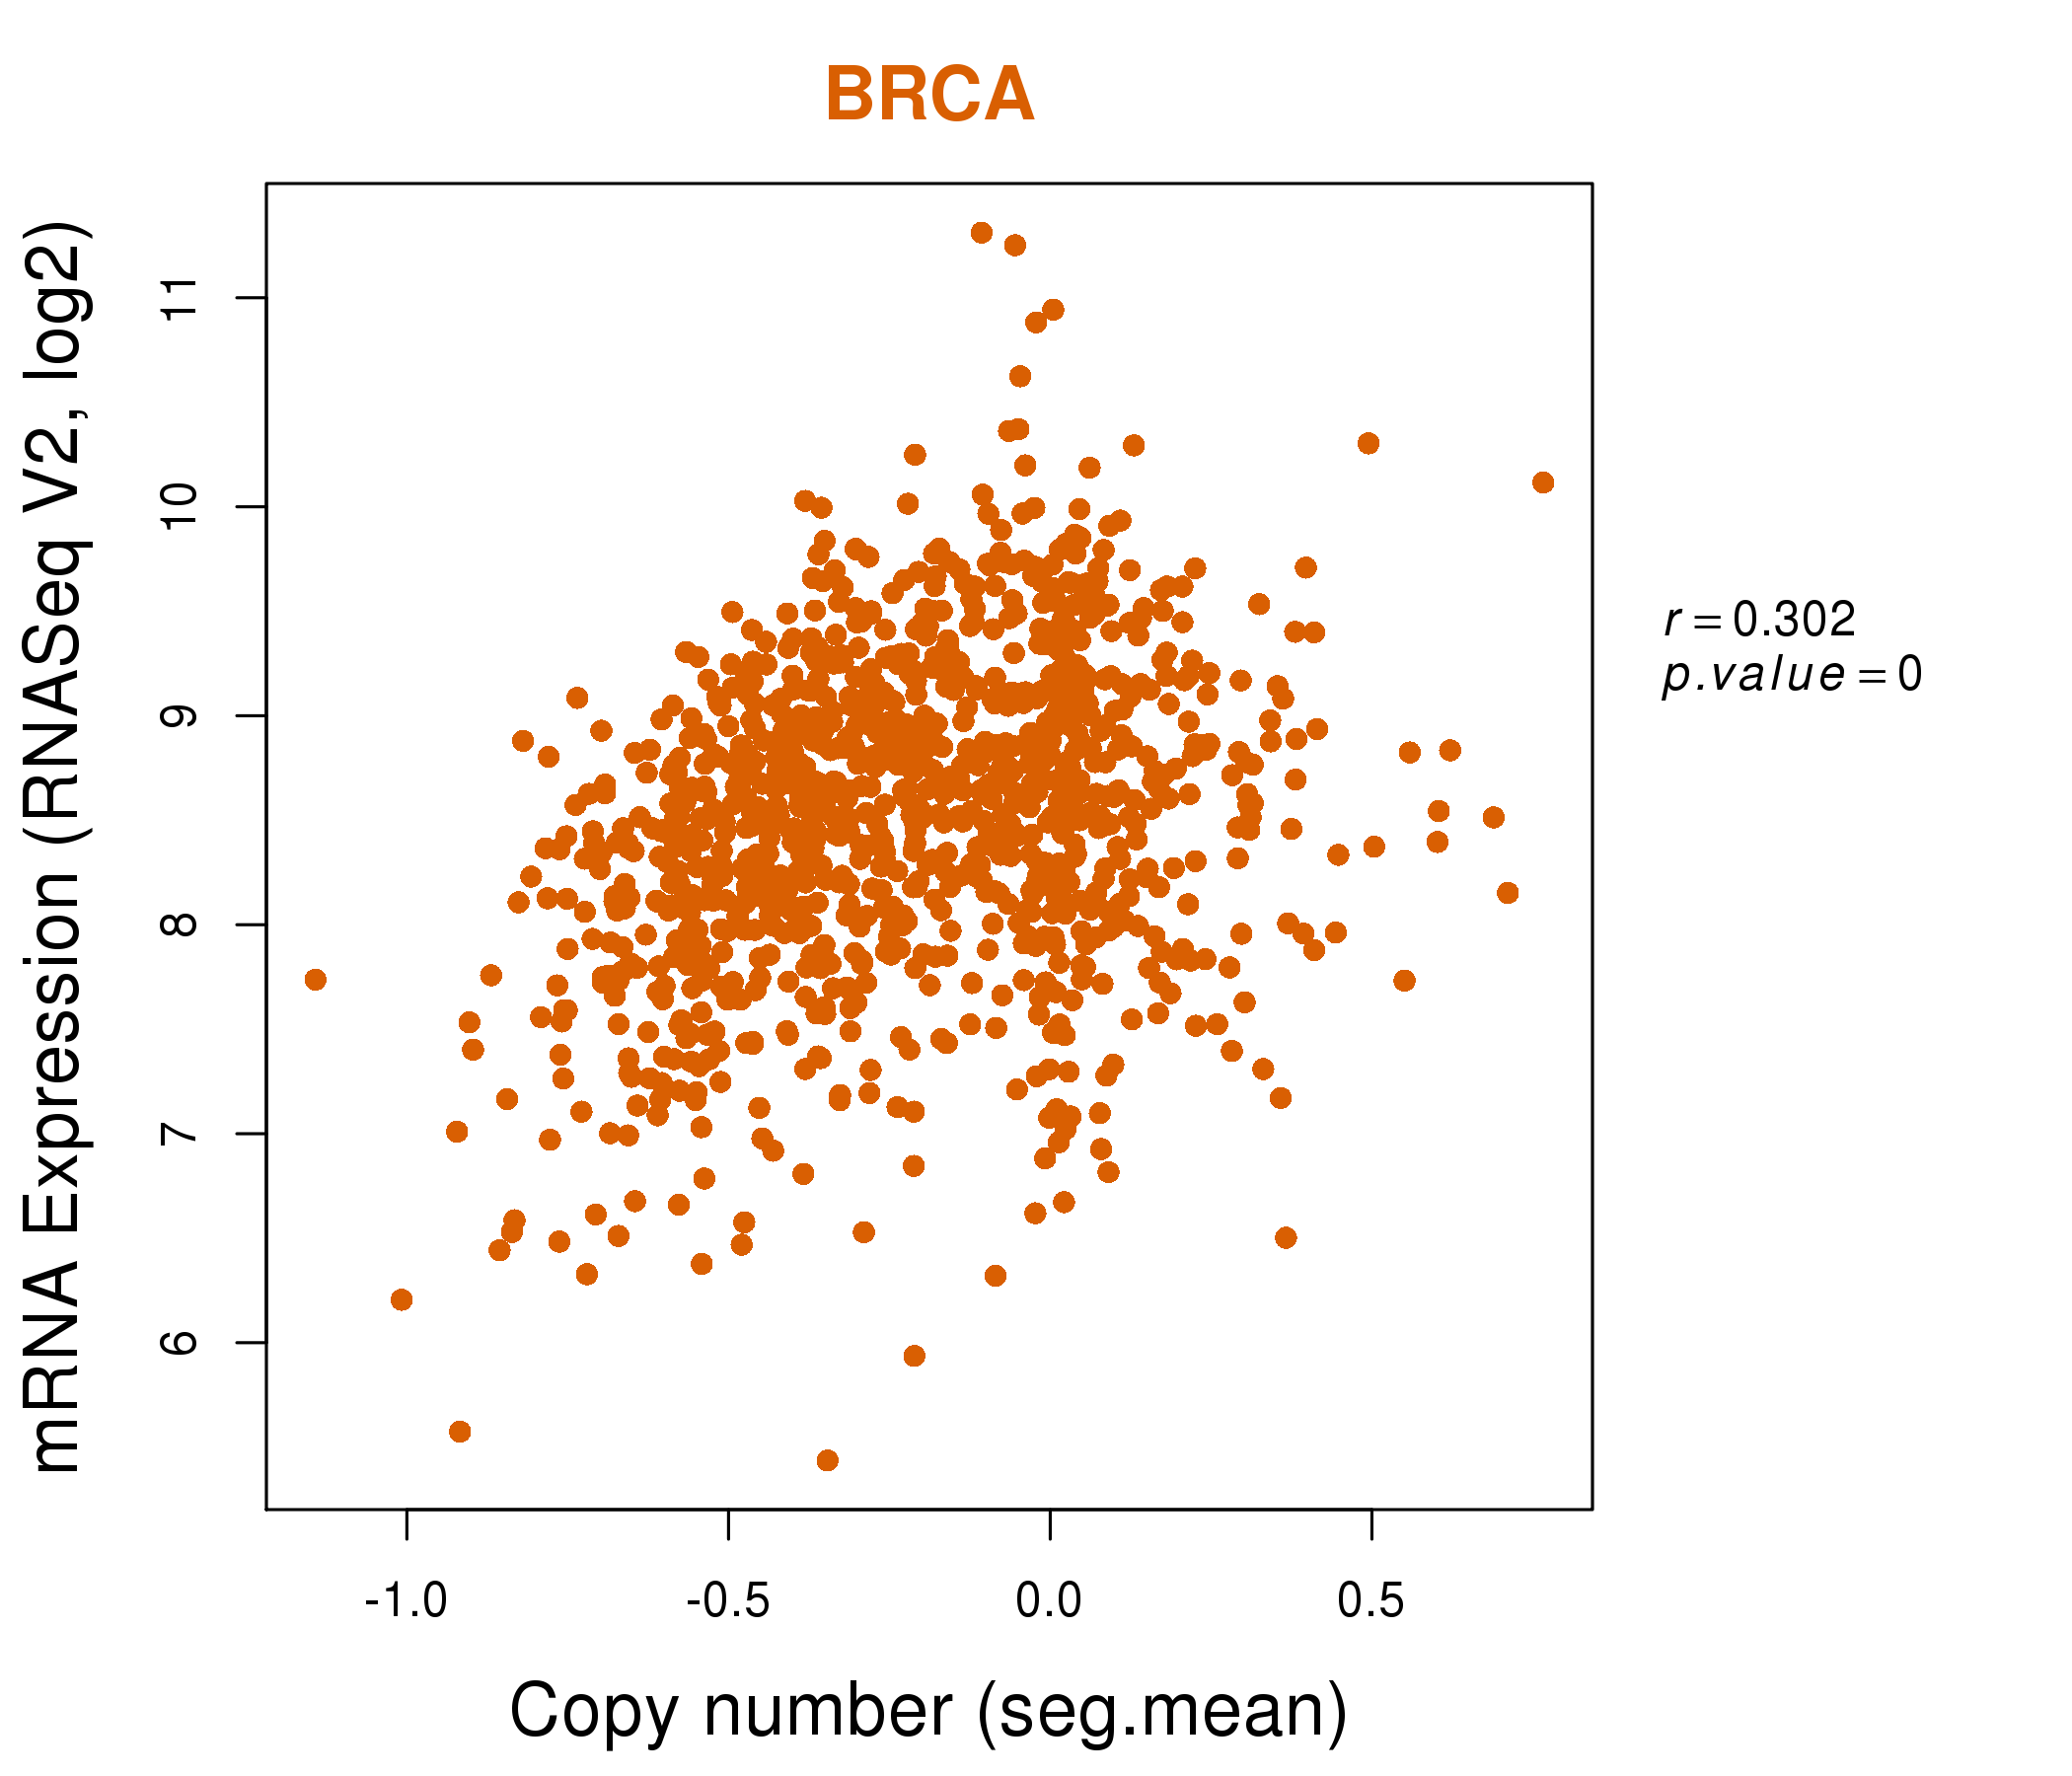
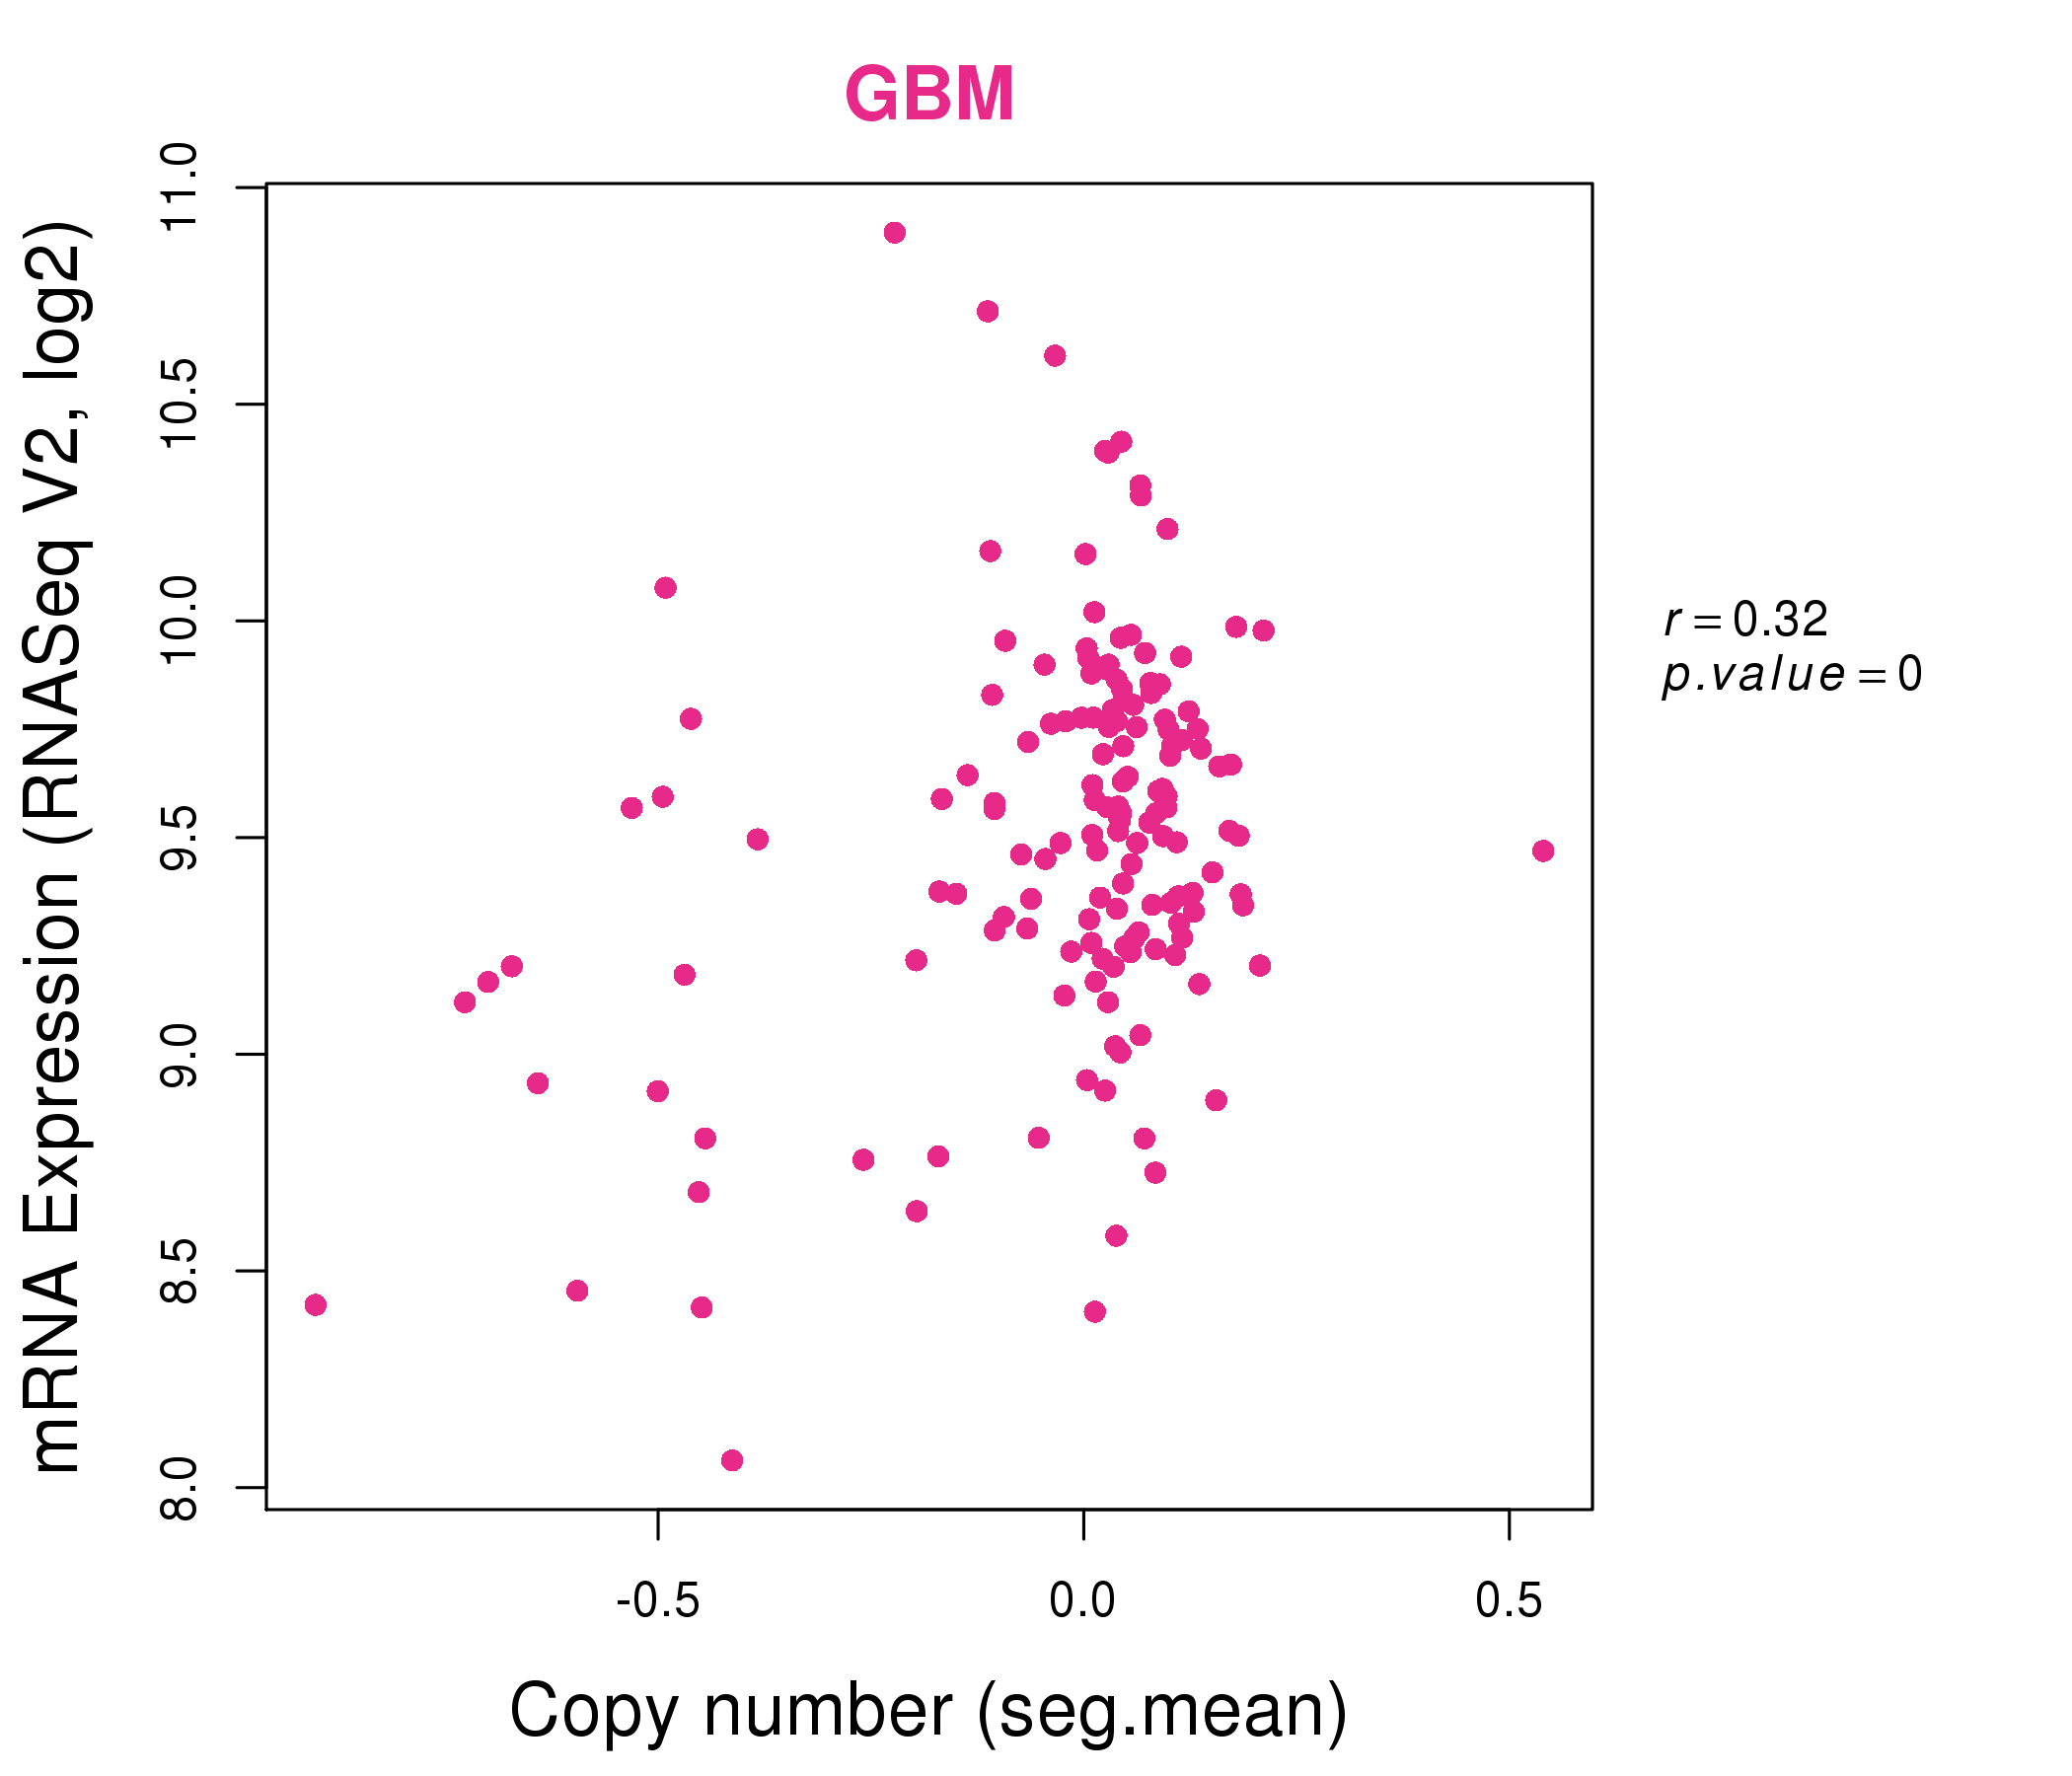
| * Normalized gene expression data of RNASeqV2 was extracted from TCGA using R package TCGA-Assembler. The URLs of all public data files on TCGA DCC data server were gathered at Jan-05-2015. Only eight cancer types have enough normal control samples for differential expression analysis. (t test, adjusted p<0.05 (using Benjamini-Hochberg FDR)) |
 |
| Top |
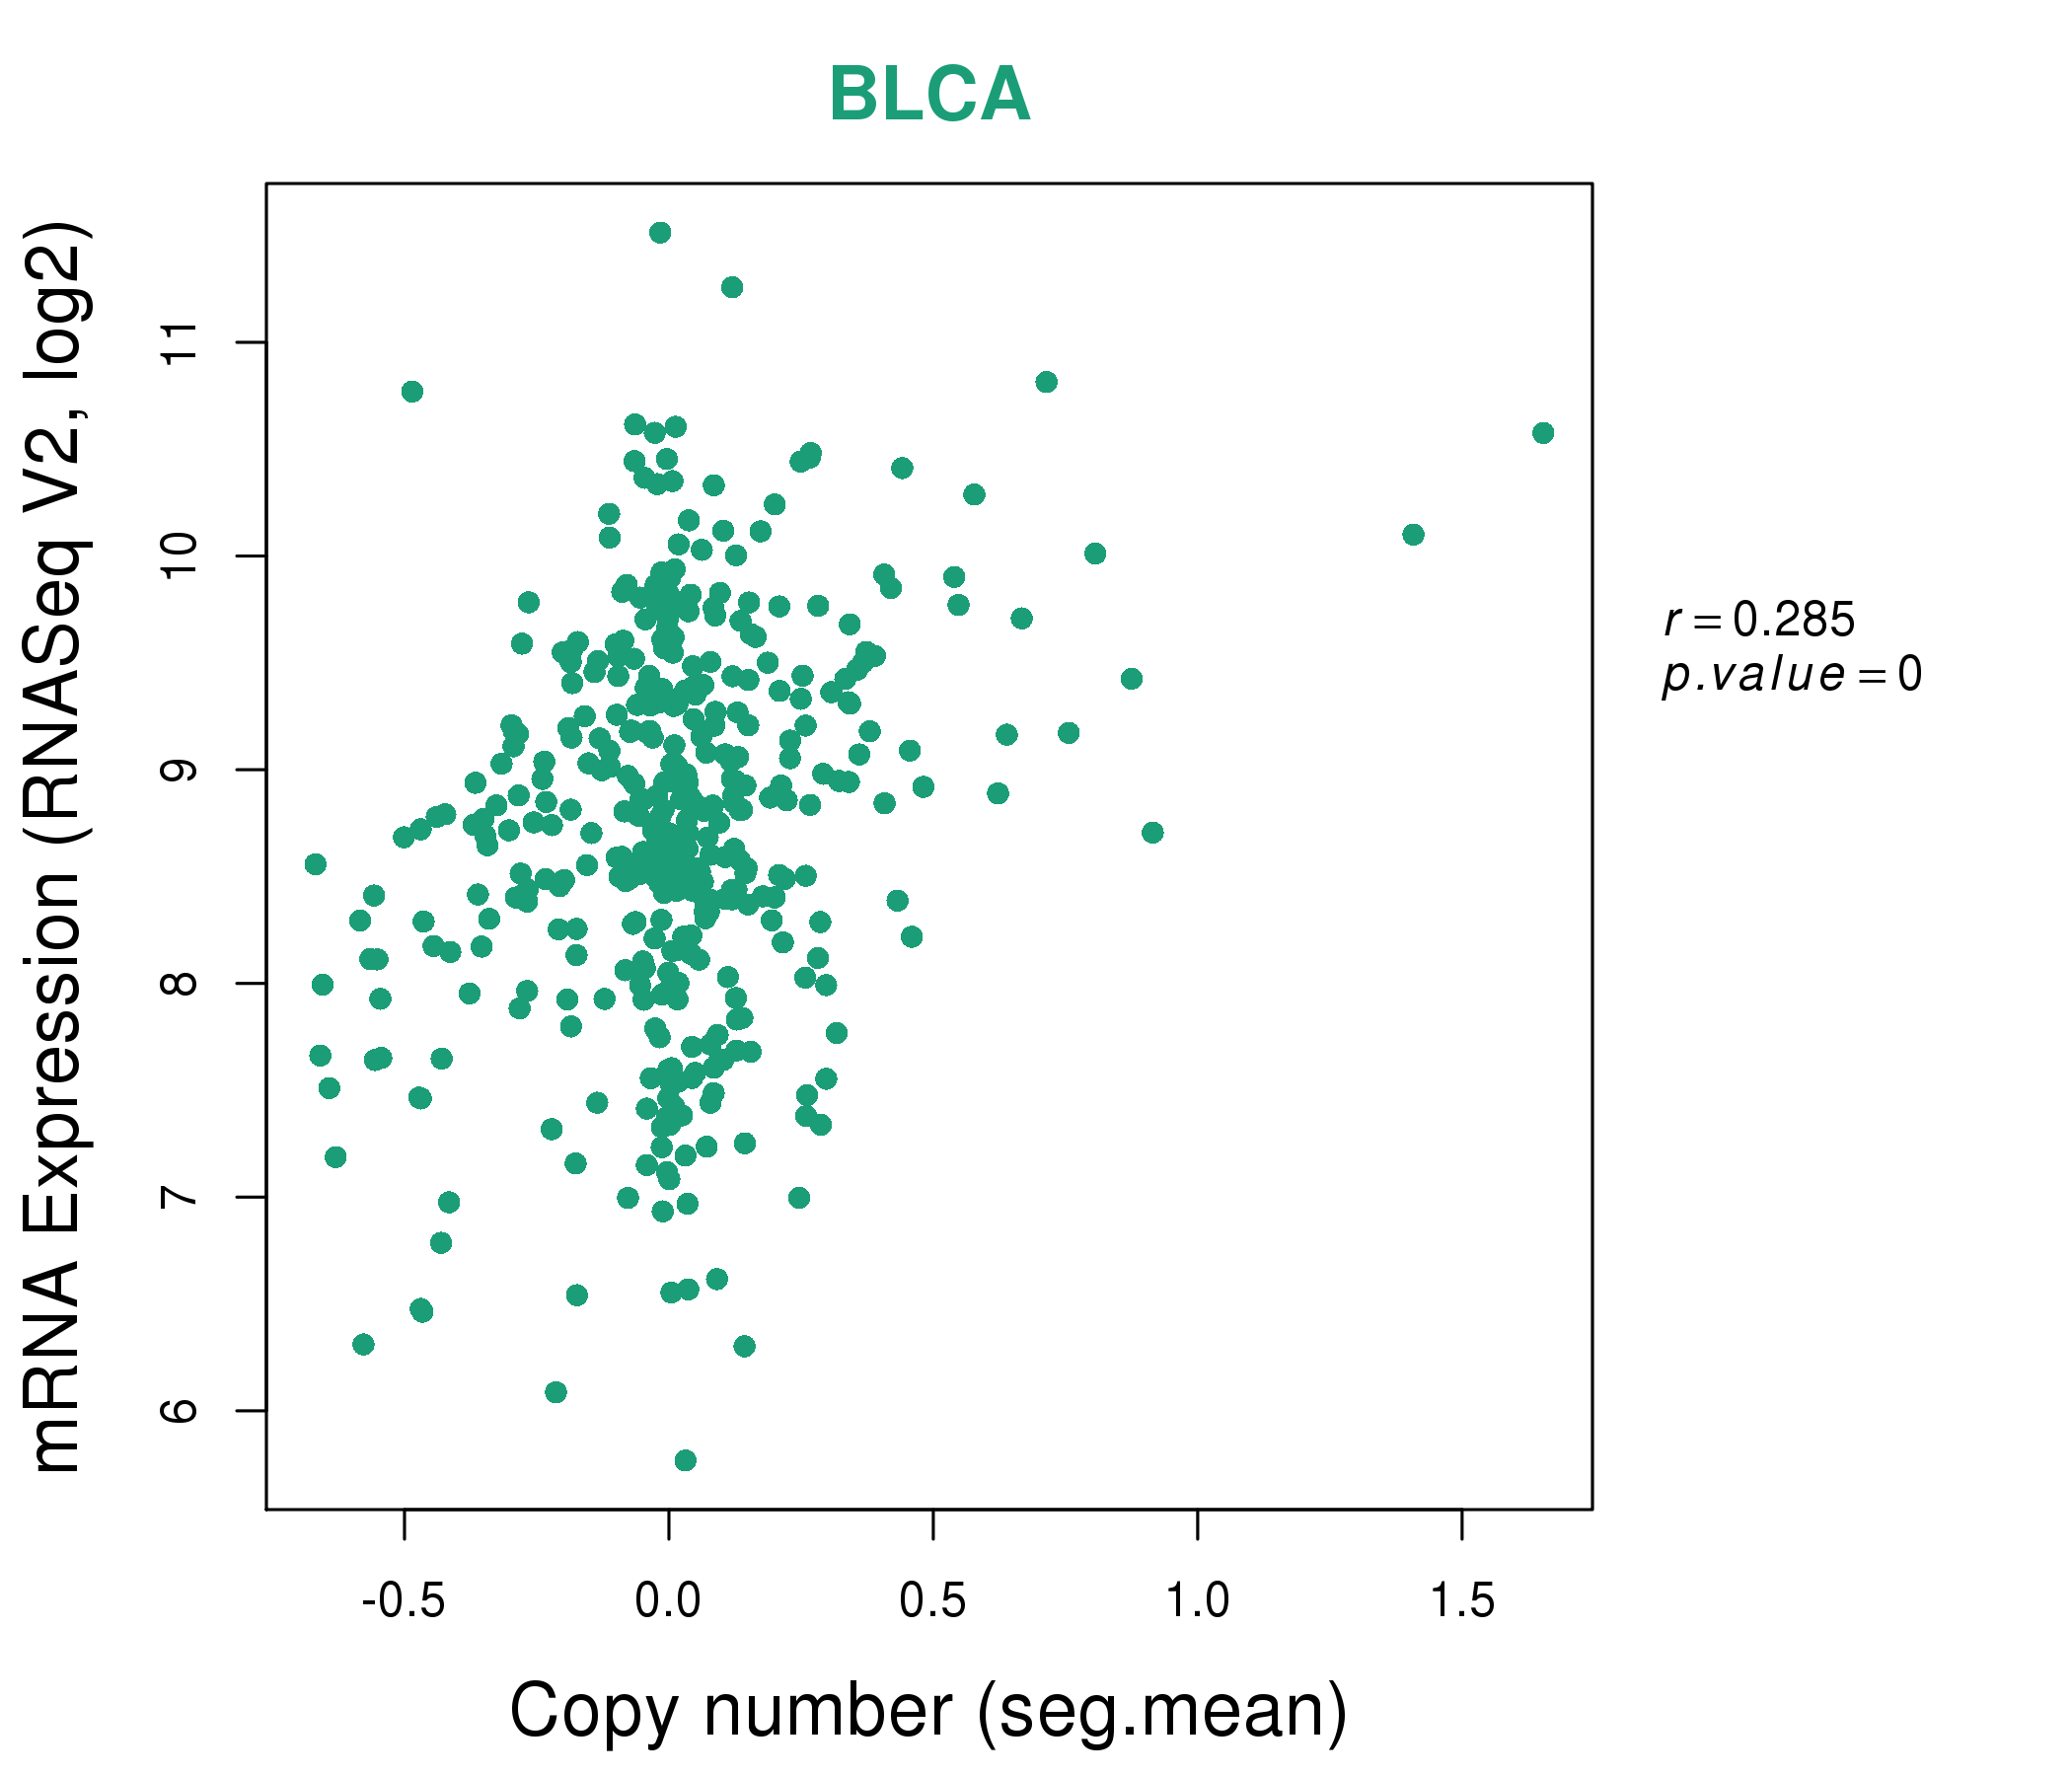
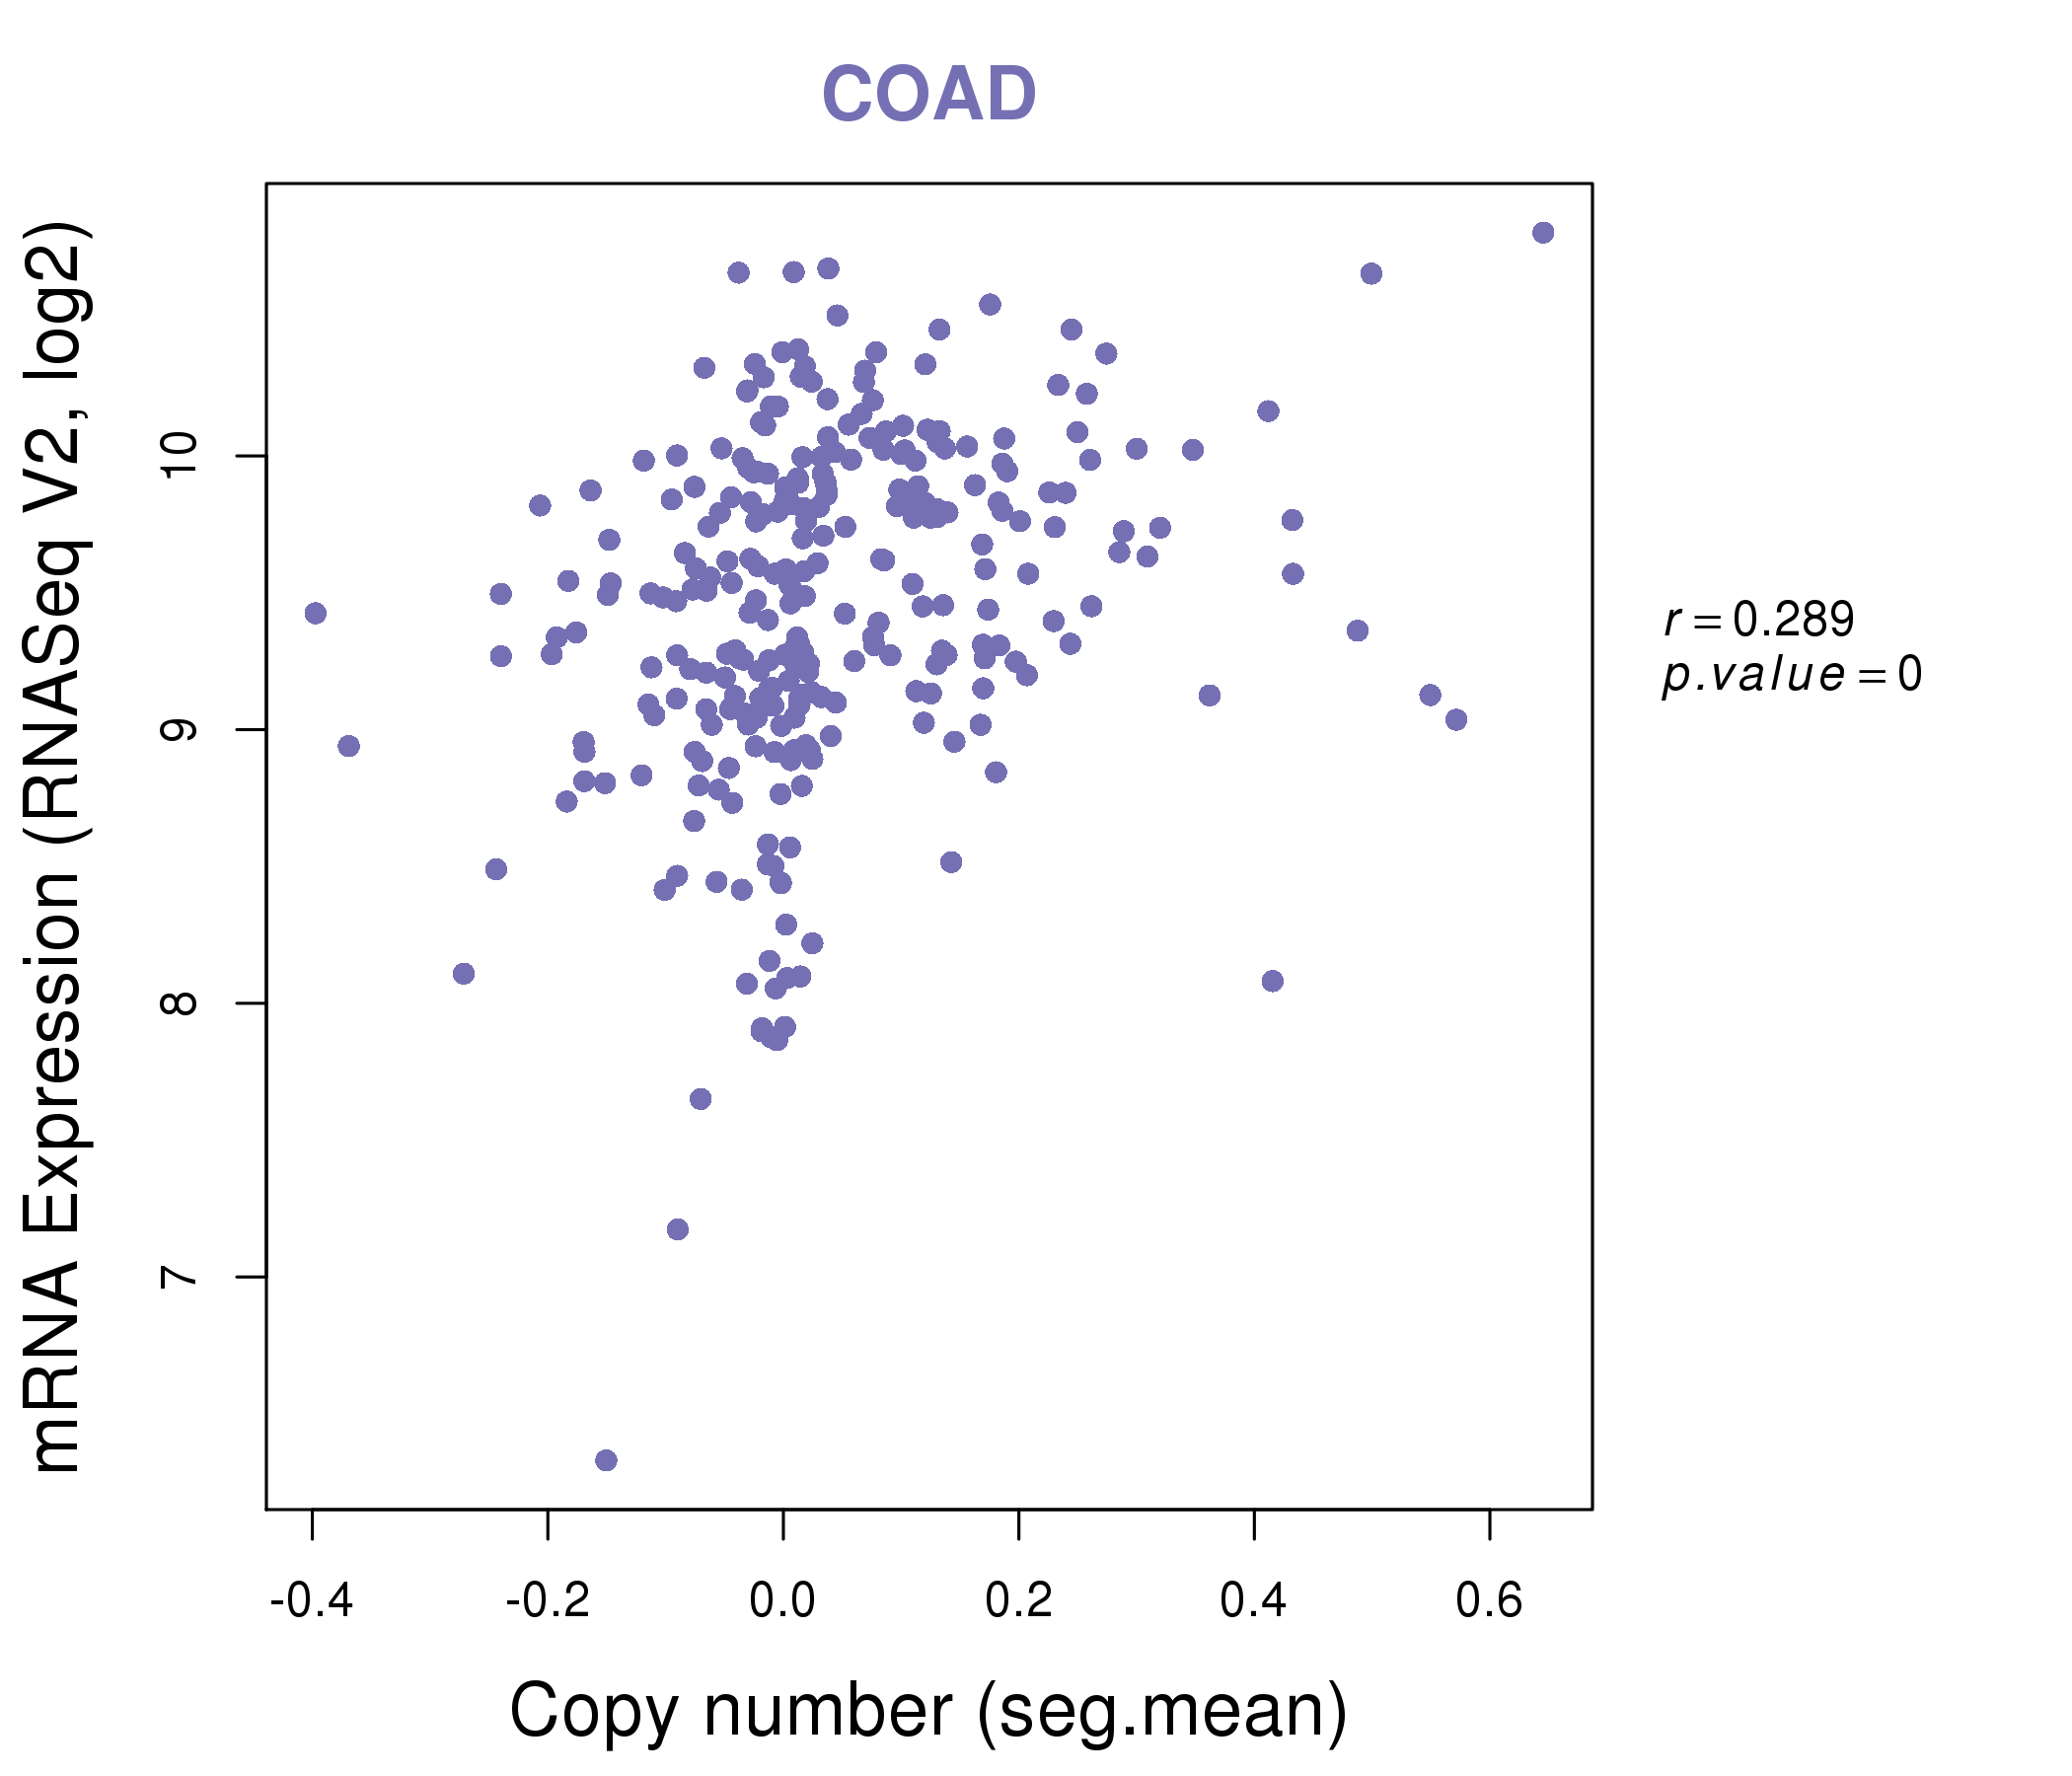
| * This plots show the correlation between CNV and gene expression. |
: Open all plots for all cancer types
 |
|
 |
|
| Top |
| Gene-Gene Network Information |
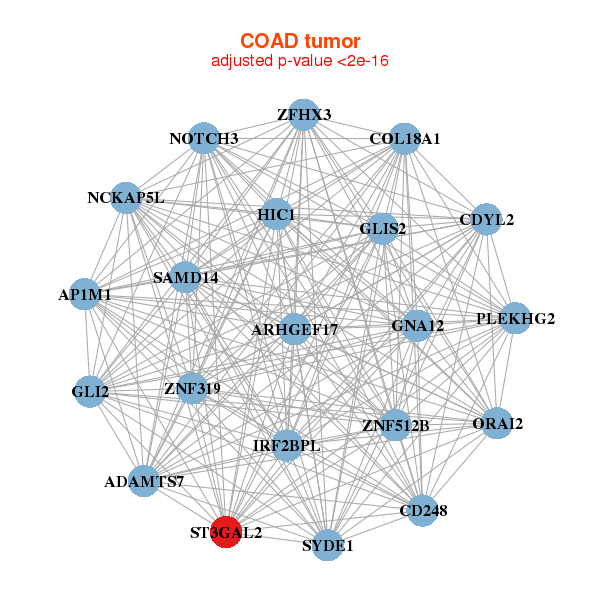
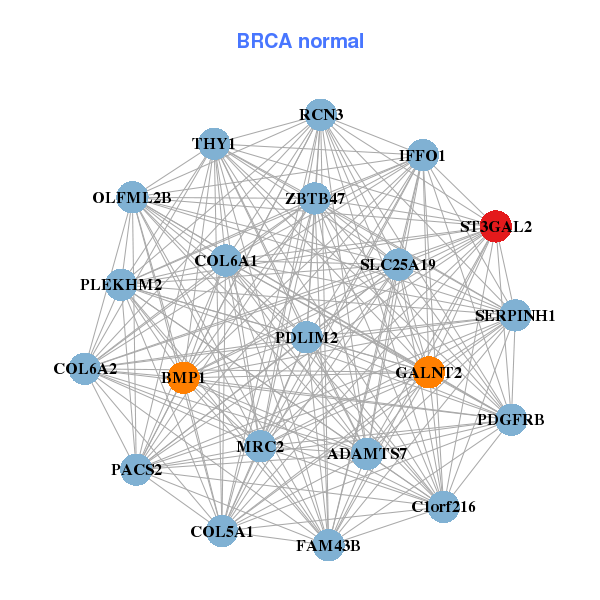
| * Co-Expression network figures were drawn using R package igraph. Only the top 20 genes with the highest correlations were shown. Red circle: input gene, orange circle: cell metabolism gene, sky circle: other gene |
: Open all plots for all cancer types
 |
|
| ACVRL1,BMP1,CLIP2,CNRIP1,COL16A1,COL18A1,COL6A1, COL6A2,EMILIN1,FMNL3,GPR124,HIC1,HLX,IFFO1, LRP1,PDGFRB,PPAPDC3,SCARF1,SCARF2,ST3GAL2,TGFB1 | ADAMTS7,BMP1,C1orf216,COL5A1,COL6A1,COL6A2,FAM43B, GALNT2,IFFO1,MRC2,OLFML2B,PACS2,PDGFRB,PDLIM2, PLEKHM2,RCN3,SERPINH1,SLC25A19,ST3GAL2,THY1,ZBTB47 |
 |
|
| ADAMTS7,AP1M1,ARHGEF17,IRF2BPL,CD248,CDYL2,COL18A1, GLI2,GLIS2,GNA12,HIC1,NCKAP5L,NOTCH3,ORAI2, PLEKHG2,SAMD14,ST3GAL2,SYDE1,ZFHX3,ZNF319,ZNF512B | ABCA3,ANO6,AP1M1,BOK,CCDC102A,FAM110B,ITPKB, CTIF,LRCH1,LRSAM1,MAPK8IP1,NAB2,NRXN3,PKN1, RNF216,SALL2,SESTD1,SNPH,ST3GAL2,WFS1,ZNF512B |
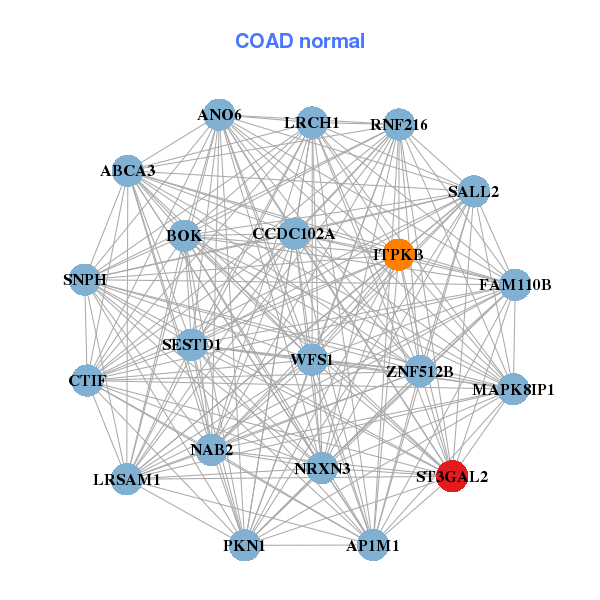
| * Co-Expression network figures were drawn using R package igraph. Only the top 20 genes with the highest correlations were shown. Red circle: input gene, orange circle: cell metabolism gene, sky circle: other gene |
: Open all plots for all cancer types
| Top |
: Open all interacting genes' information including KEGG pathway for all interacting genes from DAVID
| Top |
| Pharmacological Information for ST3GAL2 |
| There's no related Drug. |
| Top |
| Cross referenced IDs for ST3GAL2 |
| * We obtained these cross-references from Uniprot database. It covers 150 different DBs, 18 categories. http://www.uniprot.org/help/cross_references_section |
: Open all cross reference information
|
Copyright © 2016-Present - The Univsersity of Texas Health Science Center at Houston @ |