|
||||||||||||||||||||
| |
| Phenotypic Information (metabolism pathway, cancer, disease, phenome) |
| |
| |
| Gene-Gene Network Information: Co-Expression Network, Interacting Genes & KEGG |
| |
|


| Gene Summary for ELOVL1 |
| Top |
| Phenotypic Information for ELOVL1(metabolism pathway, cancer, disease, phenome) |
| Cancer | CGAP: ELOVL1 |
| Familial Cancer Database: ELOVL1 | |
| * This gene is included in those cancer gene databases. |
|
|
|
|
|
|
| ||||||||||||||
Oncogene 1 | Significant driver gene in | |||||||||||||||||||
| cf) number; DB name 1 Oncogene; http://nar.oxfordjournals.org/content/35/suppl_1/D721.long, 2 Tumor Suppressor gene; https://bioinfo.uth.edu/TSGene/, 3 Cancer Gene Census; http://www.nature.com/nrc/journal/v4/n3/abs/nrc1299.html, 4 CancerGenes; http://nar.oxfordjournals.org/content/35/suppl_1/D721.long, 5 Network of Cancer Gene; http://ncg.kcl.ac.uk/index.php, 1Therapeutic Vulnerabilities in Cancer; http://cbio.mskcc.org/cancergenomics/statius/ |
| REACTOME_METABOLISM_OF_LIPIDS_AND_LIPOPROTEINS | |
| OMIM | |
| Orphanet | |
| Disease | KEGG Disease: ELOVL1 |
| MedGen: ELOVL1 (Human Medical Genetics with Condition) | |
| ClinVar: ELOVL1 | |
| Phenotype | MGI: ELOVL1 (International Mouse Phenotyping Consortium) |
| PhenomicDB: ELOVL1 | |
| Mutations for ELOVL1 |
| * Under tables are showing count per each tissue to give us broad intuition about tissue specific mutation patterns.You can go to the detailed page for each mutation database's web site. |
| There's no structural variation information in COSMIC data for this gene. |
| * From mRNA Sanger sequences, Chitars2.0 arranged chimeric transcripts. This table shows ELOVL1 related fusion information. |
| ID | Head Gene | Tail Gene | Accession | Gene_a | qStart_a | qEnd_a | Chromosome_a | tStart_a | tEnd_a | Gene_a | qStart_a | qEnd_a | Chromosome_a | tStart_a | tEnd_a |
| BP218140 | ELOVL1 | 1 | 318 | 1 | 43830884 | 43833678 | NFASC | 309 | 583 | 1 | 204986628 | 204986903 | |
| DA345121 | LOC100507412 | 1 | 223 | ? | 115652 | 115873 | ELOVL1 | 223 | 473 | 1 | 43830921 | 43833649 | |
| DA570042 | ELOVL1 | 1 | 604 | 1 | 43829445 | 43830315 | ELOVL1 | 586 | 805 | 1 | 43832184 | 43832405 | |
| Top |
| There's no copy number variation information in COSMIC data for this gene. |
| Top |
|
 |
| Top |
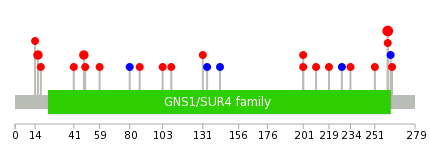
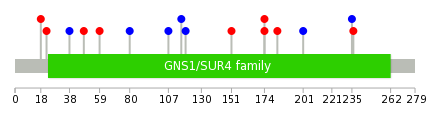
| Stat. for Non-Synonymous SNVs (# total SNVs=17) | (# total SNVs=2) |
 |  |
(# total SNVs=2) | (# total SNVs=0) |
 |
| Top |
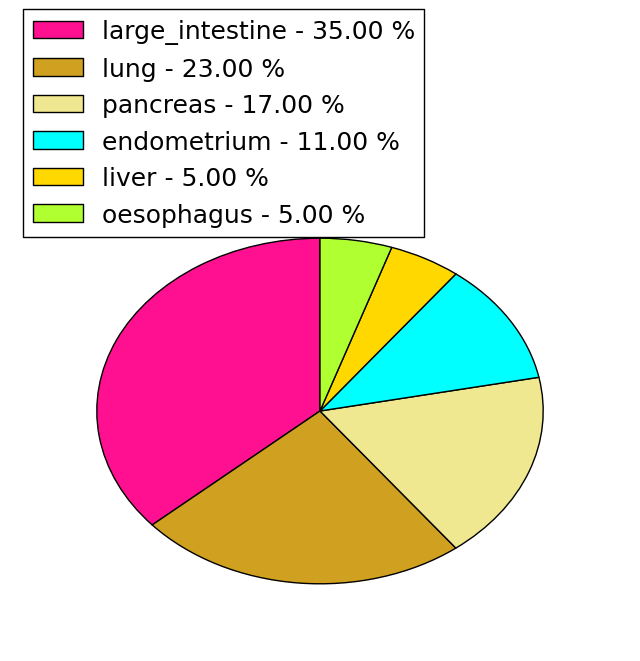
| * When you move the cursor on each content, you can see more deailed mutation information on the Tooltip. Those are primary_site,primary_histology,mutation(aa),pubmedID. |
| GRCh37 position | Mutation(aa) | Unique sampleID count |
| chr1:43829648-43829648 | p.R260Q | 5 |
| chr1:43831047-43831047 | p.D16G | 2 |
| chr1:43830951-43830951 | p.R48H | 2 |
| chr1:43829641-43829641 | p.P262P | 1 |
| chr1:43830292-43830292 | p.D134D | 1 |
| chr1:43831042-43831042 | p.R18W | 1 |
| chr1:43830302-43830302 | p.R131Q | 1 |
| chr1:43829675-43829675 | p.W251L | 1 |
| chr1:43830459-43830459 | p.R109W | 1 |
| chr1:43831048-43831048 | p.? | 1 |
| Top |
|
 |
| Point Mutation/ Tissue ID | 1 | 2 | 3 | 4 | 5 | 6 | 7 | 8 | 9 | 10 | 11 | 12 | 13 | 14 | 15 | 16 | 17 | 18 | 19 | 20 |
| # sample | 3 | 2 | 1 | 1 | 4 | 1 | 1 | 3 | ||||||||||||
| # mutation | 3 | 2 | 1 | 1 | 4 | 1 | 1 | 3 | ||||||||||||
| nonsynonymous SNV | 3 | 1 | 1 | 1 | 1 | 2 | ||||||||||||||
| synonymous SNV | 1 | 1 | 1 | 3 | 1 |
| cf) Tissue ID; Tissue type (1; BLCA[Bladder Urothelial Carcinoma], 2; BRCA[Breast invasive carcinoma], 3; CESC[Cervical squamous cell carcinoma and endocervical adenocarcinoma], 4; COAD[Colon adenocarcinoma], 5; GBM[Glioblastoma multiforme], 6; Glioma Low Grade, 7; HNSC[Head and Neck squamous cell carcinoma], 8; KICH[Kidney Chromophobe], 9; KIRC[Kidney renal clear cell carcinoma], 10; KIRP[Kidney renal papillary cell carcinoma], 11; LAML[Acute Myeloid Leukemia], 12; LUAD[Lung adenocarcinoma], 13; LUSC[Lung squamous cell carcinoma], 14; OV[Ovarian serous cystadenocarcinoma ], 15; PAAD[Pancreatic adenocarcinoma], 16; PRAD[Prostate adenocarcinoma], 17; SKCM[Skin Cutaneous Melanoma], 18:STAD[Stomach adenocarcinoma], 19:THCA[Thyroid carcinoma], 20:UCEC[Uterine Corpus Endometrial Carcinoma]) |
| Top |
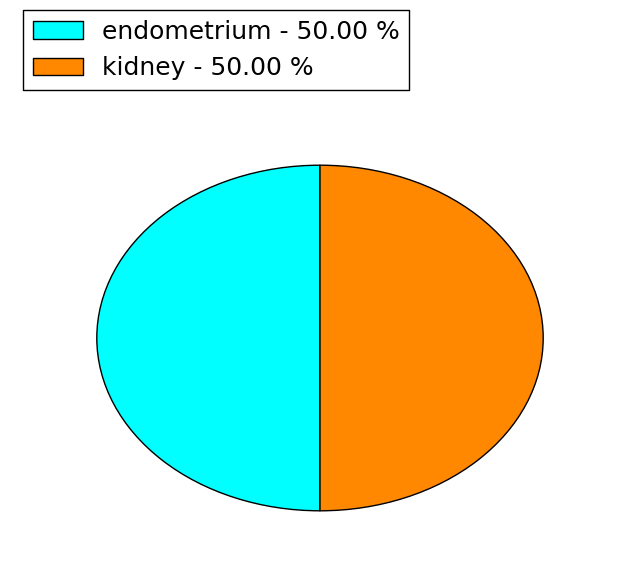
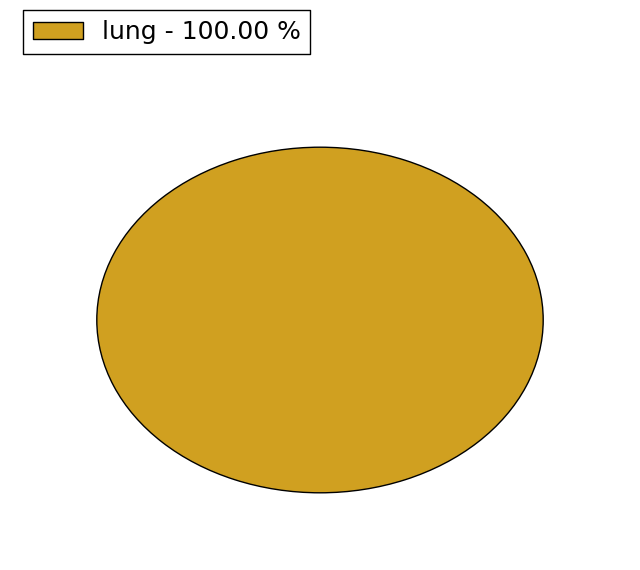
| * We represented just top 10 SNVs. When you move the cursor on each content, you can see more deailed mutation information on the Tooltip. Those are primary_site, primary_histology, mutation(aa), pubmedID. |
| Genomic Position | Mutation(aa) | Unique sampleID count |
| chr1:43829743 | p.V183A,ELOVL1 | 1 |
| chr1:43830951 | p.M174T,ELOVL1 | 1 |
| chr1:43829798 | p.M174V,ELOVL1 | 1 |
| chr1:43830980 | p.M151V,ELOVL1 | 1 |
| chr1:43830011 | p.S119S,ELOVL1 | 1 |
| chr1:43831042 | p.F116F,ELOVL1 | 1 |
| chr1:43830012 | p.D107D,ELOVL1 | 1 |
| chr1:43830081 | p.E22D,ELOVL1 | 1 |
| chr1:43830256 | p.F80F,ELOVL1 | 1 |
| chr1:43830265 | p.R59C,ELOVL1 | 1 |
| * Copy number data were extracted from TCGA using R package TCGA-Assembler. The URLs of all public data files on TCGA DCC data server were gathered on Jan-05-2015. Function ProcessCNAData in TCGA-Assembler package was used to obtain gene-level copy number value which is calculated as the average copy number of the genomic region of a gene. |
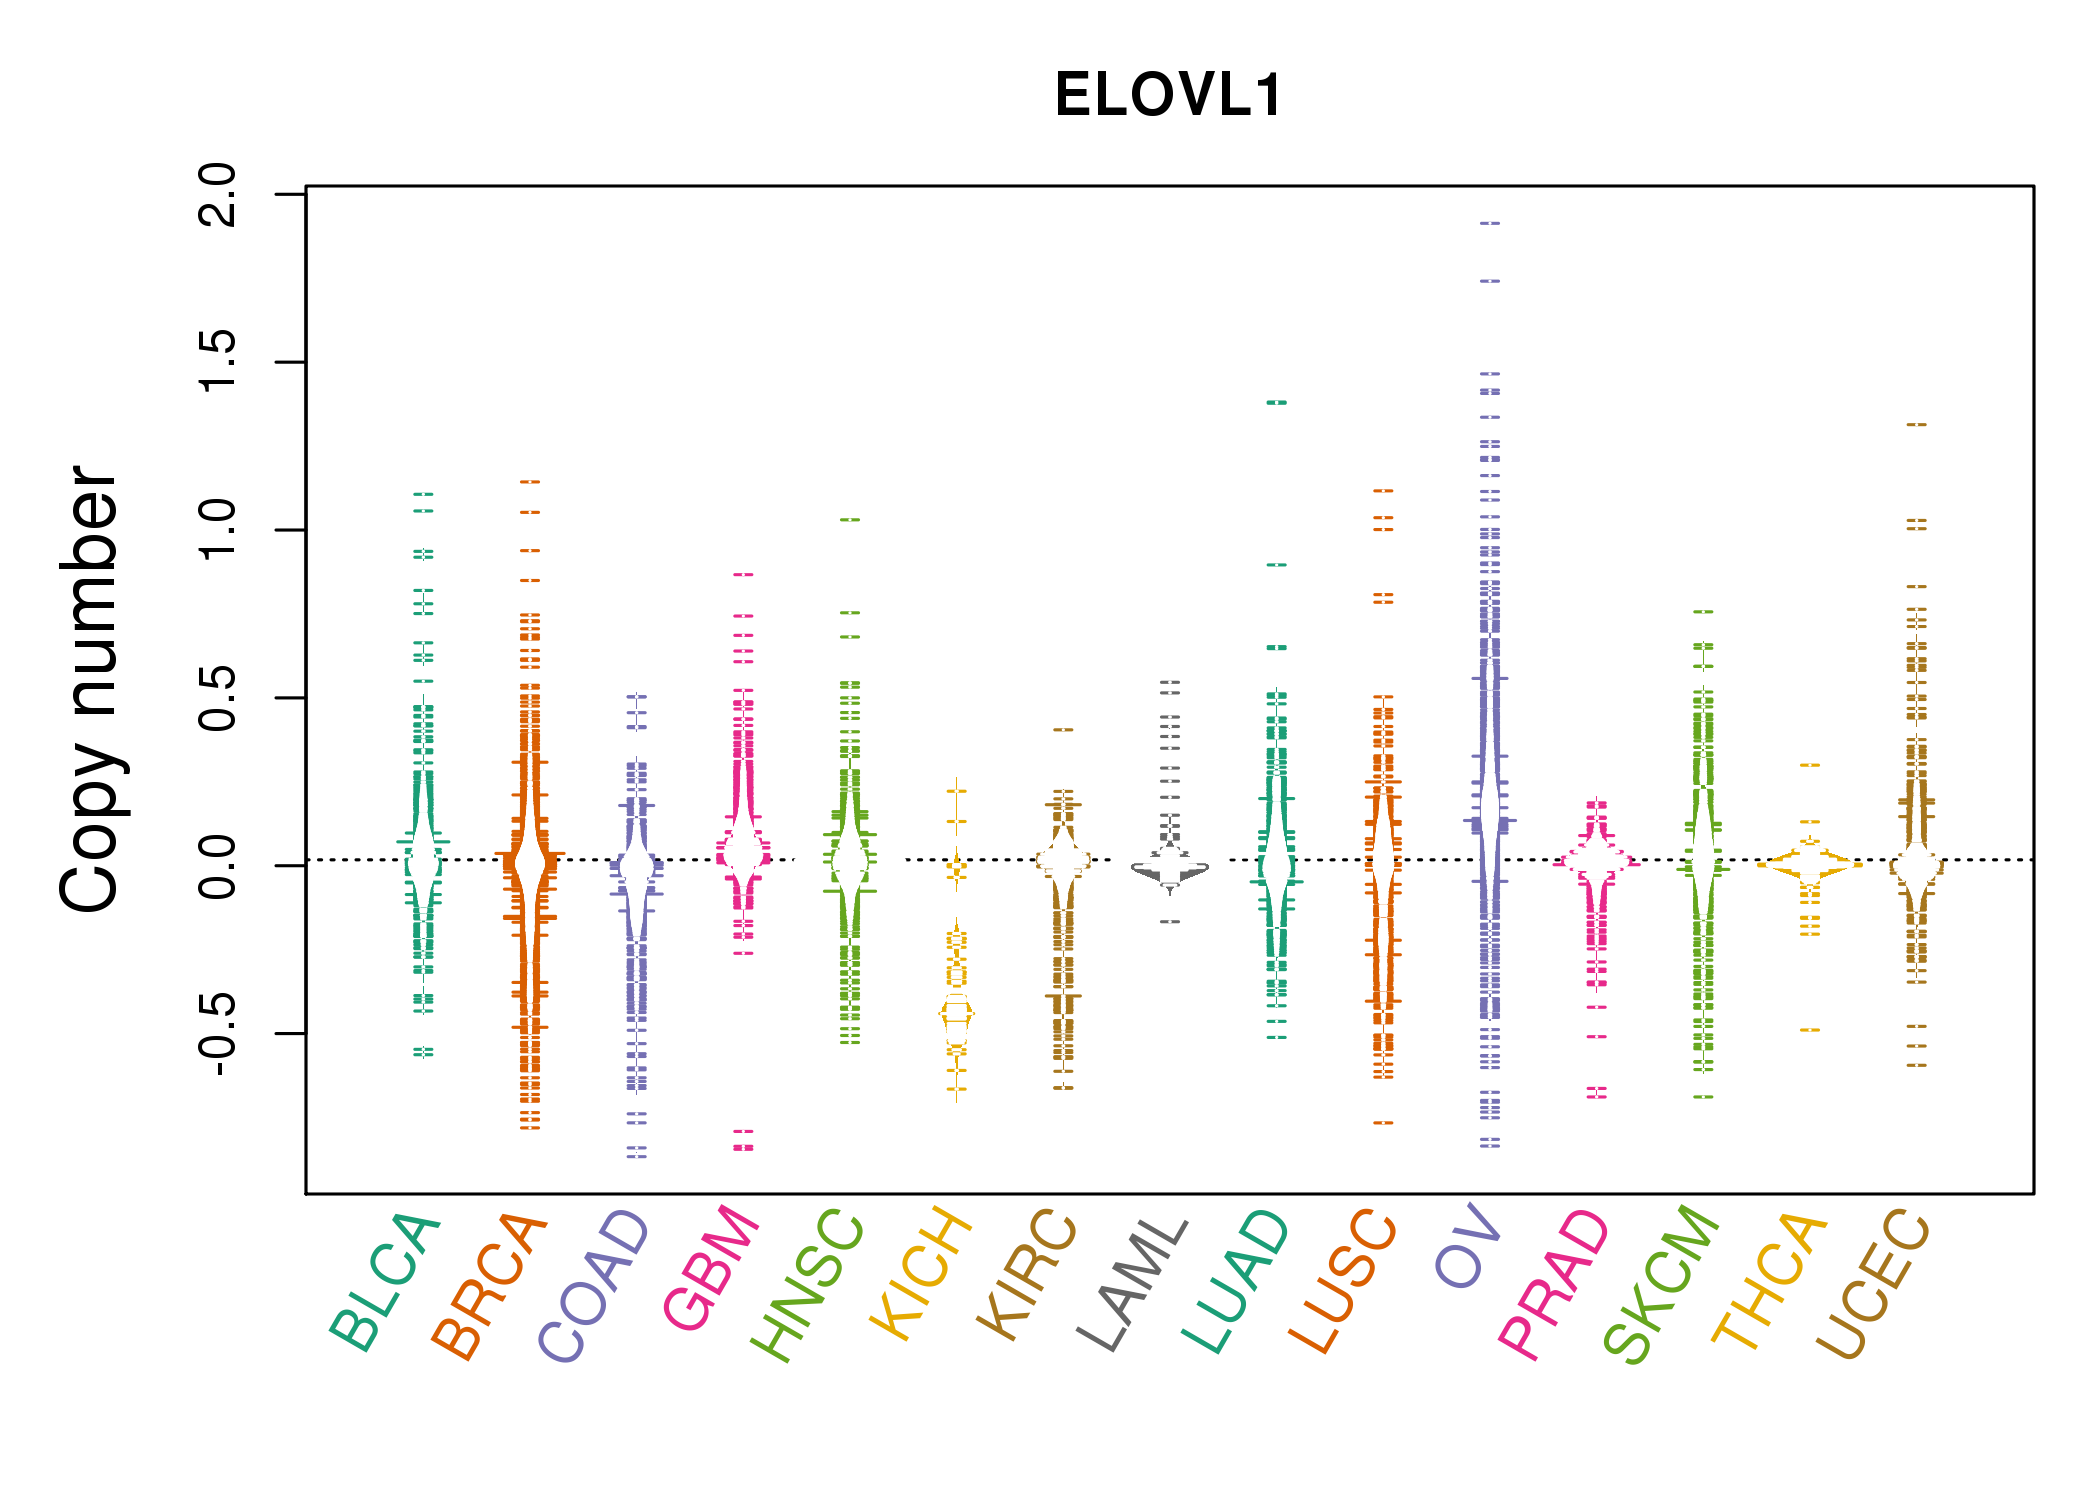 |
| cf) Tissue ID[Tissue type]: BLCA[Bladder Urothelial Carcinoma], BRCA[Breast invasive carcinoma], CESC[Cervical squamous cell carcinoma and endocervical adenocarcinoma], COAD[Colon adenocarcinoma], GBM[Glioblastoma multiforme], Glioma Low Grade, HNSC[Head and Neck squamous cell carcinoma], KICH[Kidney Chromophobe], KIRC[Kidney renal clear cell carcinoma], KIRP[Kidney renal papillary cell carcinoma], LAML[Acute Myeloid Leukemia], LUAD[Lung adenocarcinoma], LUSC[Lung squamous cell carcinoma], OV[Ovarian serous cystadenocarcinoma ], PAAD[Pancreatic adenocarcinoma], PRAD[Prostate adenocarcinoma], SKCM[Skin Cutaneous Melanoma], STAD[Stomach adenocarcinoma], THCA[Thyroid carcinoma], UCEC[Uterine Corpus Endometrial Carcinoma] |
| Top |
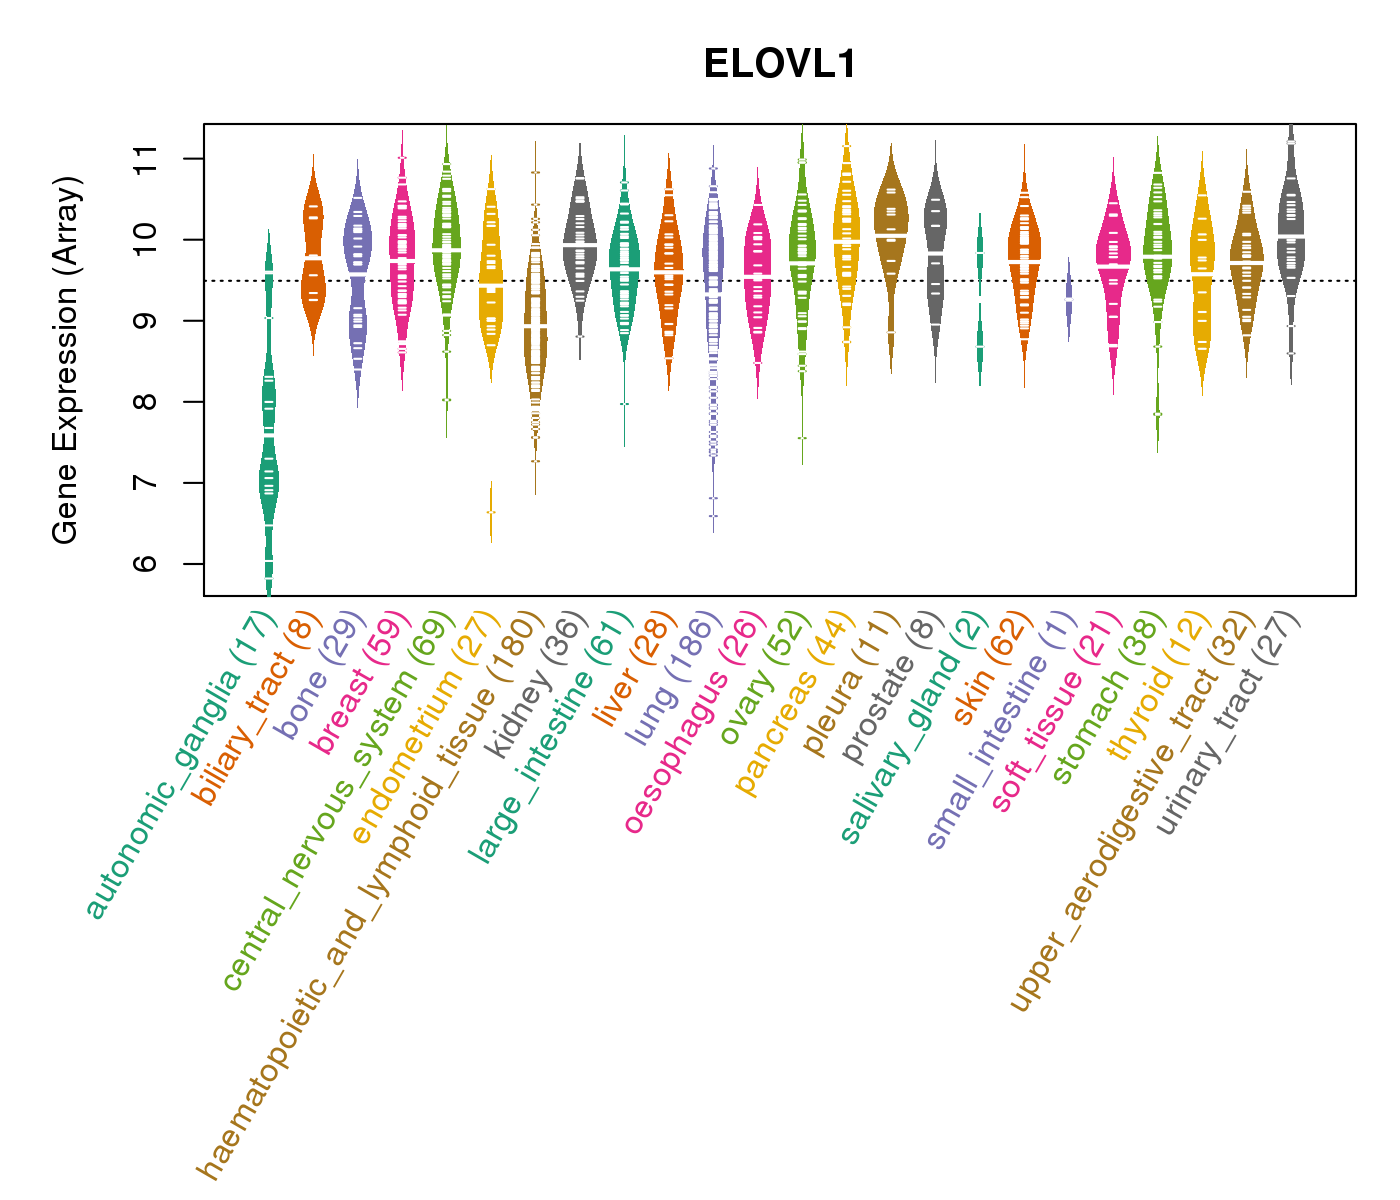
| Gene Expression for ELOVL1 |
| * CCLE gene expression data were extracted from CCLE_Expression_Entrez_2012-10-18.res: Gene-centric RMA-normalized mRNA expression data. |
 |
| * Normalized gene expression data of RNASeqV2 was extracted from TCGA using R package TCGA-Assembler. The URLs of all public data files on TCGA DCC data server were gathered at Jan-05-2015. Only eight cancer types have enough normal control samples for differential expression analysis. (t test, adjusted p<0.05 (using Benjamini-Hochberg FDR)) |
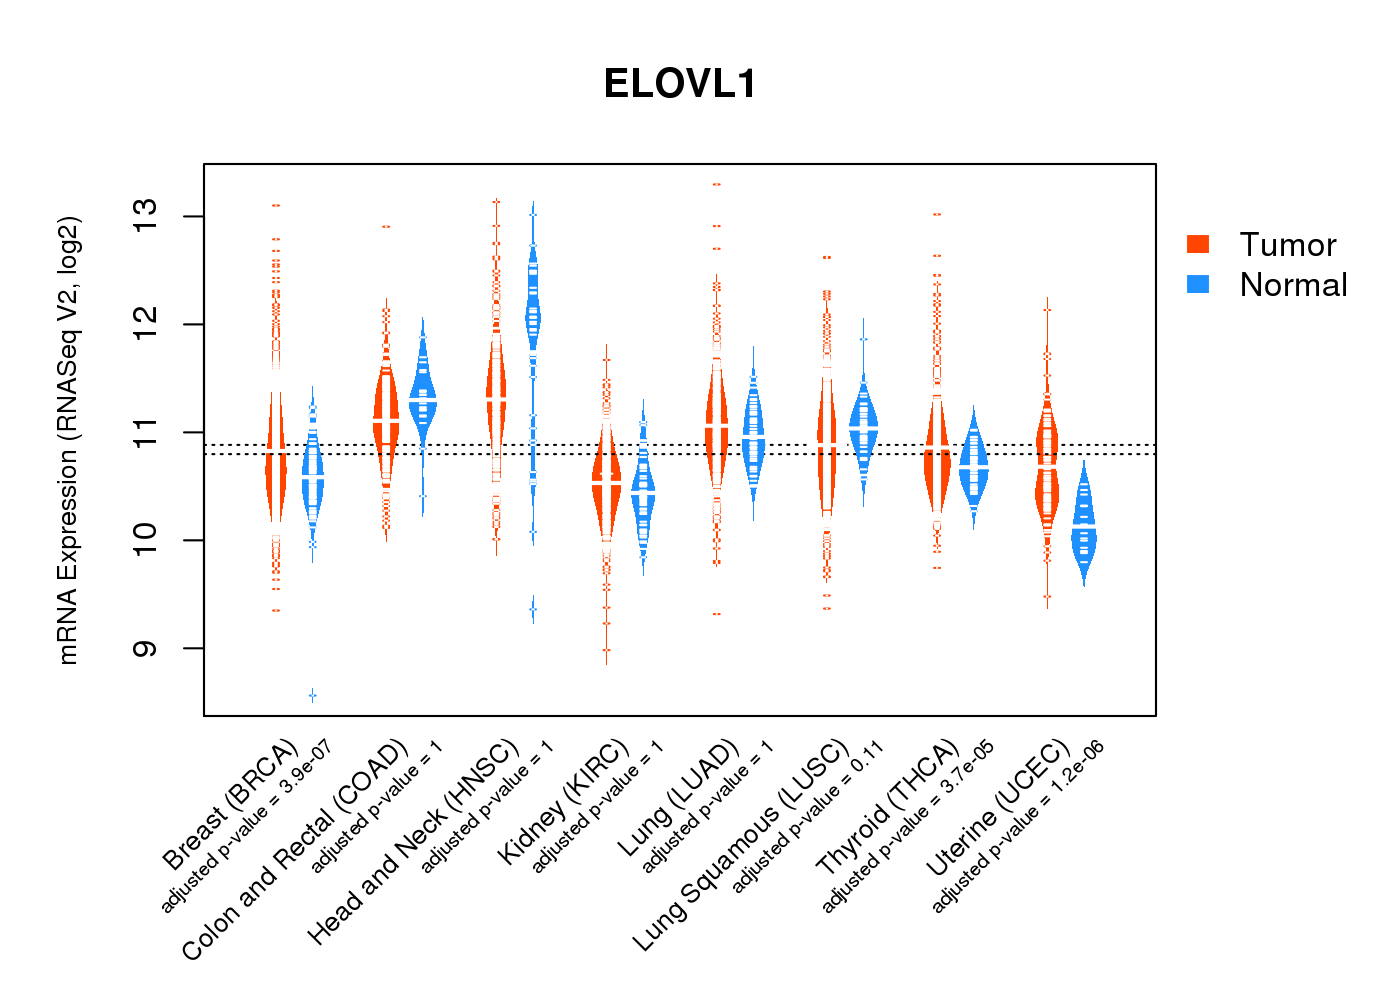 |
| Top |
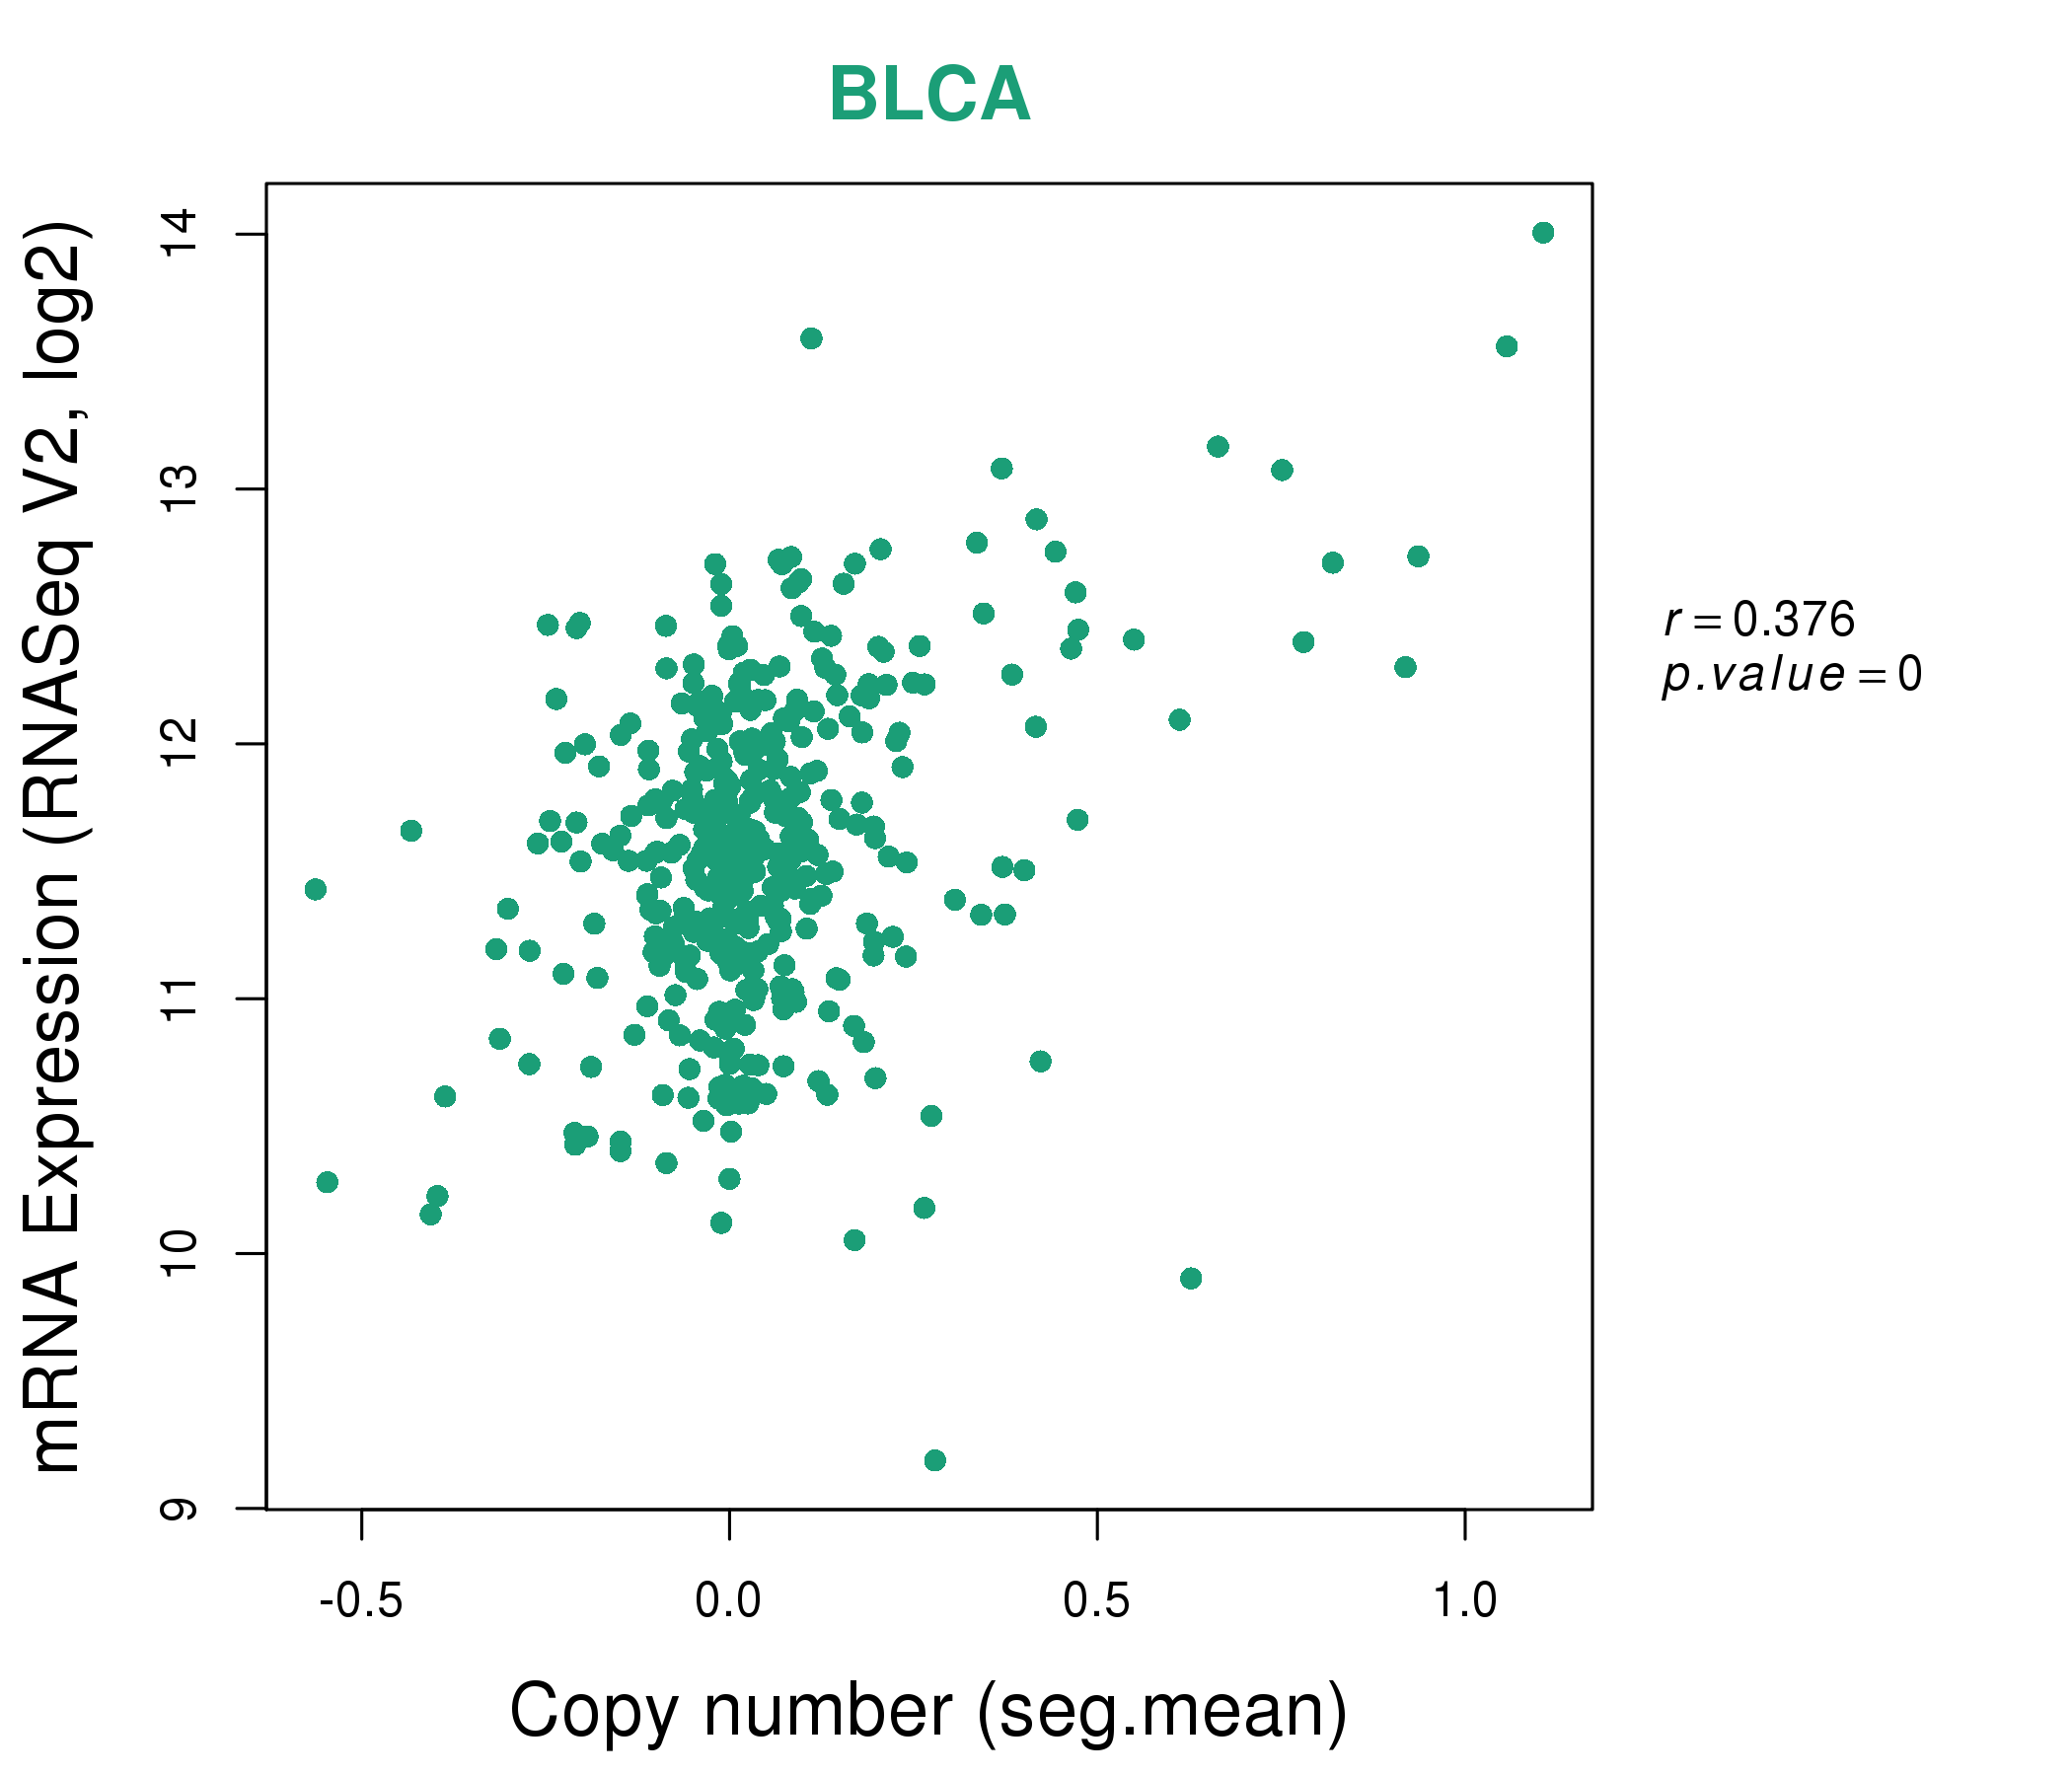
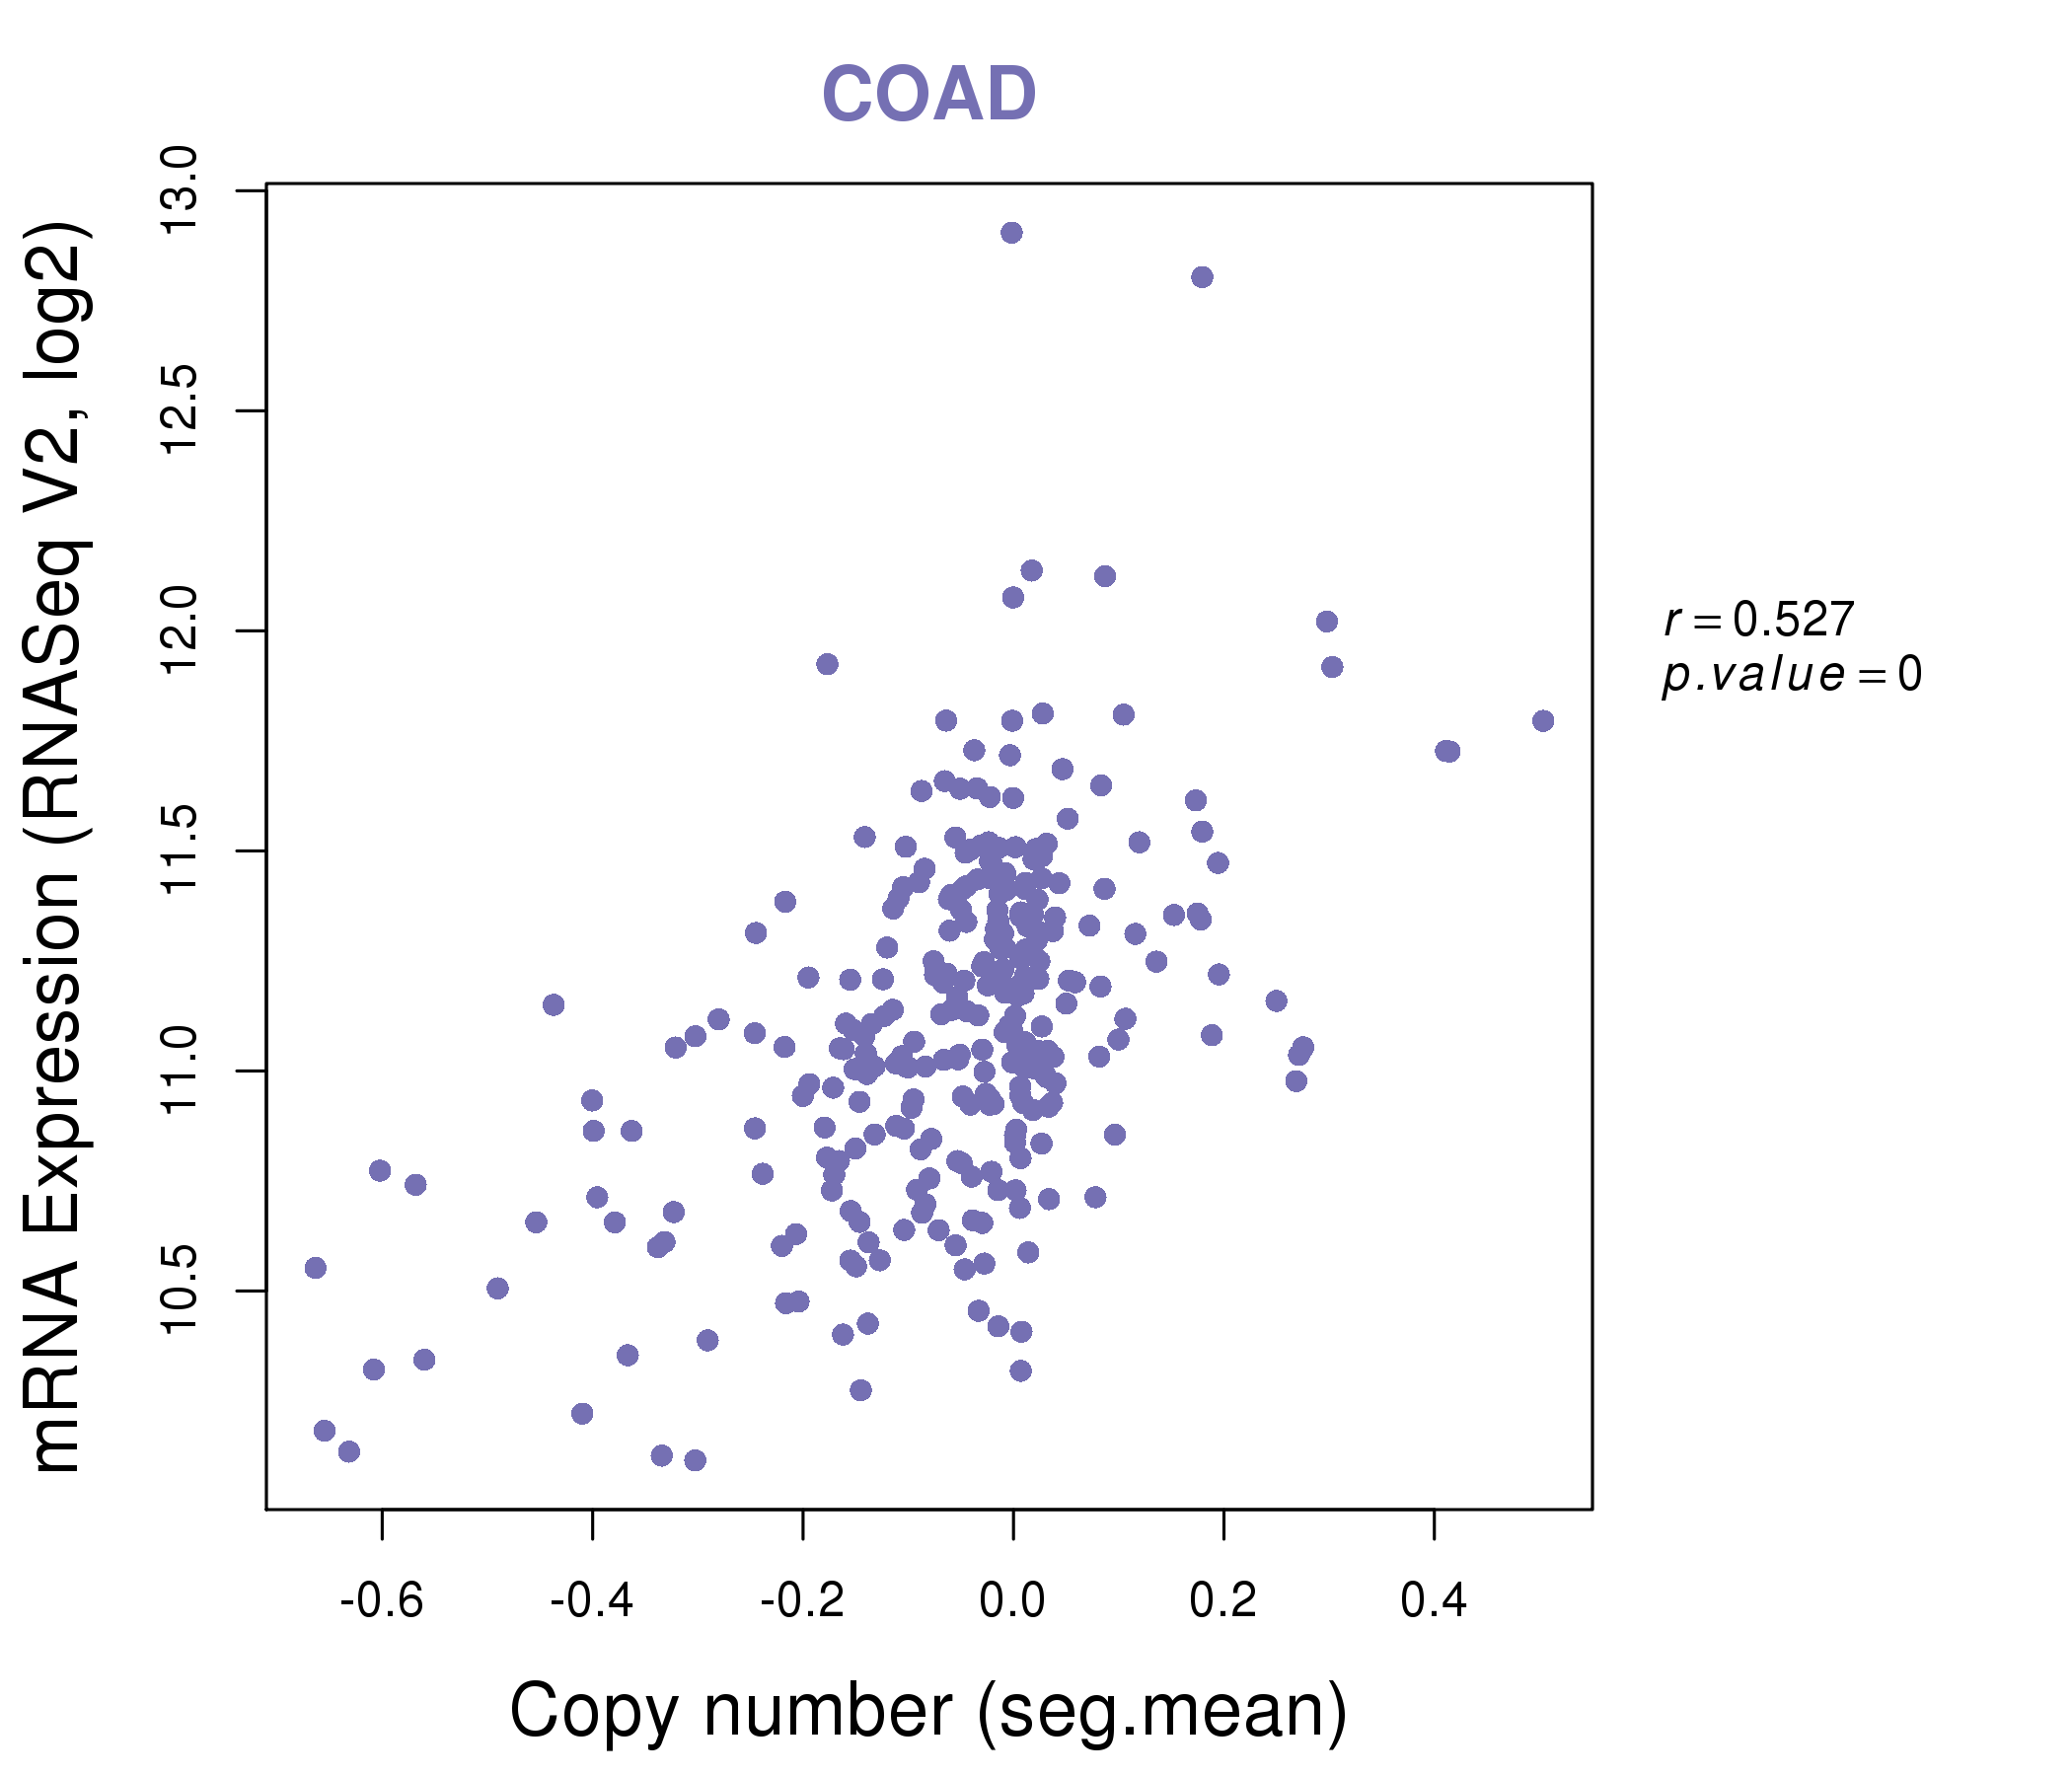
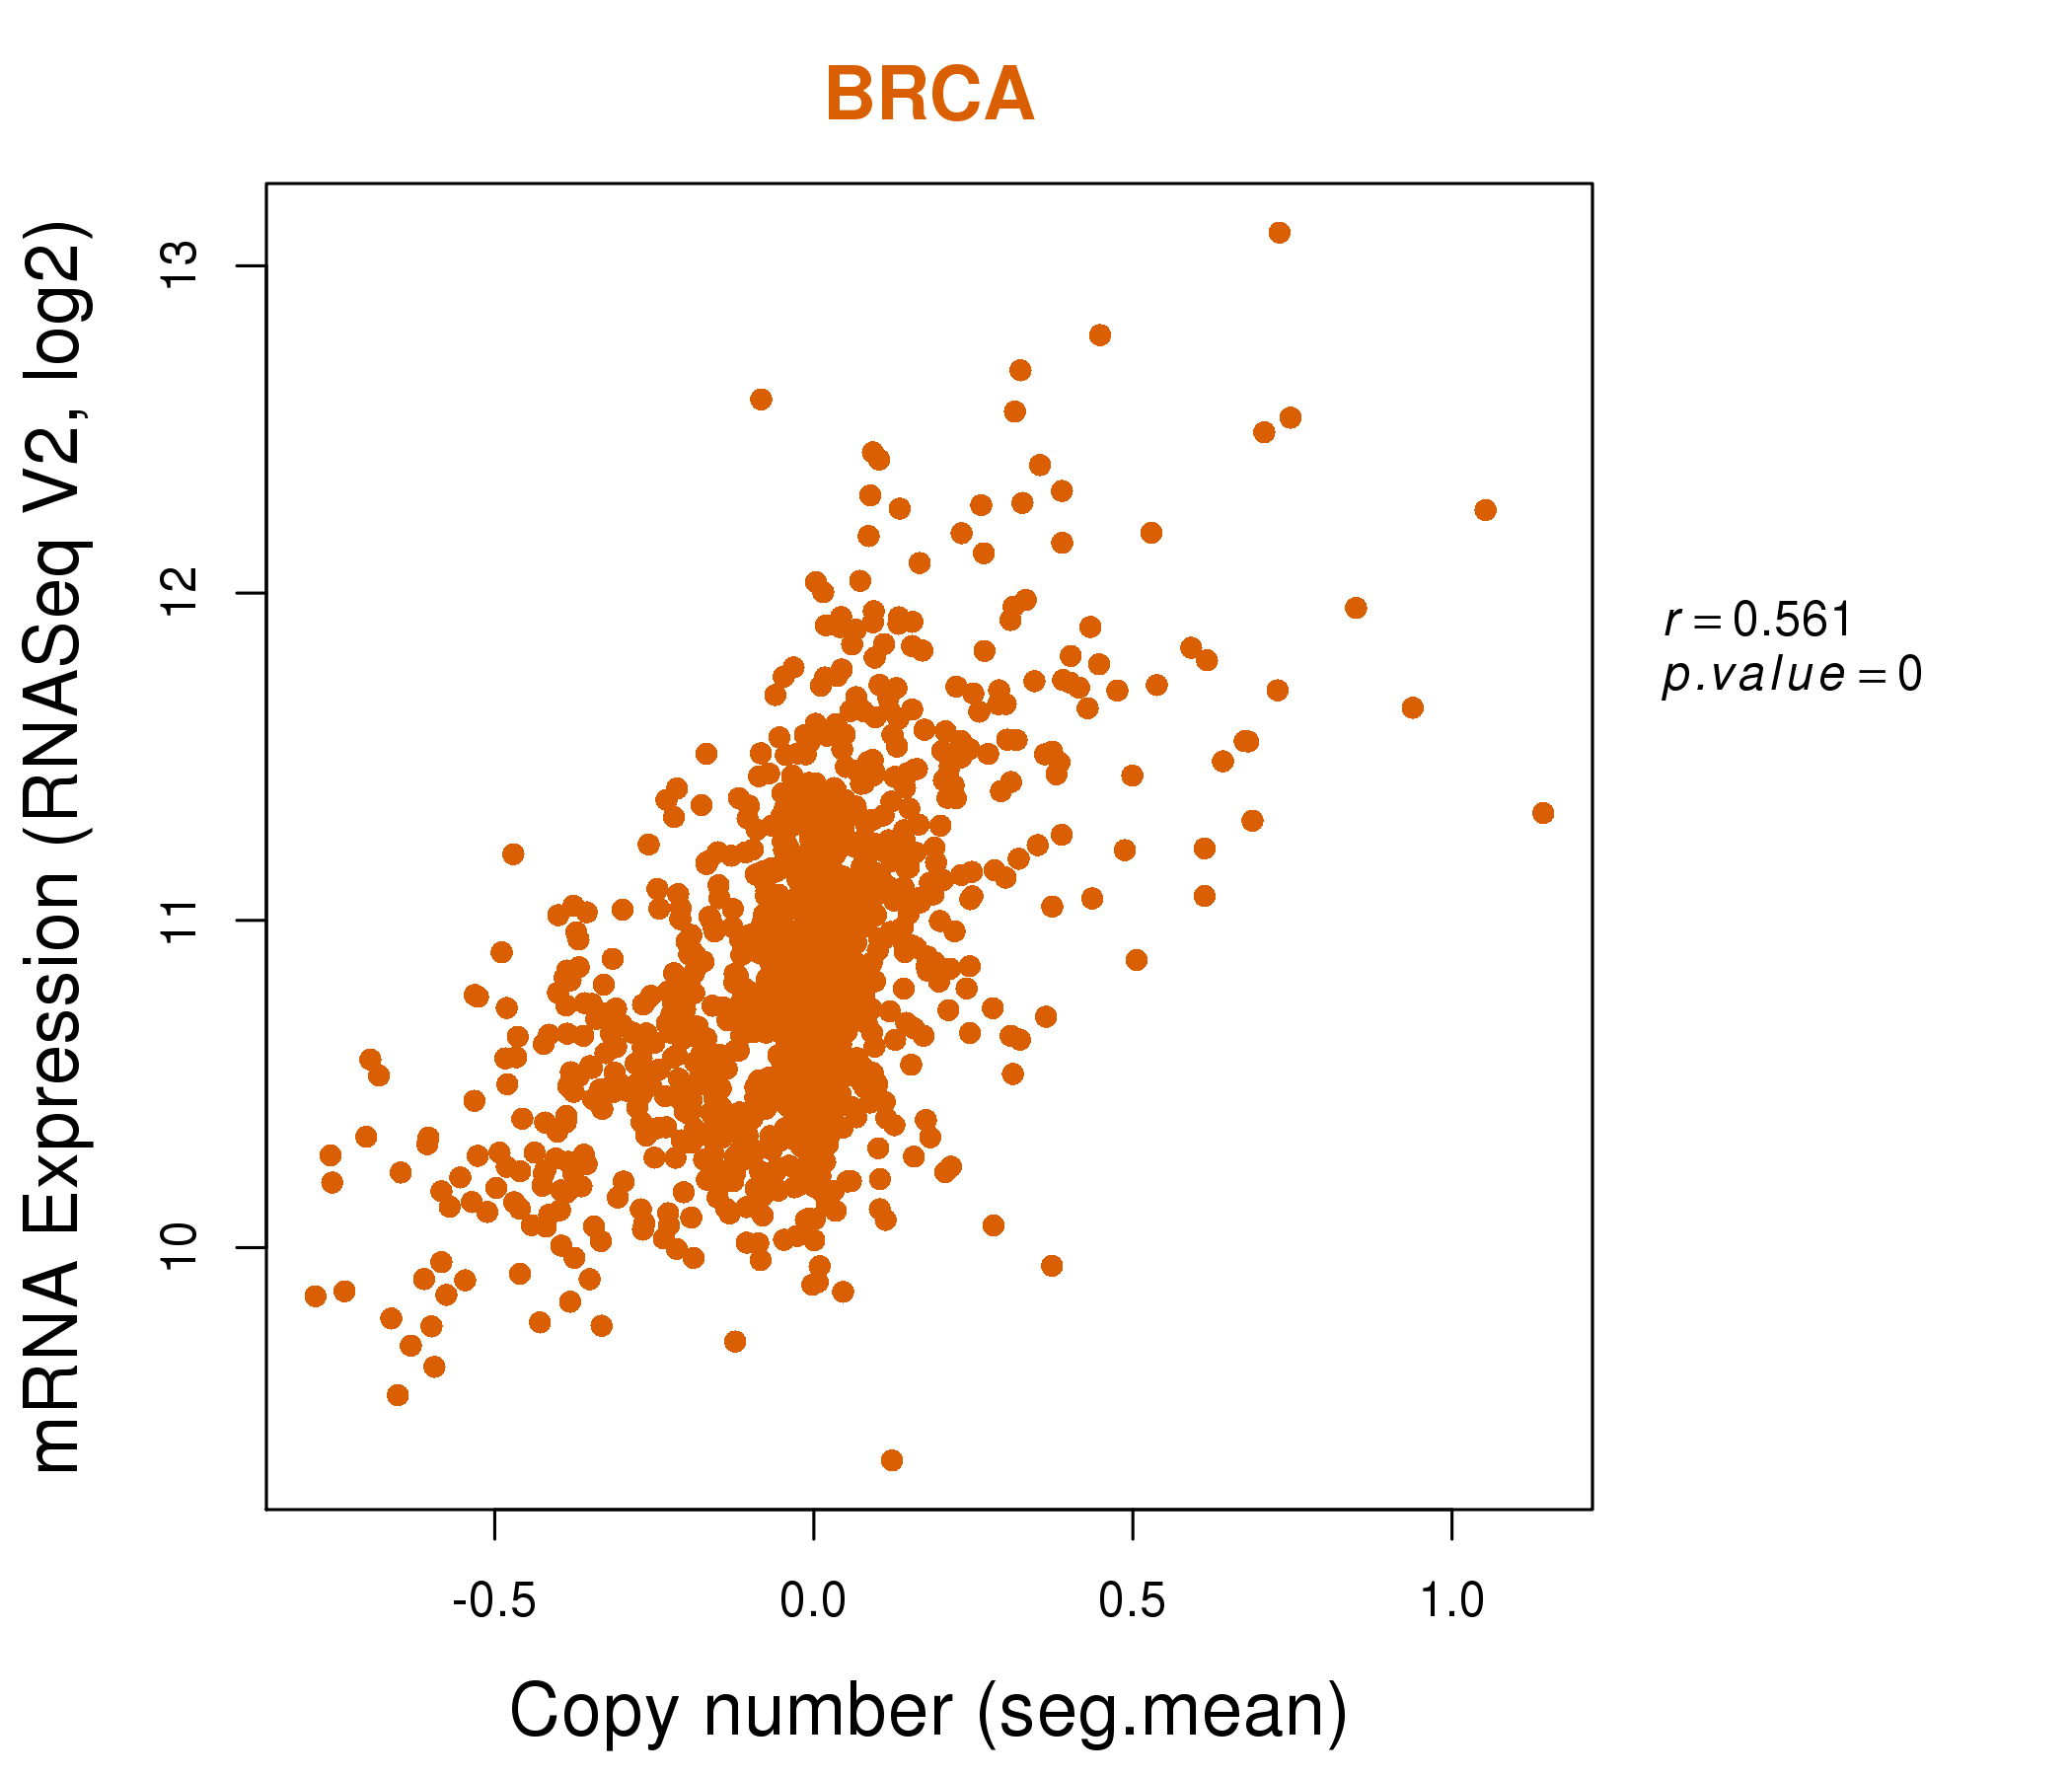
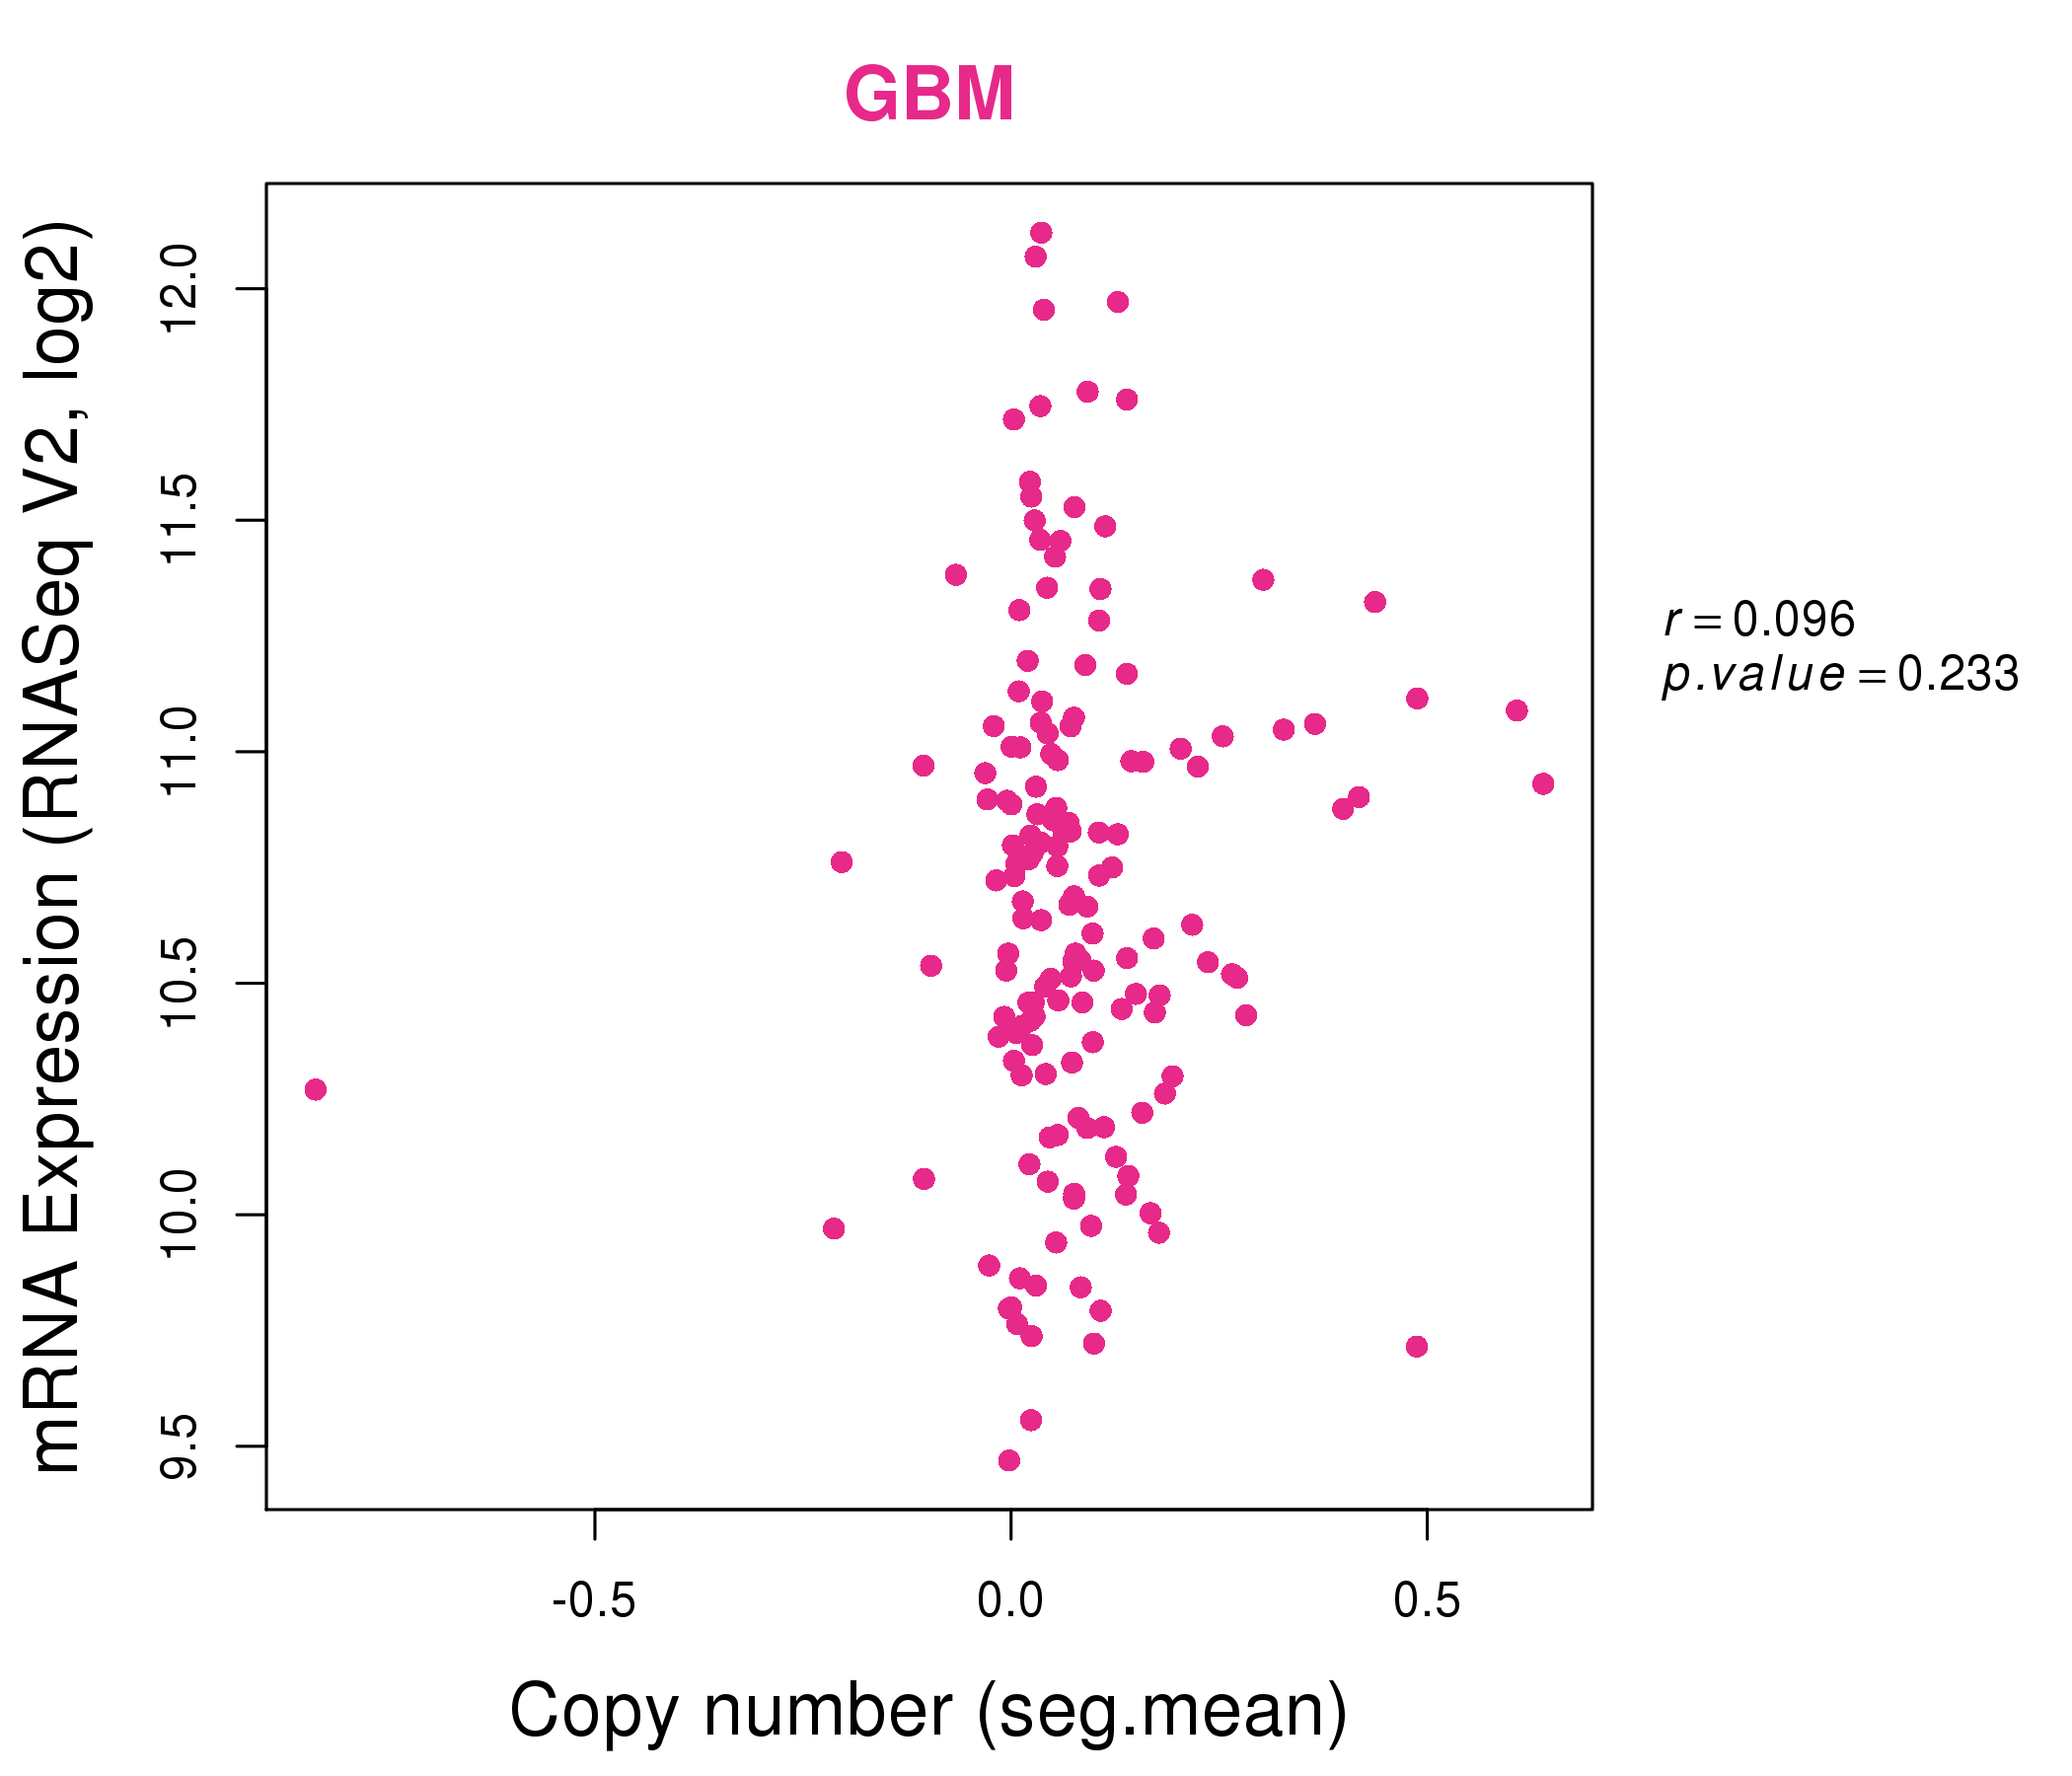
| * This plots show the correlation between CNV and gene expression. |
: Open all plots for all cancer types
 |
|
 |
|
| Top |
| Gene-Gene Network Information |
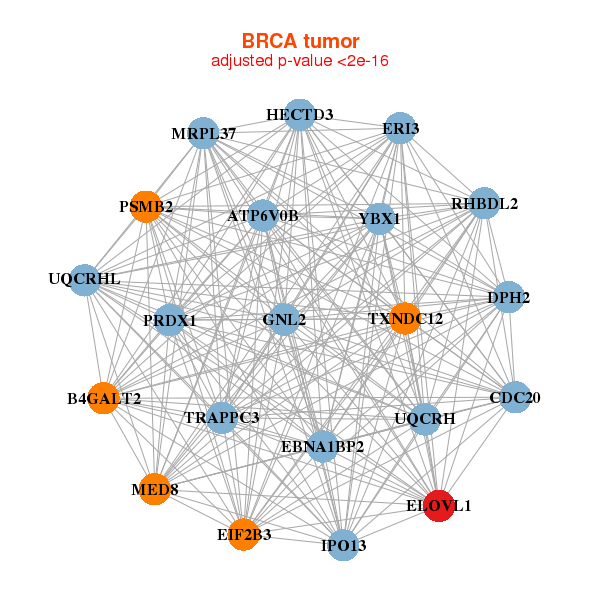
| * Co-Expression network figures were drawn using R package igraph. Only the top 20 genes with the highest correlations were shown. Red circle: input gene, orange circle: cell metabolism gene, sky circle: other gene |
: Open all plots for all cancer types
 |
|
| ATP6V0B,B4GALT2,CDC20,DPH2,EBNA1BP2,EIF2B3,ELOVL1, ERI3,GNL2,HECTD3,IPO13,MED8,MRPL37,PRDX1, PSMB2,RHBDL2,TRAPPC3,TXNDC12,UQCRH,UQCRHL,YBX1 | ANXA2,ANXA2P2,BCAP31,CAPNS1,CD151,CLPTM1L,ELOVL1, FTH1,GPX1,MAPK3,MED8,MGC72080,MSRA,NME4, NUDT5,PGAM1,PRDX4,TMEM189,TMEM214,UBE2L3,VKORC1 |
 |
|
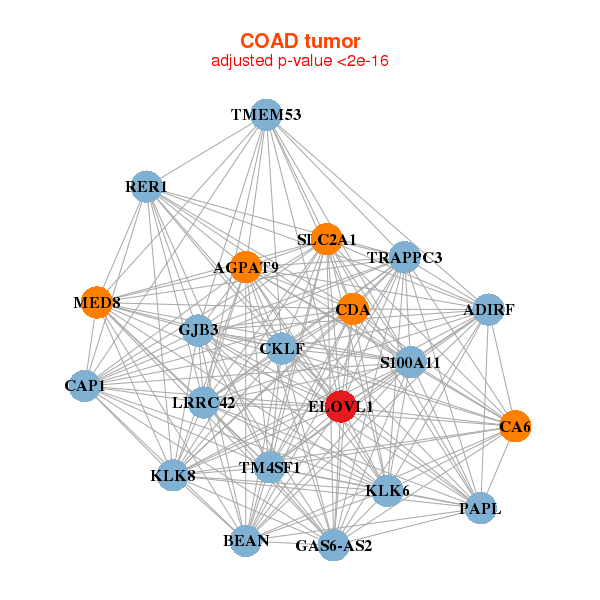
| AGPAT9,BEAN,ADIRF,CA6,CAP1,CDA,CKLF, ELOVL1,GAS6-AS2,GJB3,KLK6,KLK8,LRRC42,MED8, PAPL,RER1,S100A11,SLC2A1,TM4SF1,TMEM53,TRAPPC3 | APEX2,ATP6V0D1,CALML4,CFL1,CIB1,CLDN7,DOK4, EIF6,ELOVL1,EPCAM,HN1,HTATIP2,MAPK3,MYL12A, OSTF1,PKIB,POLD4,PPP1R14D,TMEM45B,TMEM53,TSPAN1 |

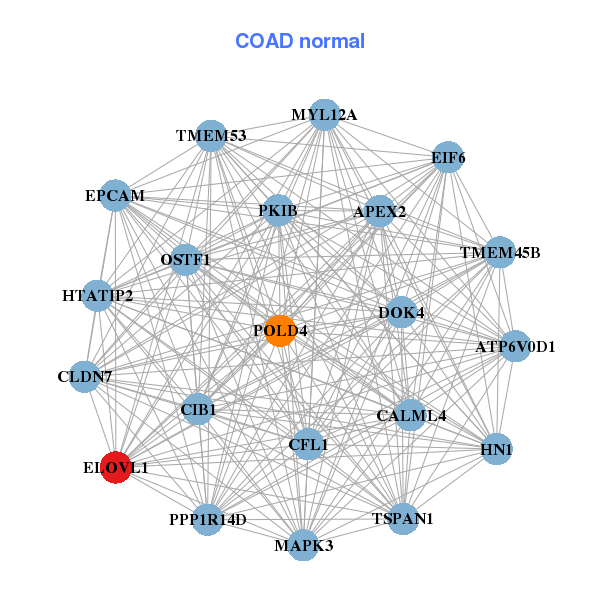
| * Co-Expression network figures were drawn using R package igraph. Only the top 20 genes with the highest correlations were shown. Red circle: input gene, orange circle: cell metabolism gene, sky circle: other gene |
: Open all plots for all cancer types
| Top |
: Open all interacting genes' information including KEGG pathway for all interacting genes from DAVID
| Top |
| Pharmacological Information for ELOVL1 |
| There's no related Drug. |
| Top |
| Cross referenced IDs for ELOVL1 |
| * We obtained these cross-references from Uniprot database. It covers 150 different DBs, 18 categories. http://www.uniprot.org/help/cross_references_section |
: Open all cross reference information
|
Copyright © 2016-Present - The Univsersity of Texas Health Science Center at Houston @ |