|
|||||||||||||||||||||||||||||||||||||||||||||||||||||||||||||||||||||||||||||||||||||||||||||||||||||||||||||||||||||||||||||||||||||||||||||||||||||||||||||||||||||||||||||||||||||||||||||||||||||||||||||||||||||||||||||||||||||||||||||||||||||||||||||||||||||||||||||||||||||||||||||||||||||||||||||||||||||||||||||||||||||||||||||||||||||||||||||||||||||||||||
| |
| Phenotypic Information (metabolism pathway, cancer, disease, phenome) |
| |
| |
| Gene-Gene Network Information: Co-Expression Network, Interacting Genes & KEGG |
| |
|


| Gene Summary for BMP1 |
| Basic gene info. | Gene symbol | BMP1 |
| Gene name | bone morphogenetic protein 1 | |
| Synonyms | OI13|PCOLC|PCP|PCP2|TLD | |
| Cytomap | UCSC genome browser: 8p21.3 | |
| Genomic location | chr8 :22022652-22058996 | |
| Type of gene | protein-coding | |
| RefGenes | NM_001199.3, NM_006129.4,NR_033403.1,NR_033404.1,NM_006128.2, NM_006130.1,NM_006131.1,NM_006132.1, | |
| Ensembl id | ENSG00000168487 | |
| Description | mammalian tolloid proteinprocollagen C-endopeptidaseprocollagen C-proteinase 3 | |
| Modification date | 20141207 | |
| dbXrefs | MIM : 112264 | |
| HGNC : HGNC | ||
| Ensembl : ENSG00000168487 | ||
| HPRD : 00209 | ||
| Vega : OTTHUMG00000097761 | ||
| Protein | UniProt: P13497 go to UniProt's Cross Reference DB Table | |
| Expression | CleanEX: HS_BMP1 | |
| BioGPS: 649 | ||
| Gene Expression Atlas: ENSG00000168487 | ||
| The Human Protein Atlas: ENSG00000168487 | ||
| Pathway | NCI Pathway Interaction Database: BMP1 | |
| KEGG: BMP1 | ||
| REACTOME: BMP1 | ||
| ConsensusPathDB | ||
| Pathway Commons: BMP1 | ||
| Metabolism | MetaCyc: BMP1 | |
| HUMANCyc: BMP1 | ||
| Regulation | Ensembl's Regulation: ENSG00000168487 | |
| miRBase: chr8 :22,022,652-22,058,996 | ||
| TargetScan: NM_001199 | ||
| cisRED: ENSG00000168487 | ||
| Context | iHOP: BMP1 | |
| cancer metabolism search in PubMed: BMP1 | ||
| UCL Cancer Institute: BMP1 | ||
| Assigned class in ccmGDB | A - This gene has a literature evidence and it belongs to cancer gene. | |
| References showing role of BMP1 in cancer cell metabolism | 1. Palmieri D, Fitzgerald D, Shreeve SM, Hua E, Bronder JL, et al. (2009) Analyses of resected human brain metastases of breast cancer reveal the association between up-regulation of hexokinase 2 and poor prognosis. Mol Cancer Res 7: 1438-1445. doi: 10.1158/1541-7786.MCR-09-0234. pmid: 2746883 go to article | |
| Top |
| Phenotypic Information for BMP1(metabolism pathway, cancer, disease, phenome) |
| Cancer | CGAP: BMP1 |
| Familial Cancer Database: BMP1 | |
| * This gene is included in those cancer gene databases. |
|
|
|
|
|
|
| |||||||||||||||||||||||||||||||||||||||||||||||||||||||||||||||||||||||||||||||||||||||||||||||||||||||||||||||||||||||||||||||||||||||||||||||||||||||||||||||||||||||||||||||||||||||||||||||||||||||||||||||||||||||||||||||||||||||||||||||||||||||||||||||||||||||||||||||||||||||||||||||||||||||||||||||||||||||||||||||||||||||||||||||||||||||||||||||||||||
Oncogene 1 | Significant driver gene in | ||||||||||||||||||||||||||||||||||||||||||||||||||||||||||||||||||||||||||||||||||||||||||||||||||||||||||||||||||||||||||||||||||||||||||||||||||||||||||||||||||||||||||||||||||||||||||||||||||||||||||||||||||||||||||||||||||||||||||||||||||||||||||||||||||||||||||||||||||||||||||||||||||||||||||||||||||||||||||||||||||||||||||||||||||||||||||||||||||||||||||
| cf) number; DB name 1 Oncogene; http://nar.oxfordjournals.org/content/35/suppl_1/D721.long, 2 Tumor Suppressor gene; https://bioinfo.uth.edu/TSGene/, 3 Cancer Gene Census; http://www.nature.com/nrc/journal/v4/n3/abs/nrc1299.html, 4 CancerGenes; http://nar.oxfordjournals.org/content/35/suppl_1/D721.long, 5 Network of Cancer Gene; http://ncg.kcl.ac.uk/index.php, 1Therapeutic Vulnerabilities in Cancer; http://cbio.mskcc.org/cancergenomics/statius/ |
| REACTOME_METABOLISM_OF_LIPIDS_AND_LIPOPROTEINS REACTOME_LIPOPROTEIN_METABOLISM | |
| OMIM | 112264; gene. 112264; gene. 614856; phenotype. 614856; phenotype. |
| Orphanet | 216812; Osteogenesis imperfecta type 3. 216812; Osteogenesis imperfecta type 3. |
| Disease | KEGG Disease: BMP1 |
| MedGen: BMP1 (Human Medical Genetics with Condition) | |
| ClinVar: BMP1 | |
| Phenotype | MGI: BMP1 (International Mouse Phenotyping Consortium) |
| PhenomicDB: BMP1 | |
| Mutations for BMP1 |
| * Under tables are showing count per each tissue to give us broad intuition about tissue specific mutation patterns.You can go to the detailed page for each mutation database's web site. |
| There's no structural variation information in COSMIC data for this gene. |
| * From mRNA Sanger sequences, Chitars2.0 arranged chimeric transcripts. This table shows BMP1 related fusion information. |
| ID | Head Gene | Tail Gene | Accession | Gene_a | qStart_a | qEnd_a | Chromosome_a | tStart_a | tEnd_a | Gene_a | qStart_a | qEnd_a | Chromosome_a | tStart_a | tEnd_a |
| BF737796 | BMP1 | 9 | 347 | 8 | 22037967 | 22052046 | MALL | 345 | 430 | 2 | 110841958 | 110842043 | |
| AA452720 | BMP1 | 3 | 128 | 8 | 22052259 | 22052390 | BMP1 | 123 | 474 | 8 | 22034121 | 22035467 | |
| BQ370786 | KCTD10 | 9 | 373 | 12 | 109888610 | 109888974 | BMP1 | 369 | 475 | 8 | 22058288 | 22058394 | |
| Top |
| Mutation type/ Tissue ID | brca | cns | cerv | endome | haematopo | kidn | Lintest | liver | lung | ns | ovary | pancre | prost | skin | stoma | thyro | urina | |||
| Total # sample | 1 | |||||||||||||||||||
| GAIN (# sample) | ||||||||||||||||||||
| LOSS (# sample) | 1 |
| cf) Tissue ID; Tissue type (1; Breast, 2; Central_nervous_system, 3; Cervix, 4; Endometrium, 5; Haematopoietic_and_lymphoid_tissue, 6; Kidney, 7; Large_intestine, 8; Liver, 9; Lung, 10; NS, 11; Ovary, 12; Pancreas, 13; Prostate, 14; Skin, 15; Stomach, 16; Thyroid, 17; Urinary_tract) |
| Top |
|
 |
| Top |
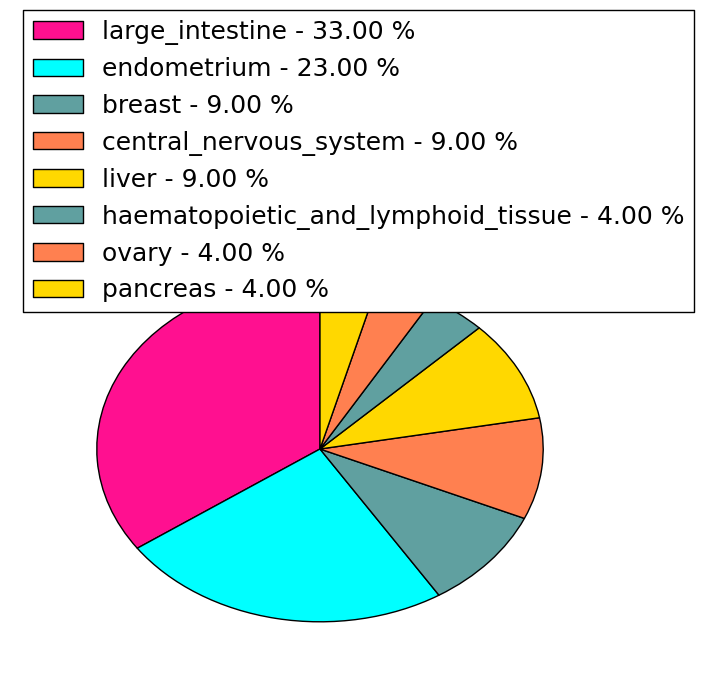
| Stat. for Non-Synonymous SNVs (# total SNVs=61) | (# total SNVs=21) |
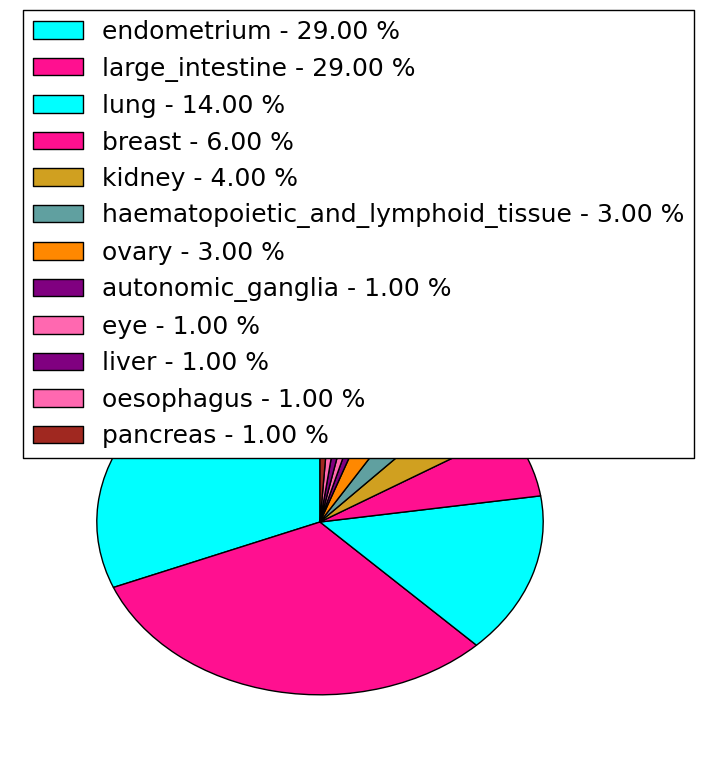 |  |
(# total SNVs=3) | (# total SNVs=4) |
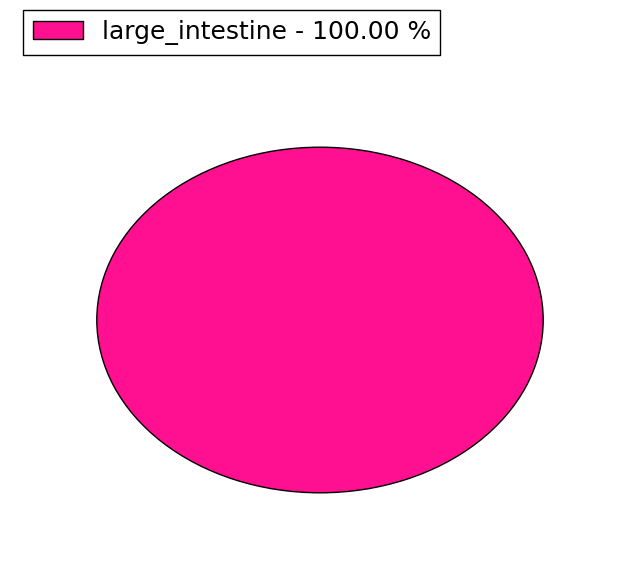 | 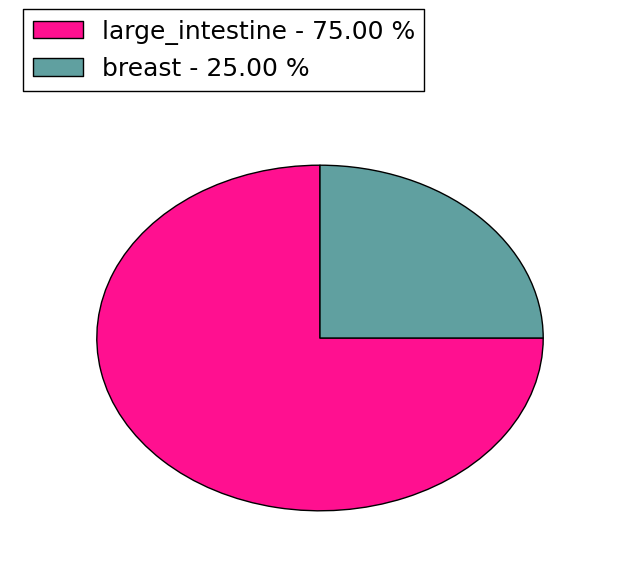 |
| Top |
| * When you move the cursor on each content, you can see more deailed mutation information on the Tooltip. Those are primary_site,primary_histology,mutation(aa),pubmedID. |
| GRCh37 position | Mutation(aa) | Unique sampleID count |
| chr8:22054259-22054260 | p.N614fs*21 | 3 |
| chr8:22066962-22066962 | p.C860C | 3 |
| chr8:22053004-22053004 | p.G557R | 2 |
| chr8:22064409-22064409 | p.T759N | 2 |
| chr8:22052315-22052315 | p.R508C | 2 |
| chr8:22054230-22054230 | p.S601S | 2 |
| chr8:22052228-22052228 | p.? | 2 |
| chr8:22037901-22037901 | p.D328H | 2 |
| chr8:22034502-22034502 | p.G194R | 2 |
| chr8:22033756-22033756 | p.A121A | 2 |
| Top |
|
 |
| Point Mutation/ Tissue ID | 1 | 2 | 3 | 4 | 5 | 6 | 7 | 8 | 9 | 10 | 11 | 12 | 13 | 14 | 15 | 16 | 17 | 18 | 19 | 20 |
| # sample | 3 | 1 | 12 | 1 | 1 | 2 | 1 | 7 | 1 | 3 | 1 | 1 | 11 | 11 | 16 | |||||
| # mutation | 3 | 1 | 13 | 1 | 1 | 2 | 1 | 9 | 1 | 3 | 1 | 1 | 12 | 12 | 23 | |||||
| nonsynonymous SNV | 1 | 8 | 1 | 2 | 1 | 9 | 2 | 1 | 4 | 7 | 18 | |||||||||
| synonymous SNV | 3 | 5 | 1 | 1 | 1 | 1 | 8 | 5 | 5 |
| cf) Tissue ID; Tissue type (1; BLCA[Bladder Urothelial Carcinoma], 2; BRCA[Breast invasive carcinoma], 3; CESC[Cervical squamous cell carcinoma and endocervical adenocarcinoma], 4; COAD[Colon adenocarcinoma], 5; GBM[Glioblastoma multiforme], 6; Glioma Low Grade, 7; HNSC[Head and Neck squamous cell carcinoma], 8; KICH[Kidney Chromophobe], 9; KIRC[Kidney renal clear cell carcinoma], 10; KIRP[Kidney renal papillary cell carcinoma], 11; LAML[Acute Myeloid Leukemia], 12; LUAD[Lung adenocarcinoma], 13; LUSC[Lung squamous cell carcinoma], 14; OV[Ovarian serous cystadenocarcinoma ], 15; PAAD[Pancreatic adenocarcinoma], 16; PRAD[Prostate adenocarcinoma], 17; SKCM[Skin Cutaneous Melanoma], 18:STAD[Stomach adenocarcinoma], 19:THCA[Thyroid carcinoma], 20:UCEC[Uterine Corpus Endometrial Carcinoma]) |
| Top |
| * We represented just top 10 SNVs. When you move the cursor on each content, you can see more deailed mutation information on the Tooltip. Those are primary_site, primary_histology, mutation(aa), pubmedID. |
| Genomic Position | Mutation(aa) | Unique sampleID count |
| chr8:22066962 | p.C860C | 2 |
| chr8:22064471 | p.N543S,BMP1 | 1 |
| chr8:22033798 | p.R712L | 1 |
| chr8:22052270 | p.V868M | 1 |
| chr8:22067158 | p.R64R,BMP1 | 1 |
| chr8:22037292 | p.G300S,BMP1 | 1 |
| chr8:22053004 | p.C435C,BMP1 | 1 |
| chr8:22022973 | p.R556R,BMP1 | 1 |
| chr8:22051620 | p.C718Y | 1 |
| chr8:22054897 | p.C917C | 1 |
| * Copy number data were extracted from TCGA using R package TCGA-Assembler. The URLs of all public data files on TCGA DCC data server were gathered on Jan-05-2015. Function ProcessCNAData in TCGA-Assembler package was used to obtain gene-level copy number value which is calculated as the average copy number of the genomic region of a gene. |
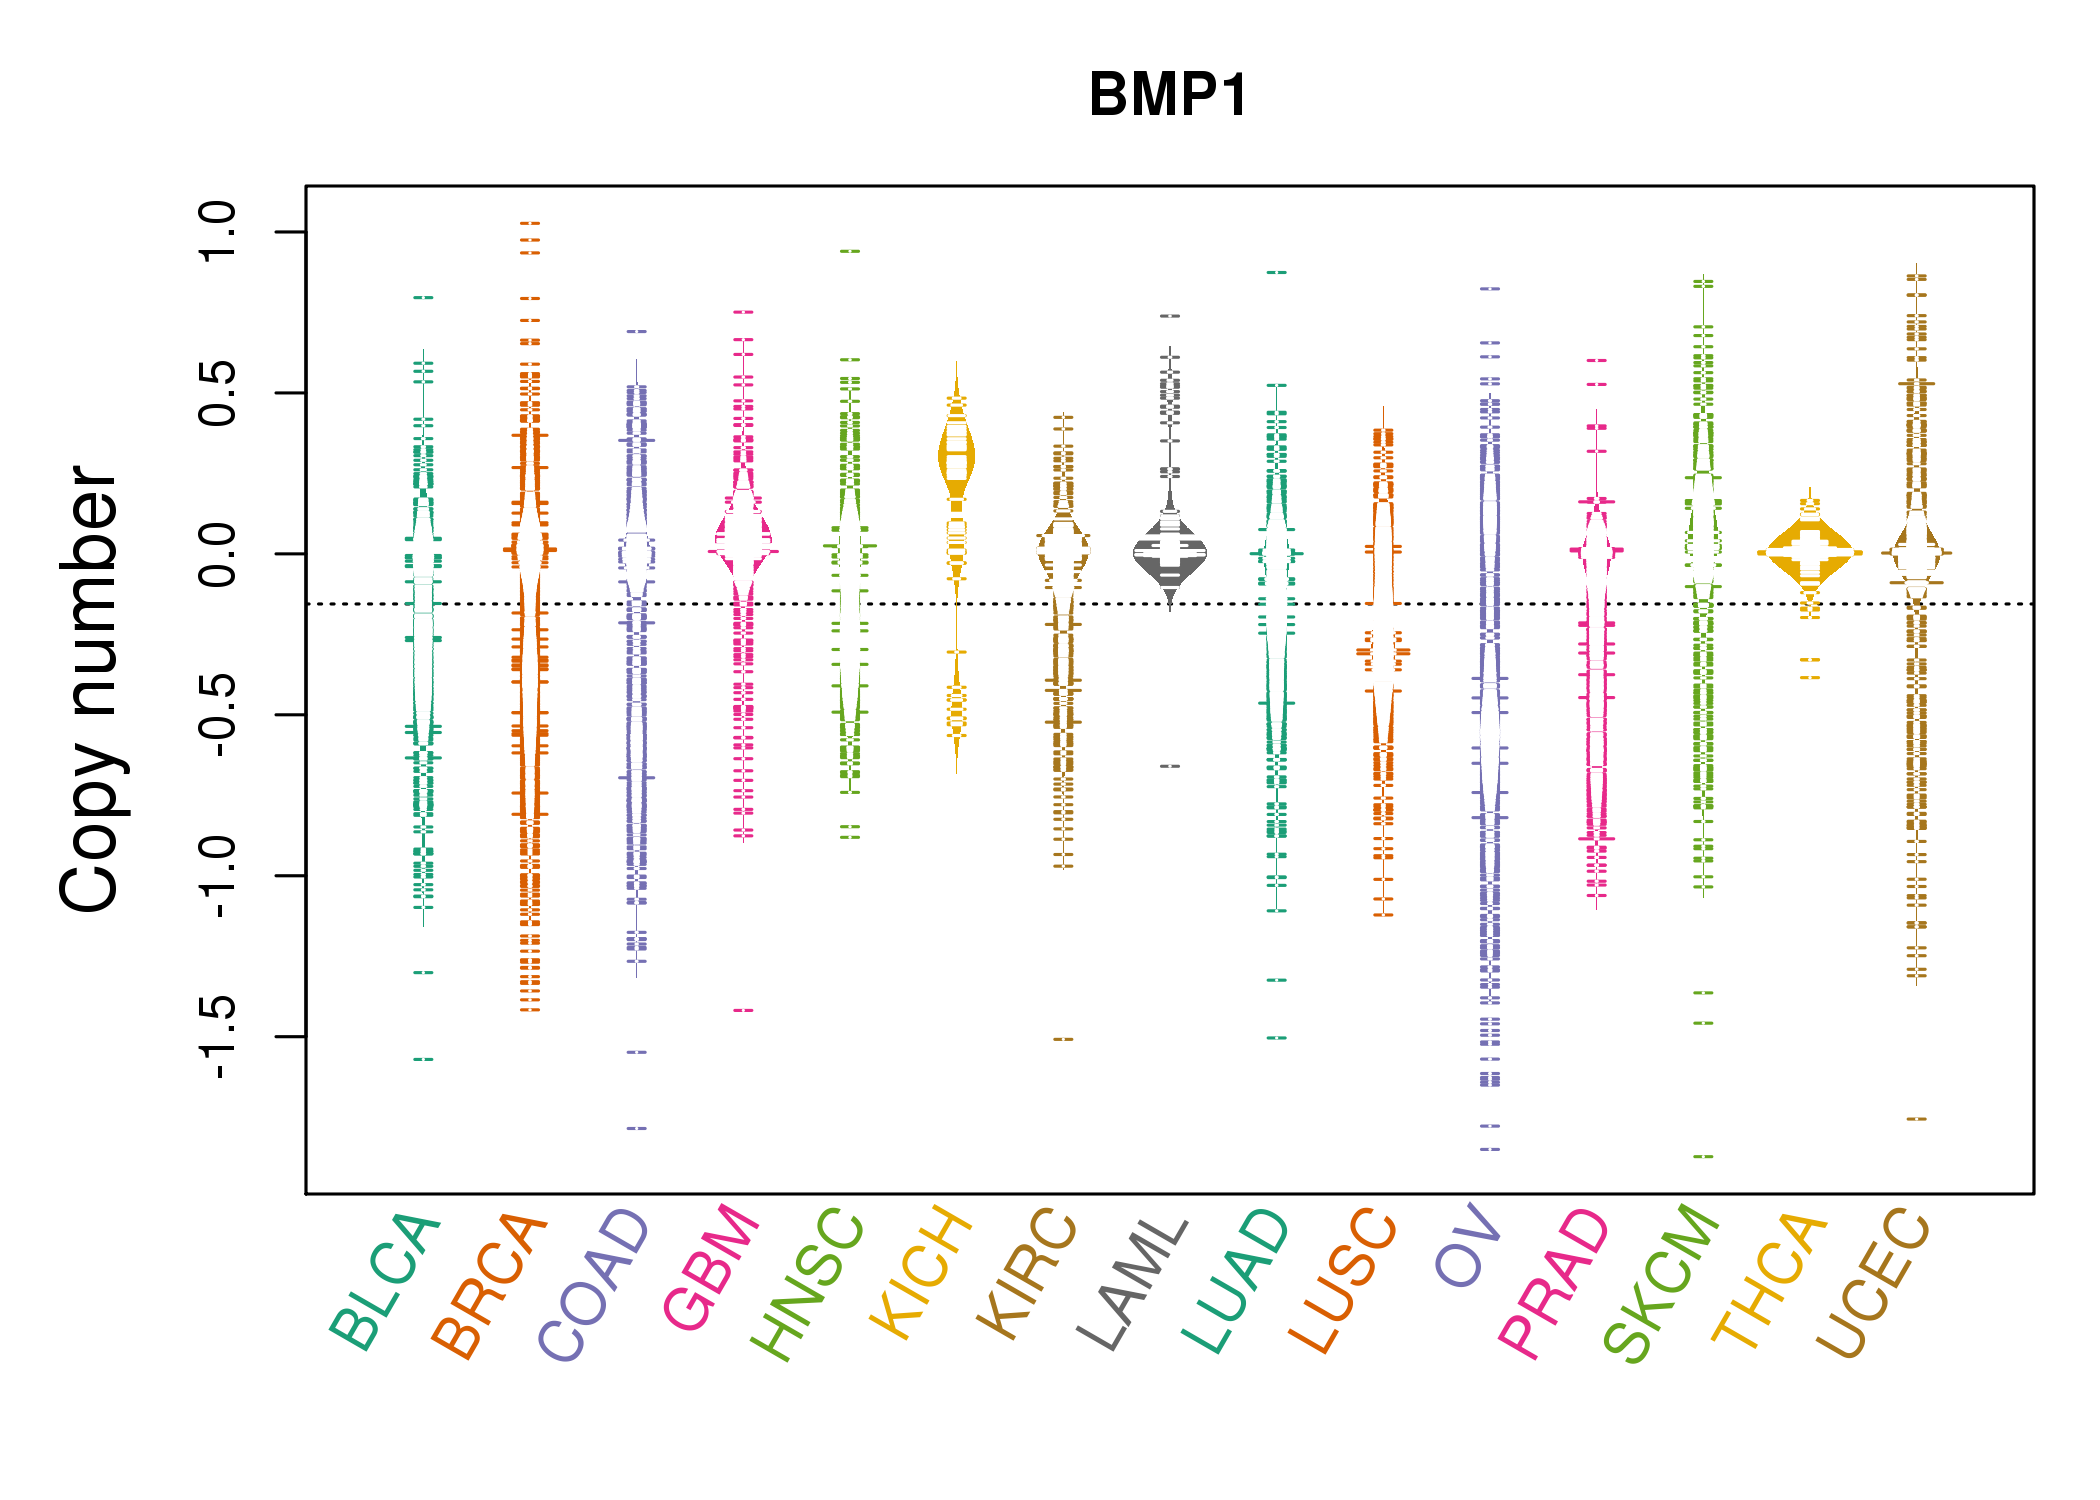 |
| cf) Tissue ID[Tissue type]: BLCA[Bladder Urothelial Carcinoma], BRCA[Breast invasive carcinoma], CESC[Cervical squamous cell carcinoma and endocervical adenocarcinoma], COAD[Colon adenocarcinoma], GBM[Glioblastoma multiforme], Glioma Low Grade, HNSC[Head and Neck squamous cell carcinoma], KICH[Kidney Chromophobe], KIRC[Kidney renal clear cell carcinoma], KIRP[Kidney renal papillary cell carcinoma], LAML[Acute Myeloid Leukemia], LUAD[Lung adenocarcinoma], LUSC[Lung squamous cell carcinoma], OV[Ovarian serous cystadenocarcinoma ], PAAD[Pancreatic adenocarcinoma], PRAD[Prostate adenocarcinoma], SKCM[Skin Cutaneous Melanoma], STAD[Stomach adenocarcinoma], THCA[Thyroid carcinoma], UCEC[Uterine Corpus Endometrial Carcinoma] |
| Top |
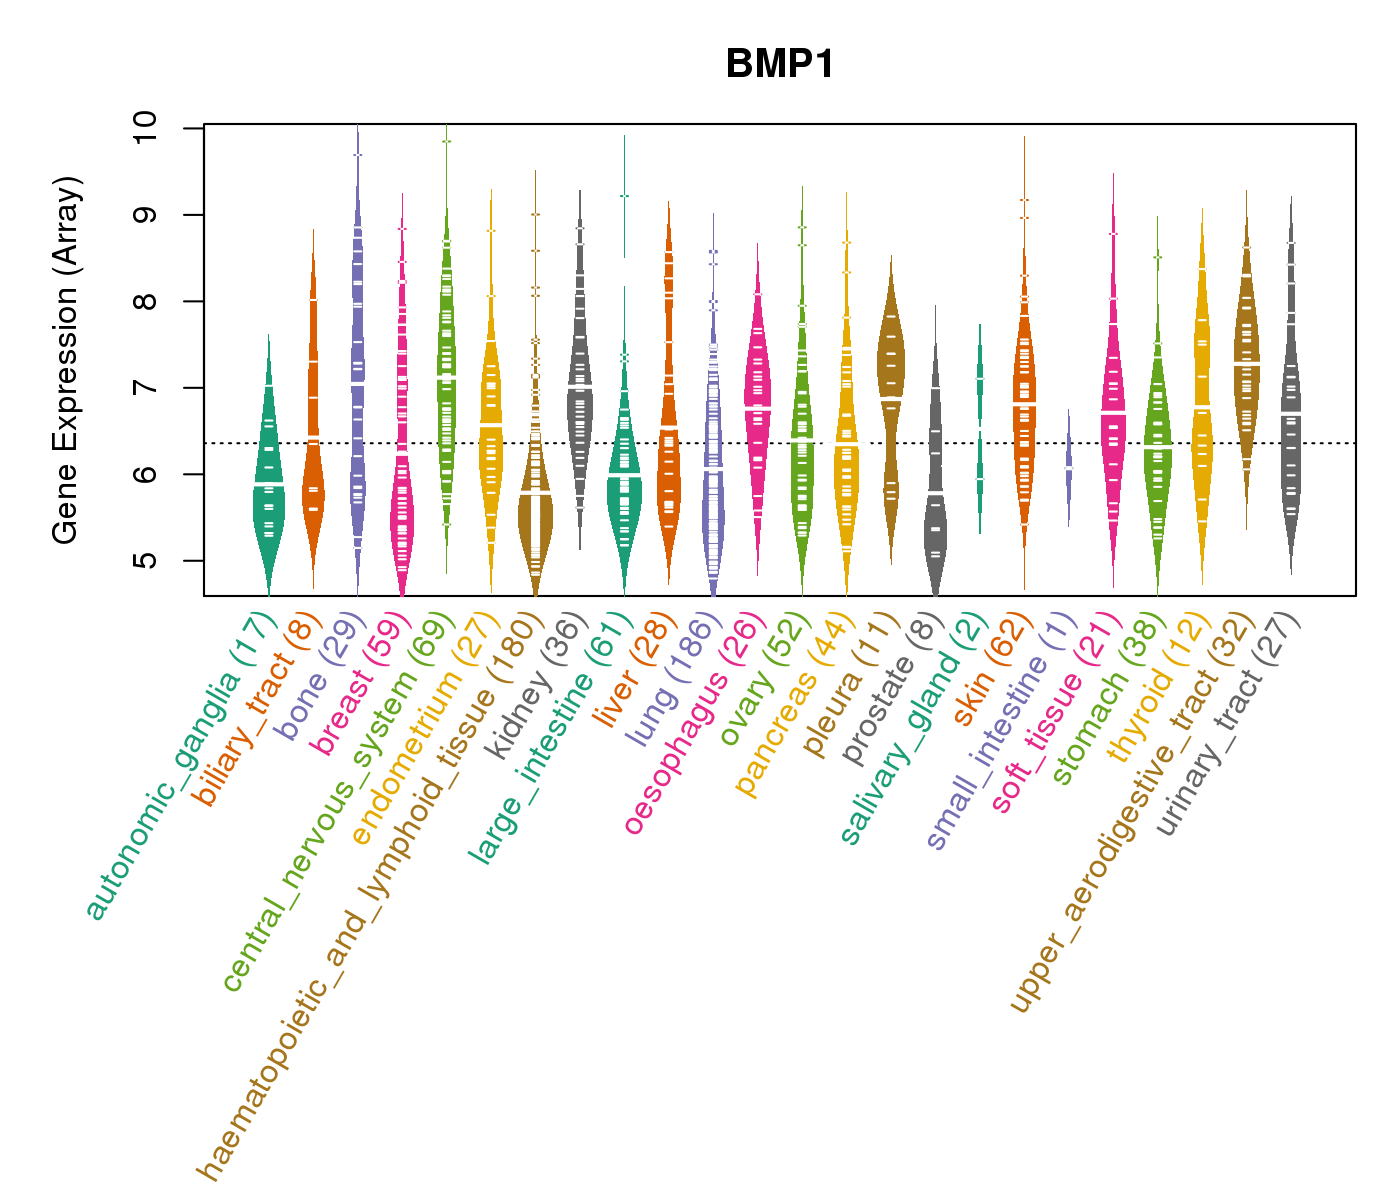
| Gene Expression for BMP1 |
| * CCLE gene expression data were extracted from CCLE_Expression_Entrez_2012-10-18.res: Gene-centric RMA-normalized mRNA expression data. |
 |
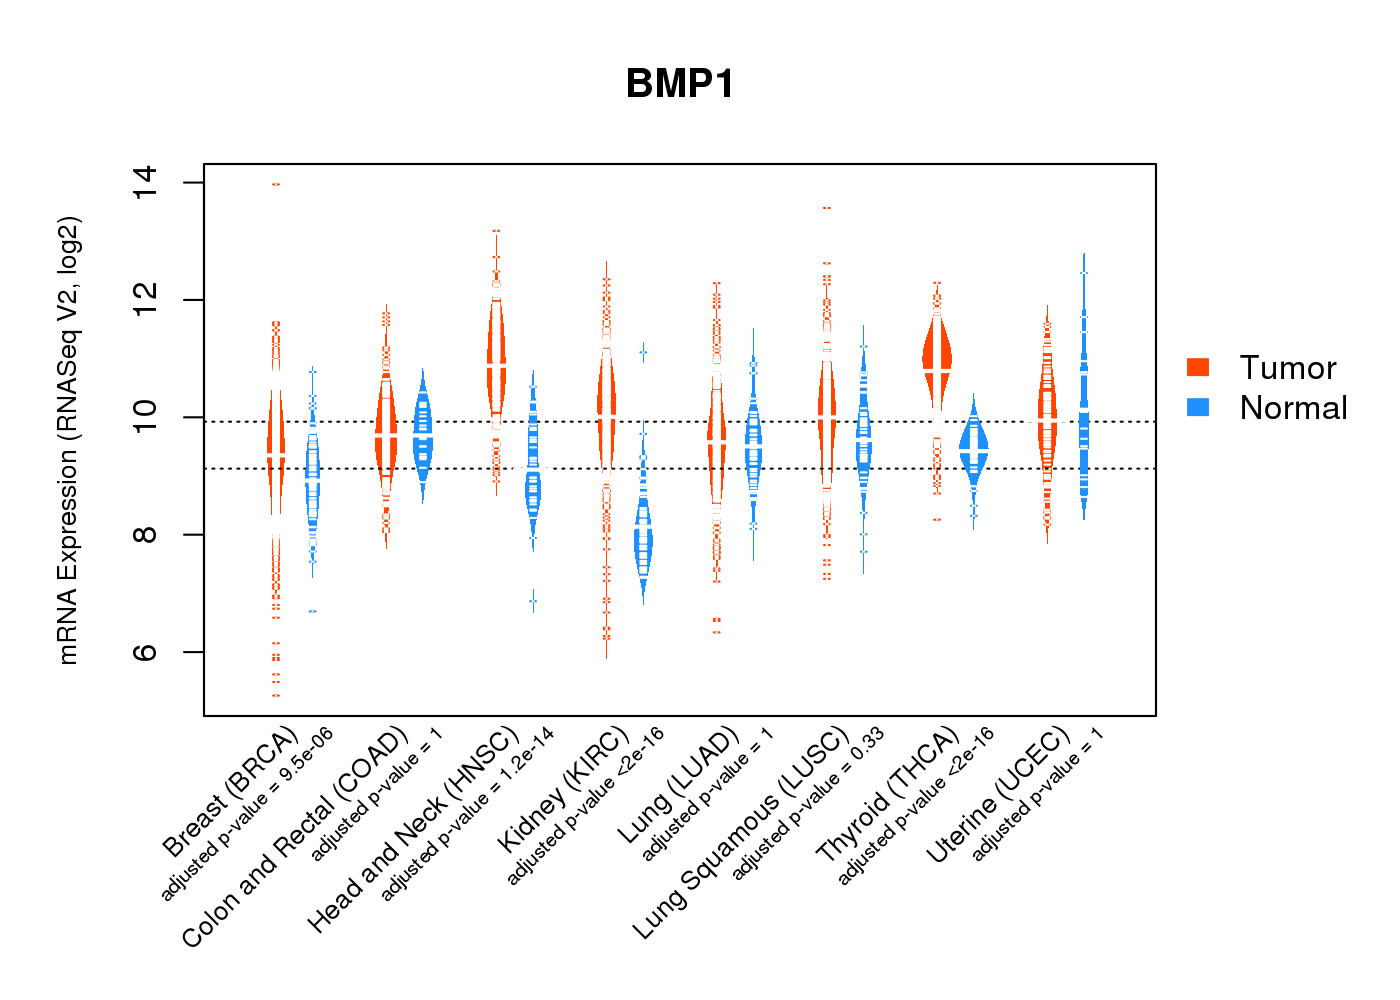
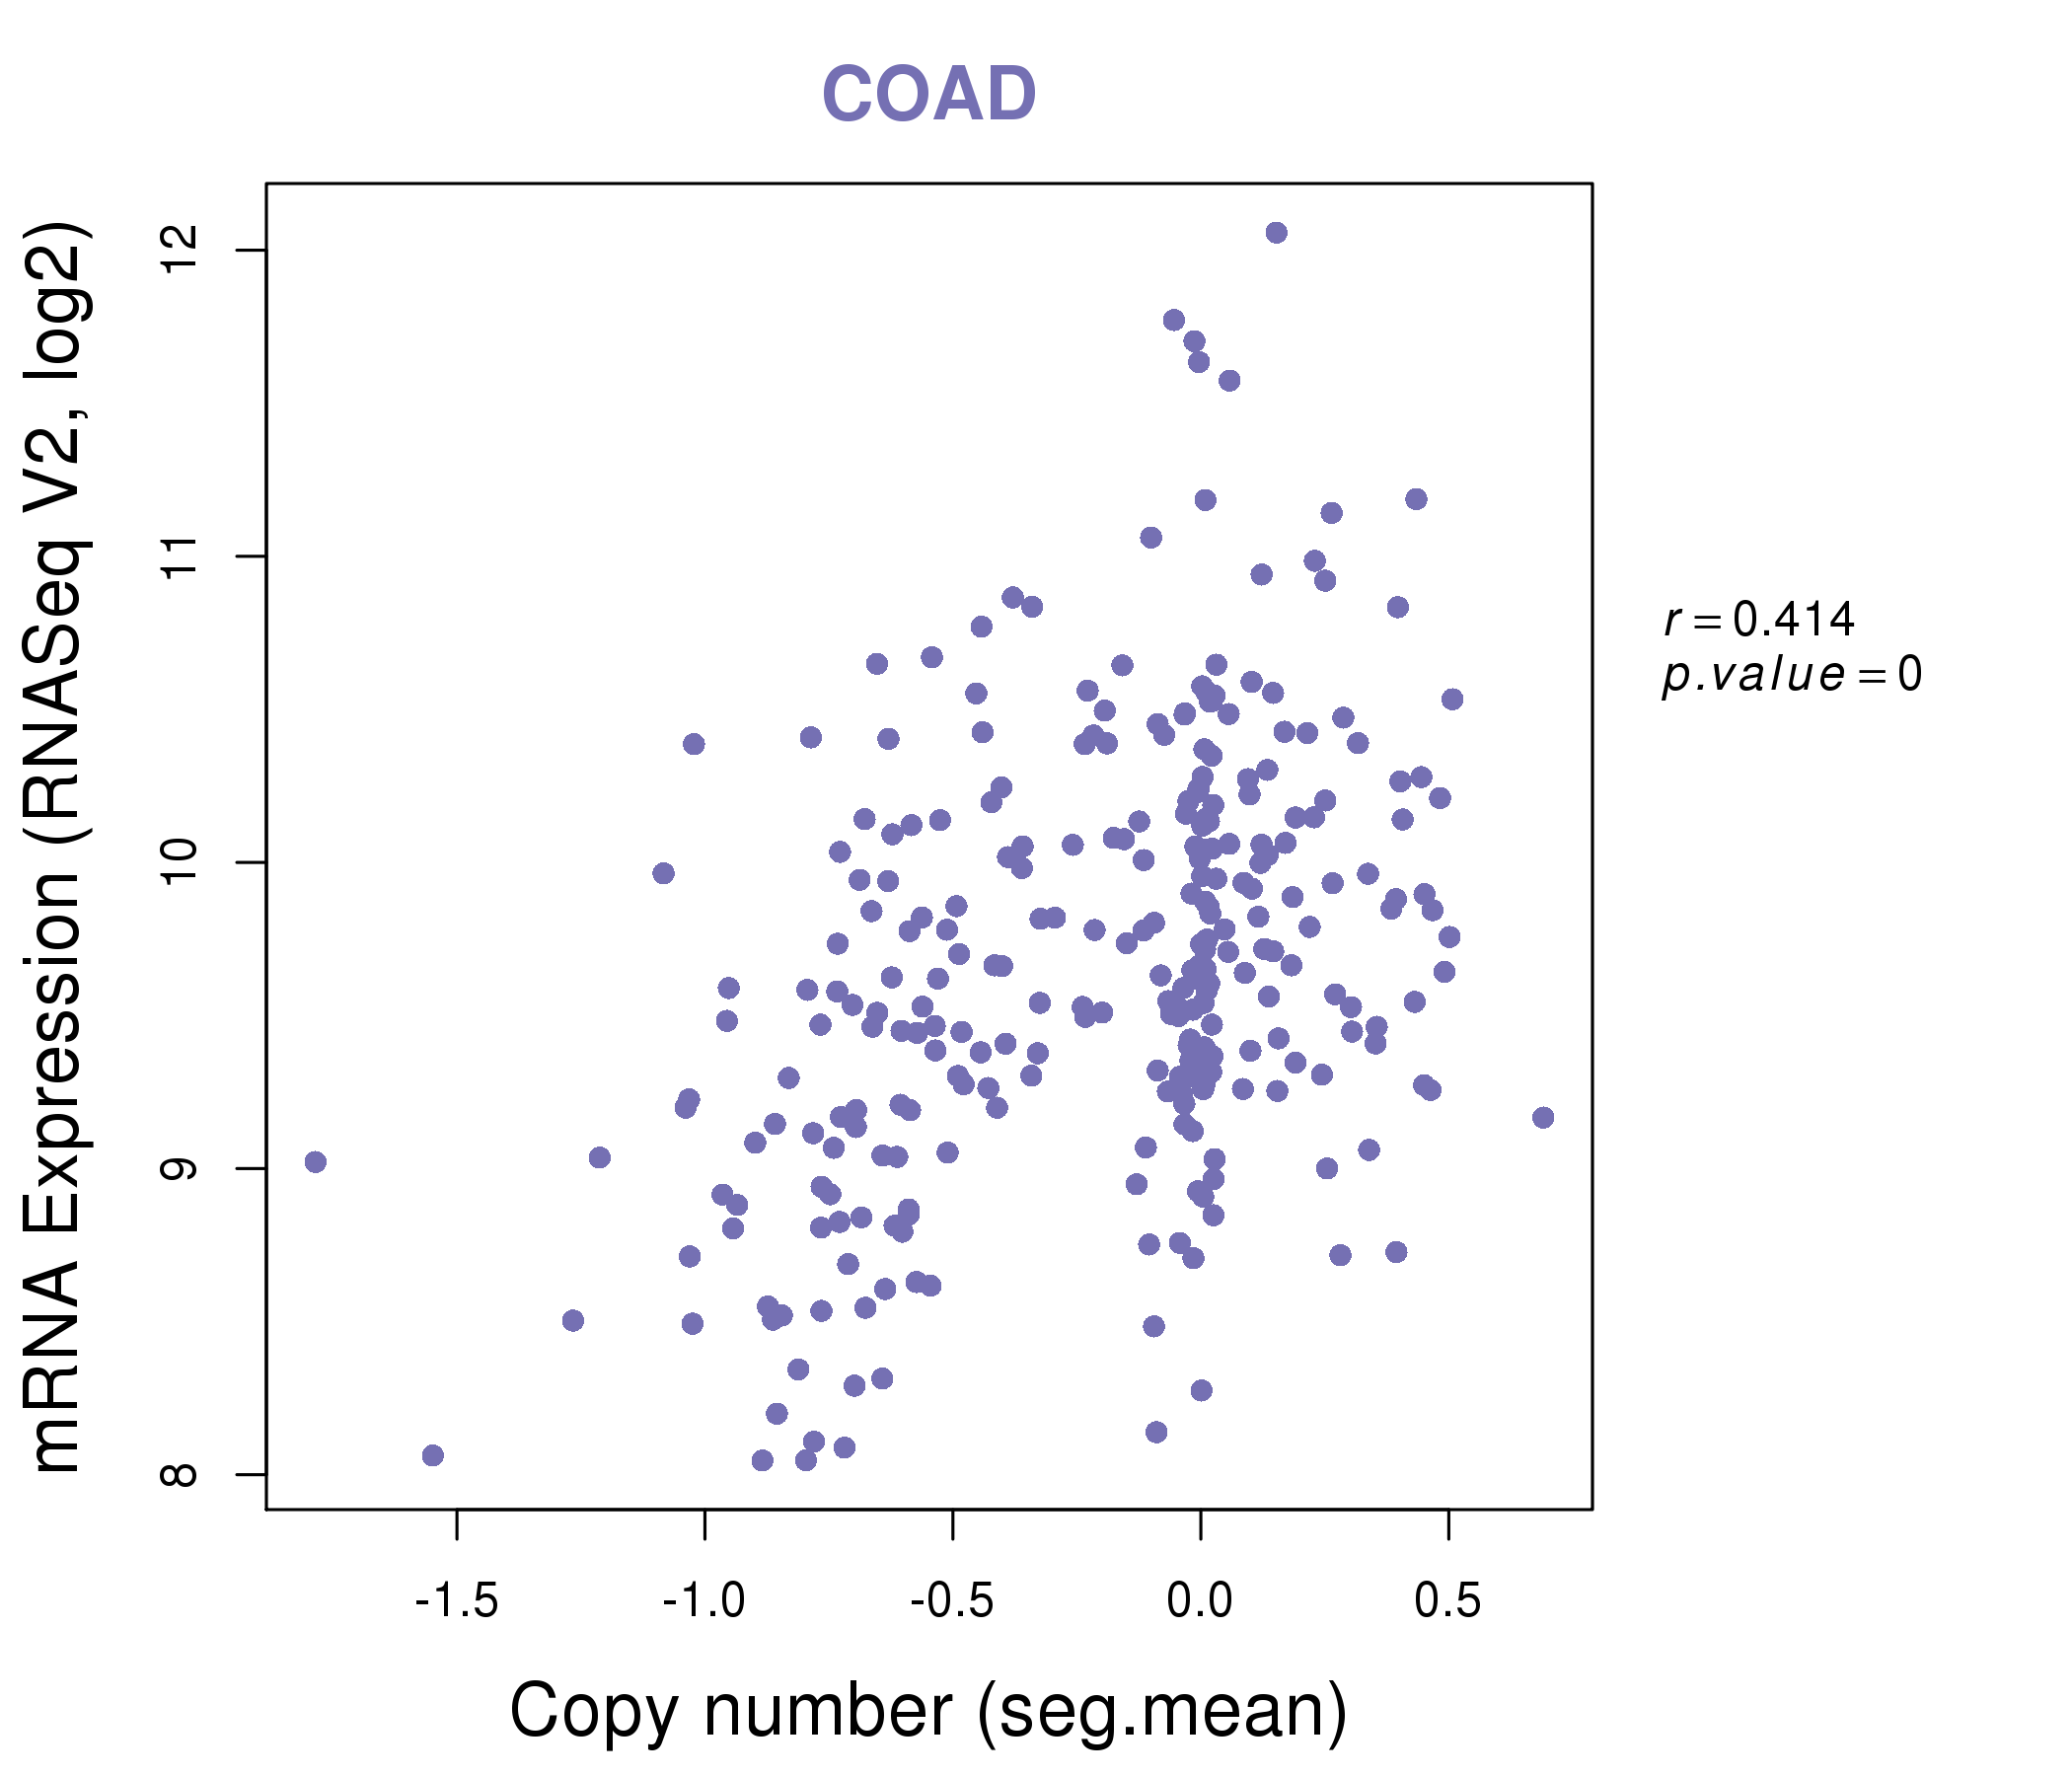
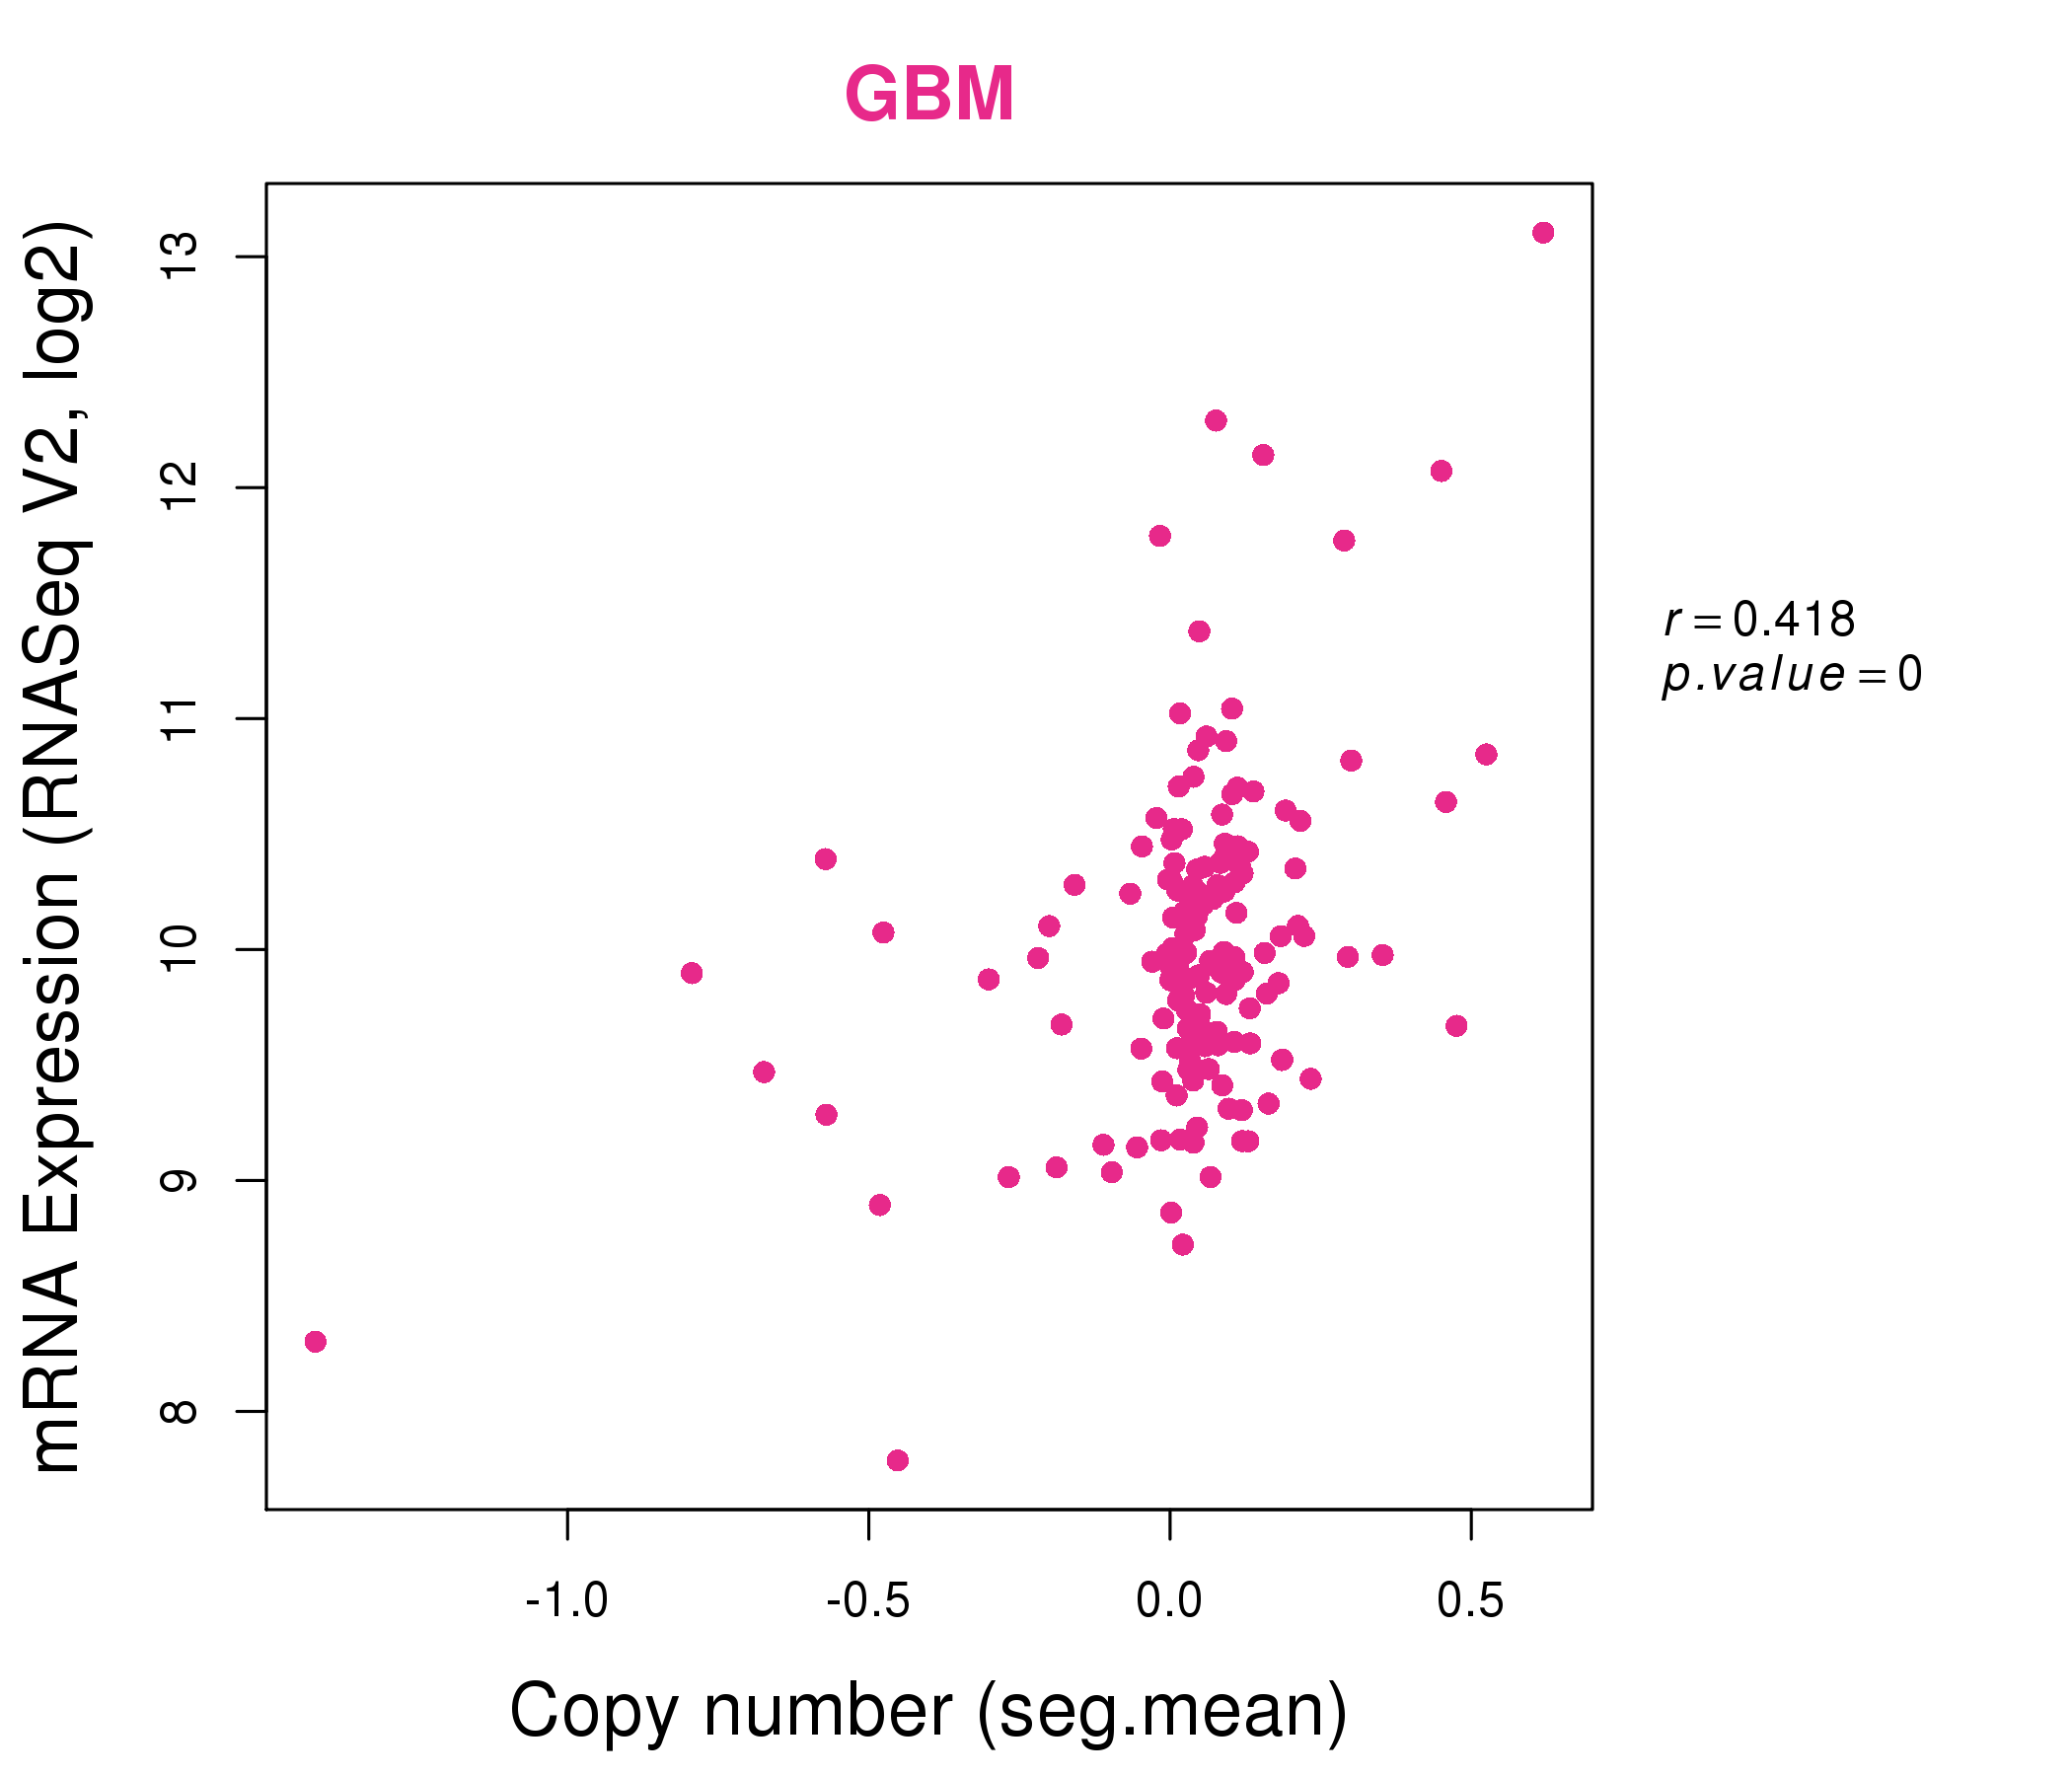
| * Normalized gene expression data of RNASeqV2 was extracted from TCGA using R package TCGA-Assembler. The URLs of all public data files on TCGA DCC data server were gathered at Jan-05-2015. Only eight cancer types have enough normal control samples for differential expression analysis. (t test, adjusted p<0.05 (using Benjamini-Hochberg FDR)) |
 |
| Top |
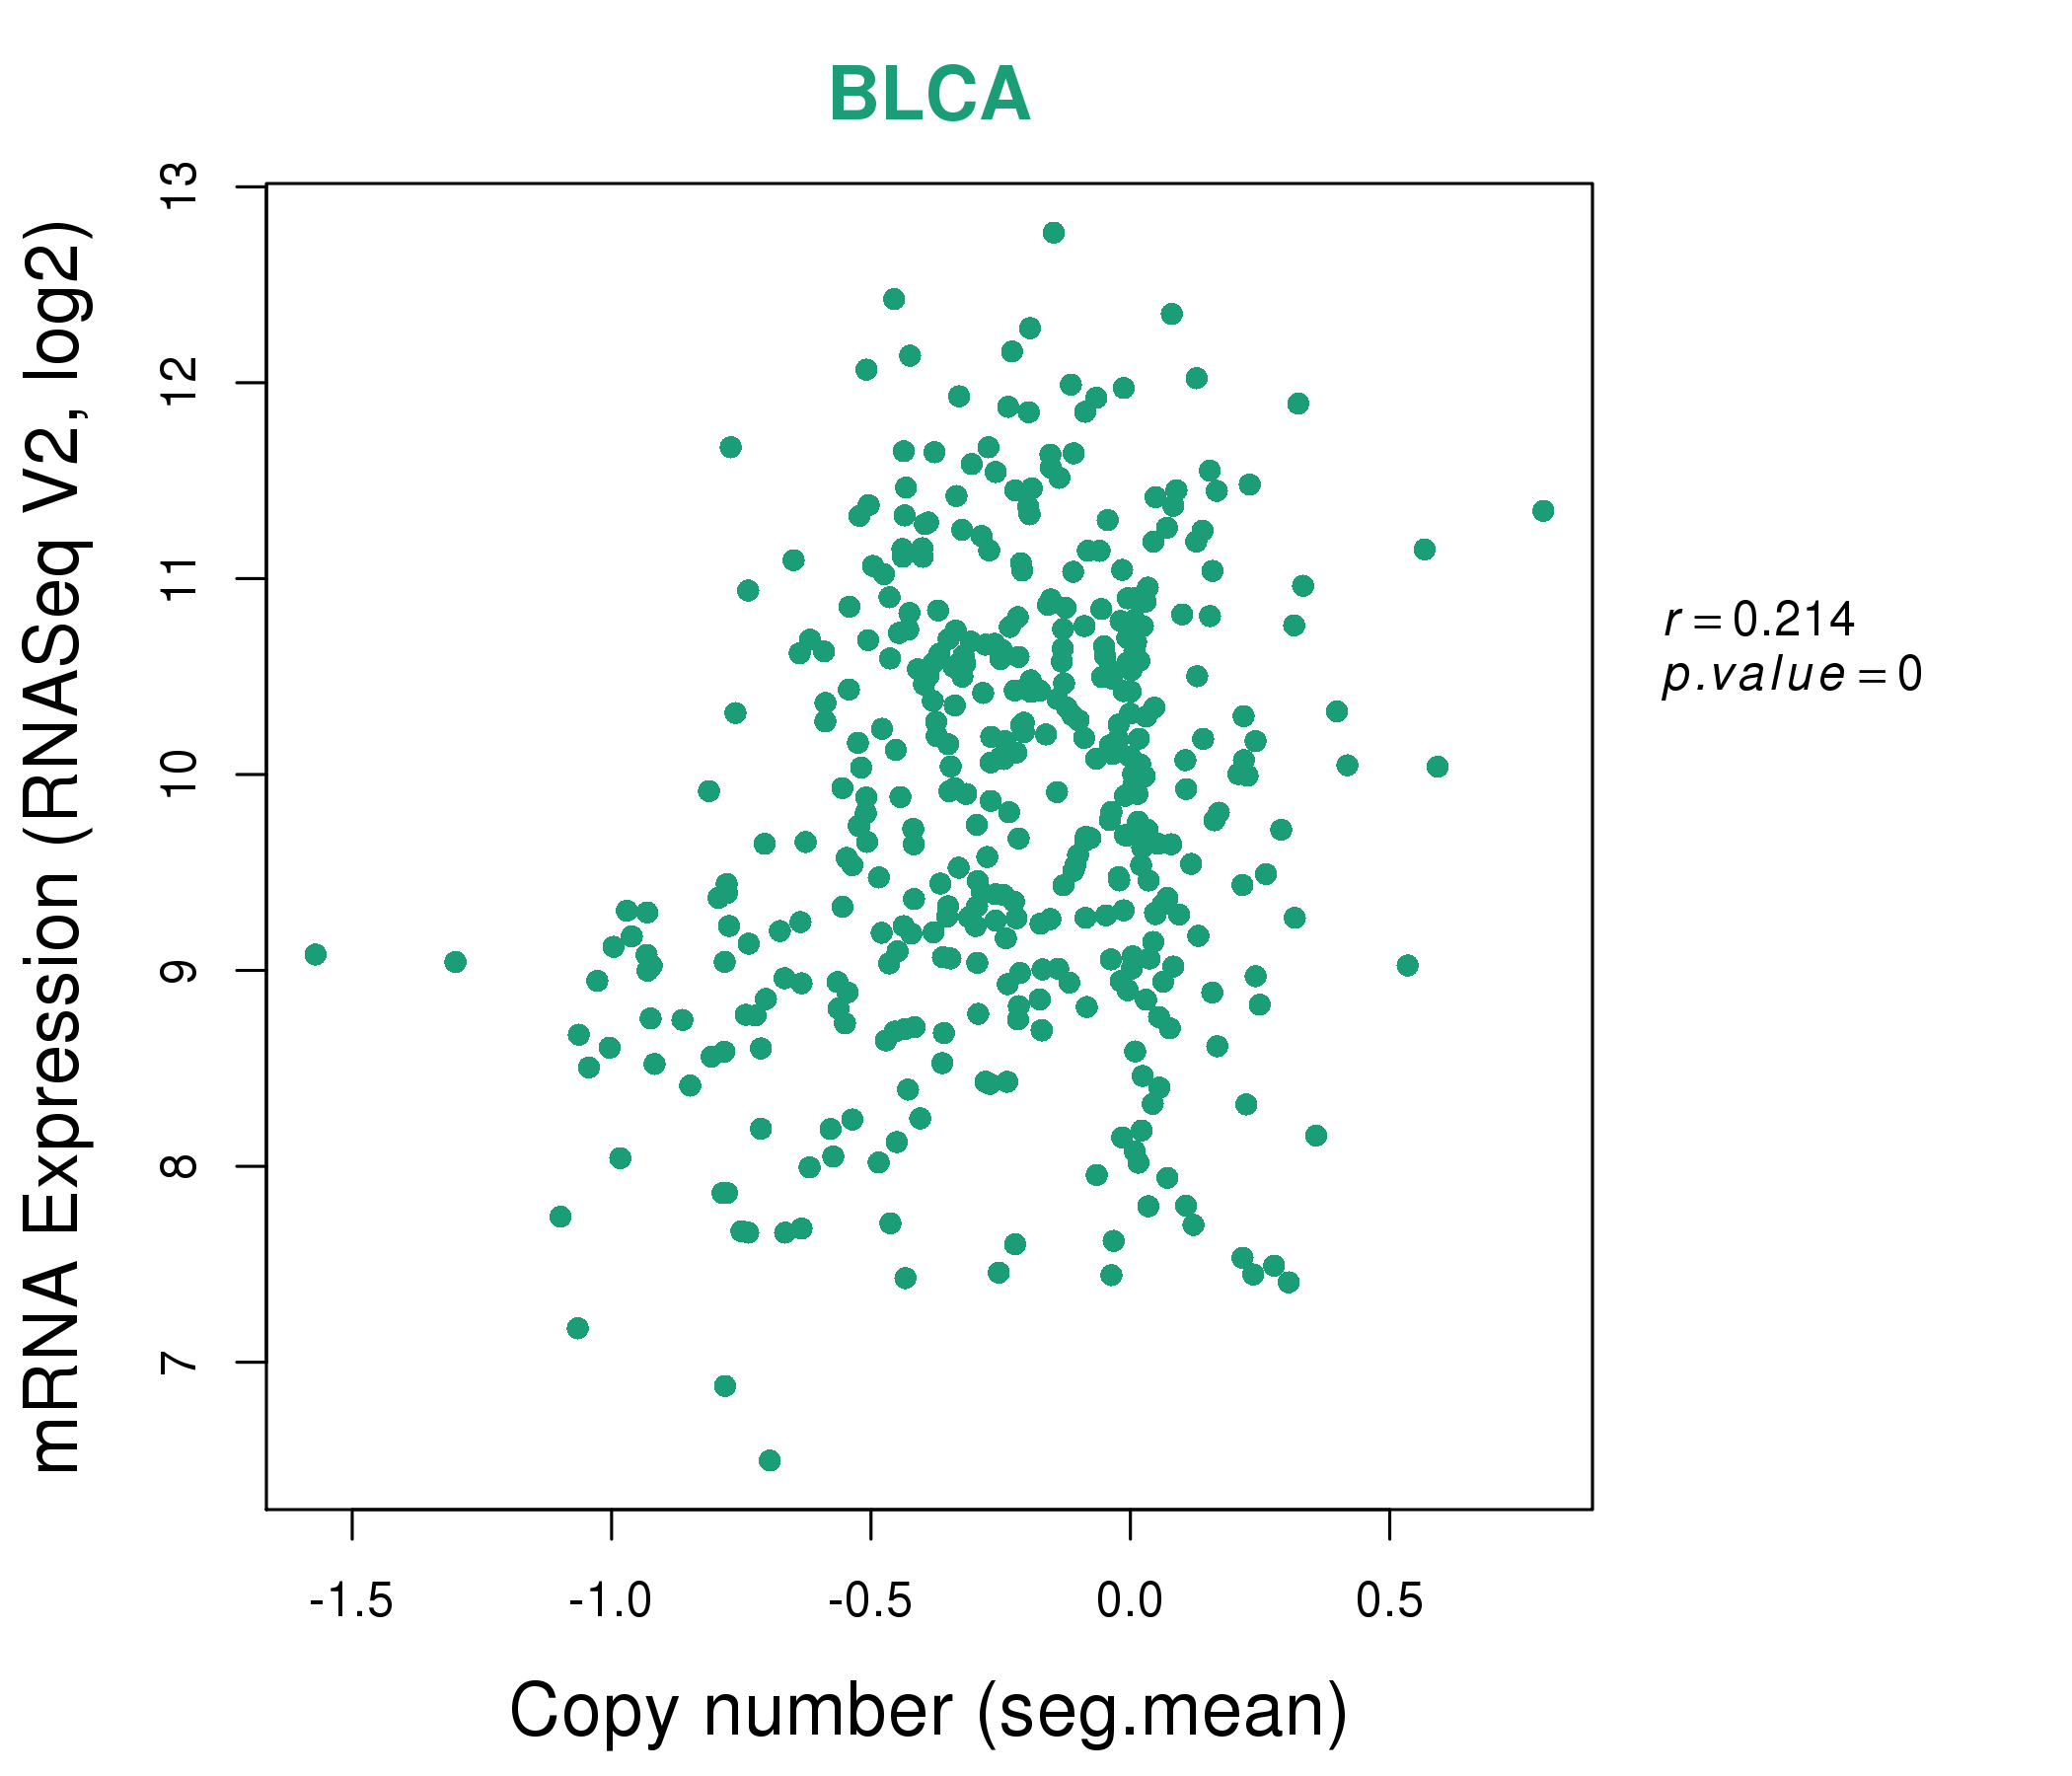
| * This plots show the correlation between CNV and gene expression. |
: Open all plots for all cancer types
 |
|
 |
|

| Top |
| Gene-Gene Network Information |
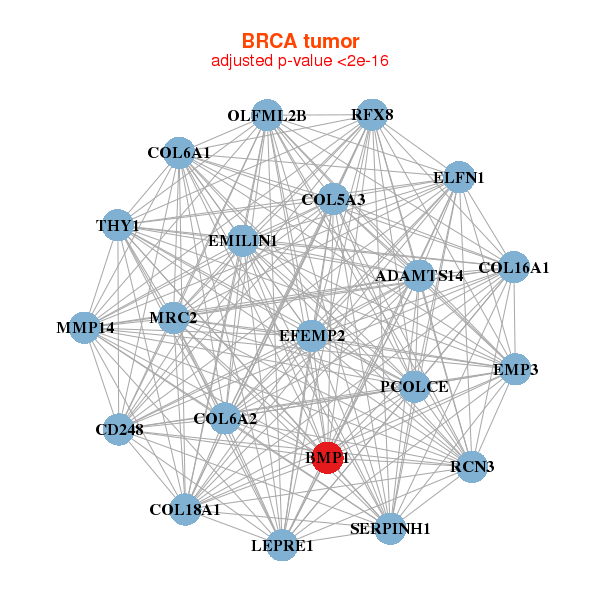
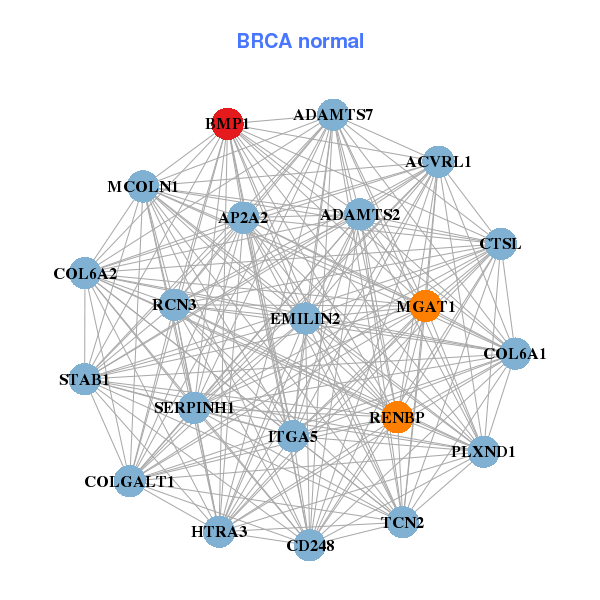
| * Co-Expression network figures were drawn using R package igraph. Only the top 20 genes with the highest correlations were shown. Red circle: input gene, orange circle: cell metabolism gene, sky circle: other gene |
: Open all plots for all cancer types
 |
| ||||
| ADAMTS14,BMP1,CD248,COL16A1,COL18A1,COL5A3,COL6A1, COL6A2,EFEMP2,ELFN1,EMILIN1,EMP3,LEPRE1,MMP14, MRC2,OLFML2B,PCOLCE,RCN3,RFX8,SERPINH1,THY1 | ACVRL1,ADAMTS2,ADAMTS7,AP2A2,BMP1,CD248,COL6A1, COL6A2,CTSL,EMILIN2,COLGALT1,HTRA3,ITGA5,MCOLN1, MGAT1,PLXND1,RCN3,RENBP,SERPINH1,STAB1,TCN2 | ||||
 |
| ||||
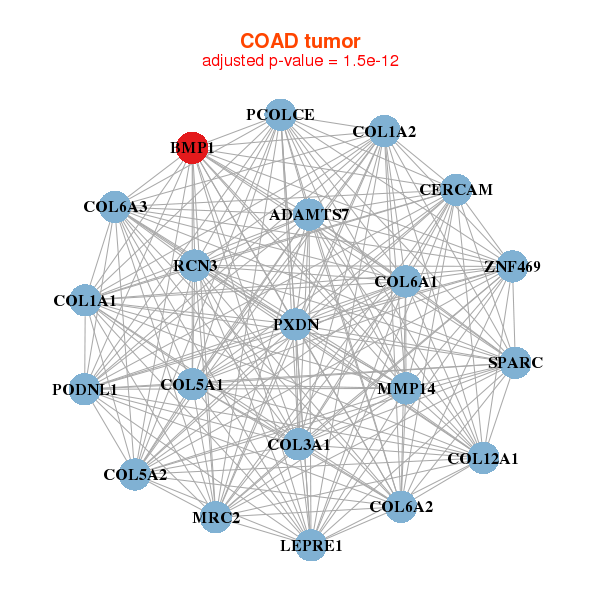
| ADAMTS7,BMP1,CERCAM,COL12A1,COL1A1,COL1A2,COL3A1, COL5A1,COL5A2,COL6A1,COL6A2,COL6A3,LEPRE1,MMP14, MRC2,PCOLCE,PODNL1,PXDN,RCN3,SPARC,ZNF469 | ARHGEF11,BMP1,CLIP2,CLSTN1,CNNM4,DAB2IP,DNM2, GRAMD4,INF2,JUP,MINK1,NR2F6,PLXNB2,RAB40C, RXRA,SIPA1L3,SLC9A1,TJP3,TMEM63B,WWP2,ZBTB7A |
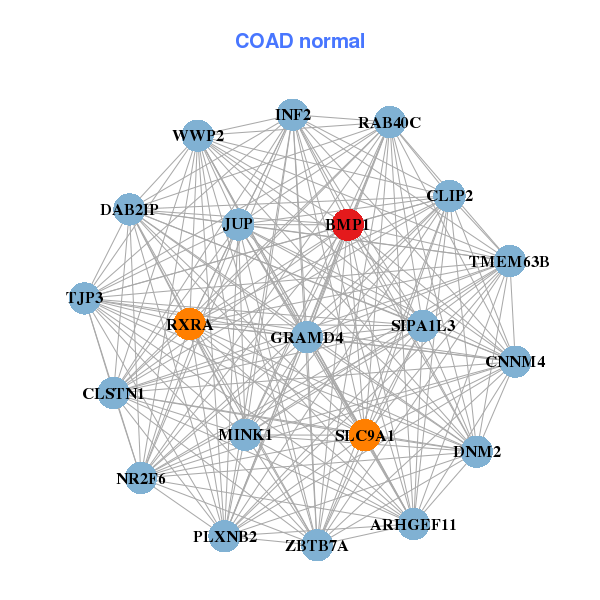
| * Co-Expression network figures were drawn using R package igraph. Only the top 20 genes with the highest correlations were shown. Red circle: input gene, orange circle: cell metabolism gene, sky circle: other gene |
: Open all plots for all cancer types
| Top |
: Open all interacting genes' information including KEGG pathway for all interacting genes from DAVID
| Top |
| Pharmacological Information for BMP1 |
| DB Category | DB Name | DB's ID and Url link |
| Chemistry | BindingDB | P13497; -. |
| Chemistry | ChEMBL | CHEMBL3898; -. |
| Chemistry | BindingDB | P13497; -. |
| Chemistry | ChEMBL | CHEMBL3898; -. |
| Organism-specific databases | PharmGKB | PA25377; -. |
| Organism-specific databases | PharmGKB | PA25377; -. |
| Organism-specific databases | CTD | 649; -. |
| Organism-specific databases | CTD | 649; -. |
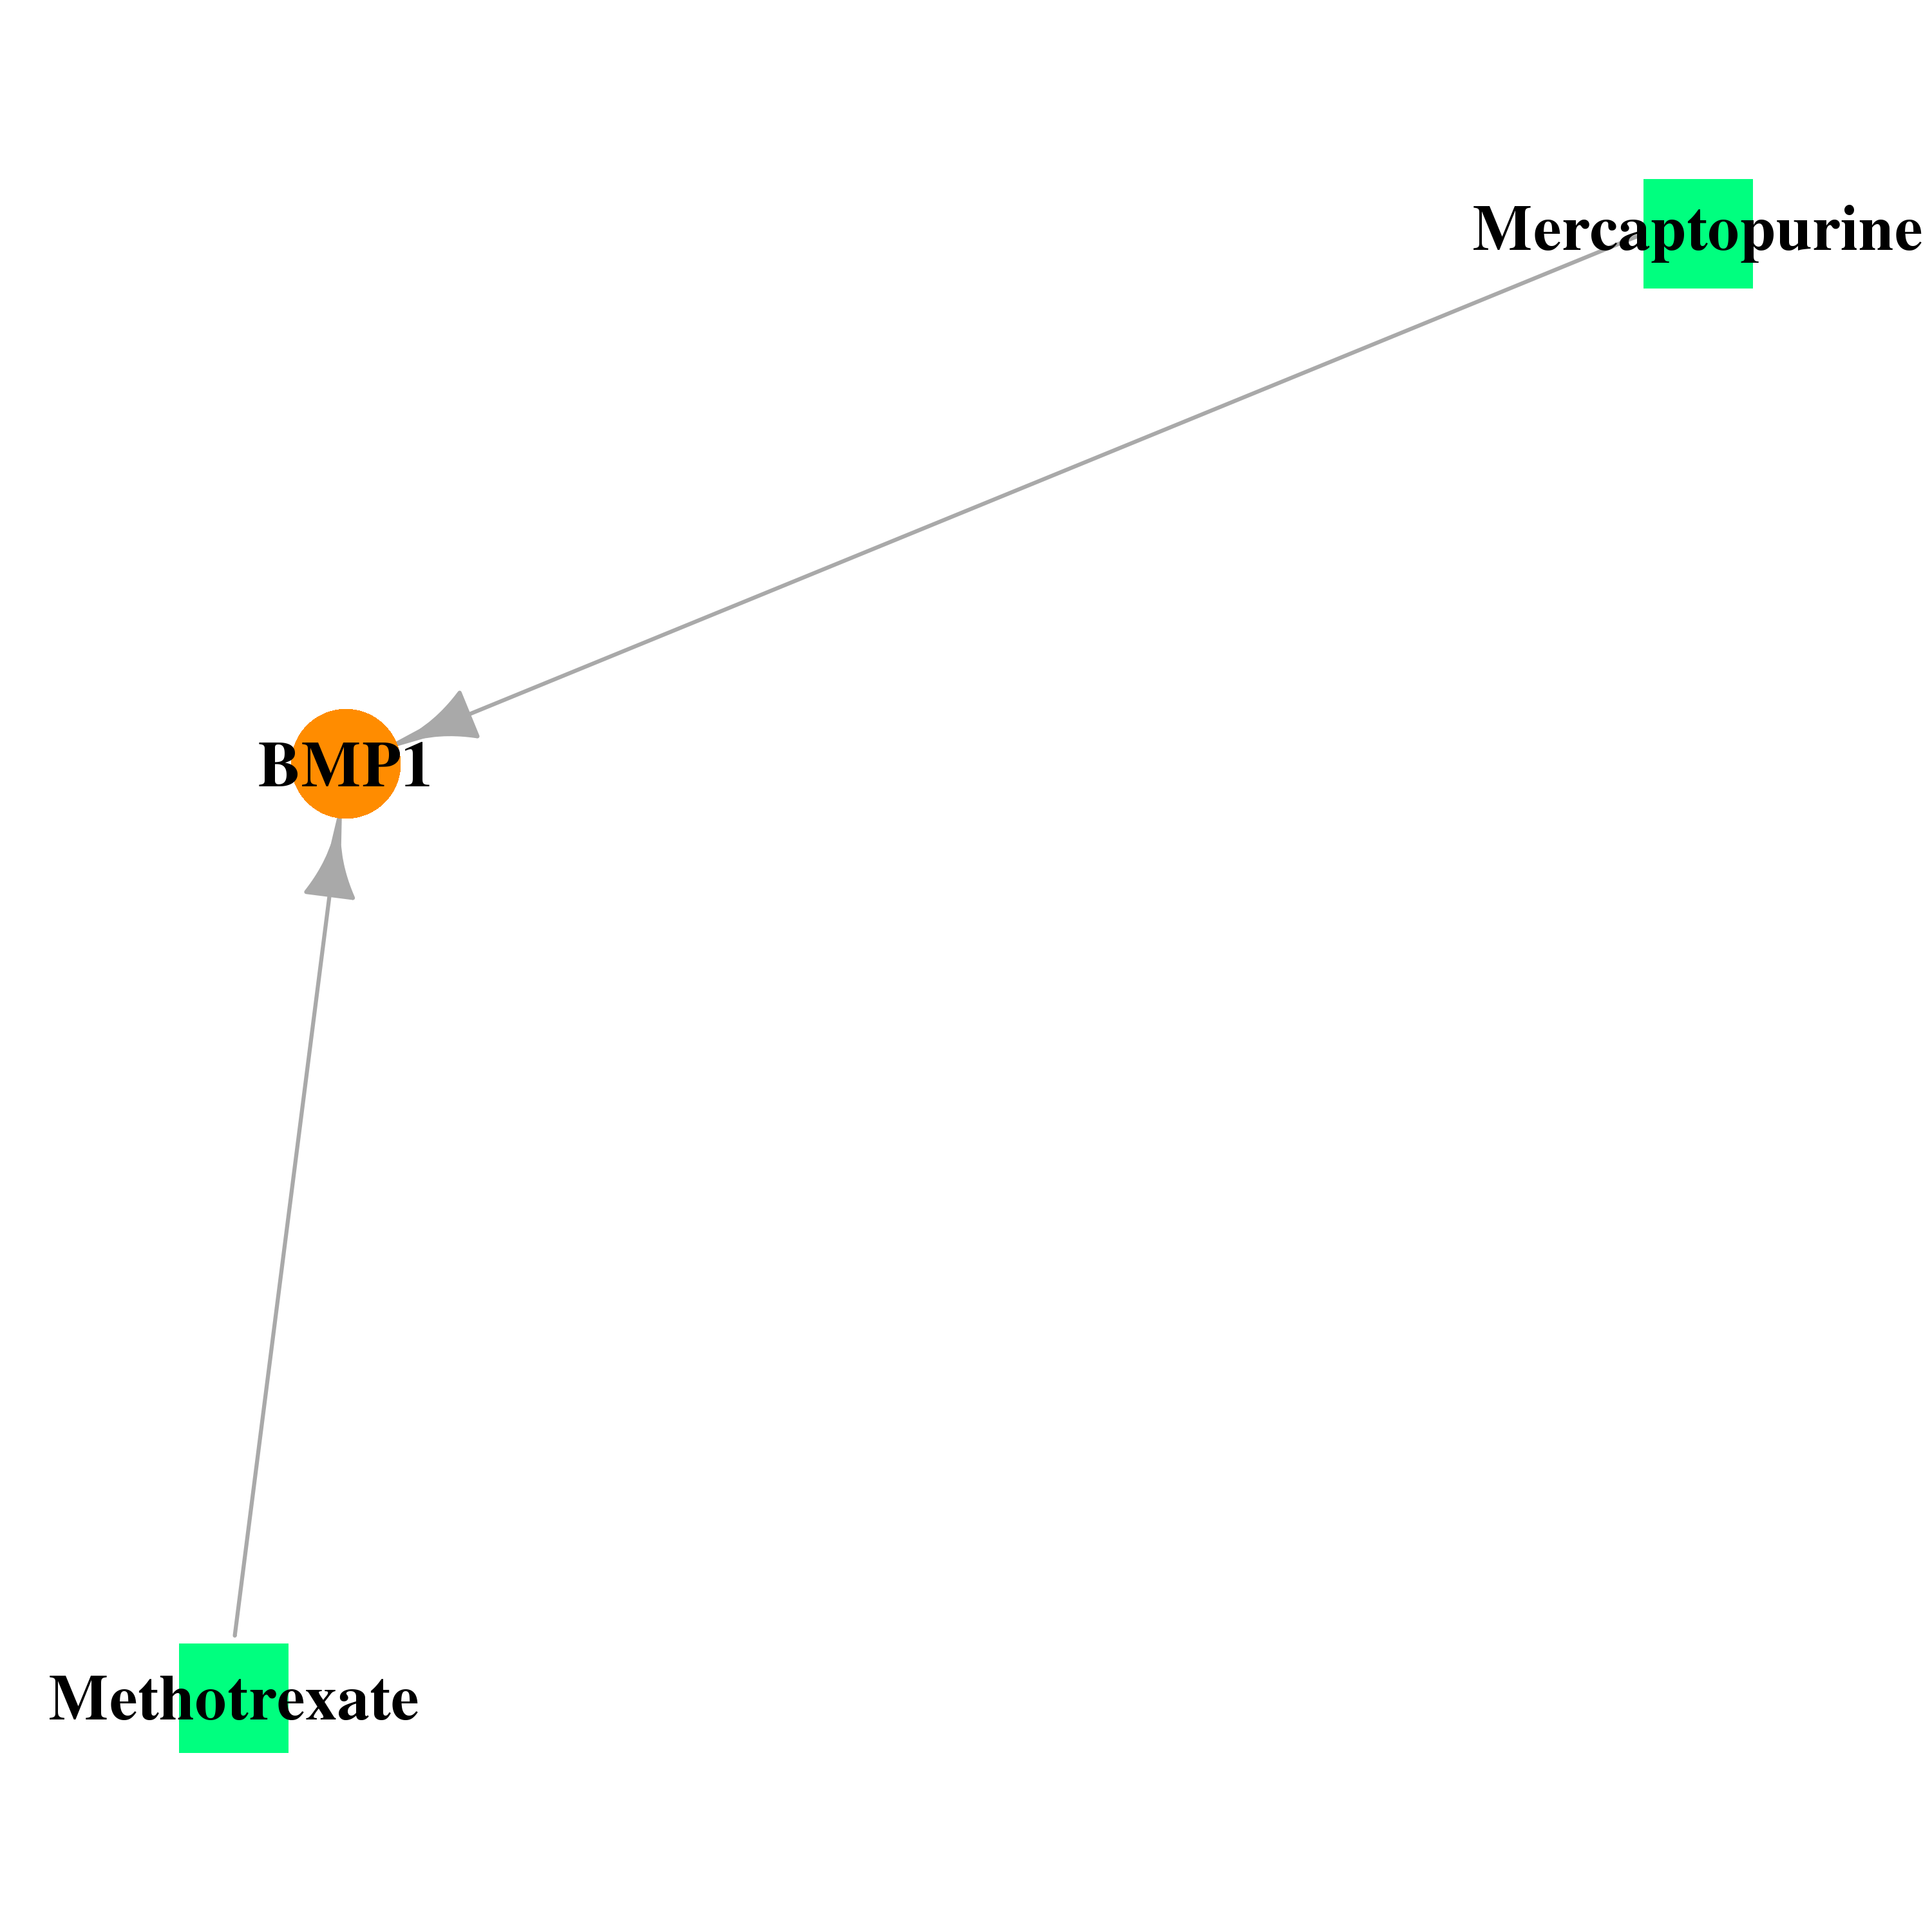
| * Gene Centered Interaction Network. |
 |
| * Drug Centered Interaction Network. |
| DrugBank ID | Target Name | Drug Groups | Generic Name | Drug Centered Network | Drug Structure |
| DB01033 | bone morphogenetic protein 1 | approved | Mercaptopurine | 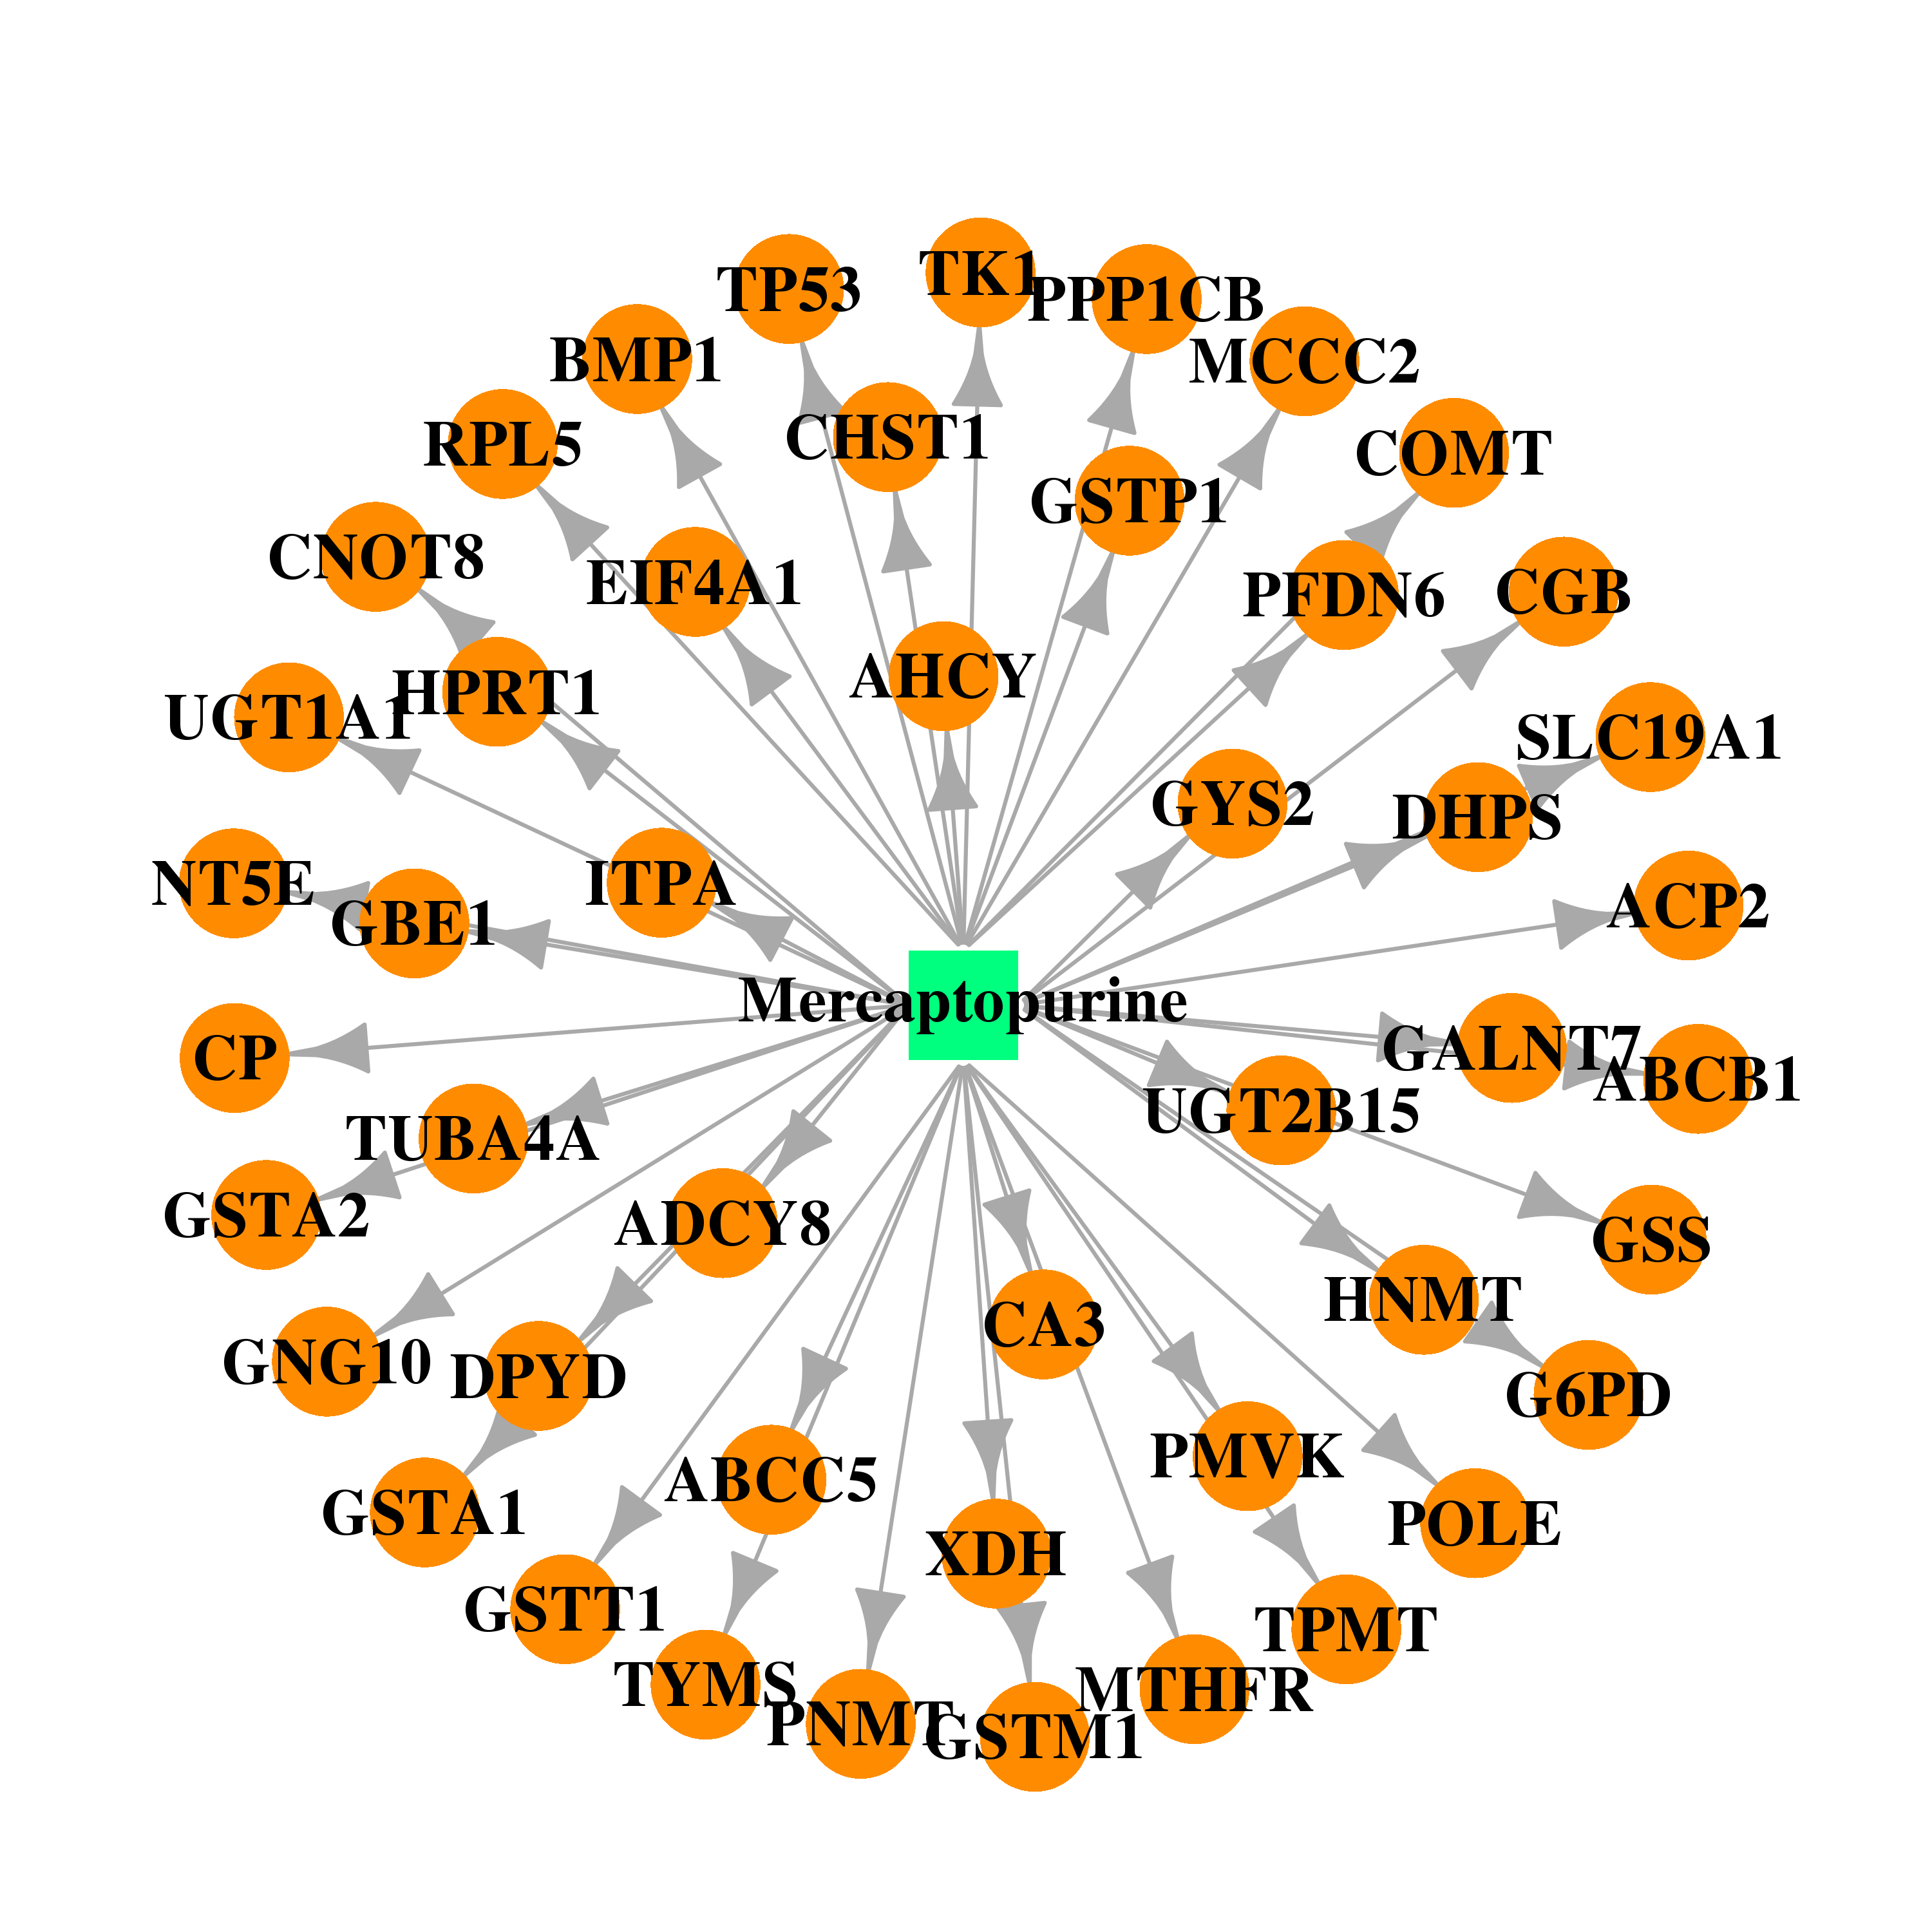 |  |
| DB00563 | bone morphogenetic protein 1 | approved | Methotrexate |  |  |
| Top |
| Cross referenced IDs for BMP1 |
| * We obtained these cross-references from Uniprot database. It covers 150 different DBs, 18 categories. http://www.uniprot.org/help/cross_references_section |
: Open all cross reference information
|
Copyright © 2016-Present - The Univsersity of Texas Health Science Center at Houston @ |