|
||||||||||||||||||||||||||||||||||||||||||||||||||||||||||||||||||||||||||||||||||||||||||||||||||||||||||||||||||||||||||||||||||||||||||||||||||||||||||||||||||||||||||||||||||||||||||||||||||||||||||||||||||||||||||||||||||||||||||||||||||||||||||||||||||||||||||||||||||||||||||||||||||||||||||||||||||||||||||
| |
| Phenotypic Information (metabolism pathway, cancer, disease, phenome) |
| |
| |
| Gene-Gene Network Information: Co-Expression Network, Interacting Genes & KEGG |
| |
|


| Gene Summary for LPIN3 |
| Basic gene info. | Gene symbol | LPIN3 |
| Gene name | lipin 3 | |
| Synonyms | LIPN3L|SMP2 | |
| Cytomap | UCSC genome browser: 20q12 | |
| Genomic location | chr20 :39969559-39989222 | |
| Type of gene | protein-coding | |
| RefGenes | NM_022896.1, NM_001301860.1,NR_126051.1, | |
| Ensembl id | ENSG00000132793 | |
| Description | lipin-3phosphatidate phosphatase LPIN3 | |
| Modification date | 20141210 | |
| dbXrefs | MIM : 605520 | |
| HGNC : HGNC | ||
| Ensembl : ENSG00000132793 | ||
| Vega : OTTHUMG00000033056 | ||
| Protein | UniProt: go to UniProt's Cross Reference DB Table | |
| Expression | CleanEX: HS_LPIN3 | |
| BioGPS: 64900 | ||
| Gene Expression Atlas: ENSG00000132793 | ||
| The Human Protein Atlas: ENSG00000132793 | ||
| Pathway | NCI Pathway Interaction Database: LPIN3 | |
| KEGG: LPIN3 | ||
| REACTOME: LPIN3 | ||
| ConsensusPathDB | ||
| Pathway Commons: LPIN3 | ||
| Metabolism | MetaCyc: LPIN3 | |
| HUMANCyc: LPIN3 | ||
| Regulation | Ensembl's Regulation: ENSG00000132793 | |
| miRBase: chr20 :39,969,559-39,989,222 | ||
| TargetScan: NM_022896 | ||
| cisRED: ENSG00000132793 | ||
| Context | iHOP: LPIN3 | |
| cancer metabolism search in PubMed: LPIN3 | ||
| UCL Cancer Institute: LPIN3 | ||
| Assigned class in ccmGDB | C | |
| Top |
| Phenotypic Information for LPIN3(metabolism pathway, cancer, disease, phenome) |
| Cancer | CGAP: LPIN3 |
| Familial Cancer Database: LPIN3 | |
| * This gene is included in those cancer gene databases. |
|
|
|
|
|
|
| ||||||||||||||||||||||||||||||||||||||||||||||||||||||||||||||||||||||||||||||||||||||||||||||||||||||||||||||||||||||||||||||||||||||||||||||||||||||||||||||||||||||||||||||||||||||||||||||||||||||||||||||||||||||||||||||||||||||||||||||||||||||||||||||||||||||||||||||||||||||||||||||||||||||||||||||||||||
Oncogene 1 | Significant driver gene in | |||||||||||||||||||||||||||||||||||||||||||||||||||||||||||||||||||||||||||||||||||||||||||||||||||||||||||||||||||||||||||||||||||||||||||||||||||||||||||||||||||||||||||||||||||||||||||||||||||||||||||||||||||||||||||||||||||||||||||||||||||||||||||||||||||||||||||||||||||||||||||||||||||||||||||||||||||||||||
| cf) number; DB name 1 Oncogene; http://nar.oxfordjournals.org/content/35/suppl_1/D721.long, 2 Tumor Suppressor gene; https://bioinfo.uth.edu/TSGene/, 3 Cancer Gene Census; http://www.nature.com/nrc/journal/v4/n3/abs/nrc1299.html, 4 CancerGenes; http://nar.oxfordjournals.org/content/35/suppl_1/D721.long, 5 Network of Cancer Gene; http://ncg.kcl.ac.uk/index.php, 1Therapeutic Vulnerabilities in Cancer; http://cbio.mskcc.org/cancergenomics/statius/ |
| REACTOME_PHOSPHOLIPID_METABOLISM REACTOME_METABOLISM_OF_LIPIDS_AND_LIPOPROTEINS | |
| OMIM | |
| Orphanet | |
| Disease | KEGG Disease: LPIN3 |
| MedGen: LPIN3 (Human Medical Genetics with Condition) | |
| ClinVar: LPIN3 | |
| Phenotype | MGI: LPIN3 (International Mouse Phenotyping Consortium) |
| PhenomicDB: LPIN3 | |
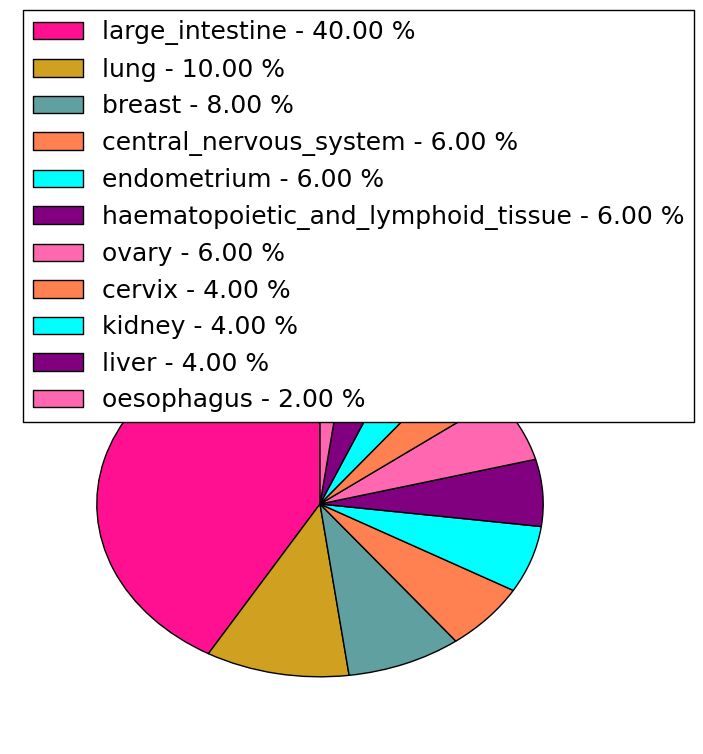
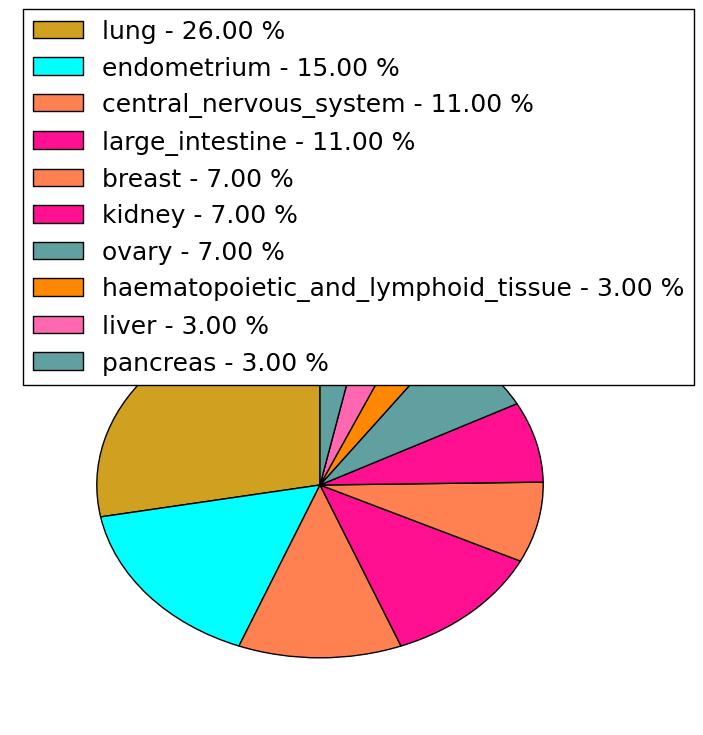
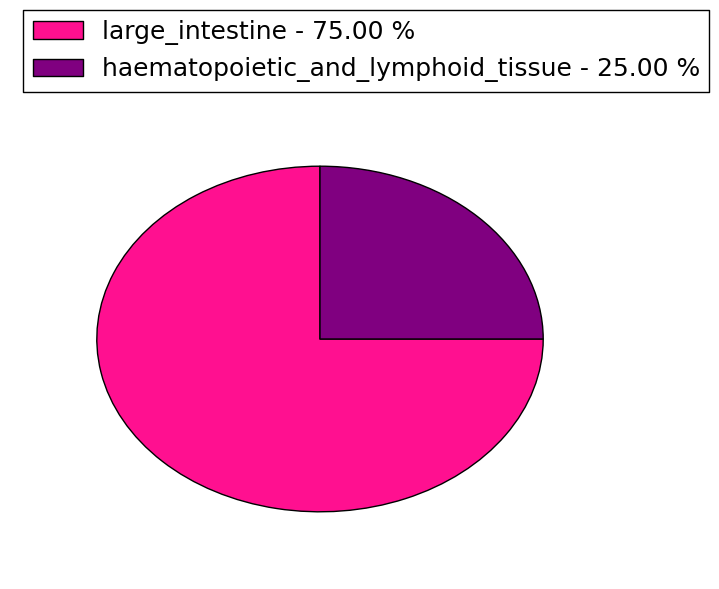
| Mutations for LPIN3 |
| * Under tables are showing count per each tissue to give us broad intuition about tissue specific mutation patterns.You can go to the detailed page for each mutation database's web site. |
| - Statistics for Tissue and Mutation type | Top |
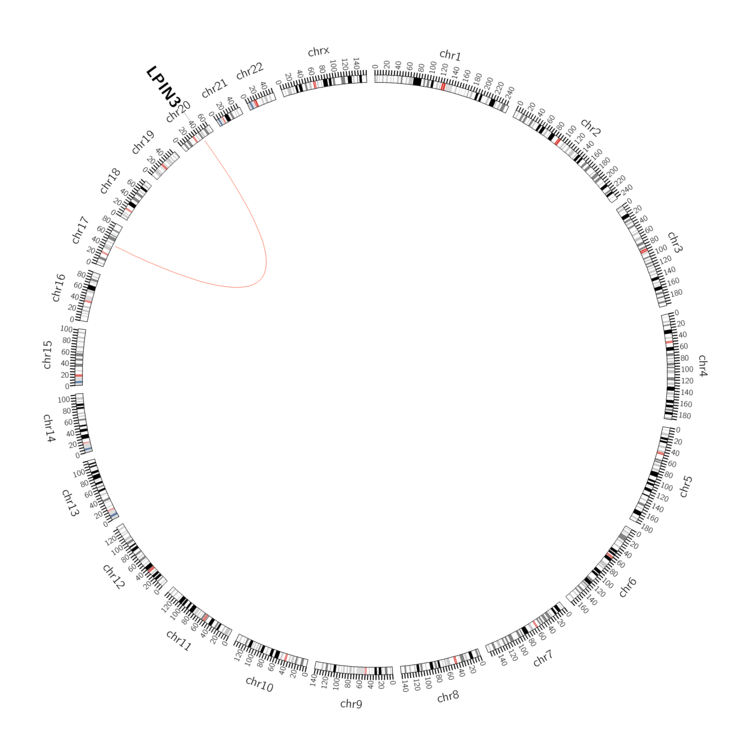 |
| - For Inter-chromosomal Variations |
| * Inter-chromosomal variantions includes 'interchromosomal amplicon to amplicon', 'interchromosomal amplicon to non-amplified dna', 'interchromosomal insertion', 'Interchromosomal unknown type'. |
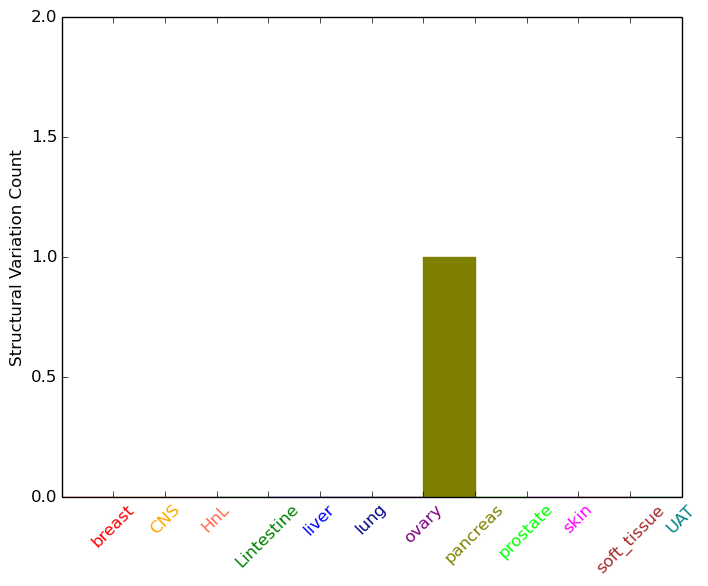 |
| - For Intra-chromosomal Variations |
| There's no intra-chromosomal structural variation. |
| Sample | Symbol_a | Chr_a | Start_a | End_a | Symbol_b | Chr_b | Start_b | End_b |
| cf) Tissue number; Tissue name (1;Breast, 2;Central_nervous_system, 3;Haematopoietic_and_lymphoid_tissue, 4;Large_intestine, 5;Liver, 6;Lung, 7;Ovary, 8;Pancreas, 9;Prostate, 10;Skin, 11;Soft_tissue, 12;Upper_aerodigestive_tract) |
| * From mRNA Sanger sequences, Chitars2.0 arranged chimeric transcripts. This table shows LPIN3 related fusion information. |
| ID | Head Gene | Tail Gene | Accession | Gene_a | qStart_a | qEnd_a | Chromosome_a | tStart_a | tEnd_a | Gene_a | qStart_a | qEnd_a | Chromosome_a | tStart_a | tEnd_a |
| Top |
| Mutation type/ Tissue ID | brca | cns | cerv | endome | haematopo | kidn | Lintest | liver | lung | ns | ovary | pancre | prost | skin | stoma | thyro | urina | |||
| Total # sample | 1 | |||||||||||||||||||
| GAIN (# sample) | 1 | |||||||||||||||||||
| LOSS (# sample) |
| cf) Tissue ID; Tissue type (1; Breast, 2; Central_nervous_system, 3; Cervix, 4; Endometrium, 5; Haematopoietic_and_lymphoid_tissue, 6; Kidney, 7; Large_intestine, 8; Liver, 9; Lung, 10; NS, 11; Ovary, 12; Pancreas, 13; Prostate, 14; Skin, 15; Stomach, 16; Thyroid, 17; Urinary_tract) |
| Top |
|
 |
| Top |
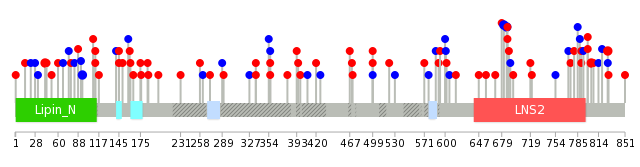
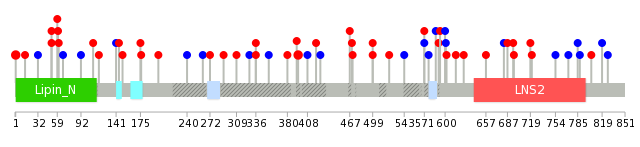
| Stat. for Non-Synonymous SNVs (# total SNVs=47) | (# total SNVs=26) |
 |  |
(# total SNVs=4) | (# total SNVs=0) |
 |
| Top |
| * When you move the cursor on each content, you can see more deailed mutation information on the Tooltip. Those are primary_site,primary_histology,mutation(aa),pubmedID. |
| GRCh37 position | Mutation(aa) | Unique sampleID count |
| chr20:39986528-39986528 | p.G682G | 2 |
| chr20:39986540-39986540 | p.L686L | 2 |
| chr20:39986541-39986541 | p.Y687D | 2 |
| chr20:39987430-39987430 | p.L827Q | 2 |
| chr20:39976281-39976281 | p.S94S | 2 |
| chr20:39974568-39974568 | p.S42L | 2 |
| chr20:39987182-39987182 | p.T804M | 2 |
| chr20:39980456-39980461 | p.? | 1 |
| chr20:39977320-39977320 | p.P117L | 1 |
| chr20:39981294-39981294 | p.P471L | 1 |
| Top |
|
 |
| Point Mutation/ Tissue ID | 1 | 2 | 3 | 4 | 5 | 6 | 7 | 8 | 9 | 10 | 11 | 12 | 13 | 14 | 15 | 16 | 17 | 18 | 19 | 20 |
| # sample | 1 | 3 | 2 | 12 | 2 | 1 | 1 | 3 | 4 | 1 | 4 | 10 | 10 | 1 | 5 | |||||
| # mutation | 1 | 3 | 2 | 10 | 2 | 1 | 1 | 3 | 4 | 1 | 4 | 13 | 14 | 1 | 5 | |||||
| nonsynonymous SNV | 2 | 2 | 10 | 1 | 1 | 1 | 2 | 3 | 9 | 9 | 2 | |||||||||
| synonymous SNV | 1 | 1 | 1 | 1 | 2 | 2 | 1 | 1 | 4 | 5 | 1 | 3 |
| cf) Tissue ID; Tissue type (1; BLCA[Bladder Urothelial Carcinoma], 2; BRCA[Breast invasive carcinoma], 3; CESC[Cervical squamous cell carcinoma and endocervical adenocarcinoma], 4; COAD[Colon adenocarcinoma], 5; GBM[Glioblastoma multiforme], 6; Glioma Low Grade, 7; HNSC[Head and Neck squamous cell carcinoma], 8; KICH[Kidney Chromophobe], 9; KIRC[Kidney renal clear cell carcinoma], 10; KIRP[Kidney renal papillary cell carcinoma], 11; LAML[Acute Myeloid Leukemia], 12; LUAD[Lung adenocarcinoma], 13; LUSC[Lung squamous cell carcinoma], 14; OV[Ovarian serous cystadenocarcinoma ], 15; PAAD[Pancreatic adenocarcinoma], 16; PRAD[Prostate adenocarcinoma], 17; SKCM[Skin Cutaneous Melanoma], 18:STAD[Stomach adenocarcinoma], 19:THCA[Thyroid carcinoma], 20:UCEC[Uterine Corpus Endometrial Carcinoma]) |
| Top |
| * We represented just top 10 SNVs. When you move the cursor on each content, you can see more deailed mutation information on the Tooltip. Those are primary_site, primary_histology, mutation(aa), pubmedID. |
| Genomic Position | Mutation(aa) | Unique sampleID count |
| chr20:39974446 | p.M1I | 2 |
| chr20:39974594 | p.R51C | 2 |
| chr20:39980542 | p.A395V | 2 |
| chr20:39986541 | p.H426H | 1 |
| chr20:39978806 | p.R602L | 1 |
| chr20:39987429 | p.L827L | 1 |
| chr20:39980775 | p.L176M | 1 |
| chr20:39984632 | p.L467I | 1 |
| chr20:39977320 | p.F615L | 1 |
| chr20:39986566 | p.I200V | 1 |
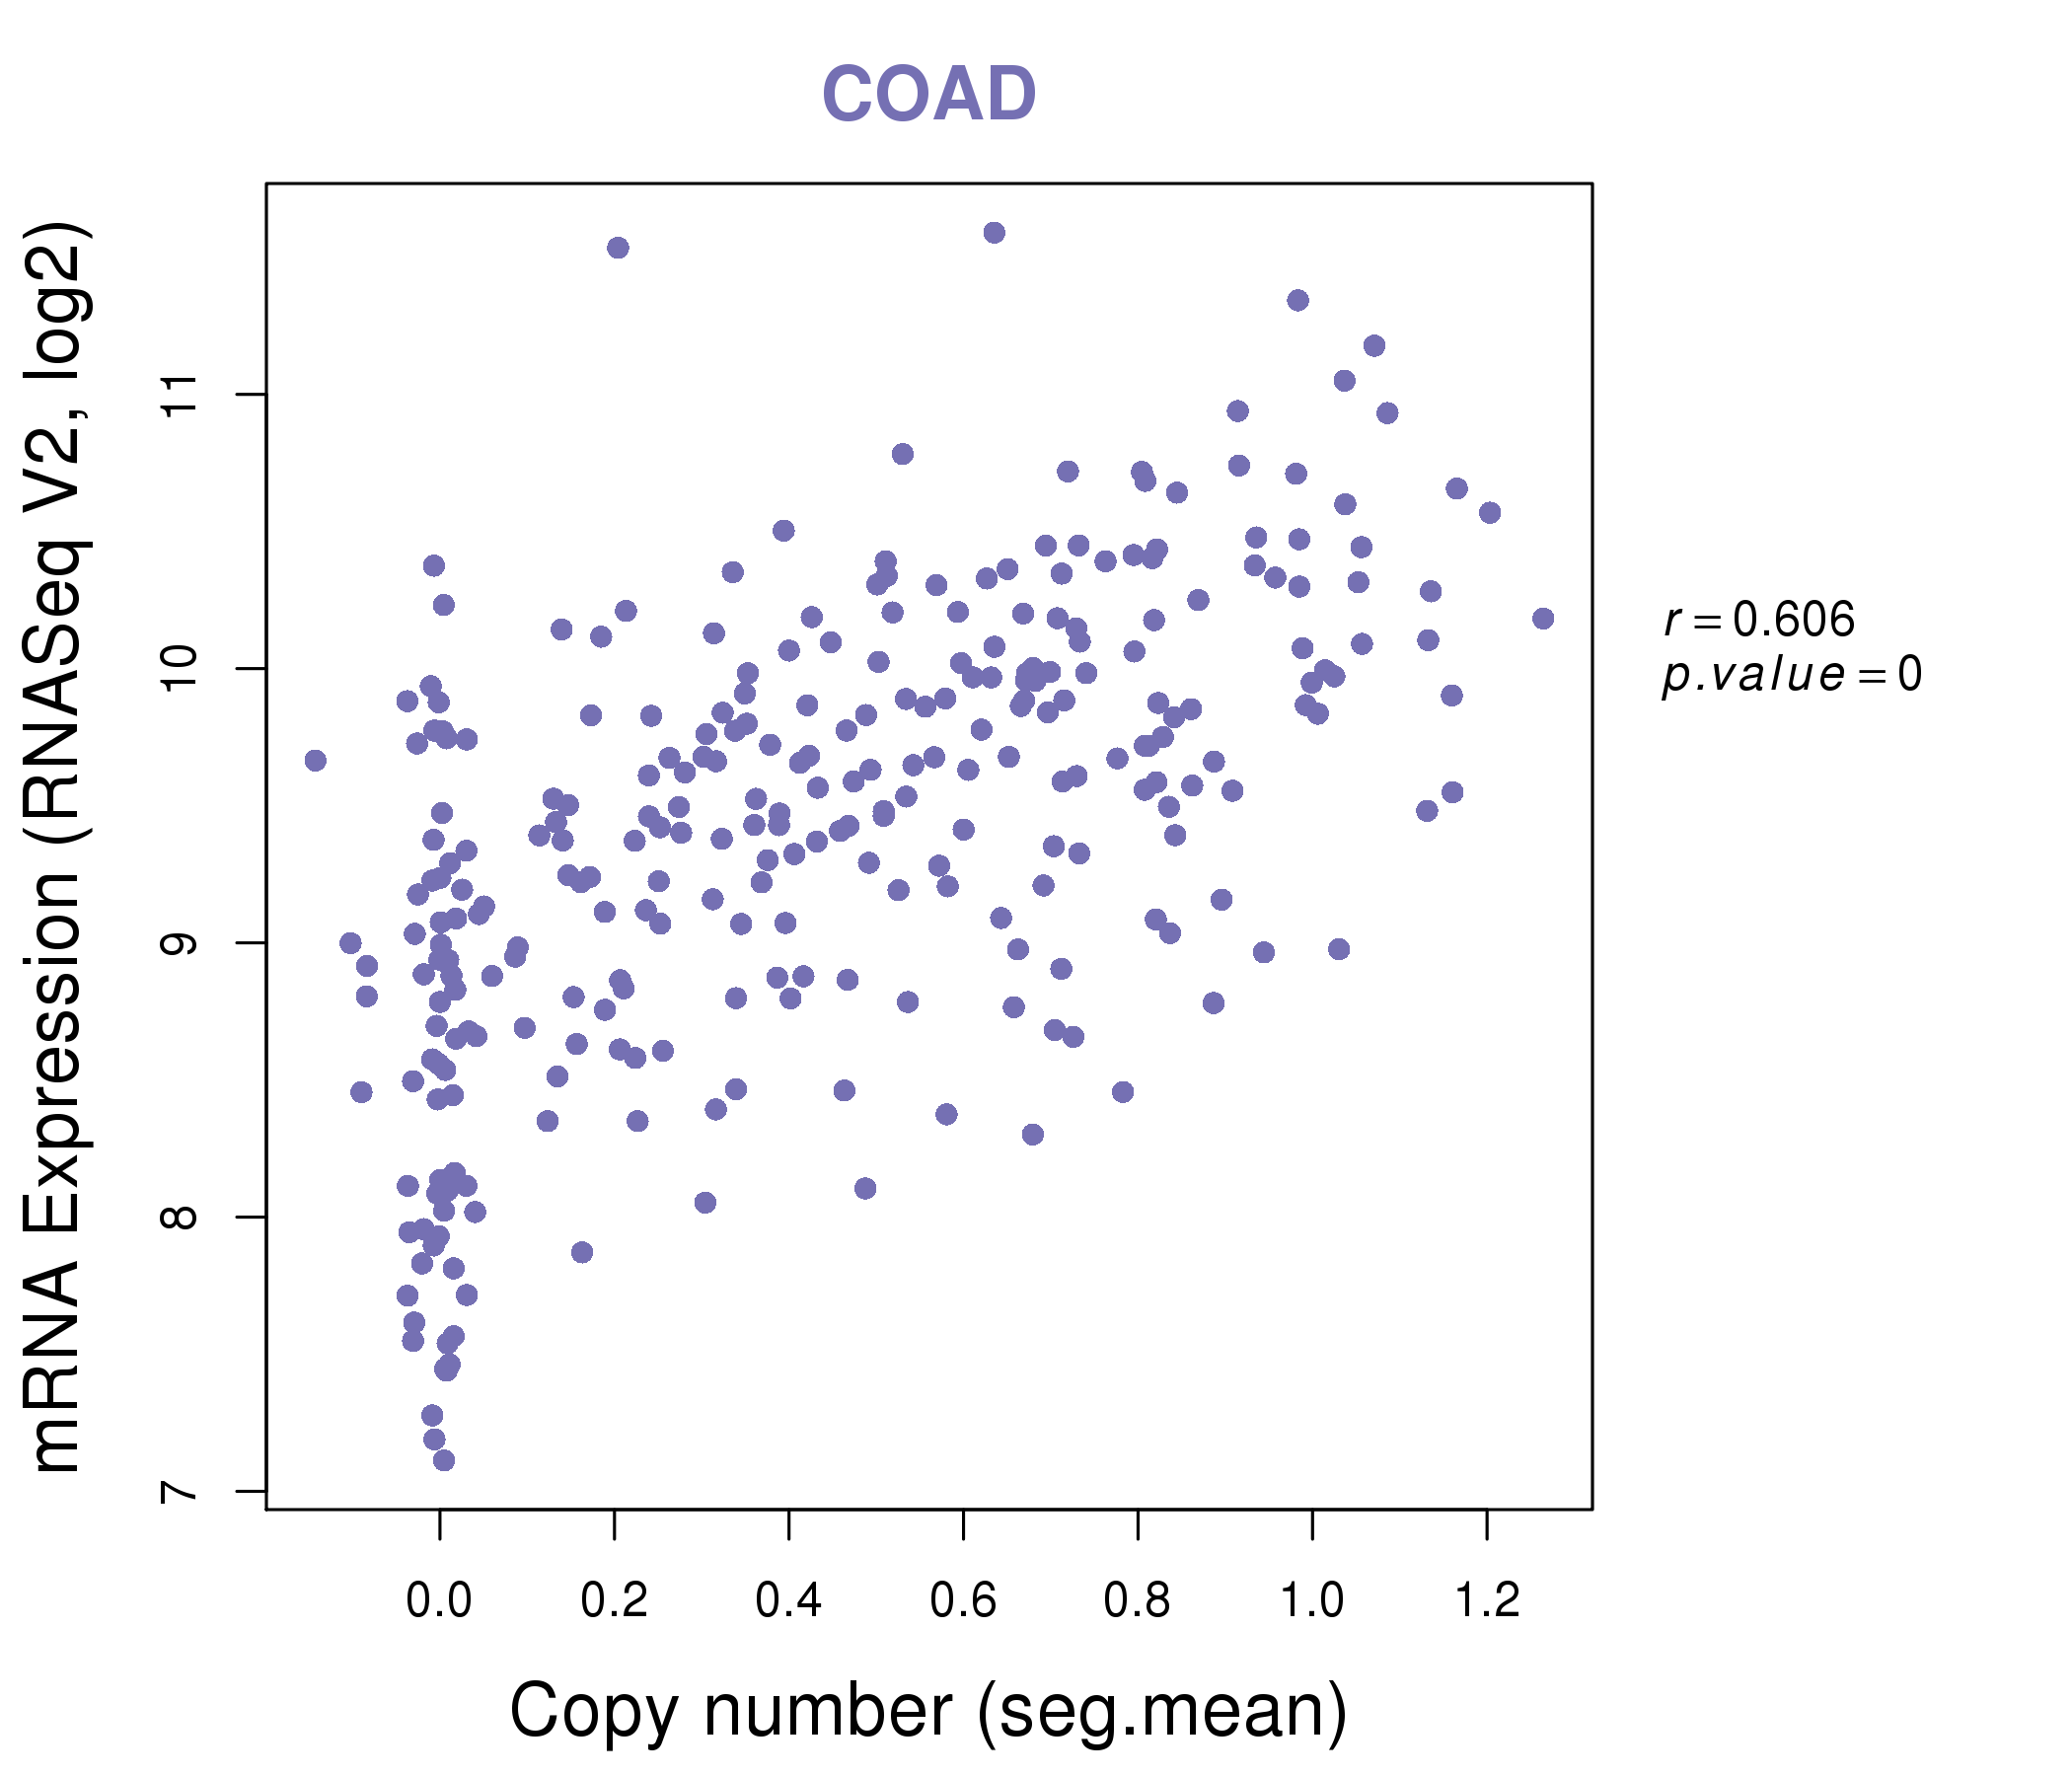
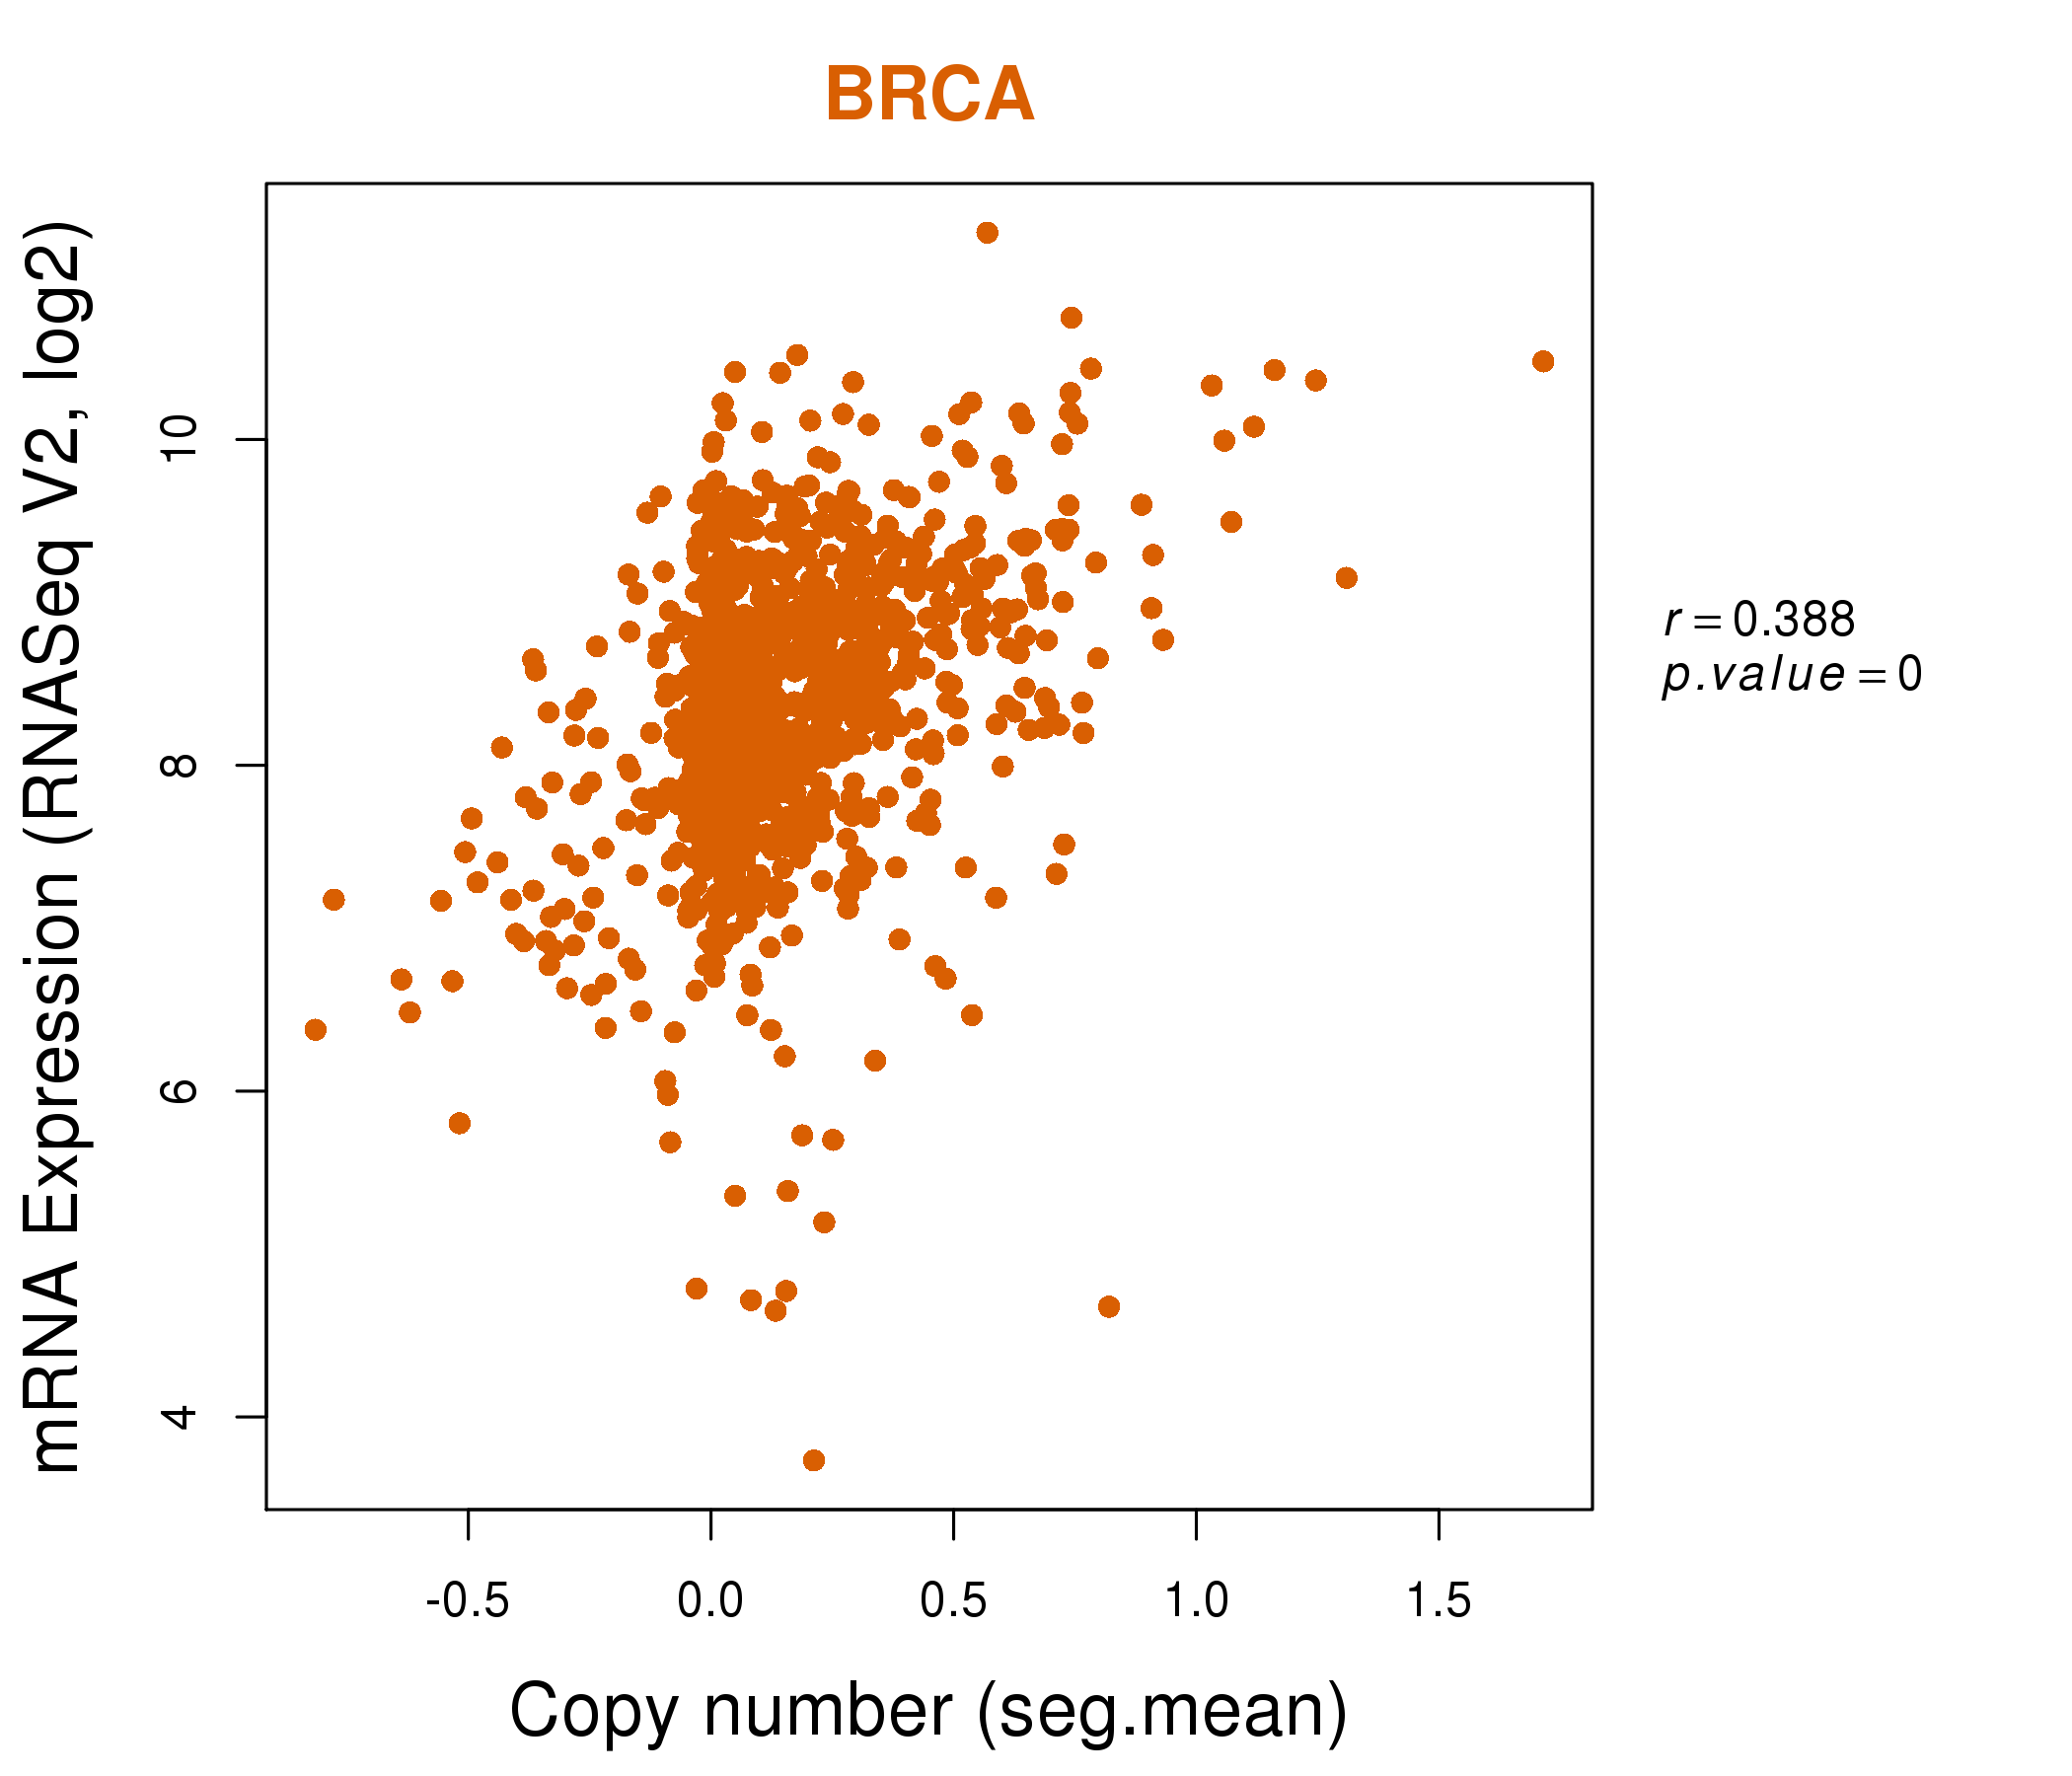
| * Copy number data were extracted from TCGA using R package TCGA-Assembler. The URLs of all public data files on TCGA DCC data server were gathered on Jan-05-2015. Function ProcessCNAData in TCGA-Assembler package was used to obtain gene-level copy number value which is calculated as the average copy number of the genomic region of a gene. |
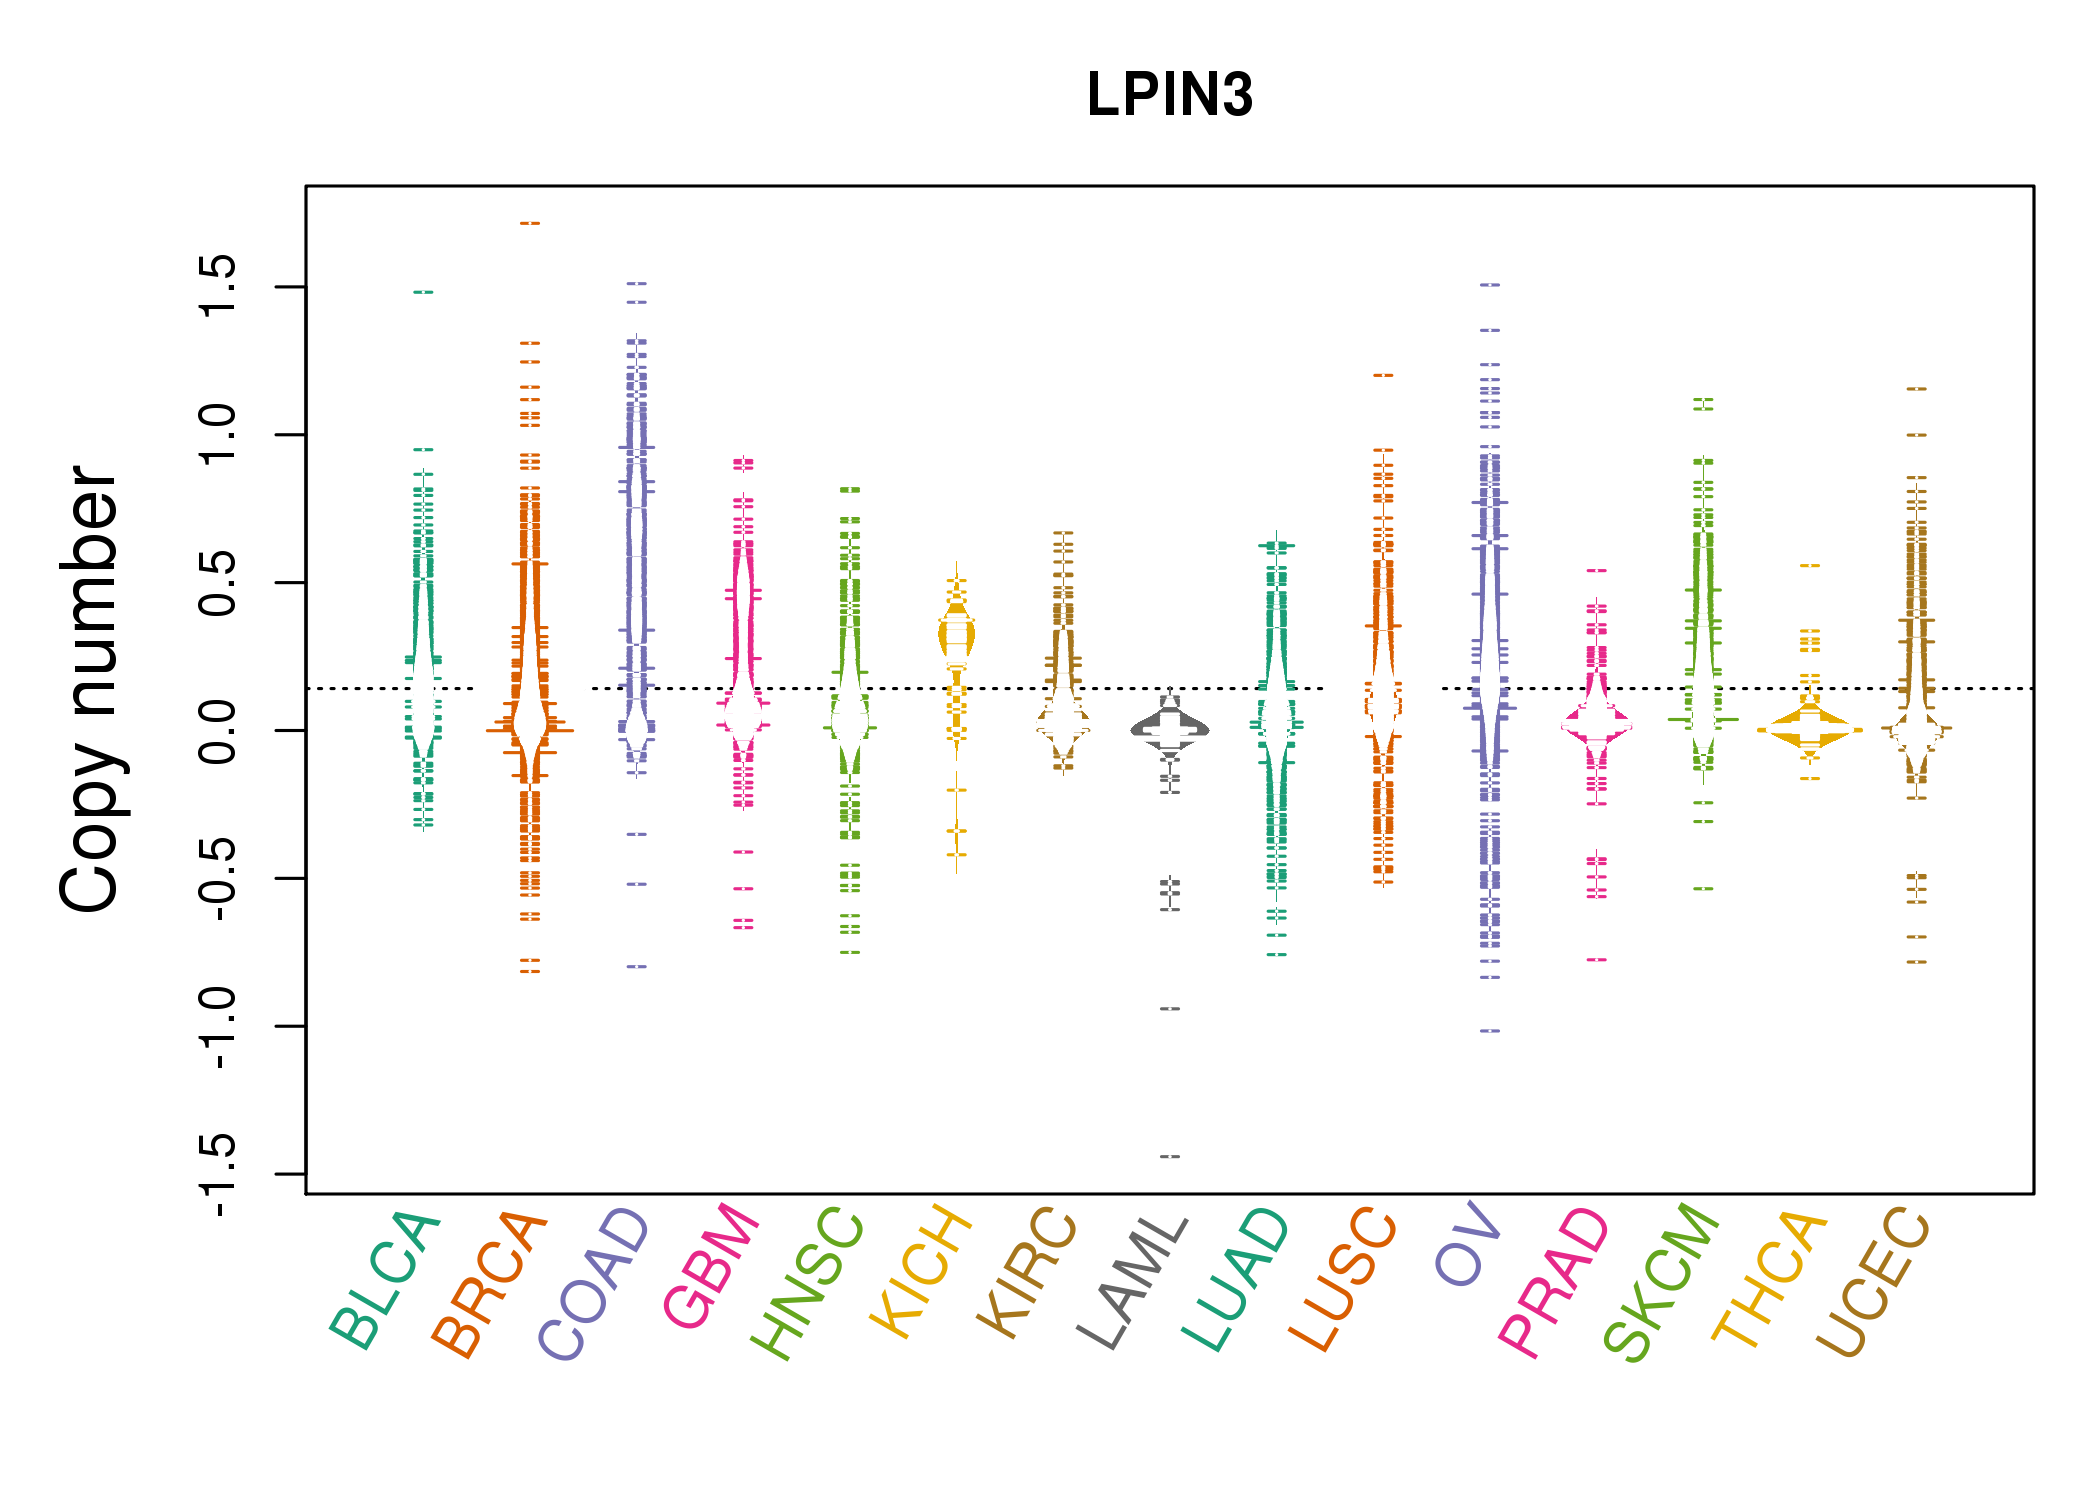 |
| cf) Tissue ID[Tissue type]: BLCA[Bladder Urothelial Carcinoma], BRCA[Breast invasive carcinoma], CESC[Cervical squamous cell carcinoma and endocervical adenocarcinoma], COAD[Colon adenocarcinoma], GBM[Glioblastoma multiforme], Glioma Low Grade, HNSC[Head and Neck squamous cell carcinoma], KICH[Kidney Chromophobe], KIRC[Kidney renal clear cell carcinoma], KIRP[Kidney renal papillary cell carcinoma], LAML[Acute Myeloid Leukemia], LUAD[Lung adenocarcinoma], LUSC[Lung squamous cell carcinoma], OV[Ovarian serous cystadenocarcinoma ], PAAD[Pancreatic adenocarcinoma], PRAD[Prostate adenocarcinoma], SKCM[Skin Cutaneous Melanoma], STAD[Stomach adenocarcinoma], THCA[Thyroid carcinoma], UCEC[Uterine Corpus Endometrial Carcinoma] |
| Top |
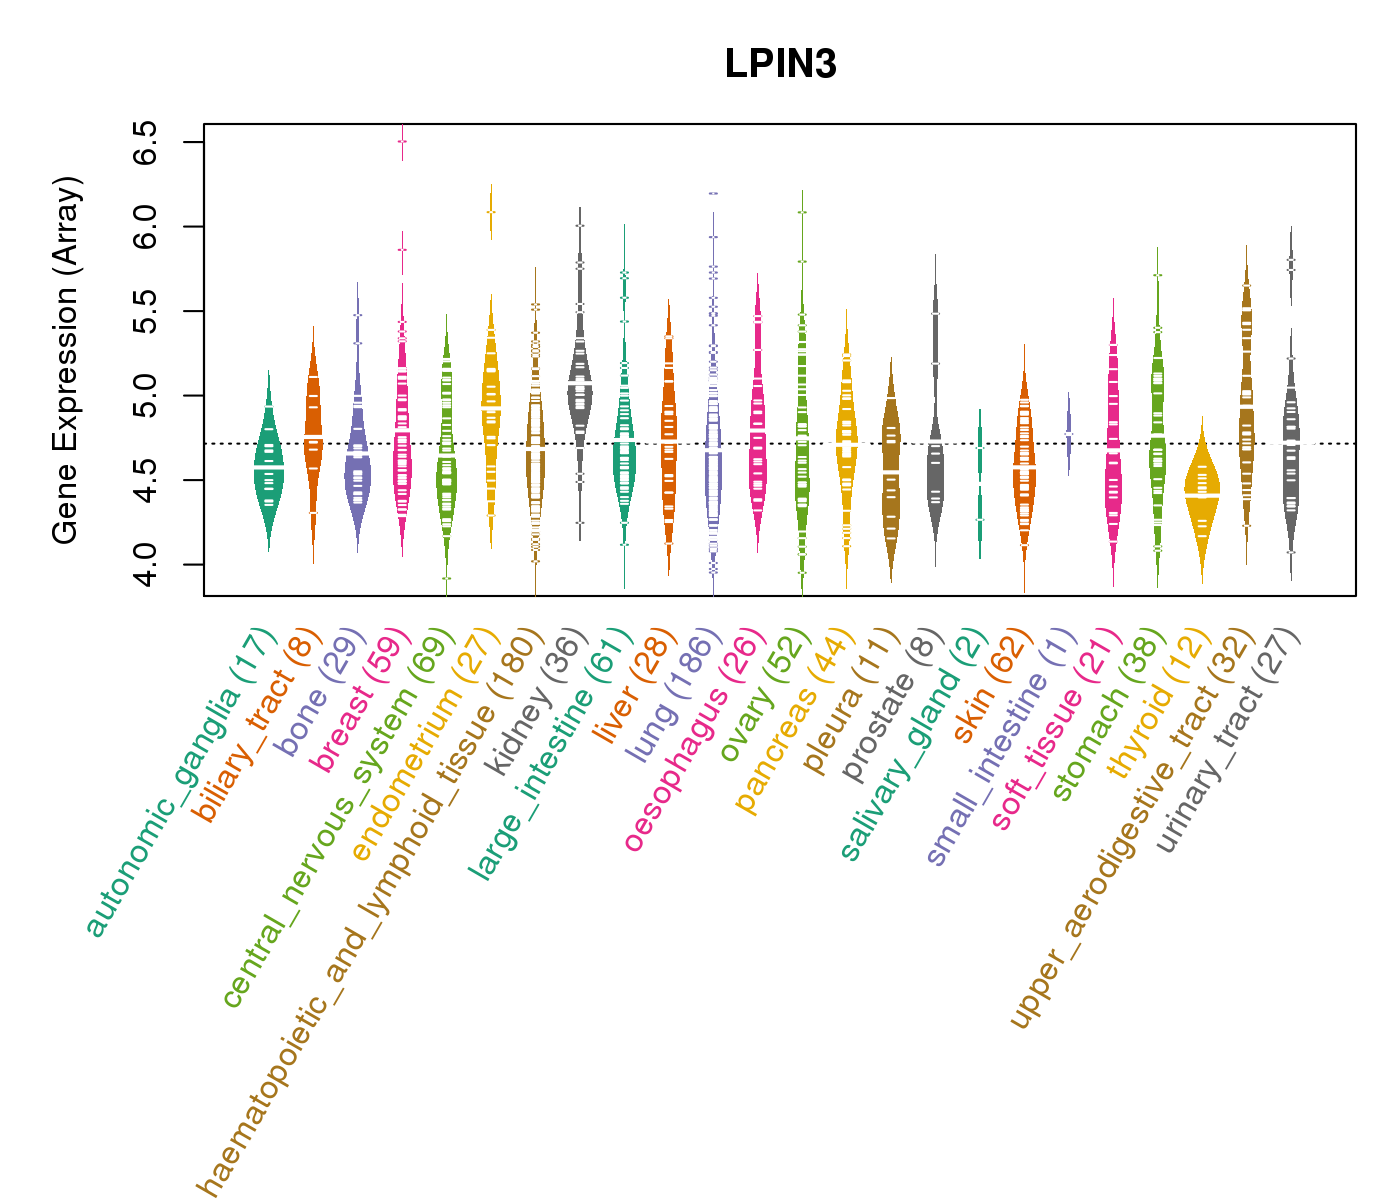
| Gene Expression for LPIN3 |
| * CCLE gene expression data were extracted from CCLE_Expression_Entrez_2012-10-18.res: Gene-centric RMA-normalized mRNA expression data. |
 |
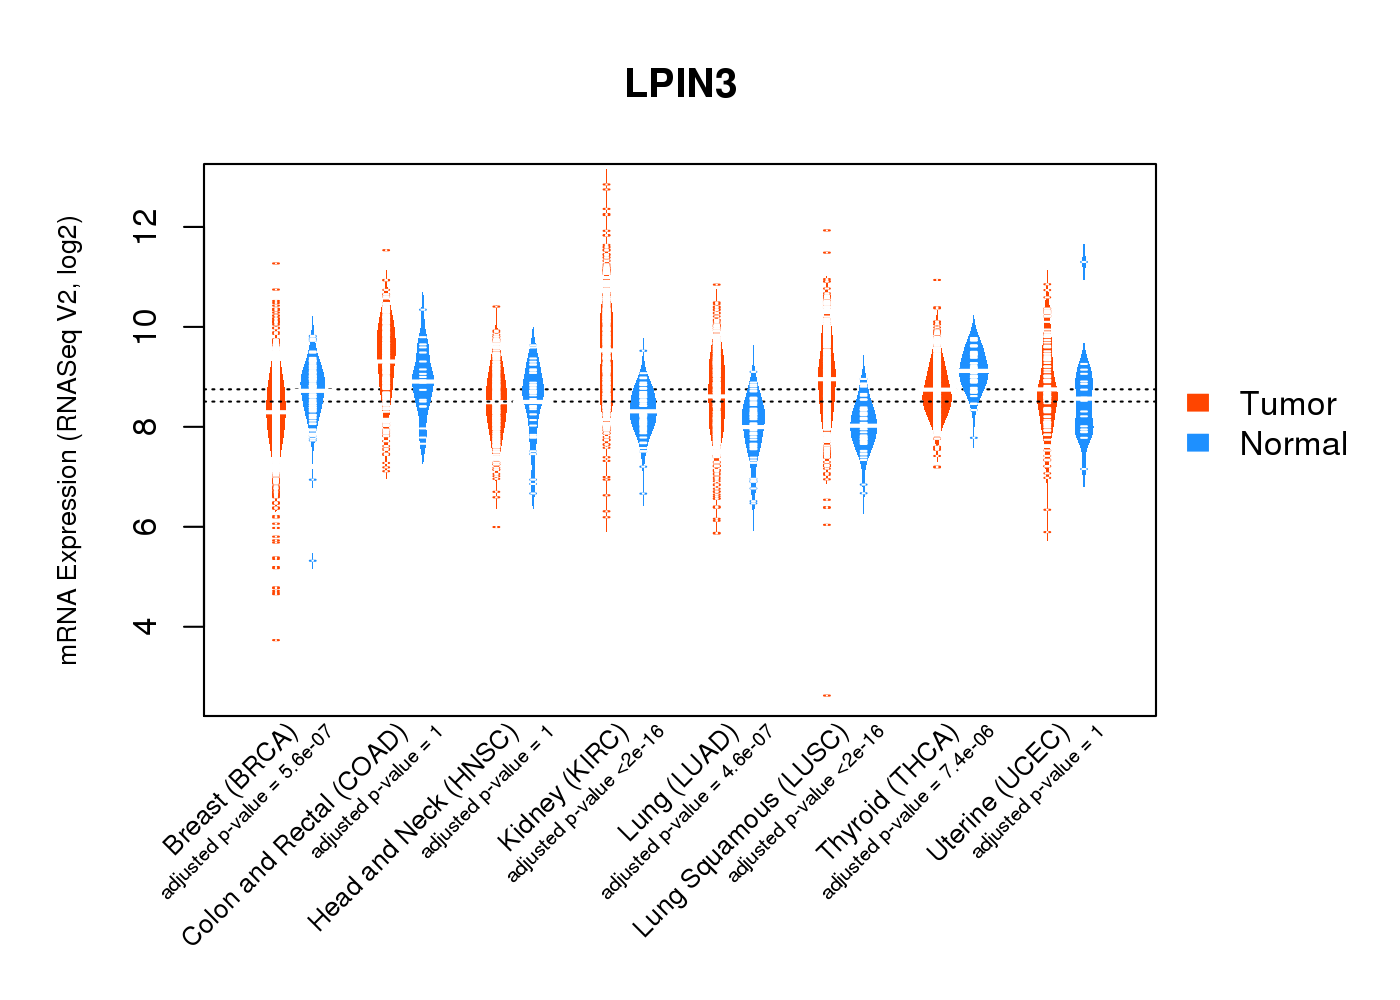
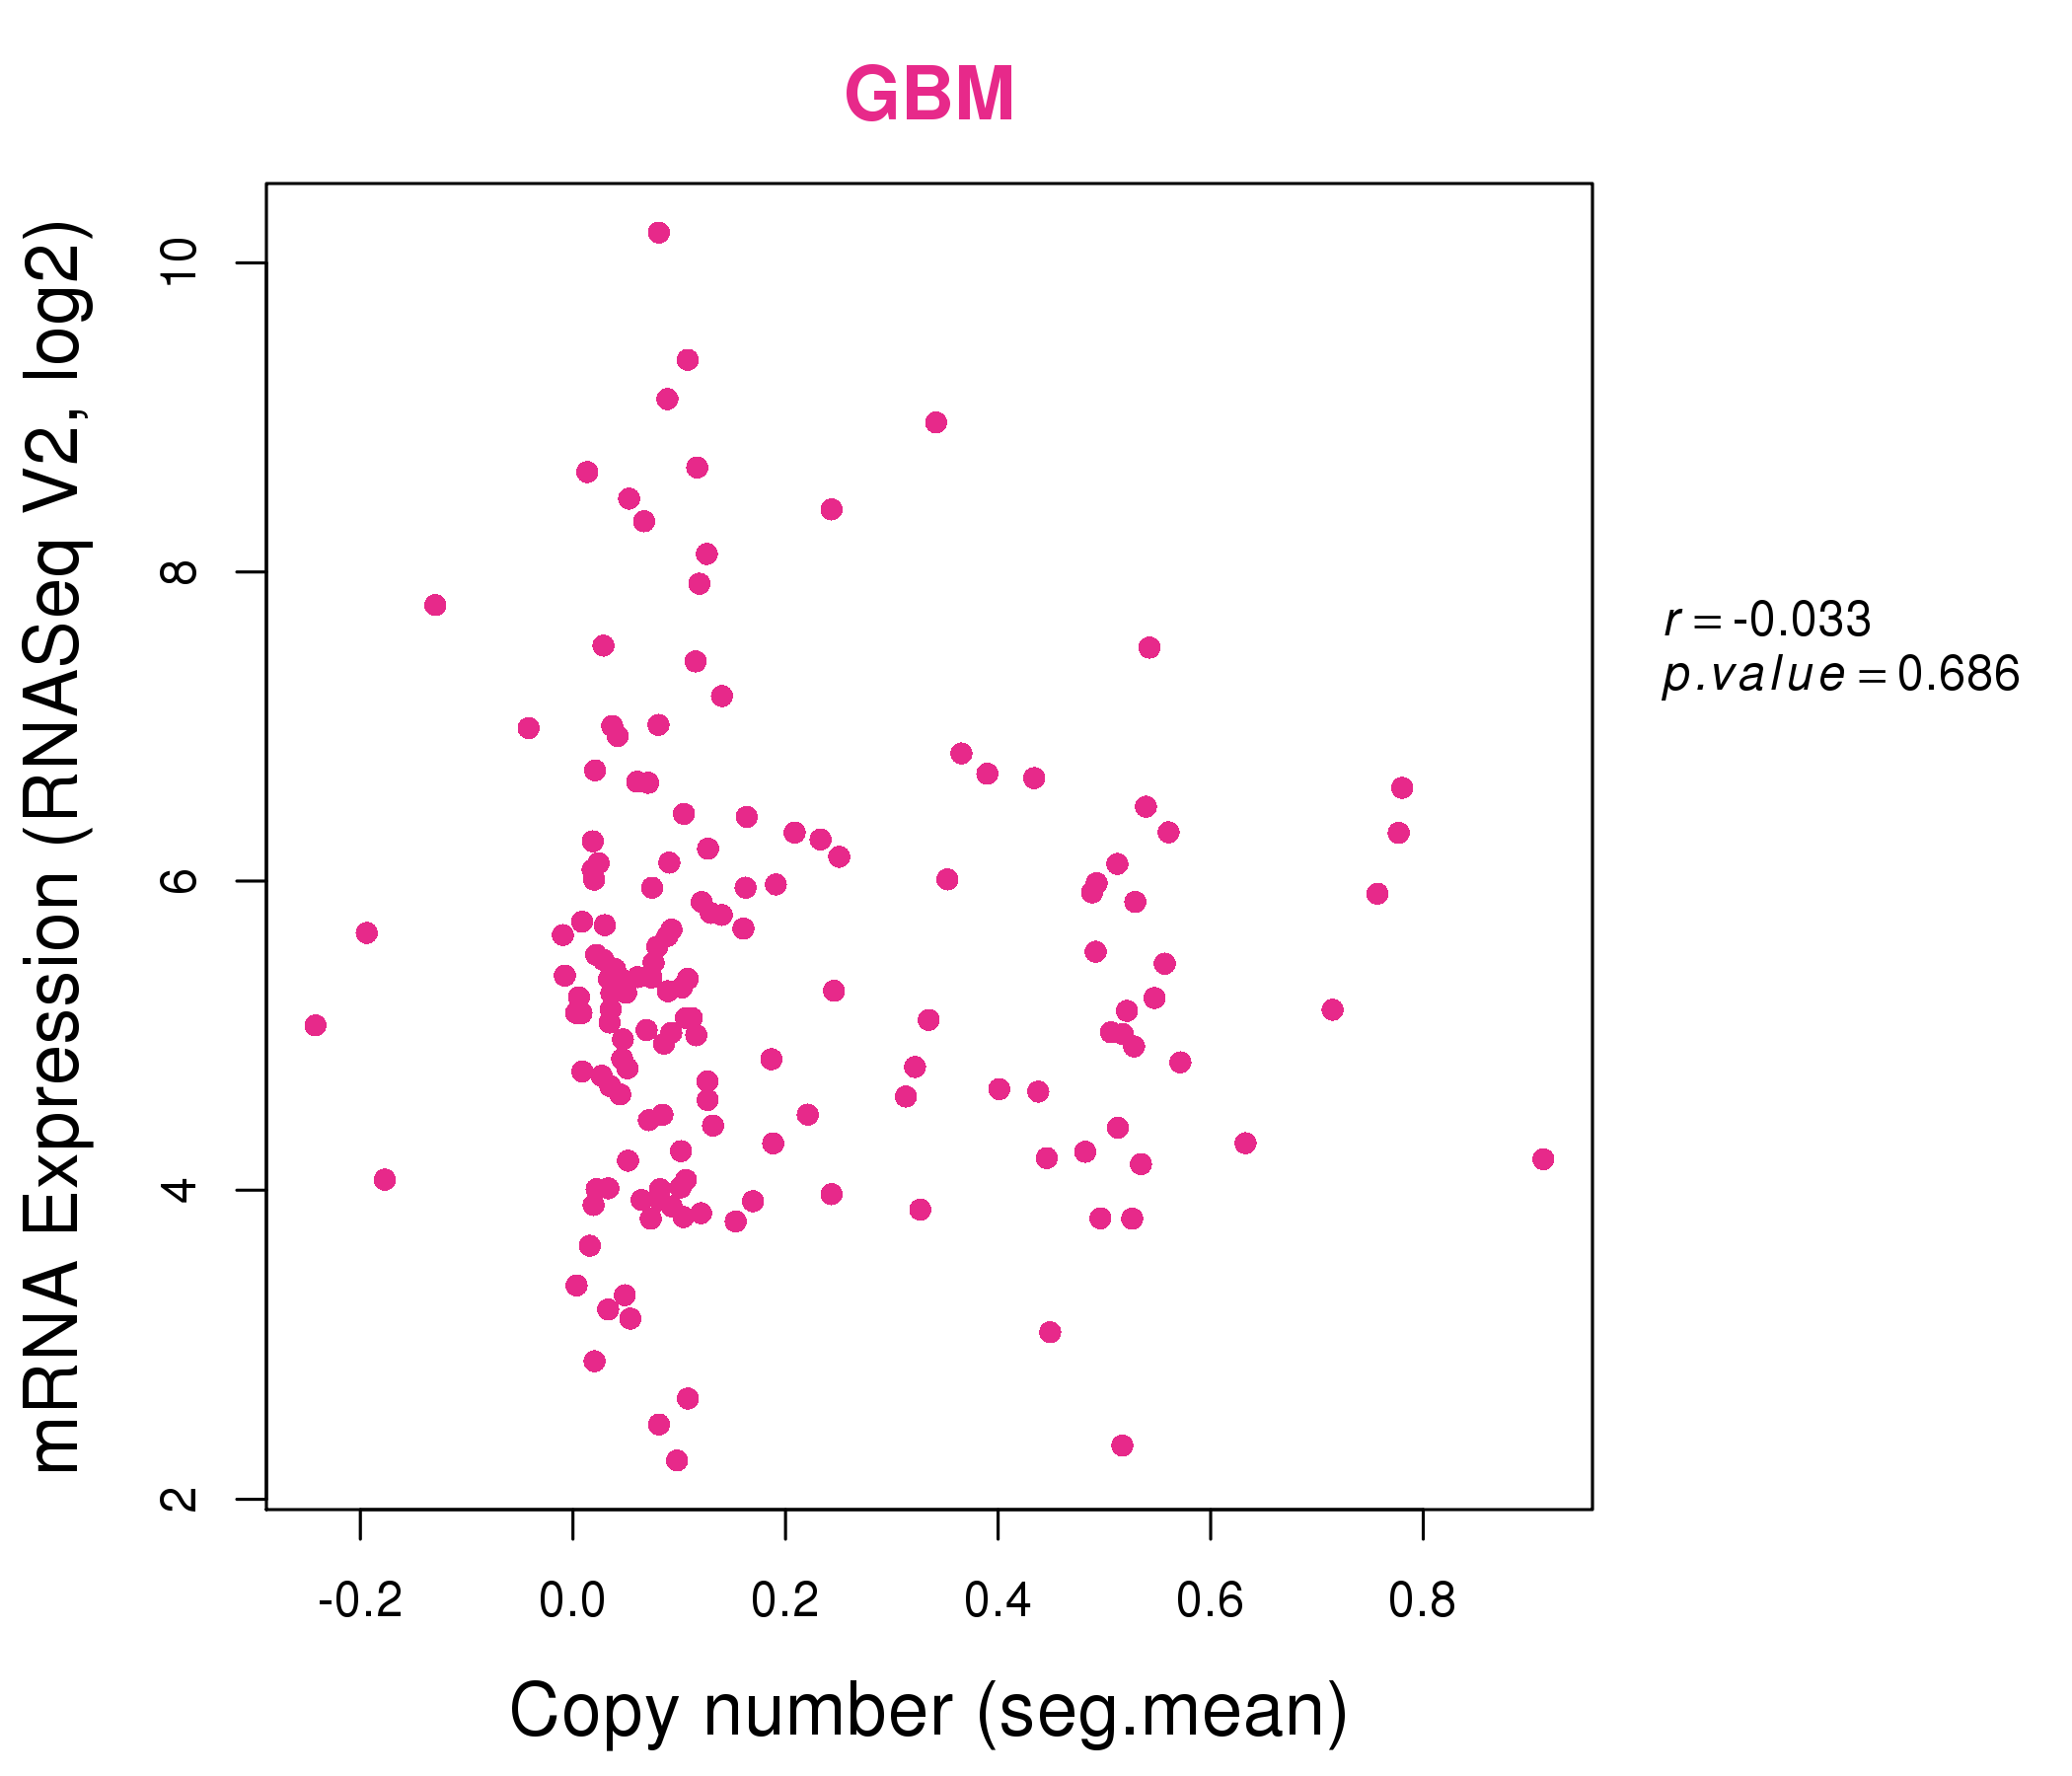
| * Normalized gene expression data of RNASeqV2 was extracted from TCGA using R package TCGA-Assembler. The URLs of all public data files on TCGA DCC data server were gathered at Jan-05-2015. Only eight cancer types have enough normal control samples for differential expression analysis. (t test, adjusted p<0.05 (using Benjamini-Hochberg FDR)) |
 |
| Top |
| * This plots show the correlation between CNV and gene expression. |
: Open all plots for all cancer types
 |
|
 |
|
| Top |
| Gene-Gene Network Information |
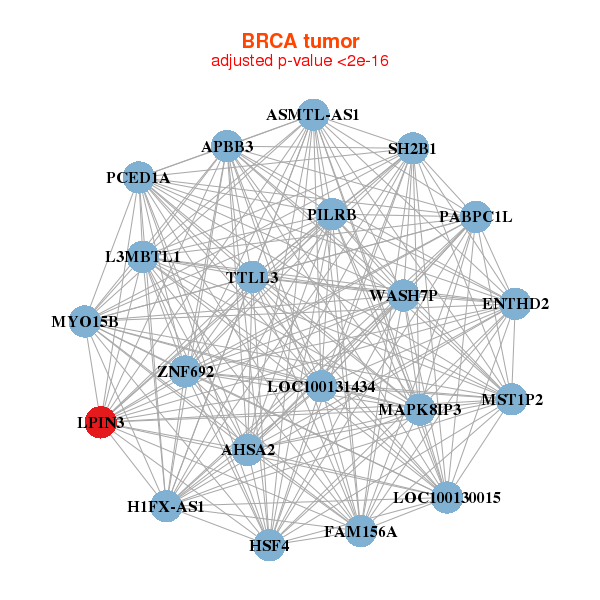
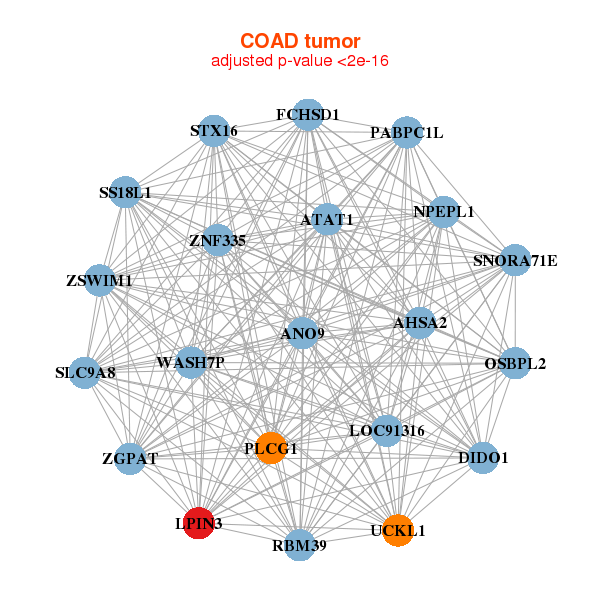
| * Co-Expression network figures were drawn using R package igraph. Only the top 20 genes with the highest correlations were shown. Red circle: input gene, orange circle: cell metabolism gene, sky circle: other gene |
: Open all plots for all cancer types
 |
|
| AHSA2,APBB3,ENTHD2,H1FX-AS1,PCED1A,FAM156A,HSF4, L3MBTL1,LOC100130015,LOC100131434,LPIN3,MAPK8IP3,MST1P2,MYO15B, ASMTL-AS1,PABPC1L,PILRB,SH2B1,TTLL3,WASH7P,ZNF692 | ANKZF1,APBB3,ARHGAP33,CEP164,FAM160A2,FAM193B,GIGYF1, HAUS5,HEMK1,JMJD7-PLA2G4B,KAT2A,LPIN3,MST1P2,NISCH, NSUN5P2,PILRB,CLASRP,SFSWAP,SNRNP70,TUBGCP6,WDR59 |
 |
|
| AHSA2,ANO9,ATAT1,DIDO1,FCHSD1,LOC91316,LPIN3, NPEPL1,OSBPL2,PABPC1L,PLCG1,RBM39,SLC9A8,SNORA71E, SS18L1,STX16,UCKL1,WASH7P,ZGPAT,ZNF335,ZSWIM1 | ENTHD2,CAPN3,DCST2,DNAH1,FAM160A2,GOLGA2P5,KIFC2, LOC100131434,LPIN3,PIDD1,MAMDC4,MZF1,OSBPL7,PDZD3, PLEKHM1P,PMS2P11,PRR22,SH2B1,SPPL2B,ZNF276,ZNF513 |
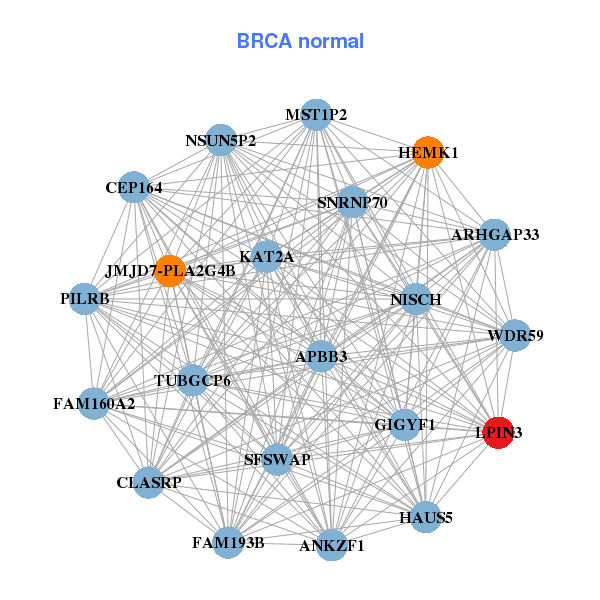
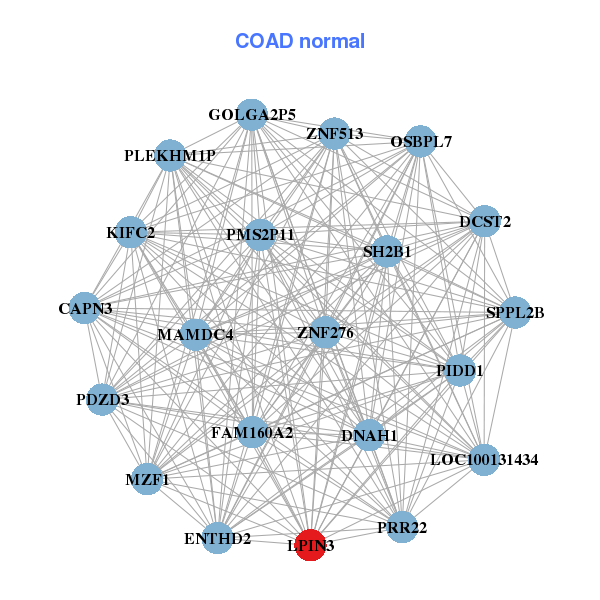
| * Co-Expression network figures were drawn using R package igraph. Only the top 20 genes with the highest correlations were shown. Red circle: input gene, orange circle: cell metabolism gene, sky circle: other gene |
: Open all plots for all cancer types
| Top |
: Open all interacting genes' information including KEGG pathway for all interacting genes from DAVID
| Top |
| Pharmacological Information for LPIN3 |
| There's no related Drug. |
| Top |
| Cross referenced IDs for LPIN3 |
| * We obtained these cross-references from Uniprot database. It covers 150 different DBs, 18 categories. http://www.uniprot.org/help/cross_references_section |
: Open all cross reference information
|
Copyright © 2016-Present - The Univsersity of Texas Health Science Center at Houston @ |